investigation of the flammability limits of acetic acid … symposium series no. 141 investigation...
TRANSCRIPT

ICHEME SYMPOSIUM SERIES NO. 141
INVESTIGATION OF THE FLAMMABILITY LIMITS OF ACETIC ACID AT ELEVATED TEMPERATURE AND PRESSURE
M Hoyle and GR Astbury
Zeneca Specialties, P.O. Box 42, Hexagon House, Blackley, Manchester, M9 8ZS
© Zeneca Limited 1997
Use of predictive models to estimation the flammable limits of materials at elevated temperatures and pressures has proved reliable for simple hydrocarbon solvents. Certain materials, such as acetic acid, dimerise in the vapour phase and this can have unpredictable affects on the flammability limits. Experimental determination of the flammable limits of acetic acid vapour in air at elevated temperature and various applied pressures was carried out. The results were compared with those predicted by the models. Construction of flainmability diagrams allowed the prediction of the flammability of the vapour composition during a chemical process, at elevated temperature and pressure, which using acetic acid as a solvent medium.
Keywords: Flammable Limits, Flammability Limits, Fire and Explosion Hazards.
INTRODUCTION
It. is necessary to know the flammability characteristics of the materials used in a process in order to avoid potential fire and explosion hazards. This allows a basis of safe operation to be specified for plant scale operations. Flammability limits of common chemicals under standard atmospheric conditions, ie atmospheric pressure and ambient temperature, are generally available from literature sources. However, at elevated temperature and pressure the flammble limits of materials can vary significantly. Other factors such as oxidant and inert materials present can also affect the limits. Some predictive models are available for estimating the change in flammable limits under varying temperature and pressure conditions but these seem to have only limited use with simple hydrocarbon species.
A flammable material that can dimerise in the vapour phase, such as acetic acid, adds a further unpredictable factor to the affect on flammable limits. Hence, the measurement of the flammable limits at elevated temperature and pressure was undertaken for acetic acid, and the results compared with the results obtained from the predictive models available. The experimental results were also invaluble in considering the flammable nature of the vapour phase formed in an actual process which used acetic acid as the solvent. The vapour composition formed within the plant vessel was estimated using available vapour - liquid equilibrium and vapour pressure data, and plotted on the flammability diagrams which had been constructed from the experimental data. The estimated vapour compositions were also compared with samples taken from the plant vessel ullage space as the reaction progressed in order to confirm that the process conditions resulted in the formation of a vapour compositions, under reaction conditions, which were outside the flammable limits.

ICHEME SYMPOSIUM SERIES NO. 141
The investigation neccesitated the development of a flammability test rig capable of allowing the measurement of flammable ranges at elevated temperature and pressure.
EXPERIMENTAL WORK
Experimental Test Rie
The flammability rig consisted of a 2.5 L Hastelloy C 26, jacketed sphere. The sphere could be operated at any temperature from 20°C to 285°C, and up to a maximum pressure of 1.5 x 10⁷ N m"z (150 bar). The bomb was fitted with: a thermocouple recording the internal vapour temperature at the centre of the sphere; an ignition source; two pressure sensors, one on a range of -4.4 x 10 5 N nT2 (-50 psig) to 1.46 x 10⁶ N m"2 (200 psig) for measuring initial vapour pressure of mixtures, and one on a range of 1 x 10s N nr2 to 1.4 x 10⁸ N nT2 (0 to 2000 psig) to record the maximum rate of pressure rise and maximum pressure generated in the event of an explosion; several ports for addition of either gas or liquid and a connection to apply vacuum or compressed air to the desired operating pressure.
The test rig is shown diagrammatically in figure 1, appended.
Experimental Procedure
Three sets of experiments were carried out, essentially by the same procedure. Initially the flammable composition envelope of acetic acid in air. with nitrogen as an inert, was determined at 155°C and atmospheric pressure, that is 1 x 10⁵ N m"2 (1 bara). The flammable composition envelopes of acetic acid in air, with water as the inert, were then determined at 155DC / 6 x 10⁵ N nr2 (6 bara) and 155°C / 11 x 105 N nr2 (11 bara).
The bomb was heated to an internal temperature of 155°C by circulating hot oil through the surrounding jacket from a thermostatically controlled bath. The bomb was evacuated by applying vacuum. The vacuum established was recorded on the low range pressure gauge. The system was sealed and a known quantity of acetic acid admitted. The pressure generated by vapourisation of the acetic acid was recorded. Nitrogen was then admitted to the required partial pressure followed by air to the required final pressure. The composition of the vapour phase mixture could then be calculated for each component of the mixture, i.e. partial pressure of component over total pressure of the system, and marked on a triangular diagram. The temperature of the mixture was allowed to stabilise before ignition. Ignition was by a fuse wire between the electrodes of a spark plug. Explosion detection was by a second pressure gauge and this was recorded on a computer along with the temperature rise, when explosion occurred. Varying the composition of the mixture allowed the construction of the flammable envelope of mixture compositions. The resulting flammable composition regions were plotted on triangular graphs to represent the three components.
The experiments involving water vapour as the inert were carried out in a similar way by addition of water via syringe, in the same manner as the addition of acetic acid. The high pressures were obtained by addition of compressed air to the desired composition.
294

ICHEME SYMPOSIUM SERIES NO. 141
Experimental Results
Three experimental tests were undertaken to determine the flammable composition envelopes of mixtures of acetic acid / air / nitrogen at 155°C and 1 x 10⁵ N m~2, acetic acid / air / water at 155°C and 6 x 10⁵ N m"z and acetic acid / air / water at 155"C and 11 x 105 N nr2.
The flammability diagrams constructed from these results can be seen in figures 2, 3 and 4 respectively.
The flammable limits and minimum oxygen for combustion (MOC) for the three experimental tests are tabulated below.
Lower Flammable Limit (Z v/v)
Upper Flammable Limit (Z v/v)
Minimum Oxygen for Combustion (MOC) (Z v/v)
Acetic acid / air / N2 at 155°C and
1 x 10⁵ N nr2
5.4 ± 0.7
14.5 ± 0.7
12.3
/ air / Water at 155°C and
6 x 10⁵ N m"z
5.0 ± 0.2
15 ± 0.2
14.0
/ air / Water at 155°C and
11 x 105 N m"z
4.5 ± 0.1
16 ± 0.1
14.9
Calculation of Vapour Composition in Plant Scale Reactor
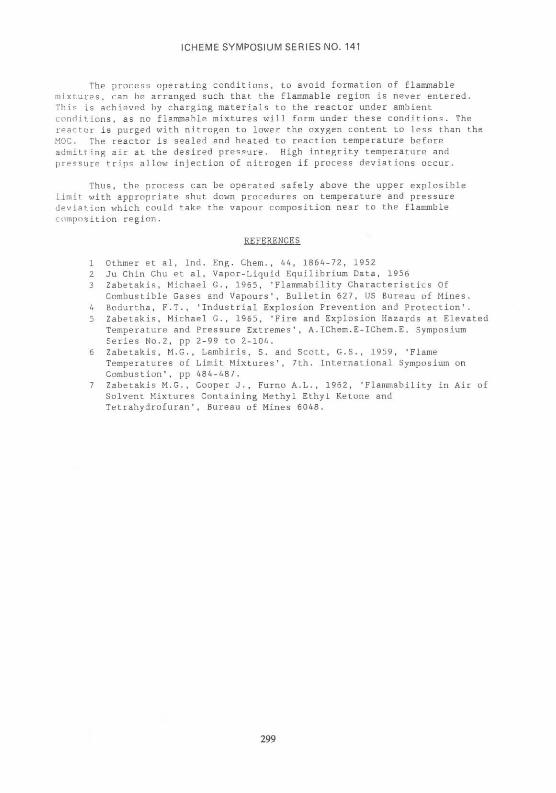
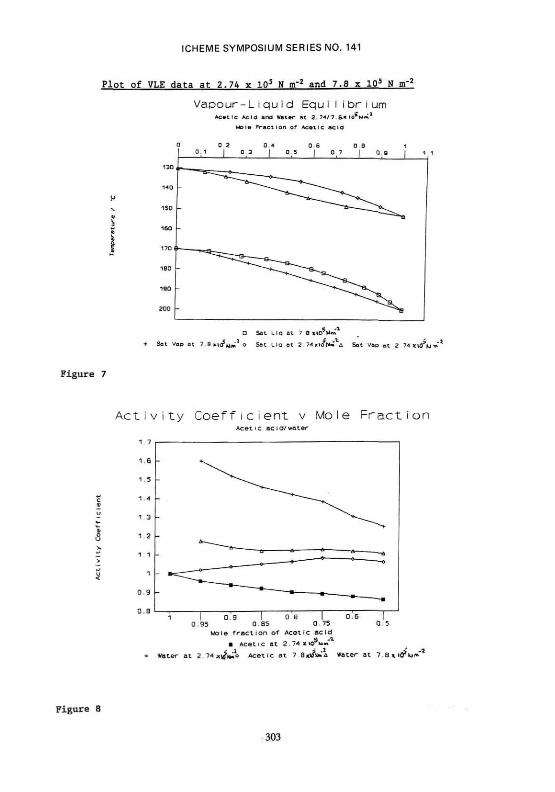
The prediction of the vapour composition within a plant reactor containing an aqueous acetic acid was carried out by using vapour-liquid equilibrium data, activity coefficients for acetic acid at elevated temperature and pressure, and vapour pressure data for the pure materials. However, the assumption had to be made that the reactant and product did not have appreciable vapour pressures and did not affect the vapour-liquid equilibrium of acetic acid/water under the process conditions.
The vapour pressure curves of pure actetic acid and water, shown in figure 6, were used to predict the partial pressures of the materials at any temperature. Measured vapour-liquid equilibrium (VLE) data at 2.74 x 10⁵ N nT2 and 7.8 x 10⁵ N m"2 were available from the literature (1,2), and are shown in figure 7. The liquid composition changes as the reaction progresses, that is water was produced and oxygen consumed during the reaction. The activity coefficients for the materials were calculated over the composition range by using the VLE data and from the partial pressure of the pure materials in the equation below.
y = activity coefficient, and
Y = (x x p°l
where p • actual vapour pressure of component at specified temperature, x = mole fraction of the component in the liquid batch. p° = vapour pressure of the pure component at specified
temperature.
295

ICHEME SYMPOSIUM SERIES NO. 141
Values of YHAC • YH20 a r e used in calculations on the assumption that :-a) presence of reactant and product do not significantly affect y. b) variation of y with temperature is of little significance over the
range 130-160°C
Similar calculations were carried out for VLE data at 7.8 x 10⁵ N m"z as activity coefficients estimated from this were more relevant to a process operating at 11 bara. The values of the activation coefficients are shown in the following table.
xHAc Mol F r a c t i n L i q u i d
1
0 . 9 5
0 . 8 5
0 . 7 5
0 .60
0 . 5 0
XH20 Mol F r a c t i n L i q u i d
0
0 . 0 5
0 . 1 5
0 . 2 5
0 . 4 0
0 . 5 0
Bpt "C
1 5 3 . 6
1 5 1 . 1
1 4 6 . 7
1 4 2 . 7
1 3 8 . 0
1 3 5 . 7
B p t / ° C
1 5 3 . 6
1 5 1 . 1
1 4 6 . 7
1 4 2 . 7
1 3 8 . 0
1 3 5 . 7
yilAc Mol F r a c t in Vapour
1
0 .857
0 . 6 5 5
0 .507
0 .350
0 . 2 7 0
ynzo Mol F r a c t
i n v a p o u r
0
0 .143
0 . 3 4 5
0 . 4 9 3
0 .650
0 .730
PllAc
2 .74
2 . 3 5
1.79
1.39
0 . 9 5 9
0 .740
Pozo
0
0 . 3 9 2
0 . 9 4 5
1 .351
1 .781
2 . 0 0 1
P°HAc
2 . 7 4
2 . 5 9
2 . 3 0
2 . 0 8
1.83
1.72
P°HZ0
0
4 . 9 0
4 . 3 4
3 .90
3 . 4 2
3 . 2 0
YHAc ActCoef f
1
0 .958
0 . 9 1 8
0 .893
0 .873
0 .860
YU20 A c t c o e f f
-1.52
1 .453
1.384
1.302
1 .250
The vapour composition at any temperature could then be calculated using the equation given above, by substituting activity coefficient, mole fraction, and partial pressure of the pure substance at that temperature and pressure. The partial pressures obtained were for acetic acid and water, and the partial pressure of air determined by difference. The partial pressures could be converted into mole fractions or X v/v if required. Taking a typical batch composition, the vapour compositions were calculated. These values are shown in the tables below for the operation of the process at 140DC to 155°C and 6 x 10⁵ N m"2.
296

ICHEME SYMPOSIUM SERIES NO. 141
Batch Composition (kg mol)
Reac tan t /Product
6.62
6.62
6.62
6.62
6.62
6.62
6.62
Ace t i c Acid
12.78
12.78
12.78
12.78
12.78
12.78
12.78
Water
0
1.55
3 .11
4 .66
7.75
9.30
10.88
To ta l
19. 4
20.95
22 .51
24.06
27.15
28.70
30.28
Mole F rac t in Liquid
X F1Ac
0.659
0.610
0.568
0 .531
0.471
0.445
0.422
X!120
0
0 . 0 7 4
0 . 1 3 8
0 . 1 9 4
0 . 2 8 5
0 . 3 2 4
0 . 3 5 9
A c t i v i t y
C o e f f i c i e n t
. YHAc
0 . 8 7 5
0 . 8 7 0
0 . 8 6 5
0 . 8 6 0
0 . 8 5 5
0 . 8 5 0
0 . 8 4 8
Ynzo
-1 . 5 6
1 . 4 7
i . 4 2
1 . 3 6
1 . 3 4
1 . 3 3
T e m p e r a t u r e 1 4 0 ° C P°HAC " l - 9 1 9 x l 0 5 N m"2
P°nzo = 3 .639xl0 5 N nT2
Temperature 150°C
P°HAc = 2 -5xl0 5 N nr z
P°H2o " 4 .78x l0 5 N m'2
Temperature 155°C
P°RAC = 2 -84xl0 5 N nr2
P°uzo • 5 .45x l0 5 N nr2
Mole F r a c t i o n in the Vapour Phase
HAc
0.184
0.170
0.157
0.146
0.129
0.121
0.114
H20
0
0.070
0.123
0.167
0.235
0.263
0.290
A i r
0.816
0.760
0.720
0.687
0.636
0.616
0.596
HAc
0.24
0.221
0.205
0.190
0.168
0.158
0.149
H20
0
0.092
0.162
0.219
0.309
0.346
0.381
A i r
0.76
0.687
0.634
0.591
0.523
0.496
0.470
HAc
0.273
0.251
0.232
0.216
0.190
0.179
0.169
H 2 0
0
0.105
0.185
0.250
0.353
0.395
0.434
A i r
0. 727
0.644
0.583
0.534
0.457
0.426
0.397
This was carried out for varying temperatures and pressures to investigate the conditions under which the vapour composition in the reactor could approach the flammable region. The flammability diagram shown in figure 9 indicates the vapour composition line throughout the reaction under the process conditions. The analysed sample of the vapour at the end of plant reaction is shown in figure 9. The same calculation regime was used to achieve the operating line for 11 x 105 N m"2 bara operating pressure and this is shown in Figure 10, indicating the vapour composition during reaction at varying temperature and pressure.
DISCUSSION
There are a number of models available in the literature which can be used to predict the effect of temperature and pressure on flammable limits (3-7). The predictive models indicated that there would be a minimial change in the lower flammable limit on increasing temperature and pressure. However, a dramatic rise in the upper flammable limit was indicated, especially with
297

ICHEME SYMPOSIUM SERIES NO. 141
increase in pressure. This would indicate that the vapour composition within the reactor could well be flammable under the process conditions.
Acetic acid, however, has a propensity to dimerise in the vapour phase under normal ambient conditions, and the extent of dimerisation would be expected to increase with increase pressure and possibly temperature. The effect of increased dimerisation on the flammable limits cannot be easily modelled and hence the experimental investigation was carried out.
The results of the experiments are shown collectively in figure 5. The diagram contrasts the effect of water as an inert under high pressure against nitrogen at atmospheric pressure. Overall, the flammable composition region does not change dramatically with change in inert and increase in pressure. Furthermore, the flammable limits do not change as dramatically with increase with pressure as was predicted from the models. The deviation from the limits proposed by the predictive models is most likely to be due to the physical nature of the acetic vapour, as the vapour dimerises.
The presence of water as the inert and the application of pressure expanded the flammable limits slightly but decreased the MOC. Increase in pressure generally expands the flammable limits and the expansion can be very marked, especially with hydrocarbons as fuel. However, the expansion in the flammable limits of acetic acid under varying pressure is relatively minor. This is most likely to be due to the physical form of the vapour, being the dimer form of acetic acid vapour.
The inerting effect of water is greater than nitrogen and this was to be expected as water has a higher molal heat capacity. It is this property of the gas / vapour which offers the inerting effect, that is heat is extracted from the initial flame kernel thus stopping flame propagation.
The estimated vapour compositions in the vapour space of the plant reactor can be seen to be well above the upper flammable limit for the mixture during the course of the reaction under the specified reaction conditions, as shown in figure 9. The estimation showed close approximation to the analysed vapour composition at the end of the reaction and therefore the assumption that was made in calculating vapour compositions is valid. Further calculations allowed the estimation of operating vapour composition lines at higher/lower temperatures and pressures. This can show the process temperature and pressure under which the vapour mixture is likely to become flammable.
CONCLUSIONS
The flammability limits of acetic acid in air are not appreciably affected by increase in temperature and pressure.
The minimum oxygen for combustion (MOC) increases with increase in pressure. Furthermore, the presence of water in the vapour mixture increases the MOC above that noted with nitrogen present as an inert under the same conditions, MOC of 14Z 02 in water vapour compared with 12.3X 02 in nitrogen.
The plant operating conditions are shown to produce vapour compositions well above the upper flammable limit and hence the atmosphere will be nonflammable during reaction.
298
ICHEME SYMPOSIUM SERIES NO. 141
The process operating conditions, to avoid formation of flammable mixtures, can be arranged such that the flammable region is never entered. This is achieved by charging materials to the reactor under ambient conditions, as no flammable mixtures will form under these conditions. The reactor is purged with nitrogen to lower the oxygen content to less than the MOC. The reactor is sealed and heated to reaction temperature before admitting air at the desired pressure. High integrity temperature and pressure trips allow injection of nitrogen if process deviations occur.
Thus, the process can be operated safely above the upper explosible Limit with appropriate shut down procedures on temperature and pressure deviation which could take the vapour composition near to the flammble composition region.
REFERENCES
1 Othmer et al, Ind. Eng. Chem., 44, 1864-72, 1952 2 Ju Chin Chu et al, Vapor-Liquid Equilibrium Data, 1956 3 Zabetakis, Michael G., 1965, 'Flammability Characteristics Of
Combustible Gases and Vapours', Bulletin 627, US Bureau of Mines. 4 Bodurtha, F.T., 'Industrial Explosion Prevention and Protection'. 5 Zabetakis, Michael G., 1965, 'Fire and Explosion Hazards at Elevated
Temperature and Pressure Extremes', A.IChem.E-IChem.E. Symposium Series No.2, pp 2-99 to 2-104.
6 Zabetakis, M.G., Lambiris, S. and Scott, G.S., 1959, 'Flame Temperatures of Limit Mixtures', 7th. International Symposium on Combustion', pp 484-487.
7 Zabetakis M.G., Cooper J., Furno A.L., 1962, 'Flammability in Air of Solvent Mixtures Containing Methyl Ethyl Ketone and Tetrahydrofuran', Bureau of Mines 6048.
299

ICHEME SYMPOSIUM SERIES NO. 141
Diagram of 2.5 L Flammabili ty Rig
Heat Ing MedIu
Vooour Press
Gauge —
Heat Ing Medlum
Port for tne Durroea addi t ion of l iQUids
ion Pressure Gauge
Addi t ion port COxidanO
Figure 1
Flammbility Diagram of Acetic Acid / Air /Nitrogen, at 155°C/lxl05 N m-2
f lomreDie corroosition refli
Figure 2

ICHEME SYMPOSIUM SERIES NO. 141
Flammabilitv Diagram of Acetic Acid / Air / Water, a t 155°C/6xl05 N m'2
ontnooie compos i t ion reg i
90 80 70 60
Air concent ra t ion C* «/»0
MDC Cimimum oxygen for coroust ion) = n o % v / \
Figure 3
Flammabilitv Diagram of Acetic Acid / Air / Water, at 155°C/llxl05 N m'2
anvnabie coroooii i L i on reg ion
Air concent ra t ion £% v / v }
MX C.'nir"muni oxygen for comDusilonO = 14.958 v/\
Figure 4
301

ICHEME SYMPOSIUM SERIES NO. 141
Flammability Diagram contrasting the change in tlammabie region with increase pressure and change in inert material present (ie N->/H?0)
Acet ic ACIO
(Fuel3 {":•:•'-'•'.:•.•] s l p r r l f lea r ia imiaole compos i t i on r e g i o n
a c i a / n l r / water a t 155 "C ana 10 Oarg
Figure 5
FlammaDie c o r o o s i l ' O n r e g i o n of a c e t i c aciO / water / a i r 155 *C ana 6 Dara
FiarrcraDle cOToos i l i on r e g i o n f o
a c e t i c a c i a / n i t r o g e n / a i r
a t 155 X ana 1 bara
water
80 70 60 C Ine r t )
c o n c e n t r a t i o n r * »/V3
Vapour Pressure Curves Pure CoToonents
TainoeratL a Pure ac
Figure 6
302
ICHEME SYMPOSIUM SERIES NO. 141
Plot of VLE data a t 2.74 x 10⁵ N m'2 and 7.8 x 10⁵ N m'
V a p o u r - L i q u i d E q u i l i b r i u m Acetic Acia and water at 2. Tin 6« IO** " ! 1
fctoie Fraction of Acetic acia
Figure 7
A c t i v i t y C o e f f i c i e n t v M o l e F r a c t i o n Acetic acid/water
0.9 I 0 8 0.95 0.85 0 75 0 5
Mole f rac t i on of Acetic acid S -a
• Acetic at 2.7-ixion.N + water at 2 74 x t ^ o Acetic at 7 8jrt?i»."a water at 7 a x i d ' u "
Figure 8
303

ICHEME SYMPOSIUM SERIES NO. 141
Flammabilitv Diagram of Acetic acid / water / air at 155°C/6 x 105 N m~2
showing Plant operating Vapour Compositions
IS<:S'-'--:-:-:-:l s i g n i f i e s f lammooie composit ion rag i
VODOUT composit ion dur ing ox ida t ion
O - at 155 "C and 6 x W?M»
Jt 150 T and S»»0*M"-"
Est I mat©d composit ions at tno end of ox ida t i on
Q - ana lys i s of vaoour onose a t end of ox i da t i on . ^ C150 "C and 5 S-6 2*101*3 Crof AM/UHM 20 1.87)
X - : i mated vapour composit ion •no of ox ida t i on
)K - est imated vapour composit ion s t a r i of ox .oa t i on Cassuming w 10% w/w water in tne ace t i c ac i d i n i t i a l l y )
Figure 9
Flammabilitv Diagram for 11 x 103 N m*^/155°C operation showing Plant vapour compositions at varying temperatures
g m f l e s f lemmac-ie composi t ion reg
Estimated vapour Composit ion
X - a t 170 "C ano 11 v \C v<-»
O - a t 160'C and 11 . HTM*
O - at 155 "C and 11 „ i ^Mni "
^ - at 150 "C and 11 y. icf\>- •X
Air concen t ra t ion C* v / v )
IOC Cmlnimum oxygen for combustion) • 14.958 v / \
Figure 10
304