investigation of the earthquake sequence off miyagi ... · investigation of the earthquake sequence...
TRANSCRIPT
Earth Planets Space, 58, 1533–1541, 2006
Investigation of the earthquake sequence off Miyagi prefecture with historicalseismograms
Hiroo Kanamori1, Masatoshi Miyazawa2, and Jim Mori2
1Seismological Laboratory, California Institute of Technology, Pasadena, California, USA2Disaster Prevention Research Institute, Kyoto University, Kyoto, Japan
(Received January 6, 2006; Revised March 30, 2006; Accepted April 23, 2006; Online published February 2, 2007)
We investigated the old seismograms of several earthquakes which occurred offshore of Miyagi prefecturein 1933 (June 18, 21:37 UT), 1936 (Nov. 2, 20:45 UT), 1937 (July 26, 19:56 UT), 1978 (June 12, 08:14 UT),and 2005 (Aug. 16, 02:46 UT). A characteristic earthquake model for the sequence of the 1936, 1978, andseveral other earlier events is the basis of the recent forecast by the Earthquake Research Committee (2003)that “The probability of the occurrence of another similar earthquake in the next 30 years is 99%”. To assessthe validity of the characteristic earthquake model, we compared the waveforms, size and other characteristicsof these earthquakes recorded at Pasadena, DeBilt, Abuyama, Aso, Weston, Strasbourg, and Christchurch. Weconclude that (1) The 1978 event is 3 to 4.5 times larger (in seismic moment) than the 2005 event; (2) The1936 and the 2005 events are about the same size and are fairly close in location; (3) The 1937 event is smallerthan the 1936 event, and is significantly deeper, possibly as deep as 90 km. In contrast, the 1933 event issignificantly shallower than the 1936 event. The differences between these events are too large to justify the useof a simple characteristic earthquake model for the probabilistic forecast. The seismic slip rate in this area andalong the adjacent subduction zone to the south is about 1/4 of the plate convergence rate, which has an importantimplication for the long-term seismic hazard in this area.Key words: Miyagi-Oki earthquakes, characteristic earthquake, probabilistic forecast, asperity.
1. IntroductionA remarkable earthquake sequence with M = 7+ events
offshore of Miyagi prefecture, Japan, was recognized by theEarthquake Research Committee of the Headquarters forEarthquake Promotion (hereafter, referred to as EarthquakeResearch Committee (ERC)) in 2000. Figure 1 shows thegeneral area and the location of the 1978 event, one of theevents in the sequence. Through the investigations of theextent of tsunamis, intensity distributions, and instrumentaldata (for recent events), the following sequence of earth-quakes has been documented: 1793 (8.2, 7.6), 1835 (7.3),1861 (7.4), 1897 (7.4, 7.8), 1936 (7.4, 7.0), 1978 (7.4, 7.4),2005 (7.2, 7.0). The first number in the parenthesis is themagnitude M assigned by ERC, and the second numberis the tsunami magnitude given by Abe (1988, 1999,personal communication, 2005). These earthquakes aregenerally called the Miyagi-ken-Oki earthquakes (OffshoreMiyagi Prefecture earthquakes), but hereafter we call themjust the Miyagi-Oki earthquakes. Note that the averagerecurrence interval before the year 2000 is 37±7 years.On the basis of this approximate regularity, ERC madea tentative calculation with the result that the probabilityof having the next Miyagi-Oki earthquake before the endof 2030 is larger than 90% (report dated Nov. 27, 2000,http://www.jishin.go.jp/main/index.html). Then, in the
Copyright c© The Society of Geomagnetism and Earth, Planetary and Space Sci-ences (SGEPSS); The Seismological Society of Japan; The Volcanological Societyof Japan; The Geodetic Society of Japan; The Japanese Society for Planetary Sci-ences; TERRAPUB.
report of June 11, 2003, ERC updated the calculation andreported that the probability of having another Miyagi-Okiearthquake during the 30 year period after June 1, 2003is 99%. (see also Table 2.2.2-1 on page 54 of the reporthttp://www.jishin.go.jp/main/chousa/05mar yosokuchizu/bunsatsu1-1.pdf.) This situation is similar to that of theParkfield sequence in the U.S (e.g., Bakun et al., 2005). OnAugust 16, 2005, 27 years after the 1978 event, a Mw = 7.2earthquake occurred in the same area, and it appeared thatthe forecast was fulfilled. However, the 2005 event wasabout 3 to 4.5 times smaller in seismic moment than the1978 event, and ERC decided that the 2005 event was notthe expected event, and the forecast remains in effect.
Implicit in this forecast is that these earthquakes are“characteristic” earthquakes, which means that they oc-curred at the same location with a similar size and mech-anism. Thus, if the size of the 2005 event is very differentfrom the 1978 event, it is not the expected characteristicevent. This is probably the logic behind the recent decisionof ERC. Then, an obvious question is how “characteristic”are these events, especially how the 1936 event compareswith the 1978 and 2005 events. Now, several lines of ev-idence suggest that the 1936 event is considerably smallerthan the 1978 event. In relation to this, two other events,one in 1937 and the other in 1933 both with M=7+ whichoccurred in approximately the same area, were brought tothe attention of seismologists (Umino et al., 2006). One ar-gument is that the characteristic event which was supposedto occur in the 1930’s was split into 3 events (1933, 1936,
1533
1534 H. KANAMORI et al.: THE EARTHQUAKE SEQUENCE OFFSHORE OF MIYAGI PREFECTURE
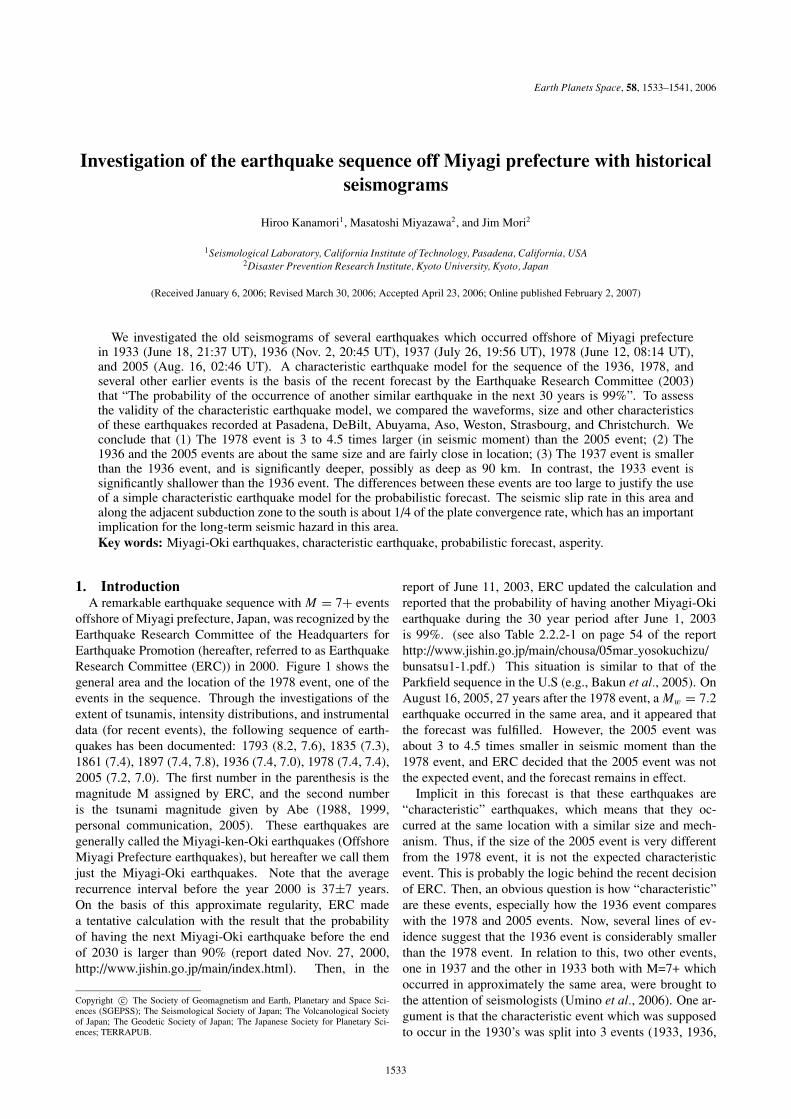
Fig. 1. Location of the 1978 earthquake (star) and comparison of thevertical component Press-Ewing (30–90) seismograms for the 1978 and2005 events. Elliptic symbols indicate the source areas of damagingearthquakes. All the events in the Miyagi-Oki sequence (1933, 1936,1937, 2005) are located within about 50 km of the 1978 event.
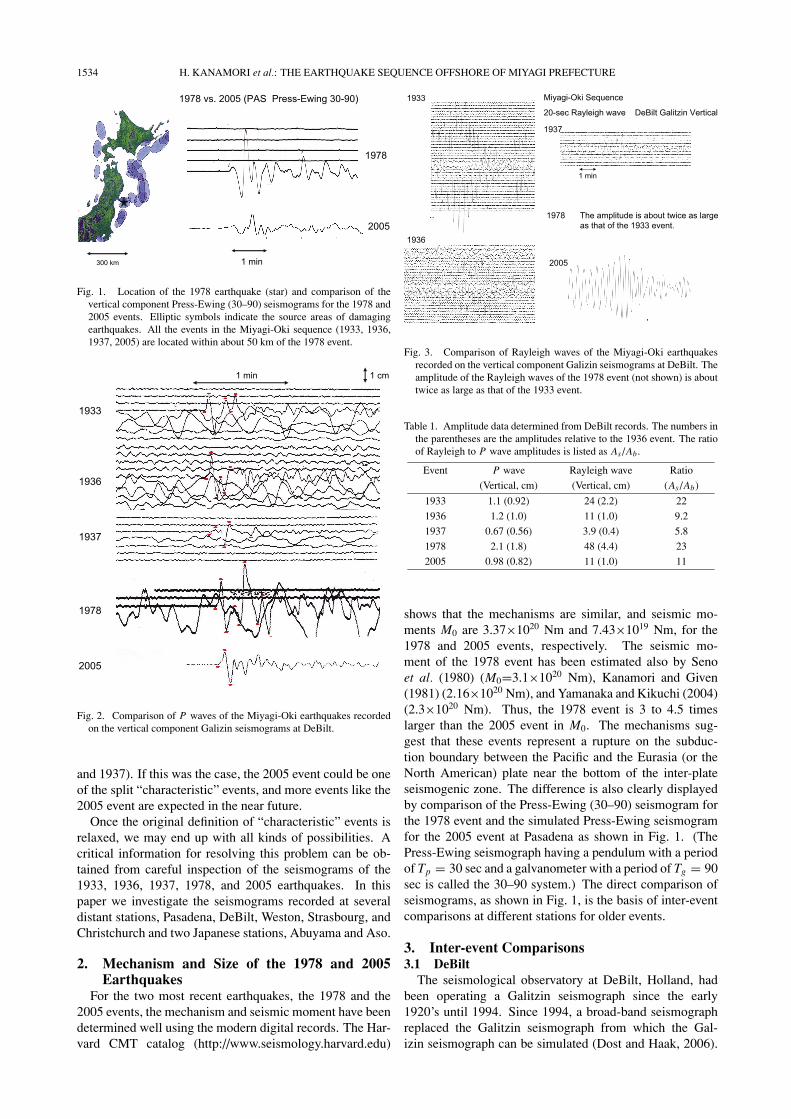
Fig. 2. Comparison of P waves of the Miyagi-Oki earthquakes recordedon the vertical component Galizin seismograms at DeBilt.
and 1937). If this was the case, the 2005 event could be oneof the split “characteristic” events, and more events like the2005 event are expected in the near future.
Once the original definition of “characteristic” events isrelaxed, we may end up with all kinds of possibilities. Acritical information for resolving this problem can be ob-tained from careful inspection of the seismograms of the1933, 1936, 1937, 1978, and 2005 earthquakes. In thispaper we investigate the seismograms recorded at severaldistant stations, Pasadena, DeBilt, Weston, Strasbourg, andChristchurch and two Japanese stations, Abuyama and Aso.
2. Mechanism and Size of the 1978 and 2005Earthquakes
For the two most recent earthquakes, the 1978 and the2005 events, the mechanism and seismic moment have beendetermined well using the modern digital records. The Har-vard CMT catalog (http://www.seismology.harvard.edu)
Fig. 3. Comparison of Rayleigh waves of the Miyagi-Oki earthquakesrecorded on the vertical component Galizin seismograms at DeBilt. Theamplitude of the Rayleigh waves of the 1978 event (not shown) is abouttwice as large as that of the 1933 event.
Table 1. Amplitude data determined from DeBilt records. The numbers inthe parentheses are the amplitudes relative to the 1936 event. The ratioof Rayleigh to P wave amplitudes is listed as As /Ab .
Event P wave Rayleigh wave Ratio
(Vertical, cm) (Vertical, cm) (As /Ab)
1933 1.1 (0.92) 24 (2.2) 22
1936 1.2 (1.0) 11 (1.0) 9.2
1937 0.67 (0.56) 3.9 (0.4) 5.8
1978 2.1 (1.8) 48 (4.4) 23
2005 0.98 (0.82) 11 (1.0) 11
shows that the mechanisms are similar, and seismic mo-ments M0 are 3.37×10²⁰ Nm and 7.43×10¹⁹ Nm, for the1978 and 2005 events, respectively. The seismic mo-ment of the 1978 event has been estimated also by Senoet al. (1980) (M0=3.1×10²⁰ Nm), Kanamori and Given(1981) (2.16×10²⁰ Nm), and Yamanaka and Kikuchi (2004)(2.3×10²⁰ Nm). Thus, the 1978 event is 3 to 4.5 timeslarger than the 2005 event in M0. The mechanisms sug-gest that these events represent a rupture on the subduc-tion boundary between the Pacific and the Eurasia (or theNorth American) plate near the bottom of the inter-plateseismogenic zone. The difference is also clearly displayedby comparison of the Press-Ewing (30–90) seismogram forthe 1978 event and the simulated Press-Ewing seismogramfor the 2005 event at Pasadena as shown in Fig. 1. (ThePress-Ewing seismograph having a pendulum with a periodof Tp = 30 sec and a galvanometer with a period of Tg = 90sec is called the 30–90 system.) The direct comparison ofseismograms, as shown in Fig. 1, is the basis of inter-eventcomparisons at different stations for older events.
3. Inter-event Comparisons3.1 DeBilt
The seismological observatory at DeBilt, Holland, hadbeen operating a Galitzin seismograph since the early1920’s until 1994. Since 1994, a broad-band seismographreplaced the Galitzin seismograph from which the Gal-izin seismograph can be simulated (Dost and Haak, 2006).
H. KANAMORI et al.: THE EARTHQUAKE SEQUENCE OFFSHORE OF MIYAGI PREFECTURE 1535
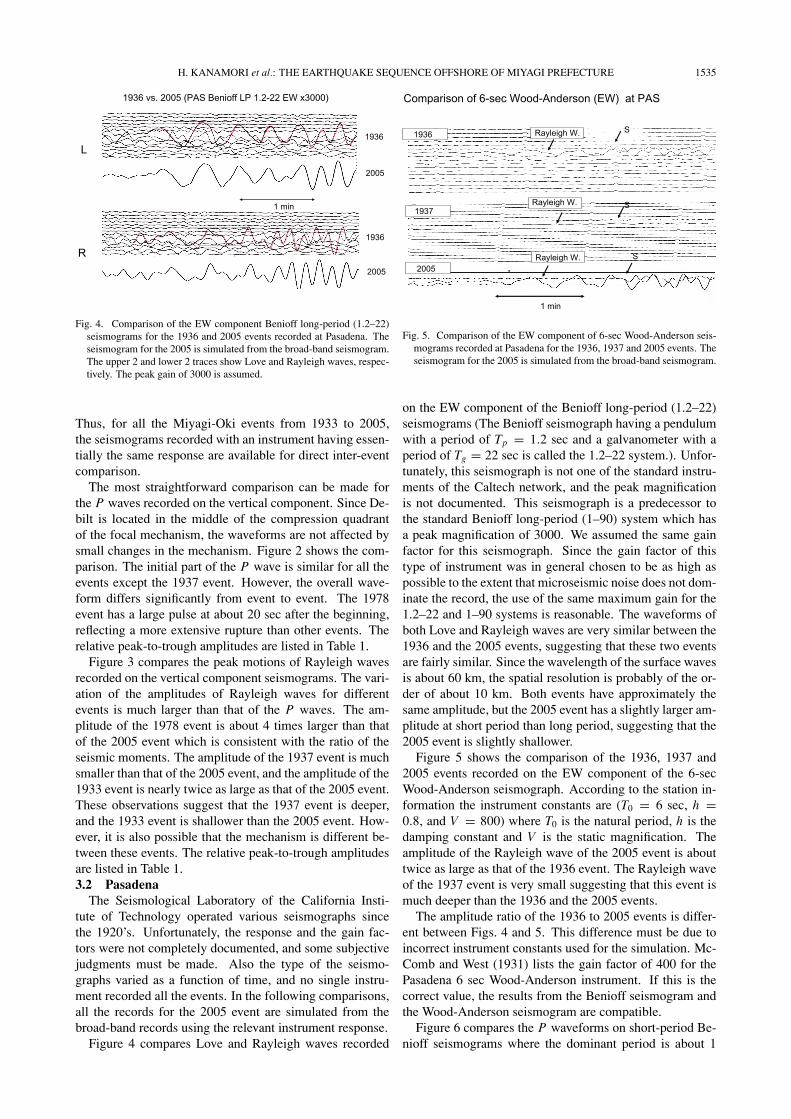
Fig. 4. Comparison of the EW component Benioff long-period (1.2–22)seismograms for the 1936 and 2005 events recorded at Pasadena. Theseismogram for the 2005 is simulated from the broad-band seismogram.The upper 2 and lower 2 traces show Love and Rayleigh waves, respec-tively. The peak gain of 3000 is assumed.
Thus, for all the Miyagi-Oki events from 1933 to 2005,the seismograms recorded with an instrument having essen-tially the same response are available for direct inter-eventcomparison.
The most straightforward comparison can be made forthe P waves recorded on the vertical component. Since De-bilt is located in the middle of the compression quadrantof the focal mechanism, the waveforms are not affected bysmall changes in the mechanism. Figure 2 shows the com-parison. The initial part of the P wave is similar for all theevents except the 1937 event. However, the overall wave-form differs significantly from event to event. The 1978event has a large pulse at about 20 sec after the beginning,reflecting a more extensive rupture than other events. Therelative peak-to-trough amplitudes are listed in Table 1.
Figure 3 compares the peak motions of Rayleigh wavesrecorded on the vertical component seismograms. The vari-ation of the amplitudes of Rayleigh waves for differentevents is much larger than that of the P waves. The am-plitude of the 1978 event is about 4 times larger than thatof the 2005 event which is consistent with the ratio of theseismic moments. The amplitude of the 1937 event is muchsmaller than that of the 2005 event, and the amplitude of the1933 event is nearly twice as large as that of the 2005 event.These observations suggest that the 1937 event is deeper,and the 1933 event is shallower than the 2005 event. How-ever, it is also possible that the mechanism is different be-tween these events. The relative peak-to-trough amplitudesare listed in Table 1.3.2 Pasadena
The Seismological Laboratory of the California Insti-tute of Technology operated various seismographs sincethe 1920’s. Unfortunately, the response and the gain fac-tors were not completely documented, and some subjectivejudgments must be made. Also the type of the seismo-graphs varied as a function of time, and no single instru-ment recorded all the events. In the following comparisons,all the records for the 2005 event are simulated from thebroad-band records using the relevant instrument response.
Figure 4 compares Love and Rayleigh waves recorded
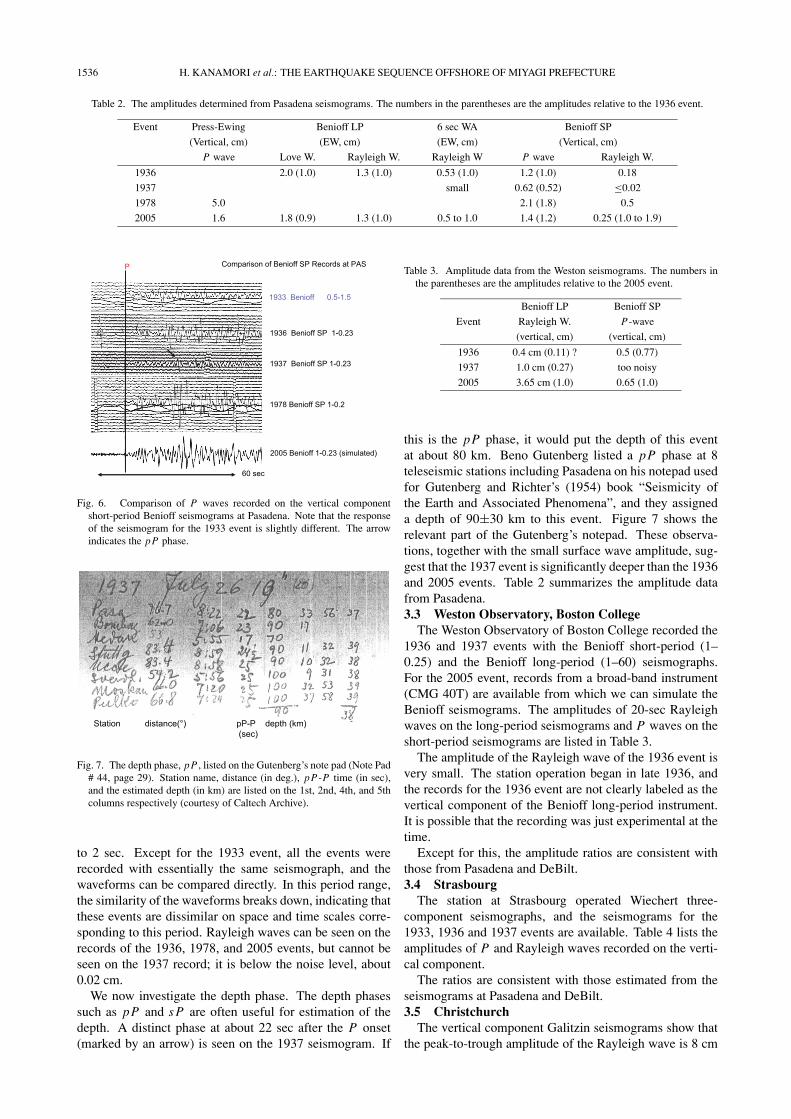
Fig. 5. Comparison of the EW component of 6-sec Wood-Anderson seis-mograms recorded at Pasadena for the 1936, 1937 and 2005 events. Theseismogram for the 2005 is simulated from the broad-band seismogram.
on the EW component of the Benioff long-period (1.2–22)seismograms (The Benioff seismograph having a pendulumwith a period of Tp = 1.2 sec and a galvanometer with aperiod of Tg = 22 sec is called the 1.2–22 system.). Unfor-tunately, this seismograph is not one of the standard instru-ments of the Caltech network, and the peak magnificationis not documented. This seismograph is a predecessor tothe standard Benioff long-period (1–90) system which hasa peak magnification of 3000. We assumed the same gainfactor for this seismograph. Since the gain factor of thistype of instrument was in general chosen to be as high aspossible to the extent that microseismic noise does not dom-inate the record, the use of the same maximum gain for the1.2–22 and 1–90 systems is reasonable. The waveforms ofboth Love and Rayleigh waves are very similar between the1936 and the 2005 events, suggesting that these two eventsare fairly similar. Since the wavelength of the surface wavesis about 60 km, the spatial resolution is probably of the or-der of about 10 km. Both events have approximately thesame amplitude, but the 2005 event has a slightly larger am-plitude at short period than long period, suggesting that the2005 event is slightly shallower.
Figure 5 shows the comparison of the 1936, 1937 and2005 events recorded on the EW component of the 6-secWood-Anderson seismograph. According to the station in-formation the instrument constants are (T0 = 6 sec, h =0.8, and V = 800) where T0 is the natural period, h is thedamping constant and V is the static magnification. Theamplitude of the Rayleigh wave of the 2005 event is abouttwice as large as that of the 1936 event. The Rayleigh waveof the 1937 event is very small suggesting that this event ismuch deeper than the 1936 and the 2005 events.
The amplitude ratio of the 1936 to 2005 events is differ-ent between Figs. 4 and 5. This difference must be due toincorrect instrument constants used for the simulation. Mc-Comb and West (1931) lists the gain factor of 400 for thePasadena 6 sec Wood-Anderson instrument. If this is thecorrect value, the results from the Benioff seismogram andthe Wood-Anderson seismogram are compatible.
Figure 6 compares the P waveforms on short-period Be-nioff seismograms where the dominant period is about 1
1536 H. KANAMORI et al.: THE EARTHQUAKE SEQUENCE OFFSHORE OF MIYAGI PREFECTURE
Table 2. The amplitudes determined from Pasadena seismograms. The numbers in the parentheses are the amplitudes relative to the 1936 event.
Event Press-Ewing Benioff LP 6 sec WA Benioff SP
(Vertical, cm) (EW, cm) (EW, cm) (Vertical, cm)
P wave Love W. Rayleigh W. Rayleigh W P wave Rayleigh W.
1936 2.0 (1.0) 1.3 (1.0) 0.53 (1.0) 1.2 (1.0) 0.18
1937 small 0.62 (0.52) ≤0.02
1978 5.0 2.1 (1.8) 0.5
2005 1.6 1.8 (0.9) 1.3 (1.0) 0.5 to 1.0 1.4 (1.2) 0.25 (1.0 to 1.9)
Fig. 6. Comparison of P waves recorded on the vertical componentshort-period Benioff seismograms at Pasadena. Note that the responseof the seismogram for the 1933 event is slightly different. The arrowindicates the pP phase.
Fig. 7. The depth phase, pP , listed on the Gutenberg’s note pad (Note Pad# 44, page 29). Station name, distance (in deg.), pP-P time (in sec),and the estimated depth (in km) are listed on the 1st, 2nd, 4th, and 5thcolumns respectively (courtesy of Caltech Archive).
to 2 sec. Except for the 1933 event, all the events wererecorded with essentially the same seismograph, and thewaveforms can be compared directly. In this period range,the similarity of the waveforms breaks down, indicating thatthese events are dissimilar on space and time scales corre-sponding to this period. Rayleigh waves can be seen on therecords of the 1936, 1978, and 2005 events, but cannot beseen on the 1937 record; it is below the noise level, about0.02 cm.
We now investigate the depth phase. The depth phasessuch as pP and s P are often useful for estimation of thedepth. A distinct phase at about 22 sec after the P onset(marked by an arrow) is seen on the 1937 seismogram. If
Table 3. Amplitude data from the Weston seismograms. The numbers inthe parentheses are the amplitudes relative to the 2005 event.
Benioff LP Benioff SP
Event Rayleigh W. P-wave
(vertical, cm) (vertical, cm)
1936 0.4 cm (0.11) ? 0.5 (0.77)
1937 1.0 cm (0.27) too noisy
2005 3.65 cm (1.0) 0.65 (1.0)
this is the pP phase, it would put the depth of this eventat about 80 km. Beno Gutenberg listed a pP phase at 8teleseismic stations including Pasadena on his notepad usedfor Gutenberg and Richter’s (1954) book “Seismicity ofthe Earth and Associated Phenomena”, and they assigneda depth of 90±30 km to this event. Figure 7 shows therelevant part of the Gutenberg’s notepad. These observa-tions, together with the small surface wave amplitude, sug-gest that the 1937 event is significantly deeper than the 1936and 2005 events. Table 2 summarizes the amplitude datafrom Pasadena.3.3 Weston Observatory, Boston College
The Weston Observatory of Boston College recorded the1936 and 1937 events with the Benioff short-period (1–0.25) and the Benioff long-period (1–60) seismographs.For the 2005 event, records from a broad-band instrument(CMG 40T) are available from which we can simulate theBenioff seismograms. The amplitudes of 20-sec Rayleighwaves on the long-period seismograms and P waves on theshort-period seismograms are listed in Table 3.
The amplitude of the Rayleigh wave of the 1936 event isvery small. The station operation began in late 1936, andthe records for the 1936 event are not clearly labeled as thevertical component of the Benioff long-period instrument.It is possible that the recording was just experimental at thetime.
Except for this, the amplitude ratios are consistent withthose from Pasadena and DeBilt.3.4 Strasbourg
The station at Strasbourg operated Wiechert three-component seismographs, and the seismograms for the1933, 1936 and 1937 events are available. Table 4 lists theamplitudes of P and Rayleigh waves recorded on the verti-cal component.
The ratios are consistent with those estimated from theseismograms at Pasadena and DeBilt.3.5 Christchurch
The vertical component Galitzin seismograms show thatthe peak-to-trough amplitude of the Rayleigh wave is 8 cm
H. KANAMORI et al.: THE EARTHQUAKE SEQUENCE OFFSHORE OF MIYAGI PREFECTURE 1537
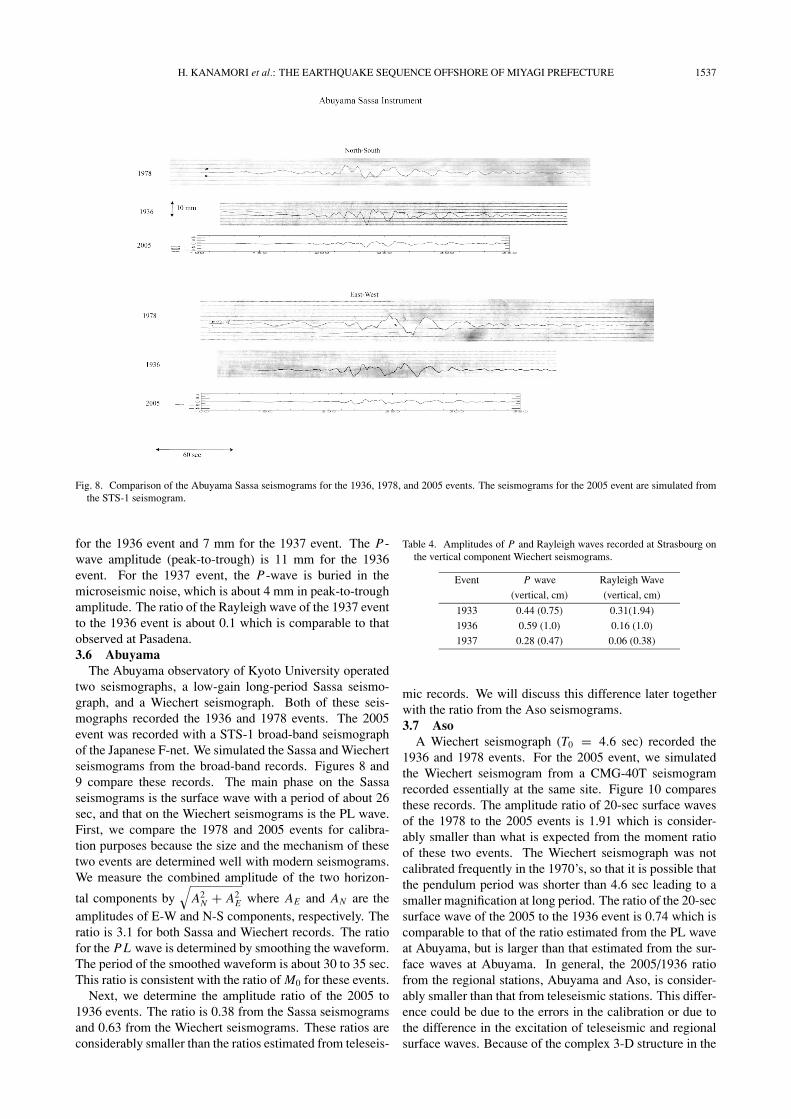
Fig. 8. Comparison of the Abuyama Sassa seismograms for the 1936, 1978, and 2005 events. The seismograms for the 2005 event are simulated fromthe STS-1 seismogram.
for the 1936 event and 7 mm for the 1937 event. The P-wave amplitude (peak-to-trough) is 11 mm for the 1936event. For the 1937 event, the P-wave is buried in themicroseismic noise, which is about 4 mm in peak-to-troughamplitude. The ratio of the Rayleigh wave of the 1937 eventto the 1936 event is about 0.1 which is comparable to thatobserved at Pasadena.3.6 Abuyama
The Abuyama observatory of Kyoto University operatedtwo seismographs, a low-gain long-period Sassa seismo-graph, and a Wiechert seismograph. Both of these seis-mographs recorded the 1936 and 1978 events. The 2005event was recorded with a STS-1 broad-band seismographof the Japanese F-net. We simulated the Sassa and Wiechertseismograms from the broad-band records. Figures 8 and9 compare these records. The main phase on the Sassaseismograms is the surface wave with a period of about 26sec, and that on the Wiechert seismograms is the PL wave.First, we compare the 1978 and 2005 events for calibra-tion purposes because the size and the mechanism of thesetwo events are determined well with modern seismograms.We measure the combined amplitude of the two horizon-
tal components by√
A2N + A2
E where AE and AN are theamplitudes of E-W and N-S components, respectively. Theratio is 3.1 for both Sassa and Wiechert records. The ratiofor the P L wave is determined by smoothing the waveform.The period of the smoothed waveform is about 30 to 35 sec.This ratio is consistent with the ratio of M0 for these events.
Next, we determine the amplitude ratio of the 2005 to1936 events. The ratio is 0.38 from the Sassa seismogramsand 0.63 from the Wiechert seismograms. These ratios areconsiderably smaller than the ratios estimated from teleseis-
Table 4. Amplitudes of P and Rayleigh waves recorded at Strasbourg onthe vertical component Wiechert seismograms.
Event P wave Rayleigh Wave
(vertical, cm) (vertical, cm)
1933 0.44 (0.75) 0.31(1.94)
1936 0.59 (1.0) 0.16 (1.0)
1937 0.28 (0.47) 0.06 (0.38)
mic records. We will discuss this difference later togetherwith the ratio from the Aso seismograms.3.7 Aso
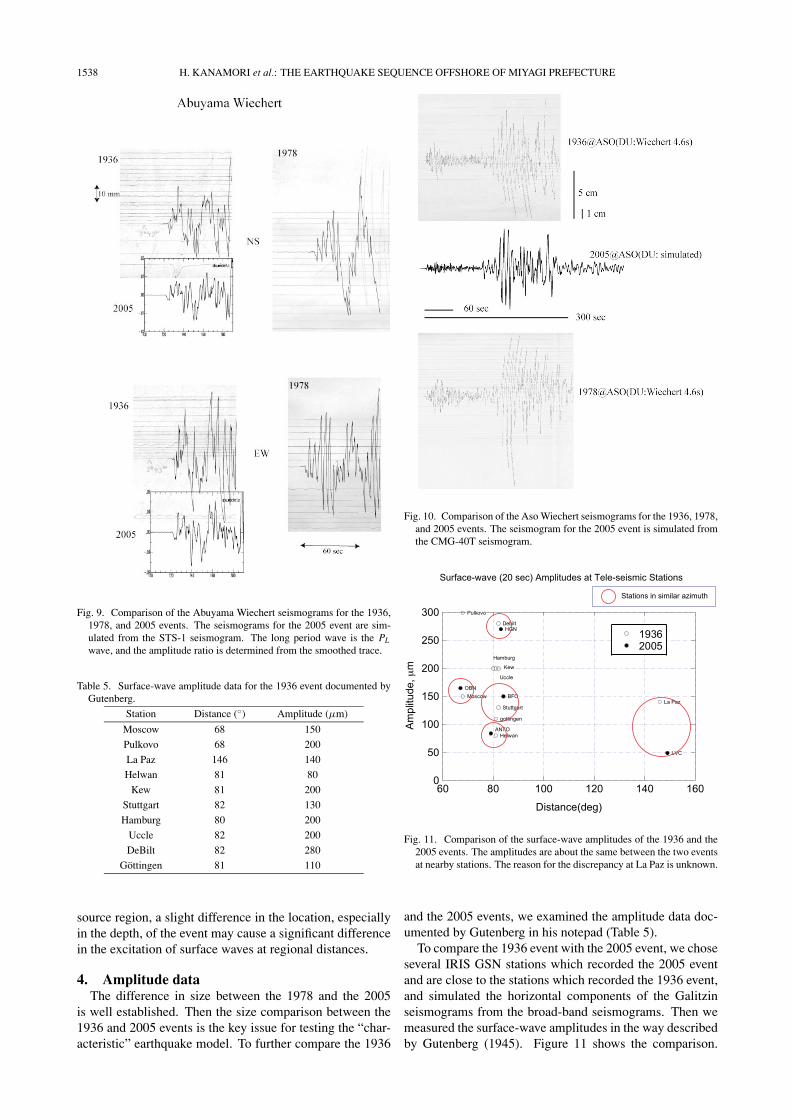
A Wiechert seismograph (T0 = 4.6 sec) recorded the1936 and 1978 events. For the 2005 event, we simulatedthe Wiechert seismogram from a CMG-40T seismogramrecorded essentially at the same site. Figure 10 comparesthese records. The amplitude ratio of 20-sec surface wavesof the 1978 to the 2005 events is 1.91 which is consider-ably smaller than what is expected from the moment ratioof these two events. The Wiechert seismograph was notcalibrated frequently in the 1970’s, so that it is possible thatthe pendulum period was shorter than 4.6 sec leading to asmaller magnification at long period. The ratio of the 20-secsurface wave of the 2005 to the 1936 event is 0.74 which iscomparable to that of the ratio estimated from the PL waveat Abuyama, but is larger than that estimated from the sur-face waves at Abuyama. In general, the 2005/1936 ratiofrom the regional stations, Abuyama and Aso, is consider-ably smaller than that from teleseismic stations. This differ-ence could be due to the errors in the calibration or due tothe difference in the excitation of teleseismic and regionalsurface waves. Because of the complex 3-D structure in the
1538 H. KANAMORI et al.: THE EARTHQUAKE SEQUENCE OFFSHORE OF MIYAGI PREFECTURE
Fig. 9. Comparison of the Abuyama Wiechert seismograms for the 1936,1978, and 2005 events. The seismograms for the 2005 event are sim-ulated from the STS-1 seismogram. The long period wave is the PL
wave, and the amplitude ratio is determined from the smoothed trace.
Table 5. Surface-wave amplitude data for the 1936 event documented byGutenberg.
Station Distance (◦) Amplitude (µm)
Moscow 68 150
Pulkovo 68 200
La Paz 146 140
Helwan 81 80
Kew 81 200
Stuttgart 82 130
Hamburg 80 200
Uccle 82 200
DeBilt 82 280
Gottingen 81 110
source region, a slight difference in the location, especiallyin the depth, of the event may cause a significant differencein the excitation of surface waves at regional distances.
4. Amplitude dataThe difference in size between the 1978 and the 2005
is well established. Then the size comparison between the1936 and 2005 events is the key issue for testing the “char-acteristic” earthquake model. To further compare the 1936
Fig. 10. Comparison of the Aso Wiechert seismograms for the 1936, 1978,and 2005 events. The seismogram for the 2005 event is simulated fromthe CMG-40T seismogram.
Fig. 11. Comparison of the surface-wave amplitudes of the 1936 and the2005 events. The amplitudes are about the same between the two eventsat nearby stations. The reason for the discrepancy at La Paz is unknown.
and the 2005 events, we examined the amplitude data doc-umented by Gutenberg in his notepad (Table 5).
To compare the 1936 event with the 2005 event, we choseseveral IRIS GSN stations which recorded the 2005 eventand are close to the stations which recorded the 1936 event,and simulated the horizontal components of the Galitzinseismograms from the broad-band seismograms. Then wemeasured the surface-wave amplitudes in the way describedby Gutenberg (1945). Figure 11 shows the comparison.

H. KANAMORI et al.: THE EARTHQUAKE SEQUENCE OFFSHORE OF MIYAGI PREFECTURE 1539
Fig. 12. Comparison of the waveforms of the 2005 inter-plate event (top) and the 2003 intra-plate event (bottom) at four stations distributed over a wideazimuthal range. The records are simulated Galitzin vertical component records. The windows from which the amplitude ratio, (As /Ab), is measuredare indicated. The vertical scale gives the amplitude in meters on a vertical component of the Galitzin seismograph (Tp = Tg = 12 sec) with a peakgain of 1.
Except La Paz, the amplitudes of the 1936 and the 2005events agree within 10 µm . The reason for a factor of 3difference in the amplitude at La Paz is unknown.
5. The 1937 Event, Intra-plate Event?As we mentioned earlier, the small surface waves and
Gutenberg’s report of pP phase suggest that the 1937 eventis probably deep. If it is indeed deep, it is probably nota thrust event on the subduction boundary, and could bean intra-plate event which occurred within the subductingplate. We tested this hypothesis by comparing the ampli-tude ratio of surface waves (Rayleigh wave) to body wavesbetween the 2005 event (inter-plate event) and a knownintra-plate event which occurred on May 26, 2003, offMiyagi prefecture (Mw = 7.0, 38.821N, 141.651E, Depth,72.0 km). This event is located about 60 km north of the2005 earthquake. We simulated Galitzin vertical compo-nent records using the data from the GSN stations, and mea-sured the amplitude ratio, (As /Ab), of surface waves to Pwaves. Figure 12 compares the waveforms at four stationsdistributed over a wide azimuthal range. The ratios aresmaller for the 2003 intra-plate event than the 2005 inter-plate event. This trend is the same as that seen for the 1937event and the 1936 event, and suggests that the 1937 event isa deep intra-plate event like the 2003 event. To quantify thisstatement, we take the ratios (As /Ab) for 7 stations whichare distributed over a wide azimuthal range, and take the av-
erage of them. The ratio of the average ratio of (As /Ab) forthe 2003 event to the 2005 event, (As /Ab)2003/(As /Ab)2005
is 0.41. If the 2003 and 2005 are at the same depth, thisratio should be 1. This ratio can be compared with the ra-tio, (As /Ab)1937/(As /Ab)1936, for the 1937 and 1936 events,which is 0.63 from DeBilt (from Table 1) and ≤0.2 fromPasadena (from Table 2). From this comparison, we canconclude that the depth relation between the 2003 and 2005events is similar to that between the 1937 and 1936 events.The almost complete absence of surface waves at Pasadenasuggests that the 1937 event can be even deeper.
6. Discussion and ConclusionAlthough the amplitude and waveform data obtained
from several stations are not completely consistent, the re-sults from different stations are generally consistent, con-sidering the difficulties in recovering the instrument charac-teristics of old seismograms. The results from teleseismicrecords show:
1) The 1978 event is 3 to 4.5 times larger (in M0) thanthe 2005 event.
2) The 1936 and the 2005 events are about the same sizeand, judging from the waveforms, they are fairly close inlocation and with a similar mechanism, but not identical.
3) The 1933 and the 1937 events are significantly dif-ferent in character from the 1936 event. The 1937 event issmaller than the 1936 event, and is significantly deeper, pos-

1540 H. KANAMORI et al.: THE EARTHQUAKE SEQUENCE OFFSHORE OF MIYAGI PREFECTURE
Table 6. Comparison of the events in the Miyagi-Oki sequence.
Event Relative size Depth
1933 1 shallower
1936 1 ∼40 km
1937 0.3 to 0.5 deeper (70 to 90 km)
1978 3 to 4.5 ∼40 km
2005 1 ∼40 km
sibly as deep as 90 km. It is most likely an intra-plate eventwithin the subducting plate. In contrast, the 1933 event issignificantly shallower than the 1936 event. Table 6 sum-marizes the overall results.
The regional records from Abuyama and Aso indicatethat the surface-wave amplitude of the 2005 event is 0.38to 0.74 times that of the 1936 event. The difference in theamplitude ratio obtained from regional and teleseismic datacould be due to inaccurate calibration. However, if the cal-ibration of the instrument is correct, then the smaller ratiofrom regional data than from teleseismic records indicatesthat the location and the mechanism must be different tocause different excitation for teleseismic and regional dis-tances.
Out of the 5 events of the sequence (1933, 1936, 1937,1978, 2005), only the 1936 and 2005 events look similar.Thus, by a common sense definition, this sequence is not acharacteristic sequence. In the “characteristic earthquake”model used for long-term probabilistic forecasts, some vari-ations are implicitly allowed, but the variations suggestedby our analysis are too large to justify a simple characteris-tic earthquake model for the Miyagi-Oki sequence.
Umino et al. (2006) relocated the main shocks and theaftershocks of the 1933, 1936, 1937, and 1978 earthquakesusing the S-P times reported by the Japan MeteorologicalAgency and those read from the records at two nearby sta-tions. They found that the aftershock areas of the 1933,1936, and 1937 events partly overlap with that of the 1978event. Their conclusions on the 1933 and the 1936 eventsare qualitatively consistent with our results. Regarding the1937 event, Umino et al. (2006) argue on the basis of thedepth of some of the aftershocks (figures 4 and 5 of Uminoet al.) and the main shock mechanism (figure 6 of Uminoet al.) that the 1937 event occurred on the plate boundary,like the 1936 and the 1978 events. This conclusion is dif-ferent from our conclusion. Since the interpretations of theold seismic data are inevitably subject to large uncertain-ties because of the limited quality and the uncertain timingand instrument characteristics, whether the 1937 event isan inter-plate or intra-plate event is ultimately a matter ofjudgment. Our conclusion is based on the pP phase andthe amplitude ratio of the surface to body waves.
Takemura and Kanda (2006) investigated the intensitydistribution of the events of the Miyagi-Oki sequence in-cluding the 1936, 1937, and 1978 events. Their conclusionis qualitatively compatible with that of Umino et al. (2006)and ours. Regarding the 1937 event, Takemura and Kanda(2006) found that the area of intensity 5 (JMA scale) of the1937 event is smaller than that of the 1936 event (figure 2 ofTakemura and Kanda), and its source area is shifted to the
west with respect to the 1936 event (figure 4 of Takemuraand Kanda). This result is consistent with our finding thatthe 1937 event is smaller and probably deeper than the 1936event.
Despite some differences in detail between the threestudies, the overall conclusion that the 1933, 1936, 1937,and1978 are different enough not to be treated as simplecharacteristic earthquakes is supported by all of these stud-ies.
This sequence probably has a more significant implica-tion for the long-term seismic hazard in northeastern Japan.Even if the earthquakes are not characteristic, these eventsdetermine the seismic slip rate in this area for the past 70years. The question is how this seismic slip rate compareswith the plate motion rate in this area. A simple calcula-tion as is done by Kanamori (1977) indicates that it is onlyabout 1/4 of the plate convergence rate. A similar ratio ap-plies to the 200 km segment of the subduction zone southof off Miyagi prefecture. Very few large damaging earth-quakes seem to have occurred for the past 1400 years alongthis segment. In contrast, recent analyses of GPS data sug-gest (Mazzotti, 2000; Nishimura et al., 2004) that plate cou-pling in northeastern Japan is almost 100% (i.e., no aseis-mic slip) to a depth of about 50 km. These observationssuggest: (1) Three quarters of the plate motion is takenup by aseismic slip which was not resolved by the GPSanalysis, or (2) The plate boundary is coupled 100%, andthe accumulated strain will be eventually released by eitherlarge megathrust events, large tsunami earthquakes, or largesilent earthquakes.
Acknowledgments. We thank Katsuyuki Abe for providing uswith key information on the old Japanese events. We thankBernard Dost (DeBilt), Luis Rivera (Strasbourg), Brian Ferris(Christchurch), and John Ebel and Dina Smith (Weston) for lo-cating and sending us the copies of the seismograms used in thisstudy. Anthony Guarino helped us find old seismograms from theCaltech seismogram archive. The copies of the pages of the Guten-berg notepad used in this study were provided by the Archives ofthe California Institute of Technology. For the study of the 2003and 2005 events, we used the Japanese F-Net seismograms, andthe Global Seismic Network seismograms of the Incorporated Re-search Institutions for Seismology. We thank Luis Rivera, ToruMatsuzawa, and Keiko Kuge for careful and thoughtful reviews.Hiroo Kanamori acknowledges the support of the Japan Societyof Promotion of Science under its Eminent Scientists Award pro-gram, which allowed his visit to the Disaster Prevention ResearchInstitute, Kyoto University.
ReferencesAbe, K., Tsunami magnitudes and the quantification of earthquake
tsunamis around Japan, Bull. Earthquake Res. Inst. Tokyo Univ., 63,289–303, 1988.
Abe, K., Quantification of historical tsunamis by the Mt scale, Zisin, 52,369–377, 1999.
Bakun, W. H., B. Aagaard, B. Dost, W. L. Ellsworth, J. L. Hardebeck, R.A. Harris, C. Ji, M. J. S. Johnston, J. Langbein, J. J. Lienkaemper, A. J.Michael, J. R. Murray, R. M. Nadeau, P. A. Reasenberg, M. S. Reichle,E. A. Roeloffs, A. Shakal, R. W. Simpson, and F. Waldhauser, Impli-cations for prediction and hazard assessment from the 2004 Parkfieldearthquake, Nature, 437, 969–974, 2005.
Dost, B. and H. W. Haak, Comparing waveforms by digitisation and sim-ulation of waveforms for four Parkfield earthquakes observed in stationDBN, the Netherlands, Bull. Seismol. Soc. Am., 96, S50–S55, 2006.
Gutenberg, B., Amplitudes of surface waves and magnitude of shallowearthquakes, Bull. Seismol. Soc. Am., 35, 3–12, 1945.

H. KANAMORI et al.: THE EARTHQUAKE SEQUENCE OFFSHORE OF MIYAGI PREFECTURE 1541
Gutenberg, B. and C. F. Richter, Seismicity of the Earth and AssociatedPhenomena, 2 ed., 310 pp., Princeton University Press, Princeton 1954.
Kanamori, H., Seismic and Aseismic Slip along Subduction Zones and theirTectonic Implications, 163–174 pp., AGU Geophys. Mono. 1977.
Kanamori, H. and J. W. Given, Use of long-period surface waves for rapiddetermination of earthquake source parameters, Phys. Earth Planet. Int.,27, 8–31, 1981.
Mazzotti, S., X. Le Pichon, P. Henry, and S. Miyazaki, Full interseismiclocking of the Nankai and Japan-west Kurile subduction zones: Ananalysis of uniform elastic strain accumulation in Japan constrainedby permanent GPS, Journal of Geophysical Research-Solid Earth, 105,13159–13177, 2000.
McComb, H. E. and C. J. West, List of seismological stations of the world,Bulletin of the National Research Council, 1–119, 1931.
Nishimura, T., T. Hirasawa, S. Miyazaki, T. Sagiya, T. Tada, S. Miura,and K. Tanaka, Temporal change of interplate coupling in northeasternJapan during 1995–2002 estimated from continuous GPS observations,Geophysical Journal International, 157, 901–916, 2004.
Seno, T., K. Shimazaki, P. Somerville, K. Sudo, and T. Eguchi, Rupture
process of the Miyagi-oki, Japan, earthquake of June 12, 1978, Phys.Earth Planet. Int., 23, 39–61, 1980.
Takemura, M. and K. Kanda, Characteristics of seismic intensity distri-bution from the earthquake (M=7.2) off Miyagi Prefecture, Japan, onAugust 16th, 2005, and its short-period seismic wave radiation zone,Zisin, 2006 (submitted) (in Japanese).
Umino, N., T. Kono, T. Okada, J. Nakajima, T. Matsuzawa, N. Uchida, A.Hasegawa, Y. Tamura, and G. Aoki, Revisiting the three M∼7 Miyagi-oki earthquakes in the 1930s: Possible seismogenic slip on asperitiesthat were re-ruptured during the 1978 M=7.4 Miyagi-oki earthquake,Earth Planets Space, 58, this issue, 1587–1592, 2006.
Yamanaka, Y. and M. Kikuchi, Asperity map along the subduction zonein northeastern Japan inferred from regional seismic data, J. Geophys.Res., 109, B07307, doi:07310.01029/02003JB002683, 2004.
H. Kanamori (e-mail: [email protected]), M. Miyazawa, and J.Mori