investigation of systematic differences in aircraft … · airspeeds or phase of flight (pof). in...
TRANSCRIPT

Accepted for publication in Bulletin, American Meteorological Society. 1
INVESTIGATION OF SYSTEMATIC DIFFERENCES IN AIRCRAFT AND
RADIOSONDE TEMPERATURES WITH IMPLICATIONS FOR NWP AND CLIMATE
STUDIES
Bradley A Ballish
NOAA/NWS/NCEP/NCO, Camp Springs, Maryland
V. Krishna Kumar
Perot Systems Government Services and NOAA/NWS/NCEP/NCO, Camp Springs, Maryland Automated aircraft temperatures exhibit considerable variance with aircraft models and are on average warmer than radiosonde temperatures; therefore, field studies and bias corrections for NWP models are recommended. ________
Corresponding author address: Dr. Bradley A. Ballish, NOAA/NCEP Central Operations, Rm. 307, 5200 Auth Road, Camp Springs, MD 20746. E-mail: [email protected]
Accepted for publication in Bulletin, American Meteorological Society. 2
ABSTRACT
Automated aircraft data are very important as input to numerical weather prediction (NWP) models due to their
accuracy, large quantity, extensive and different data coverage compared to radiosonde data. On average,
aircraft mean temperature observation increments (MTOI defined here as the observations minus the
corresponding 6-h forecast (background)) are more positive (warmer) than radiosondes, especially around jet
level. Temperatures from different model types of aircraft exhibit a large variance in MTOI that vary with both
pressure and the phase of flight (POF), confirmed by collocation studies. This paper compares temperatures of
aircraft and radiosondes by collocation and MTOI differences along with discussing the pros and cons of each
method, with neither providing an absolute truth.
Arguments are presented for estimating bias corrections of aircraft temperatures before input into NWP models
based on the difference of their MTOI and that of radiosondes, which tends to cancel systematic errors in the
background while using the radiosondes as truth. These corrections are just estimates as radiosonde
temperatures have uncertainty and the NCEP background has systematic errors, especially a MTOI of almost 2o
C at the tropopause attributable in part to vertical interpolation errors, which can be reduced by increasing
model vertical resolution. The estimated temperature bias corrections are predominantly negative, of the order
of 0.5 to 1.0o C, with relatively small monthly changes, and often have vertically deep amplitudes.
This study raises important issues pertaining to the NWP, aviation and climate communities. Further metadata
from the aviation community, field experiments comparing temperature measurements and input from other
NWP centers are recommended for refining bias corrections.

Accepted for publication in Bulletin, American Meteorological Society. 3
1. Introduction
Wind and temperature data from radiosondes and aircraft are main sources of in-situ information to data
assimilation systems for Numerical Weather Prediction (NWP). Currently, there are about 150,000 automated
aircraft reports per day, used at the National Centers for Environmental Prediction (NCEP), with approximately
three times as many temperature observations than from radiosondes. NCEP operational analyses use
automated aircraft reports known as Aircraft Meteorological Data Relay (AMDAR) data, which includes
automated aircraft data from US aircraft referred to as Aircraft Communication Addressing and Reporting
System (ACARS). Automated aircraft reports from outside the US are referred here as NUS-AMDAR for
clarity. For more information on automated aircraft data, see Moninger et al. (2003) and Painting (2003). A
newer type of US automated aircraft data known as Tropospheric Airborne Meteorological Data Reporting
(TAMDAR) (Moninger et al. 2006) are not yet used in operational models at NCEP and therefore are not
analyzed. However, discussions of some past tests with these data and suggestions for possible field tests are
given.
Zapotocny et al. (2000) showed that with the data assimilation system of the NCEP Eta model, winds and
temperatures from ACARS data had significant impact on analyses and short-range forecasts, but generally less
than that of radiosondes for 12-hour forecasts, but no verifications scores were presented. Graham et al. (2000)
studied impact on 60-hour forecasts with the United Kingdom Meteorological Office model, with various data
types withheld for 15 hours prior to the analysis. These impact tests showed that both radiosondes and aircraft
data were important, with winds generally more useful than temperatures, but the aircraft temperatures were
important in some oceanic cases. Cardinali et al. (2003) analyzed the impact of variable thinning of aircraft
data on an improved 4DVAR version of the European Centre for Medium-Range Weather Forecasts (ECMWF)
model. Their data denial tests with no aircraft data below 350 hPa over North America and Europe indicated

Accepted for publication in Bulletin, American Meteorological Society. 4
that there were differences in forecast mean temperature due to the aircraft data being warmer on average than
the radiosonde data, which is consistent with the finding that ACARS units are more often warmer than the
model background (Moninger et al. 2003).
All types of data used for atmospheric analysis have bias as do the analyses and forecasts from NWP models,
which is a serious concern (Dee 2005). In this paper, the word “bias” denotes a true mean difference of the
observations from reality as opposed to a mean model error. Although such biases cannot be precisely
determined, observational data believed to have significant bias can be bias corrected. It is understood that such
corrections are just estimates. For many years, satellite radiances have been useful for atmospheric analysis, but
required bias corrections of the data by statistical comparison to the background as in Harris and Kelly (2001).
Operational bias corrections are performed to surface pressure observations at the ECMWF using average
differences in surface pressure observations with the background based on the assumption that background
surface pressure has little bias (http://www.ecmwf.int/publications/newsletters/pdf/108.pdf). Here it was found
necessary to employ an anti-buddy check so that only observations that had disagreement with their neighbors
were corrected; otherwise, a problem occurred where a spurious correction formed over North America.
Since the model’s background field has bias (Derber and Wu 1998; Auligne et al. 2007), bias corrections are
statistically anchored to a data type such as radiosondes that have presumably small bias. These latter types of
bias corrections are adaptive since if the bias of the data being corrected changes with time, so do the
corrections. Such corrections involve sophisticated statistics, but are just estimates of the corrections as they
involve assumptions on how to compare the data to be corrected to the data assumed to be without bias. The
standard data such as radiosondes are not perfect and have uncertainty and small biases for various reasons.
Accepted for publication in Bulletin, American Meteorological Society. 5
Field tests can be performed to compare different types of data such as in Bedka et al. (2006), where TAMDAR
temperatures were compared with those of an Accurate Temperature Measuring (ATM) radiosonde, with
multicolored radiosonde temperature sensors (Schmidlin et al. 1986). Further field experiments conducted with
the ATM radiosondes in Schmidlin and Northam (2005) helped quantify uncertainty in radiosonde
temperatures. TAMDAR temperatures were studied in a wind tunnel, compared to temperatures measured on a
NOAA aircraft and to dropsonde data (Daniels et al. 2004a). TAMDAR temperatures were further compared
with those coming from a Rosemont temperature sensor that is similar to temperature measurements on large
commercial aircraft (Daniels et al. 2004b). Such field experiments can provide valuable results, but it is not
likely that all types of aircraft temperatures can be calibrated for all pressures, temperature conditions, aircraft
airspeeds or Phase of Flight (POF). In addition, aircraft temperature biases of a certain aircraft type may change
with time due to gradual clogging of the pitot tubes or changes in new aircraft. However, field tests can provide
anchoring standards for bias corrections derived from data assimilation systems.
Given that radiosonde and aircraft temperatures are critical sources of data for weather prediction and earlier
studies have shown differences in their biases, further detailed investigation of the bias differences is essential.
Schwartz and Benjamin (1995) showed that there were differences in collocated ACARS and radiosonde
temperatures in an area around Denver, Colorado in February and March 1992. They also showed some
dependence of temperature differences on the aircraft’s POF, such as ascent, descent or level, as did Mamrosh
et al. (2002). The ACARS collocation statistics were refined further in Benjamin et al. (1999), where
collocation limits were reduced to 10 km in the horizontal, 10 minutes in time and 30.4m in the vertical. Ballish
and Kumar (2006), using longer periods of time and a global data base including radiosondes, ACARS, NUS-
AMDAR and AIREP (non automated aircraft report) data found persistent differences in the sign of their mean
temperature observation increments (MTOI) between radiosonde and aircraft temperatures with radiosonde

Accepted for publication in Bulletin, American Meteorological Society. 6
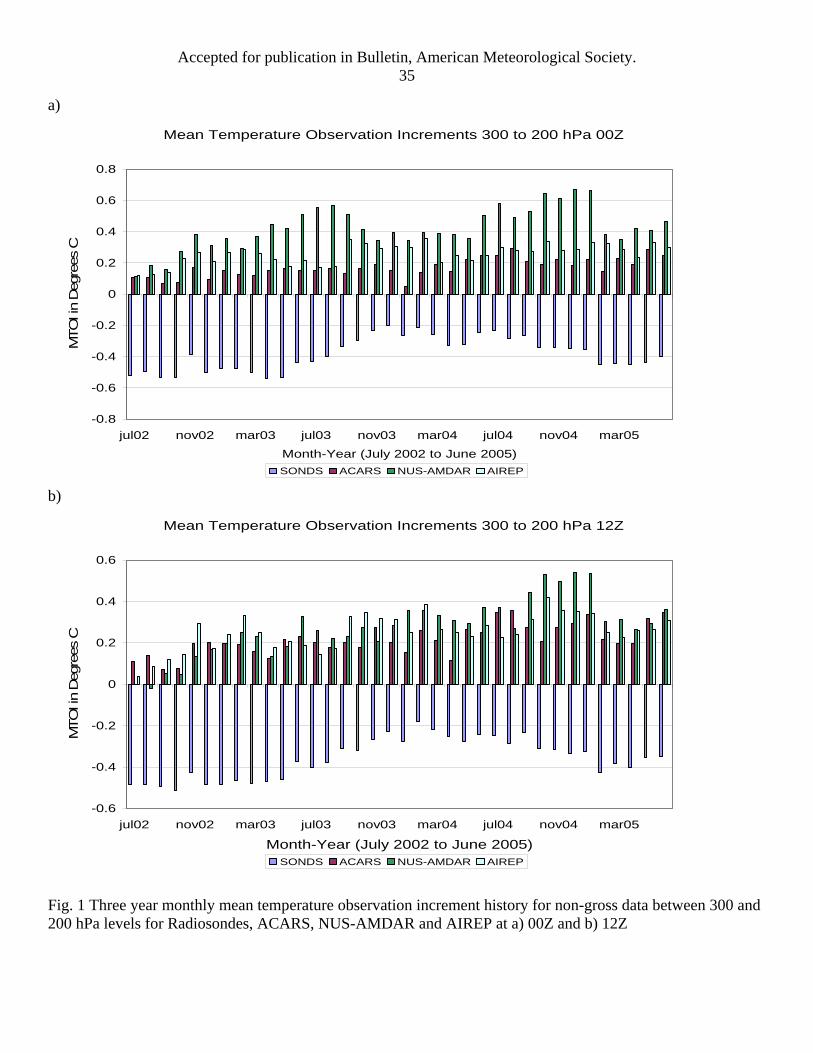
MTOI averaging roughly .5o C colder around 250 hPa, as indicated in Fig. 1a,b. A list of acronyms is provided
in Table 1. Observation increments are defined here as the observations minus the corresponding 6-h forecast
(background) from the NCEP Global Forecast System (GFS) interpolated to the observation locations. Here the
monthly averaged MTOI (for non-gross data, explained in Section 2) are shown for a 3-yr period from July
2002 through June 2005 for 00Z (Fig. 1a) and 12Z (Fig. 1b) for the NCEP Global Data Assimilation System
(GDAS) analyses. These findings of temperature differences raise the issue and the paradigmatic conundrum of
what constitutes the absolute truth, what is the impact of these temperature differences on model analyses and
forecasts, and how to correct any biases. This paper is the first refereed study to show substantial evidence that
the aircraft MTOI vary with aircraft types, pressure levels and the POF as well as to suggest bias corrections of
aircraft temperatures.
2. NCEP GDAS
The NCEP GDAS used in the study, prior to May 2007, is described in Parrish and Derber (1992). As of May
2007, NCEP implemented a new Grid-point Statistical Interpolation (GSI) analysis system (Derber et al. 2007).
Both systems use a data gross check, where data that deviate from the background by more than 10 times the
observational error estimate are considered gross and are not used in operational analyses nor used in computing
MTOI, as large gross errors could adversely affect computed biases. Table 2 shows the temperature observation
error estimates for radiosondes and AMDAR data that are used by the NCEP GDAS analysis, with constant
values between 800 and 350 hPa (not shown). For observations at elevations (in pressure) not in the table, the
errors are considered linear in the logarithm of pressure. AMDAR temperature error estimates are similar to
those from radiosondes. NCEP operational practice is that when an aircraft has a monthly MTOI of 2.0o C or
more in magnitude in any of the three pressure bands for statistics using all POF, the unit is added to the reject-
list for temperatures. Once the MTOI decreases in magnitude below 1.0o C, the unit is removed from the reject-

Accepted for publication in Bulletin, American Meteorological Society. 7
list. For units where the MTOI varies considerably with pressure, subjective judgment is used to decide for
what pressures the unit is on to the reject-list. Observational units on the reject-list are not used in operational
analyses, but the data can still be monitored. Observations are subjected to additional quality control (QC)
procedures (Collins 1998; Woollen 1991).
Radiosonde temperatures may be adjusted by the NCEP radiation correction (RADCOR) procedure (Collins
1999), which adjusts different radiosondes to make their MTOI for matching solar angles similar to those of a
Vaisala RS80 DigiCora radiosonde rather than adjusting towards the average background.
The GDAS uses the observation increments that pass QC along with the background to create the analysis. To
interpolate the background from the model to observation locations, the background is first interpolated
horizontally to observation locations on model levels and then vertical interpolation is done using a linear in the
logarithm of pressure assumption.
3. Aircraft Temperature Bias Analysis 3.1 Versus NCEP Background Aircraft temperatures vary due to many factors such as the aircraft model, airline practices, POF, atmospheric
pressure, software and temperature sensors. Large commercial aircraft fuselages have pitot tubes, which are
about 12 millimeters in diameter and include a temperature sensor inside. Painting (2003) explains how total
and static air pressure measurements are used to derive temperatures and winds along with estimates of their
uncertainty. Adjustment is needed to the temperature due to large dynamic heating of the order of 25o C at
flight level. Approximations are made with no turbulence assumed, an ideal gas constant for dry air is used and
heat exchange with the aircraft is estimated. Different aircraft types can also have different temperature sensors

Accepted for publication in Bulletin, American Meteorological Society. 8
and software that may average the data before they are reported. Aircraft measurements involve rapid motion
through the air in an environment where the air speed and temperature change with pressure, time and
horizontal position. Therefore, there can be error or uncertainty in the temperature due to time delay for the
sensors to adjust to the true air temperature as well as to time averaging of the data. With aircraft, the
temperature sensing equipment may not be repaired or replaced for a long time. A spurious increase in
temperature may occur when the pitot tubes sometimes become corroded or clogged with debris.
Aeronautical Radio Inc. (ARINC) processes the ACARS data downlinks from the aircraft into the
Meteorological Data Collection and Reporting System (MDCRS the ACARS data in the Binary Universal Form
for the Representation of meteorological data (BUFR) format). The resulting data has the tail numbers
encrypted at the request of the airlines to protect the autonomy of the data. Since NCEP is the World
Meteorological Organization (WMO) lead center for aircraft data, we had access to the tail number encryption
software. By means of real tail numbers in conjunction with the Federal Aviation Administration (FAA) web
site (http://registry.faa.gov/aircraftinquiry/), the aircraft model types for all legitimate ACARS reports are
determined. Based on information for European AMDAR models obtained from the WMO AMDAR panel1,
the relevant aircraft model types were determined for most European AMDAR units.
Detailed statistics of AMDAR temperature data as a function of aircraft model numbers were computed which
revealed a characteristic dependence of the MTOI on individual aircraft model types. Figures 2a,b show
monthly averaged ACARS MTOI for 300 hPa and above for all observation cycles combined (00Z, 06Z, 12Z
and 18Z) for non-gross data over 12 months as a function of aircraft model types for two select groups of
aircraft types. Group 1 in Fig. 2a was selected for its large data counts, while group 2 in Fig. 2b was chosen to
show large variations in MTOI. If an aircraft’s MTOI differed by more than three standard deviations from the 1 Lists of EU AMDAR data are available from Stewart Taylor, [email protected]
Accepted for publication in Bulletin, American Meteorological Society. 9
mean of those of a particular type, then that aircraft’s data were not used in the final computation. The bar
graphs shown in Fig. 2a,b include data from all POF and would change insignificantly if data from the few
aircraft in ascent or descent were omitted from the calculations in this pressure range. Different aircraft model
types tend to have different MTOI that change slowly with time, with most being positive. The steadiness in
time of the MTOI along with their sizable variation, suggests that bias correction of the temperatures based on
aircraft type could be worthwhile. The FAA registration information from its web site reveals that almost all
reporting ACARS units of a particular model type are operated by a single airline and have similar registration
dates. Thus, it is likely that a particular model type has similar equipment and software that affect the reported
temperatures. On the other hand, it is possible that different types of aircraft may have identical temperature
measuring and processing systems, and could be treated as one group, if the airlines could provide this
information. Aircraft bias correction based on aircraft type is similar to performing radiation correction of
radiosonde temperatures based on instrument types rather than individual sites. Bias correction based on each
aircraft tail number would encounter problems when data counts become too low. Exceptions to model types
being a good predictor of bias corrections and other difficulties will be discussed below.
3.2 Aircraft to Aircraft Collocation Studies
In order to assess observational temperature differences independent of the background, collocation studies
comparing different aircraft temperature observations together are performed. Collocation involves generating
statistics for different observational data that are close together in time, pressure and horizontal location so that
the data can be compared. As temperature tends to change with altitude, the collocation statistics were done
using aircraft data that are within one hPa in pressure, pass the temperature gross check, and in addition, the two
compared observations had to be within 150 kilometers and one hour in time, and neither unit is on the reject-
list. Experiments with changing the limits for collocations result in changes in counts and minor changes in

Accepted for publication in Bulletin, American Meteorological Society. 10
mean temperature collocation differences (MTCD). For collocations near the ground, one would need tighter
limits due to increased atmospheric variability as well as needing to account for the POF. Figure 3a shows
MTCD comparing aircraft model type 757-222 with other types for January 2007, with the types with the
largest number of collocations to the left ranging from 716,796 to 16,416. Here, the MTCD are averages of the
temperatures from aircraft type 757-222 minus temperatures from the other aircraft types in the figure that meet
the collocation constraints. Since the 757-222 units have negative MTOI, most of the MTCD are negative. The
MTCD are similar to MTOI differences “MTOID”, even though the collocations involve a small subset of the
total data, while the MTOI are global involving all observations. Figure 3b has similarly computed MTCD,
but now the MTCD are averages of the collocations between the aircraft type shown on the horizontal axis and
all other aircraft types that were within the collocation limits, weighted by collocation counts ranging from
1,625,824 to 79,370. Type 767-332 has the largest differences in MTOID and MTCD shown Fig. 3a,b and will
be examined in the next section.
3.3 Vertical and POF Dependence of MTOI
Figure 4a shows MTOI for select ACARS types for January 2005 interpolated to the nearest mandatory pressure
level. Figure 4b is the same for select NUS-AMDAR types for a longer period, December 2005 through
February 2006, used to achieve larger counts. These statistics include all POF. The above figures show that
there is considerable variation in the magnitudes, sign and vertical behavior of the MTOI, with most types
showing a predominantly positive (warm) MTOI.
Many types of US ACARS units do not report the POF and some only report near jet level, while most of the
European AMDAR units report data during all POF through a variety of pressure ranges. Therefore, Fig. 5
shows European AMDAR MTOI interpolated to the nearest mandatory pressure levels for different POF:
missing (MISS), ascent (ASNT), descent (DSNT) and level (LEVL). MTOI near the ground may be large due

Accepted for publication in Bulletin, American Meteorological Society. 11
to possible systematic errors in the background being larger at low levels, and the descent data tend to be colder
than ascent. This temperature difference between ascent and descent is typical for almost all aircraft types that
report the POF. One type, Airbus type A318-100 has an atypical pattern with ascent MTOI colder than descent
(not shown). Recently, Drüe, et al. (2008) found that different Lufthansa aircraft types showed average
temperature differences by collocations for descending aircraft at the Frankfurt airport as large as 1o C even
though the aircraft all had the same software for processing the temperature measurements and had comparable
environmental conditions. Computing MTOI for all aircraft types, for different POF to the nearest mandatory
pressure levels would lead to problems with very low counts for some types.
See Tables 3 and 4 respectively for more detailed information on MTOI and counts of observations for different
ACARS and NUS-AMDAR types for January 2007 for four different pressure bands. These statistics are for all
times of day and all POF. The ACARS statistics were for observations passing the QC in NCEP GDAS runs,
while for the NUS-AMDAR data, the statistics were for non-gross data, as some types have no data passing the
QC due to all of their data being on the reject-list. There is considerable variation in counts and MTOI with
different aircraft types and pressure bands.
For ACARS types 767-322 and 767-332, there is an atypical pattern where data with a missing POF have large
MTOI differences compared to data with a level POF, which is not expected at cruise level, (Fig. 6a,b). The
767-322 units reporting with a missing POF are roughly 1o C colder than those reporting a level POF, see Fig
6a. With type 767-332, the sign of the MTOI differences is the opposite, (Fig 6b). For each of these two types,
there appears to be two subtypes with different MTOI and reporting practices. So far, we have no explanation
for these abnormal differences. Likely, it is a software difference since one subtype is reporting a missing POF
Accepted for publication in Bulletin, American Meteorological Society. 12
when the aircraft is not likely to be changing altitude. These subtypes represent a small fraction of the total
data, but for bias correction, they could be treated as different types.
4. Radiosonde Temperature MTOI Analysis Radiosondes use different types of temperature sensors as part of a sensor package hanging from a balloon that
rises through the atmosphere. The reported temperature may differ from its true value due to a number of
factors such as the characteristics of the temperature sensor; solar and infrared heating or cooling depending on
the current state of the atmosphere and the surface below; variable air conduction rates; impact from the balloon
and its tether; and all the parts of the radiosonde and the computer processing of the temperatures before
distribution. Changes in any of the above factors can influence the reported temperature (Gaffen 1994).
Radiosonde temperatures have been shown to be slow to respond to rapid temperature changes in the vertical
and have error if the sensor is too warm or cold at the balloon launch compared to the current surface conditions
(Mahesh et al. 1997; Hudson et al. 2004).
4.1 Radiation Correction
Attempt to correct radiosonde temperatures for radiative effects, called the radiation correction, is a difficult and
challenging problem as outlined in Luers and Eskridge (1995); therefore, there is some uncertainty in corrected
results. The uncertainty in radiosonde temperatures continues to be an active area of research due to the
importance of estimating global warming (Thorne et al. 2005).
Investigation of the negative (cold) MTOI of radiosondes around 250 hPa reveals that the NCEP RADCOR
procedure makes it more negative. Figure 7a shows global MTOI for 250 +/- 25 hPa for 00Z with and without
the NCEP RADCOR for a period from July 2004 to June 2006. The figure shows the largest MTOI during the

Accepted for publication in Bulletin, American Meteorological Society. 13
northern hemisphere winter, which is due to the MTOI being larger in winter conditions and most radiosondes
are in the northern hemisphere. Similar results for 12Z are shown in Fig. 7b.
One problem found was that the NCEP RADCOR was still correcting the Chinese radiosondes after they were
corrected at the site starting some time in January 2001 (Yatian et al. 2002). When this double correction for
the Chinese radiosondes was removed in September 2005, the net effect of the NCEP RADCOR on the global
MTOI was reduced, see Fig 7a,b, as expected considering the Chinese correction was relatively large (not
shown). The mean cooling due to the NCEP RADCOR and the analysis are smaller after this correction.
Another problem with RADCOR was an error involving the radiosonde ascent rate in the RADCOR applied at
the site for US RS80 radiosondes (Redder et al. 2003). Uncertainties in the radiation correction are found to be
small compared to the MTOI at the tropopause as explained later. The NCEP RADCOR is not the primary
focus of the paper, but it needs to be revised in the future in light of the new NCEP GSI analysis system and if
aircraft bias corrections are applied.
4.2 Tropopause Bias
The vertical minimum of the MTOI of the radiosondes has been occurring for a long time outside the tropics
and has a vertical peak around 250 hPa as shown by the NCEP non-operational verification website by S. Saha
(http://wwwt.emc.ncep.noaa.gov/gmb/ssaha/maps/obs/month/monthly_cross.html). For available cases, select
the desired month and then select the vertical map option. These plots indicate mostly positive MTOI values
around 250 hPa especially in the winter, as the definition of MTOI is just the opposite of ours. Forecasts from
the ECMWF show similar characteristics at the same website.
Further investigation into the negative (cold) MTOI around 250 hPa showed that for temperature observations
labeled as tropopause data, there was a negative MTOI of almost two degrees C over the continental US

Accepted for publication in Bulletin, American Meteorological Society. 14
(CONUS) for January 2006 (not shown). MTOI at the tropopause are smaller than the MTOI using the NCEP
reanalysis (Randel et al. 2000), where the forecast model has less vertical resolution. The tropopause is often a
narrow and relative minimum in temperature in the vertical profile of a radiosonde’s temperature; therefore, it
could be difficult for both forecast models to predict and to perform accurate vertical interpolation from model
vertical coordinates to the observations.
4.3 Vertical Interpolation Experiments
Since the MTOI at the tropopause were larger than expected considering the accuracy of the observed data and
because the tropopause is vertically narrow, an experiment was conducted to examine the role of vertical
interpolation in producing the bias. Radiosonde temperature data over the CONUS that passed NCEP analysis
QC were taken as the truth and used to initialize model sigma levels assumed to be at the same locations as the
radiosondes and with the same surface pressure. With the temperature on model levels derived from the
assumed true temperatures, one can then perform interpolation from the model levels back to the radiosonde
levels to check on interpolation errors. Since radiosonde data are approximately linear in the logarithm of
pressure between reported levels, we use this relation for all vertical interpolation experiments. According to
the above assumptions, one would expect these “true” model temperatures vertically interpolated back to the
radiosonde levels, to agree well with the observed data.
To understand this pedagogical experiment better, a skewt-logP diagram is shown in Fig. 8a, for the site 72340
for 12Z on 4 January 2007, with observed temperatures shown as red asterisks and temperatures at the centers
of model levels derived from the interpolation of the observations to the model shown as blue triangles. The
temperatures represented by blue triangles match the radiosonde profile, red curve, throughout except for

Accepted for publication in Bulletin, American Meteorological Society. 15
relatively large error at the tropopause given by the asterisk just above 200 hPa. Smaller error is evident just
below 150 hPa. The vertical locations of the blue triangles show typical model vertical resolution. This case
was selected as it has a simple sharp tropopause where the error in interpolation can be easily seen. The error in
the vertical interpolation of the model compared to the observations is the distance between the blue and red
curves.
Figure 8b summarizes average temperature statistics to the nearest mandatory pressure levels for this
temperature interpolation experiment over the CONUS for 00Z and 12Z combined for January 2006. The curve
labeled as “I64” of Fig. 8b shows that there are sizeable average errors with the interpolations of the
observations to the model and then back to the observations, where the 64 refers to the model’s 64 vertical
levels. The center of model levels are shown on the right side of Fig. 8b based on a surface pressure of 1000
hPa. The MTOI for these same radiosonde temperatures are labeled “MTOI”, and there is a large MTOI at 200
hPa. These MTOI include significant level radiosonde data with statistics taken to the nearest mandatory
pressure levels. The curve labeled as “NTRP” is the same as “MTOI” but excludes any observations reported
as a tropopause level from the MTOI calculations and shows that removing tropopause data reduces the MTOI.
Here, the tropopause data had to be between 300 to 175 hPa or else they were treated as non-tropopause
observations. The interpolation errors shown by curve I64 are a significant fraction of the MTOI around 250
hPa, which involves the operational forecast from an analysis six hours earlier and then vertical and horizontal
interpolation from the model to the observations. Interpolation experiment I72 was the same as I64, except the
model’s vertical resolution was doubled between sigma levels centered at .3297 and .1382, resulting in 8 more
levels and twice as much vertical resolution around jet level. The biases shown by curve I72 are roughly half
those shown in curve I64 around jet level. These tests indicate that there can be significant vertical
interpolation error especially for the tropopause. The model would also need more vertical resolution to capture

Accepted for publication in Bulletin, American Meteorological Society. 16
sharp tropopauses, and further work with the vertical interpolation problem appears worthwhile. The negative
MTOI near the tropopause for the Vaisala RS80 DigiCora radiosonde type contributes to the overall cooling of
the NCEP RADCOR near 250 hPa as it is based on the MTOI of this radiosonde type.
4.4 Aircraft to Radiosonde Collocation Studies
Since the background has bias and there are large MTOI at the tropopause, it is useful to generate collocation
statistics between ACARS types and radiosonde temperatures that do not rely on the accuracy of the
background. Over the CONUS area, comparisons were made with temperatures from ACARS and radiosonde
data. Here, radiosonde temperatures that passed the QC were interpolated in the vertical again using the
assumption that the temperatures are linear in the logarithm of pressure. The vertical interpolation is necessary
since the nearby radiosonde data may have pressure differences as large as the mandatory pressure differences.
To count as a collocation, the aircraft and radiosonde temperatures had to be within 200 km with a time
separation of 1.5 hours or less. No collocations with any vertical separation of over 25 hPa were used. Figure
9a shows the results of the collocations using all CONUS radiosondes for 00Z in January 2007 for the 11
aircraft types with the largest collocation counts sorted to the left side of the plot. The average of the aircraft
minus radiosonde temperatures meeting the above limits are labeled as “MTCD”, while the same differences in
their MTOI were labeled as “MTOID”. For different aircraft types, MTOID and MTCD are similar despite
tropopause problems and some small differences due to the collocations being a small subset of the total data
used in the MTOI calculations. Figure 9b shows the same for 12Z, but the aircraft types displayed are the same
as in Fig. 9a. The MTCD tend to be more positive for 00Z, which could be due to diurnal differences in aircraft
routes, reporting pressures and times or may indicate a problem with RADCOR for the radiosondes.

Accepted for publication in Bulletin, American Meteorological Society. 17
5. Evidence of Systematic Temperature Problems If the average of the observation increments were zero, and the background and analysis had no systematic
errors, then there would be no systematic changes in the analysis minus background temperature field.
However, Fig. 10a,b show, respectively, nonzero monthly average temperature differences of the analysis minus
background for 00Z and 06Z for July 2007 at 250 hPa. Fig. 11a,b similarly show changes for 12Z and 18Z.
The analysis introduces areas of warming over the CONUS, except at 18Z. Systematic temperature changes
and their relation to data biases are not always obvious in part because the analysis uses a variational technique
assimilating different types of conventional temperature and wind data as well as satellite radiances. Analysis
temperature changes at one point are influenced by data from all over the globe. Further work would be needed
to show whether systematic temperature changes by the analysis are due to bias in the observations or the
background.
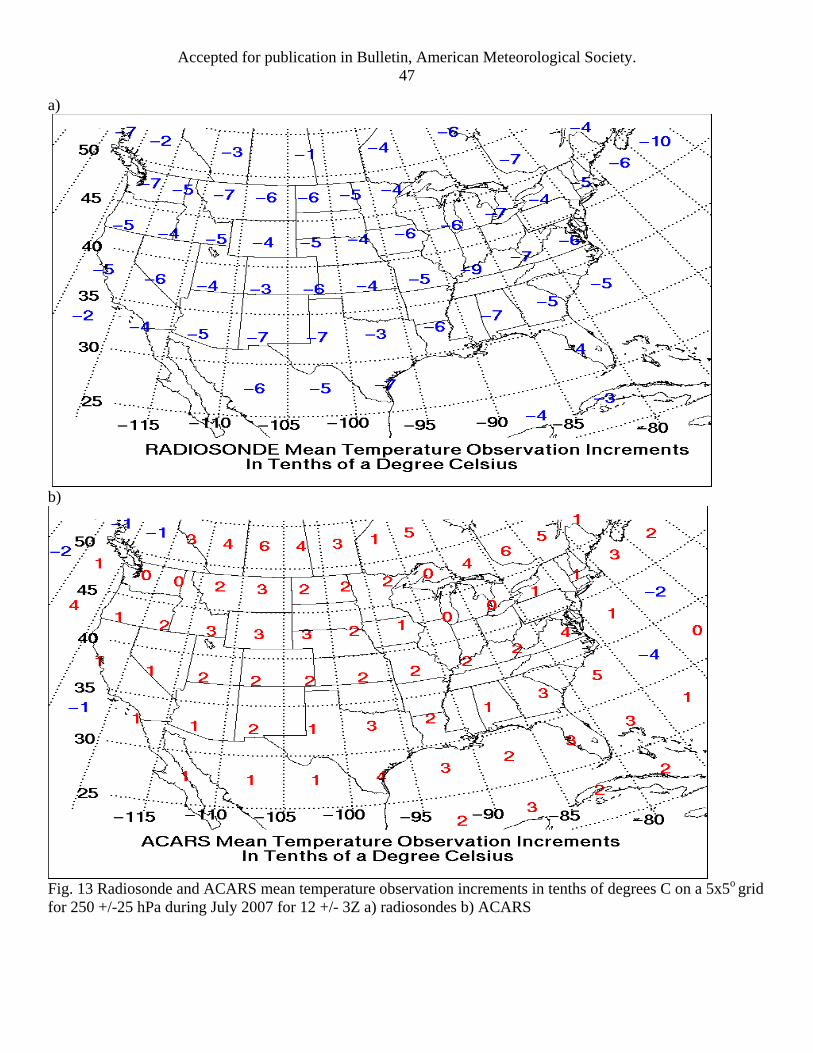
In order to investigate the systematic temperature differences over the CONUS around 250 hPa, Fig. 12a,b
show, respectively, the average counts of radiosonde and ACARS temperature observations for 12Z +/- 3 hours
for July 2007 at 250 +/- 25 hPa on a 5x5o grid. This pressure level was chosen as the biggest contrast in MTOI
is near this level. Figures 13a,b show the same for MTOI in tenths of a degree C. The ACARS data show
mostly positive (warm) MTOI and radiosondes negative (cold). For this period over the CONUS, the NCEP
RADCOR is near zero, so it plays little role in the MTOI differences. The CONUS area especially around 250
hPa is an area of temperature uncertainty due to the contrasting MTOI, where the differences are larger in
magnitude than the analysis minus background changes shown in Figures 10 and 11.
6. Bias Correction Strategy and Consistency Checks

Accepted for publication in Bulletin, American Meteorological Society. 18
By using radiosonde temperatures as the truth and differences in radiosonde and aircraft temperatures as a basis
for deriving aircraft bias corrections, some practical considerations have to be made to carry this out. One
potentially good method would be to use collocations between radiosonde and aircraft temperatures to derive
bias corrections. Unfortunately, some types of aircraft would have too few such collocations to allow for
reliable corrections of temperatures involving all aircraft types and pressures. One problem with collocations is
that not all the aircraft of one type may be sampled uniformly as some aircraft could be flying in areas with few
radiosondes. When collocation counts are low, the derived corrections are less reliable.
A more practical approach is to use differences in MTOI between aircraft and radiosondes. In Section 3, these
were shown to be similar to collocation differences. Still, there are problems to overcome using MTOI
differences. Since radiosonde MTOI have a large average of almost 2o C at the tropopause, and the radiosondes
always report tropopause observations if the temperature profile meets reporting standards for tropopause data,
while aircraft may not report at the tropopause, radiosonde data may over emphasize the tropopause bias
problem compared to aircraft observations. This overemphasis is likely to be reduced by deriving the
corrections through relatively thick pressure layers. Thick layers are also likely to reduce problems where the
background may have diurnal errors near the ground, which may be aggravated further by only having the
background available every 6 hours, rather than a higher resolution time interpolation. Problems with low data
counts for bias correction are further reduced by using thick layers. If the model background has systematic
biases that vary with space, pressure or time, then using MTOI differences will have some error, as the data
distributions are not uniform. Similarly, if the true bias in the observations vary with space, pressure or time,
then using collocations with radiosondes may have sampling problems as most radiosondes have limited
distribution and are primarily at 00Z and 12Z.

Accepted for publication in Bulletin, American Meteorological Society. 19
To reduce the number of figures shown, proposed bias corrections of aircraft temperatures will be shown
without differentiating between different POF, although the actual corrections will differentiate for different
POF for types reporting the POF and large counts at low levels. Since many types of aircraft do not report the
POF or do not report frequently at low levels, these types will have bias corrections that are not a function of the
POF. It is possible that for NWP centers with better time interpolation and less diurnal bias, increased vertical
resolution for the corrections would be beneficial. As a first attempt at bias correction, four pressure groups
were decided to be used, namely the surface to 700 hPa, 700 to 500 hPa, 500 to 300 hPa, and 300 to 150 hPa.
To make differences in MTOI between radiosondes and aircraft similar to collocation differences, observation
increments from similar areas of the globe were used. For ACARS data, MTOI for the aircraft types and
radiosondes were calculated on an area approximating the CONUS. For AMDAR units that were mostly in the
northern hemisphere, MTOI were derived for 20o northward outside the CONUS. For aircraft types with most
of their observations in the tropics, a third region from 20o S to 20o N was used. For aircraft types with most of
their observations south of 20o S, the southern hemisphere was used as a fourth region.
Since there can be errors in reported data that affect derived MTOI, only radiosonde temperatures that passed
the QC were used. For most aircraft types, the same rule was applied except for types where all temperature
data were on the reject-list. For types on the reject-list such as Japanese, Chinese and South African AMDAR
data that have either very warm biases or excessive position errors, non-gross temperatures were used rather
than those that passed the QC for deriving bias corrections.
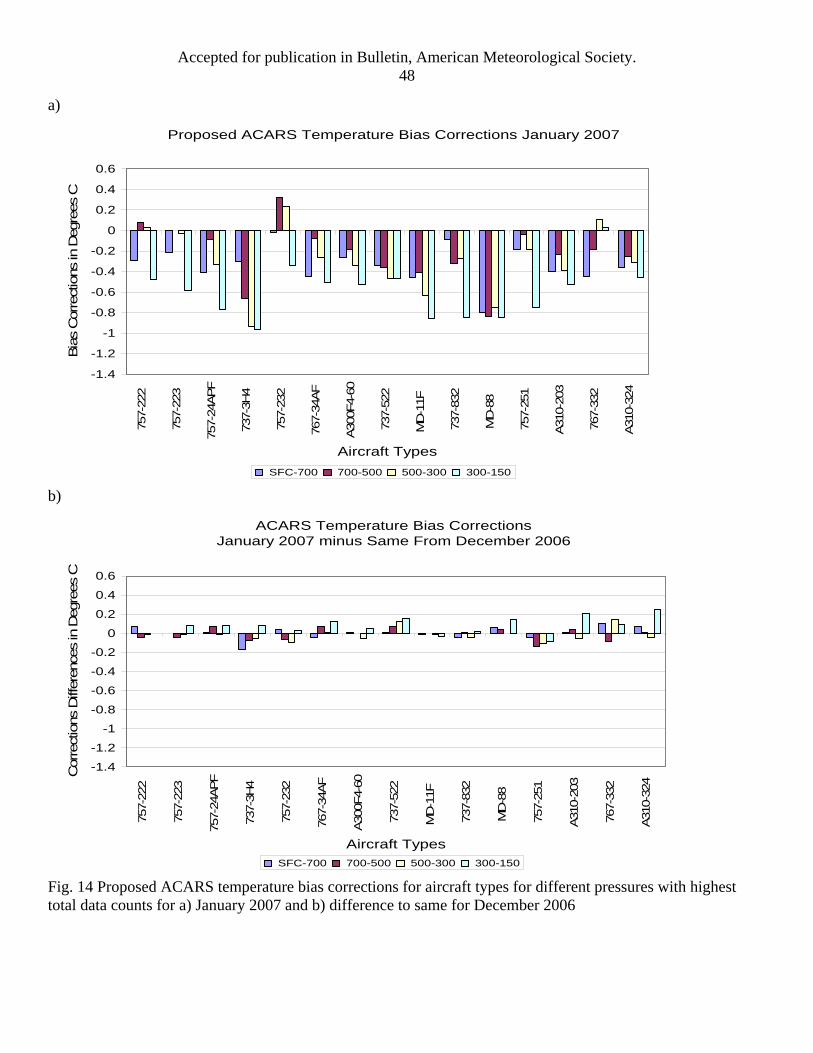
Using the above rules for deriving bias corrections, Fig 14a shows these corrections for 15 ACARS types for
January 2007. The corrections are mostly negative, have amplitudes of the order of several tenths of a degree at

Accepted for publication in Bulletin, American Meteorological Society. 20
all pressures, which makes significant impact of the corrections on forecasts likely. The aircraft types further to
the left have the largest counts. The 15 types in the graphic represent about 96% of the total ACARS data.
Data types with lower counts (not shown) have similar patterns of differences, but some would have no
differences displayed below 300 hPa due to very low data counts. For January 2007, the average NCEP
RADCOR correction over the CONUS near 250 hPa is roughly -0.1o C, so it is a small part of the total
correction. Figure 14b shows the differences between the bias corrections for January 2007 and the previous
month. Notice, the monthly changes in the differences are small. This indicates that corrections could be
derived using monthly MTOI, but additional work may show a more optimal period or method for the
corrections.
Figure 15a is the same as Fig. 14a, but for July 2007. Figure 15b is the same as 14b except the difference is for
January 2007 minus July 2007. For aircraft types, 737-3H4, 737-832 and 767-332, the differences in bias
corrections between January and July are of the order of .5o C in the surface to 700 hPa layer. These differences
are large and need further investigation. Since there can be regional differences in the background bias, new
corrections were derived using only observation increments that were nearby collocations, but large differences
were still found. It was found that collocations with small distance separation limits of only 10 km can have
problems in coastal areas where aircraft could be sampling the cold marine air while the nearby radiosonde
measures warm inland air. Similar calculations avoiding near coastal areas still showed large six-month
differences in corrections. Using small collocations limits reduces counts and may favor ascent over descent or
vice versa, as aircraft landings and takeoffs are not randomly associated with radiosonde data.
Possible explanation of the large six-month differences with the bias corrections is that the true aircraft
temperature corrections may depend on a factor such as true airspeed or temperature lapse rates. If airspeed is

Accepted for publication in Bulletin, American Meteorological Society. 21
an important factor in bias corrections, comparing aircraft temperatures with radiosondes without this factor
may give reasonable average corrections, but will not fully explain all the variance in the data or changes in bias
corrections with time as mean airspeed may change with time. No attempt was made to derive MTOI based on
true air speed because the aircraft data we receive do not have this. Similarly, temperature lapse rates coupled
with rates of ascent and descent may be another important predictor for bias corrections. Another possible
problem is the lack of more accurate time interpolation of the background especially near the ground.
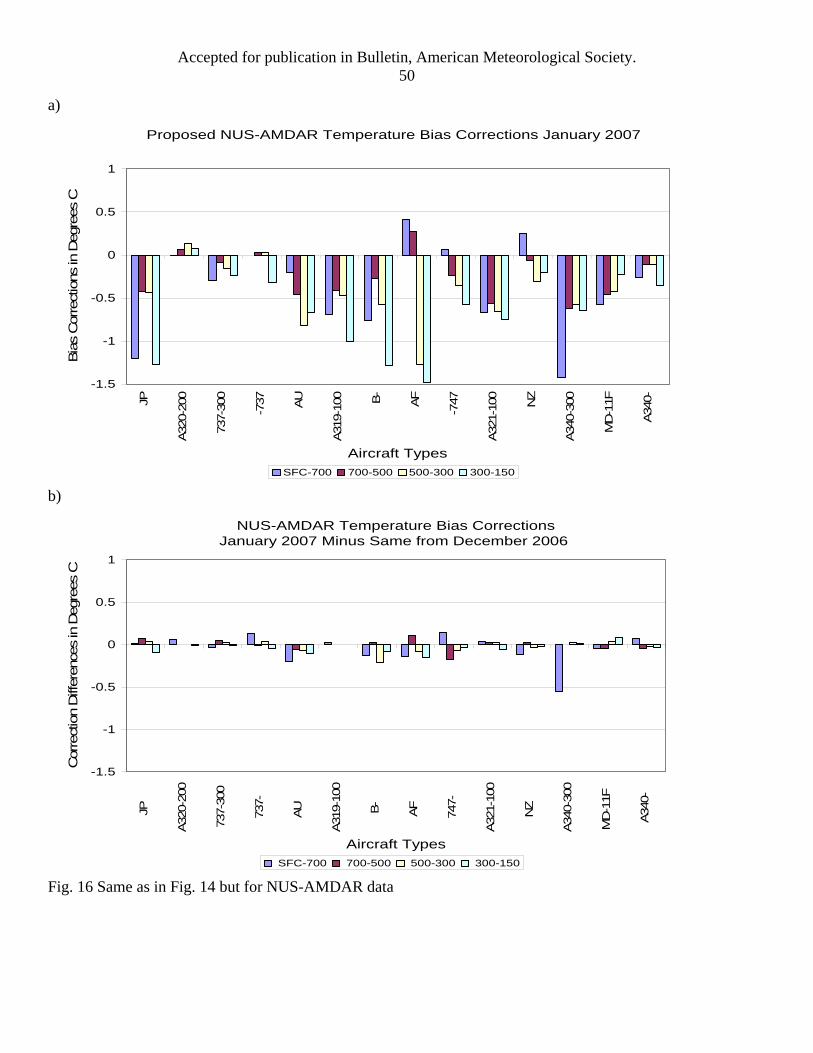
Similar to Fig. 14a,b, Fig. 16a,b show the same except for NUS-AMDAR data. Here, the 14 data types with the
largest counts represent roughly 83% of the total. For European aircraft, the model types are shown in the
figures, while the other symbols are JP, Japanese; AU, Australian; B- Chinese; AF South African and NZ for
New Zealand. Notice, that some of the NUS-AMDAR bias corrections are bigger than the observational error
estimate of 1o C for NUS-AMDAR data above 800 hPa. Again, the monthly changes in the differences are
small. The bias corrections for the ACARS and NUS-AMDAR temperatures are much bigger than typical for
the radiosonde radiation corrections in the troposphere.
Any potential operational correction of temperature data at NCEP may be different from the above plans, as
testing may reveal unexpected problems and revisions may be made as more is learned concerning the
corrections. Further testing will be done with the new GSI analysis. Interactions from other NWP centers about
the possible methods, impact and implications of bias corrections would be desirable. Detailed numerical
investigations to study the full impact of bias correction on the current NCEP operational forecasts in the short,
medium and extended range are currently underway. Since the US airlines have agreed to allow other
government meteorologists to have access to lists of what type of aircraft each unit is, interested parties may

Accepted for publication in Bulletin, American Meteorological Society. 22
contact the lead author for the latest information on aircraft types. So far, we have no information on NUS-
AMDAR aircraft model types except for European units.
7. Conclusions and Plans for Future Work Aircraft temperatures have been shown to vary considerably depending on aircraft model types, pressure and
the POF based on MTOI and collocation studies. The aircraft show predominantly positive (warm) MTOI
while the radiosondes show average negative (cold) MTOI especially around 250 hPa, which results partially
from both errors in forecast of the tropopause and interpolation from model levels to the tropopause.
Arguments were presented towards deriving bias corrections by using MTOI differences between aircraft types
and radiosondes using four pressure levels. These bias corrections are relatively large, of the order of .5 to 1o C,
with amplitudes that are often large at all pressures and consistent from one month to the next, but show some
longer term changes at lower levels that are suspect, indicating more work is needed in this area. Since there is
some uncertainty in radiosonde temperatures due to different temperature sensors and possible errors in the
radiation correction, it may be best to only correct aircraft temperatures that meet a minimum threshold.
A precise field test is recommended to help decide the truth in comparing aircraft and radiosonde temperatures.
This study also raises several intriguing questions. What are the impacts of bias corrected temperatures as
proposed here, and can other NWP centers derive more optimal corrections? Are model temperatures warmer
than they should be due to increases in the quantity and area coverage of aircraft reports with their relatively
warm temperatures? Would additional model vertical resolution result in both better assimilation of radiosonde
tropopause temperatures and forecast skill? Would better use of aircraft temperatures be made in NWP and
climate studies if the aviation community could provide more metadata concerning aircraft temperature

Accepted for publication in Bulletin, American Meteorological Society. 23
measurements? In order to address some of the above questions, we need concerted efforts in data analysis,
data impact studies with NWP and climate models to assess fully the implications at short, medium and climate
time scales. With that perspective, we have initiated impact studies with the NCEP GDAS and GFS with and
without bias correction of aircraft temperatures, and the completed results will be reported in a separate paper.
Acknowledgements. The authors would like to thank Jeff Stickland for numerous suggestions and help with the
AMDAR data. Suru Saha provided her useful web site with MTOI for radiosondes given over a large time.
Stewart Taylor provided aircraft types for the European AMDAR data. Louis Krivanek provided help with the
FAA web site for determining ACARS aircraft types. William Moninger and Richard Mamrosh provided
useful comments and suggestions. The authors would like to thank John Ward, Maxine Brown and Ben Kyger
of NCEP Central Operations for supporting the work. The authors thank Stan Benjamin and an anonymous
reviewer for their very thorough and constructive reviews, and Yucheng Song, David Helms, Bill Bua, and
Wayman Baker for early reviews of the manuscript with many constructive suggestions.

Accepted for publication in Bulletin, American Meteorological Society. 24
References
Auligne, T., A. P. McNally, and D. P. Dee, 2007: Adaptive bias correction for satellite data in a numerical
weather prediction system. Q. J. R. Meteorol. Soc. 133: 631-642.
Ballish, B., and K. Kumar, 2006: Comparison of aircraft and radiosonde temperatures biases at NCEP. 10th
Symposium on Integrated Observing and Assimilation Systems for the Atmosphere, Oceans, and Land Surface
(IOAS-AOLS), Atlanta, GA, Amer. Meteor. Soc., CD-ROM, 3.5
Bedka, S., W. F. Feltz, E. R. Oson, K. M. Bedka, R. A. Petersen, and R. T. Neece, 2006: TAMDAR
thermodynamic state validation using radiosonde data from TAVE. 10th Symposium on Integrated Observing
and Assimilation Systems for the Atmosphere, Oceans, and Land Surface (IOAS-AOLS), Atlanta, GA, Amer.
Meteor. Soc.
Benjamin, S. G., B. E. Schwartz, and R. E. Cole, 1999: Accuracy of ACARS wind and temperature
observations determined by collocation. Wea. Forecasting, 14, 1032-1038.
Cardinali, C., L. Isaksen, and E. Anderson, 2003: Use and impact of automated aircraft data in a global 4DVAR
data assimilation system. Mon. Wea. Rev., 131, 1865-1877.
Collins,W., 1998: Complex quality control of significant level rawinsonde temperatures. J. Atmos. and Oceanic
Techno. 16, 69-79.

Accepted for publication in Bulletin, American Meteorological Society. 25
Collins,W., 1999: Determination of new adjustment tables in order to bring radiosonde temperature and height
measurements from different sonde types into relative agreement. [Available online at
http://www.emc.ncep.noaa.gov/mmb/papers/collins/new_tables/new_tables.html]
Daniels,T. S., G. Tsoucalas, M. Andersen, W. Moninger, and R. Mamrosh, 2004a: Tropospheric airborne
meteorological data reporting (TAMDAR) sensor development. 11th Conference on Aviation, Range, and
Aerospace Meteorology, Hyannis, MA, Amer. Meteor. Soc.
Daniels,T. S., J. J. Murray, C. A. Grainger, D. K. Zhou, M. A. Avery, G. Tsoucalas, M. F. Cagle, P. R.
Schaffner, 2004b: Troposheric airborne meteorological data reporting (TAMDAR) sensor development. 11th
Conference on Aviation, Range, and Aerospace Meteorology, Hyannis, MA, Amer. Meteor. Soc.
Dee, D. P., 2005: Bias and data assimilation. Q. J. R. Meteorol. Soc. 131: 3323-3343.
Derber, J. C., R. Treadon, W. S. Wu, D. F. Parrish, and D. T. Kliest, 2007: NCEP’s gridpoint statistical
interpolation analysis system. 11th Symposium on Integrated Observing and Assimilation Systems for the
Atmosphere, Oceans, and Land Surface (IOAS-AOLS), Atlanta, GA, Amer. Meteor. Soc., CD-ROM, 3.2
Derber, J. C., and W. S. Wu, 1998: The use of TOVS cloud-cleared radiances in the NCEP SSI analysis system.
Mon. Wea. Rev., 126, 2287-2299.
Drüe, C., W. Frey, A. Hoff, and T. Hauf, 2008: Aircraft-type specific errors in AMDAR weather reports from
commercial aircraft. Q. J. R. Meteor. Soc., 134, 229-239.

Accepted for publication in Bulletin, American Meteorological Society. 26
Gaffen, D. J., (1994) Temporal inhomogeneities in radiosondes temperature records. J. Geosphys. Res., 99(D2),
3667-3673.
Graham, R. J., S. R. Anderson and M. S. Bader, 2000: The relative utility of current observation systems to
global-scale NWP forecasts. Q. J. R. Meteor. Soc., 126, 2435-2460.
Harris, B. A., and G. Kelly, 2001: A satellite radiance-bias correction scheme for data assimilation. Quart. J.
Roy. Meteor. Soc, 127, 1453-1468.
Hudson, S. R., M. S. Town, V. P. Walden, and S. G. Warren, 2004: Temperature, humidity, and pressure
response of radiosondes at low temperatures. J. Atmos. and Oceanic Techno., 21, 825-836.
Luers, J. K., and R. E. Eskridge, 1995: Temperature corrections for the VIZ and Vaisala radiosondes. J. Appl.
Meteor., 34, 1241-1252.
Mahesh, A., V. P. Walden, and S. G. Warren,1997: Radiosonde temperature measurements in strong inversions:
correction for thermal lag based on an experiment at the south pole. J. Atmos. and Oceanic Techno., 14, 45-53.
Mamrosh, R., R. Baker and T. Jirikowic, 2002: A comparison of ACARS WVSS and NWS radiosonde
temperatures and moisture data. 6th Symposium on Integrated Observing and Assimilation Systems for the
Atmosphere, Oceans, and Land Surface (IOAS-AOLS), Atlanta, GA, Amer. Meteor. Soc., CD-ROM, 61.14A

Accepted for publication in Bulletin, American Meteorological Society. 27
Moninger, W. R., R. D. Mamrosh, and P. M. Pauley, 2003: Automated meteorological reports from commercial
aircraft. Bull. Amer. Meteor. Soc., 84, 203-216.
Moninger, W. R., R. D. Mamrosh, and T. S. Daniels, 2006: Automated weather reports form aircraft:
TAMDAR and the U. S. AMDAR fleet. 12th Conference on Aviation, Range, and Aerospace Meteorology
(ARAM), Atlanta GA. Amer. Meteor. Soc., CD-ROM, 4.2
Painting, D. J. 2003: AMDAR Reference Manual. [Available online at
http://amdar.wmo.int/Publications/AMDAR_Reference_Manual_2003.pdf]
Parrish, D. F., and J. C. Derber, 1992: The National Meteorological Center’s spectral statistical interpolation
analysis system. Mon. Wea. Rev., 120, 1747-1763.
Randel, W. J., F. Wu, and D. Gaffen, 2000: Interannual variability of the tropical tropopause derived from
radiosonde data and NCEP reanalyses. J. Geophys. Res., 105, 15,509-15,523.
Redder, C., J. Luers, and R. Eskridge, 2003: Unexplained discontinuity in the U.S. radiosonde temperature data.
Part II:Stratosphere. J. Atmos. and Oceanic Techno., 21, 1133-1144.
Schmidlin, F. J., J. K. Luers, and P. D. Hoffman, 1986: Preliminary estimates of radiosonde thermistor errors.
NASA Tech. Paper 2637. 15pp.

Accepted for publication in Bulletin, American Meteorological Society. 28
Schmidlin, F. J., and E. T. Northam, 2005: Standards for evaluating radiosonde measurements. 9th Symposium
on Integrated Observing and Assimilation Systems for the Atmosphere, Oceans, and Land Surface (IOAS-
AOLS), Atlanta, GA, Amer. Meteor. Soc.
Schwartz, B., and S. G. Benjamin, 1995: A comparison of temperature and wind measurements from ACARS-
Equipped aircraft and rawinsondes. Wea. Forecasting, 10, 528-544.
Thorne, P. W., D. E. Parker, J. R. Christy, and C. A. Mears, 2005: Uncertainty in climate trends: Lessons from
upper-air temperature records. Bull. Amer. Meteor. Soc., 86, 1437-1442.
Woollen, J. S., 1991: New NMC operational OI quality control. Ninth Conference on Numerical Weather
Prediction, American Meteorological Society, 24-27.
Yatian, G., H. Bingxun, H. Deyun and F. Zhende, 2002: Corrections for bias of Chinese upper-air
measurements. [Available online at www.wmo.int/pages/prog/www/IMOP/publications/IOM-75-
TECO2002/Papers/1.2(07)Guo.doc]
Zapotocny, T. H., S. J. Nieman, W. P. Menzel, J. P. Nelson III, J.A. Jung, E. Rogers, D. F. Parrish, G.J.DiMego,
M. Baldwin and T.J. Schmit, 2000: A case study of the sensitivity of the Eta Data Assimilation System. Wea.
Forecasting, 15, 603-621.

Accepted for publication in Bulletin, American Meteorological Society. 29
FIGURES Fig. 1. Three year monthly mean temperature observation increment history for non-gross data between 300 and 200 hPa levels for Radiosondes, ACARS, NUS-AMDAR and AIREP at a) 00Z and b) 12Z Fig. 2. Monthly mean temperature observation increment sequence for two groups of ACARS types 300 hPa and above at all times of day for non-gross data with outliers removed for a) Group1 and b) Group 2 Fig. 3. Aircraft to aircraft statistics 300 hPa and above by aircraft types during January 2007 a)mean temperature collocation differences and observation increment differences for Type 757-222 and b) mean temperature collocation differences between aircraft types on the x-axis with all other types Fig. 4. Average vertical dependence of mean temperature observation increments for select aircraft types versus pressure for non-gross data for a) ACARS types and b) NUS-AMDAR types Fig. 5. POF and pressure dependence of European AMDAR mean temperature observation increments for non-gross data for winter 2006 Fig. 6. Vertical dependence of mean temperature observation increments versus missing and level POF for January 2006 for ACARS types a) 767-322 and b) 767-332 Fig. 7. Monthly averaged global temperature differences versus the background at 250 +/- hPa, raw observation minus background (RAWMB), NCEP RADCOR corrected observation minus background (RADMB) and analysis minus background (ANLMB) from July 2004 to July 2006 for a) 00Z and b) 12Z. Fig. 8. Radiosonde temperatures profiles for vertical interpolation experiments. a) Skewt logP temperature profile for site 72340, 12Z 4 January 2007, with observations given in red and interpolations to model in blue. b) Monthly averaged temperature differences for January 2006 to the nearest mandatory pressure level for vertical interpolation experiment over the CONUS. See text for explanation of symbols Fig. 9. ACARS mean temperature collocations and observation increment differences with CONUS radiosondes 250 +/- 25 hPa during January 2007 a) 00Z and b) 12Z Fig. 10. Monthly average values of analysis (AN) minus background (BG) temperature at 250 hPa during July 2007 for a) 00Z and b) 06Z Fig. 11. Same as Fig. 10 but for a) 12Z and b) 18Z Fig. 12. Radiosonde and ACARS daily average data counts on a 5x5o grid for 250 +/-25 hPa during July 2007 for 12 +/- 3Z a) radiosondes b) ACARS Fig. 13. Radiosonde and ACARS mean temperature observation increments in tenths of degrees C on a 5x5o grid for 250 +/-25 hPa during July 2007 for 12 +/- 3Z a) radiosondes b) ACARS

Accepted for publication in Bulletin, American Meteorological Society. 30
Fig. 14. Proposed ACARS temperature bias corrections for aircraft types for different pressures with highest total data counts for a) January 2007 and b) difference to same for December 2006 Fig. 15. Proposed ACARS temperature bias corrections for aircraft types for different pressures with highest total data counts for a) July 2007 and b) difference to same for January 2007 Fig. 16. Same as in Fig. 14 but for NUS-AMDAR data

Accepted for publication in Bulletin, American Meteorological Society. 31
Table 1. Acronym definitions Acronym Definition ACARS Aircraft Communication Addressing and Reporting System AIREP Air Report AMDAR Aircraft Meteorological Data Relay ARINC Aeronautical Radio Inc. ASNT Ascent ATM Accurate Temperature Measuring BUFR Binary Universal Form for the Representation of meteorological data CONUS Continental US DSNT Descent ECMWF European Centre for Medium-Range Weather Forecasts FAA Federal Aviation Administration GDAS Global Data Assimilation System GFS Global Forecast System GSI Grid-point Statistical Interpolation LEVL Level MDCRS Meteorological Data Collection and Reporting System MISS Missing MTCD Mean Temperature Collocation Differences MTOI Mean Temperature Observation Increments MTOID Mean Temperature Observation Increment Differences NCEP National Centers for Environmental Prediction NCO NCEP Central Operations NOAA National Oceanic and Atmospheric Administration NUS Non-US NWP Numerical Weather Prediction NWS National Weather Service POF Phase of Flight QC Quality Control RADCOR Radiation Correction TAMDAR Tropospheric Airborne Meteorological Data Reporting WMO World Meteorological Organization 4DVAR Four-Dimensional Variational Data Assimilation

Accepted for publication in Bulletin, American Meteorological Society. 32
Table 2. Temperature observation error estimates in degrees C for radiosondes (Sonde) and AMDAR data Pressure in hPa Sonde AMDAR 1000.0 1.20 1.47 950.0 1.10 1.35 900.0 .900 1.24 850.0 .800 1.12 800.0 .800 1.00 … 350.0 .800 1.00 300.0 .900 1.00 250.0 1.20 1.00 200.0 1.20 1.00 150.0 1.00 1.00

Accepted for publication in Bulletin, American Meteorological Society. 33
Table 3. ACARS statistics January 2007 all times of day for non-gross data SFC-700 hPa 700- 500 hPa 500-300 hPa 300-150 hPa Type NUM MTOI o C NUM MTOI o C NUM MTOI o C NUM MTOI o C 737-322 4407 0.22 6222 -0.1 7997 -0.1 8763 -0.2 737-3H4 102517 0.28 49104 0.55 35446 0.71 24087 0.48 737-522 47066 0.32 27358 0.25 15665 0.26 21387 -0.01 737-724 0 0 0 0 100 0.43 567 0.19 737-823 111 0.36 118 0.23 1642 -0.02 9966 0.26 737-824 0 0 0 0 327 0.09 1856 0.05 737-832 7612 0.07 8826 0.21 13864 0.05 68500 0.37 737-924 0 0 0 0 0 0 253 0.29 747-422 589 0.17 600 -0.36 666 -0.76 1571 -0.66 757-222 72329 0.27 90427 -0.19 112123 -0.25 306598 0 757-223 133777 0.19 91944 -0.12 64925 -0.19 3730 0.1 757-224 0 0 0 0 0 0 4477 0.14 757-232 3558 0 1754 -0.43 11521 -0.44 167844 -0.13 757-24APF 118746 0.39 65160 -0.03 50367 0.12 57476 0.3 757-251 11561 0.16 12011 -0.07 14103 -0.03 49698 0.27 767-224 0 0 0 0 0 0 718 0.32 767-322 619 0.24 568 -0.63 1257 -0.99 3015 -0.83 767-323 0 0 0 0 119 0.64 699 0.54 767-332 2261 0.43 544 0.07 3079 -0.33 32012 -0.51 767-34AF 51458 0.43 26050 -0.03 29685 0.04 57083 0.03 767-424ER 0 0 0 0 141 0.02 138 0.02 777-222 423 0.99 361 0.43 475 0.25 2524 0.29 777-223 0 0 0 0 191 0.37 2875 0.54 777-224 0 0 0 0 0 0 109 0.1 A300F4-60 67897 0.24 33529 0.07 4424 0.12 12639 0.05 A310-203 33207 0.37 18539 0.12 1647 0.18 6867 0.06 A310-222 11349 0.32 6821 0.14 499 0.15 2029 -0.03 A310-324 15685 0.34 8476 0.14 722 0.09 2801 -0.02 A319-131 1465 0.04 1239 -0.13 1498 -0.09 2935 -0.32 A320-232 1739 0.04 1554 -0.13 2251 -0.17 5054 -0.13 MD-10-10F 867 -0.07 0 0 1924 -0.15 447 -0.31 MD-11 147 0.36 281 0.14 342 -0.07 119 0.3 MD-11F 30354 0.44 17424 0.3 14155 0.41 36914 0.38 MD-88 11115 0.77 12451 0.73 23433 0.53 40498 0.37 TOTAL 730926 0.3 481280 0.05 414212 0.02 931151 0.06

Accepted for publication in Bulletin, American Meteorological Society. 34
Table 4. NUS-AMDAR statistics January 2007 all times of day for non-gross data SFC-700 hPa 700- 500 hPa 500-300 hPa 300-150 hPa Type NUM MTOI o C NUM MTOI o C NUM MTOI o C NUM MTOI o C 737- 60291 -0.1 25737 -0.17 19189 -0.24 24444 0.02 737-300 65223 0.22 20757 -0.04 46828 -0.05 26441 -0.06 747- 7104 0.39 2494 -0.12 1639 0.05 51158 0.34 747-400 3895 0.65 1013 0.23 2053 0.26 15256 0.4 757- 16389 -0.08 5758 -0.26 1215 -0.29 3741 -0.43 767- 6170 0.11 2090 -0.3 679 -0.29 9603 -0.05 A300-600 4344 0.3 1352 0.25 2390 0.15 5958 0.05 A318-100 5570 0.13 4469 -0.08 5195 -0.18 803 -0.04 A319-100 35533 0.61 17978 0.27 22771 0.25 21495 0.7 A320-100 4849 0.07 3747 -0.13 5323 -0.28 584 -0.54 A320-200 56785 -0.1 32796 -0.2 50819 -0.35 29179 -0.39 A321-100 16890 0.58 6083 0.43 12375 0.45 13834 0.44 A330-300 6140 0.41 2653 0.37 3336 0.23 12408 0.36 A340- 5830 0.17 2607 -0.15 987 -0.07 22374 0.05 A340-300 5850 1.13 2635 0.44 3689 0.39 21354 0.44 A340-600 1344 0.82 519 0.71 410 0.47 3254 0.56 MD-11- 2935 0.44 446 0.53 179 0.55 2706 0.51 MD-11F 6931 0.5 2343 0.37 4898 0.26 17835 0.03 AU 34747 0.56 11805 0.29 15991 0.26 49155 0.33 AF 33943 -0.13 6766 -0.42 3030 0.78 38490 1.16 B- 30705 0.67 15895 0.13 25531 0.36 17302 0.97 HK 13645 0.69 4527 0.32 1059 0.04 6834 0.12 JP 137758 1.11 85604 0.28 46875 0.22 70663 0.97 MK 1617 0.77 497 0.54 192 0.13 2174 1.06 NZ 19449 0.03 4909 -0.12 5255 -0.25 6902 -0.08 SA 2644 0.62 734 -0.17 299 -0.07 3829 0.64 SV 8099 1.02 3683 0.88 3148 0.75 223 0.78 MISC 34294 0.2 13715 0.05 13513 0.33 27407 0.32 TOTAL 628974 0.44 283612 0.1 298868 0.07 505406 0.41
Accepted for publication in Bulletin, American Meteorological Society. 35
a)
Mean Temperature Observation Increments 300 to 200 hPa 00Z
-0.8
-0.6
-0.4
-0.2
0
0.2
0.4
0.6
0.8
jul02 nov02 mar03 jul03 nov03 mar04 jul04 nov04 mar05
Month-Year (July 2002 to June 2005)
MTO
I in
Deg
rees
C
SONDS ACARS NUS-AMDAR AIREP b)
Mean Temperature Observation Increments 300 to 200 hPa 12Z
-0.6
-0.4
-0.2
0
0.2
0.4
0.6
jul02 nov02 mar03 jul03 nov03 mar04 jul04 nov04 mar05
Month-Year (July 2002 to June 2005)
MTO
I in
Deg
rees
C
SONDS ACARS NUS-AMDAR AIREP
Fig. 1 Three year monthly mean temperature observation increment history for non-gross data between 300 and 200 hPa levels for Radiosondes, ACARS, NUS-AMDAR and AIREP at a) 00Z and b) 12Z

Accepted for publication in Bulletin, American Meteorological Society. 36
a)
ACARS Mean Temperature Observation Increments by Aircraft Types 300 hPa up
-0.2
-0.1
0
0.1
0.2
0.3
0.4
0.5
0.6
0.7
0.8
Jul-04 Aug-04 Sep-04 Oct-04 Nov-04 Dec-04 Jan-05 Feb-05 Mar-05 Apr-05 May-05 Jun-05
Month-Year Group 1
MTO
I in
Deg
rees
C
757-222 757-232 757-251 767-332 767-34A MD-11 b)
ACARS Mean Temperature Observation Increments by Aircraft Type 300 hPa up
-1
-0.5
0
0.5
1
1.5
2
Jul-04 Aug-04 Sep-04 Oct-04 Nov-04 Dec-04 Jan-05 Feb-05 Mar-05 Apr-05 May-05 Jun-05
Month-Year Group 2
MTO
I in
Deg
rees
C
747-422 757-24A 767-322 767-432 MD-88 MD-90 Fig. 2 Monthly mean temperature observation increment sequence for two groups of ACARS types 300 hPa and above at all times of day for non-gross data with outliers removed for a) Group1 and b) Group 2

Accepted for publication in Bulletin, American Meteorological Society. 37
a)
Aircraft Mean Temperature Collocation and Increment Differences for Type 757-222 January 2007 300 hPa Up
-0.8
-0.6
-0.4
-0.2
0
0.2
0.4
0.6
0.8
757-232 757-251 737-832 767-34AF
757-24APF
767-332 737-322 MD-88 MD-11F 737-522 A300F4-60
737-823
Aircraft Type
MTC
D a
nd M
TOID
in D
egre
es C
MTCD MTOID b)
Generalized Aircraft Mean Temperature Collocation Differences January 2007 300 hPa Up
-0.8
-0.6
-0.4
-0.2
0
0.2
0.4
0.6
757-222 757-232 767-34AF
737-832 757-251 757-24APF
MD-11F 767-332 MD-88 A300F4-60
A310-203
Aircraft Type
MTC
D in
Deg
rees
C
Fig. 3 Aircraft to aircraft statistics 300 hPa and above by aircraft types during January 2007 a)mean temperature collocation differences and observation increment differences for Type 757-222 and b) mean temperature collocation differences between aircraft types on the x-axis with all other types

Accepted for publication in Bulletin, American Meteorological Society. 38
Fig. 4 Average vertical dependence of mean temperature observation increments for select aircraft types versus pressure for non-gross data for a) ACARS types and b) NUS-AMDAR types

Accepted for publication in Bulletin, American Meteorological Society. 39
Fig. 5 POF and pressure dependence of European AMDAR mean temperature observation increments for non-gross data for winter 2006

Accepted for publication in Bulletin, American Meteorological Society. 40
Fig. 6 Vertical dependence of mean temperature observation increments versus missing and level POF for January 2006 for ACARS types a) 767-322 and b) 767-332

Accepted for publication in Bulletin, American Meteorological Society. 41
a) Monthly Averaged Temperature Differences Versus Background 00Z
250 +/- 25 hPa All Sondes
-0.7
-0.6
-0.5
-0.4
-0.3
-0.2
-0.1
0
0.1
JUL0
4
AUG04
SEP04
OCT0
4
NOV04
DEC04
JAN05
FEB05
MAR05
APR05
MAY05
JUN05
JUL0
5
AUG05
SEP05
OCT0
5
NOV05
DEC05
JAN06
FEB06
MAR06
APR06
MAY06
JUN06
Month and Year (July 2004 to June 2006)
Differ
ence
s in D
egre
es C
RAWMB RADMB ANLMB b)
Monthly Average Temperature Differences Versus Background 12Z 250 +/- 25 hPa All Sondes
-0.7
-0.6
-0.5
-0.4
-0.3
-0.2
-0.1
0
0.1
JUL0
4
AUG04
SEP04
OCT0
4
NOV04
DEC04
JAN05
FEB05
MAR05
APR05
MAY05
JUN05
JUL0
5
AUG05
SEP05
OCT0
5
NOV05
DEC05
JAN06
FEB06
MAR06
APR06
MAY06
JUN06
Month and Year (July 2004 to June 2006)
Differ
ence
in D
egre
es C
RAWMB RADMB ANLMB Fig. 7 Monthly averaged global temperature differences versus the background at 250 +/- hPa, raw observation minus background (RAWMB), NCEP RADCOR corrected observation minus background (RADMB) and analysis minus background (ANLMB) from July 2004 to June 2006 for a) 00Z and b) 12Z

Accepted for publication in Bulletin, American Meteorological Society. 42
a)
b)
Fig. 8 Radiosonde temperatures profiles for vertical interpolation experiments. a) Skewt logP temperature profile for site 72340, 12Z 4 January 2007, with observations given in red and interpolations to model in blue. b) Monthly averaged temperature differences for January 2006 to the nearest mandatory pressure level for vertical interpolation experiment over the CONUS. See text for explanation of symbols

Accepted for publication in Bulletin, American Meteorological Society. 43
a)
ACARS Mean Temperature Collocation and Observation Increment Differences with CONUS Sondes 00Z 250 +/- 25 hPa January 2007
-0.1
0.1
0.3
0.5
0.7
0.9
1.1
1.3
757-222
757-232
767-34AF
737-832
MD-88 767-332
757-24APF
737-3H4
MD-11F
757-251
A300F4-60
Aircraft Types
MTC
D a
nd M
TOID
in D
egre
es C
MTCD MTOID b)
ACARS Mean Temperature Collocation and Observation Increment Differences with CONUS Sondes 12Z 250 +/- 25 hPa January 2007
-0.1
0.1
0.3
0.5
0.7
0.9
1.1
1.3
757-222
757-232
767-34AF
737-832
MD-88 767-332
757-24APF
737-3H4
MD-11F
757-251
A300F4-60
Aircraft Types
MTC
D a
nd M
TOID
in D
egre
es C
MTCD MTOID Fig. 9 ACARS mean temperature collocations and observation increment differences with CONUS radiosondes 250 +/- 25 hPa during January 2007 a) 00Z and b) 12Z

Accepted for publication in Bulletin, American Meteorological Society. 44
Fig. 10 Monthly average values of analysis (AN) minus background (BG) temperature at 250 hPa during July 2007 for a) 00Z and b) 06Z

Accepted for publication in Bulletin, American Meteorological Society. 45
Fig. 11 Same as Fig. 10 but for a) 12Z and b) 18Z

Accepted for publication in Bulletin, American Meteorological Society. 46
a)
b)
Fig. 12 Radiosonde and ACARS daily average data counts on a 5x5o grid for 250 +/-25 hPa during July 2007 for 12 +/- 3Z a) radiosondes b) ACARS
Accepted for publication in Bulletin, American Meteorological Society. 47
a)
b)
Fig. 13 Radiosonde and ACARS mean temperature observation increments in tenths of degrees C on a 5x5o grid for 250 +/-25 hPa during July 2007 for 12 +/- 3Z a) radiosondes b) ACARS
Accepted for publication in Bulletin, American Meteorological Society. 48
a)
Proposed ACARS Temperature Bias Corrections January 2007
-1.4
-1.2
-1
-0.8
-0.6
-0.4
-0.2
0
0.2
0.4
0.6
757-
222
757-
223
757-
24AP
F
737-
3H4
757-
232
767-
34AF
A30
0F4-
60
737-
522
MD
-11F
737-
832
MD
-88
757-
251
A310
-203
767-
332
A310
-324
Aircraft Types
Bia
s C
orre
ctio
ns in
Deg
rees
C
SFC-700 700-500 500-300 300-150
b)
ACARS Temperature Bias Corrections January 2007 minus Same From December 2006
-1.4
-1.2
-1
-0.8
-0.6
-0.4
-0.2
0
0.2
0.4
0.6
757-
222
757-
223
757-
24APF
737-
3H4
757-
232
767-
34AF
A30
0F4-
60
737-
522
MD
-11F
737-
832
MD
-88
757-
251
A310
-203
767-
332
A310
-324
Aircraft Types
Cor
rect
ions
Diff
eren
ces
in D
egre
es C
SFC-700 700-500 500-300 300-150
Fig. 14 Proposed ACARS temperature bias corrections for aircraft types for different pressures with highest total data counts for a) January 2007 and b) difference to same for December 2006

Accepted for publication in Bulletin, American Meteorological Society. 49
a)
Proposed ACARS Temperature Bias Corrections July 2007
-1.4
-1.2
-1
-0.8
-0.6
-0.4
-0.2
0
0.2
0.4
0.6
757-
222
757-
223
757-
24AP
F
737-
3H4
757-
232
767-
34AF
A300
F4-6
0
737-
522
MD
-11F
737-
832
MD
-88
757-
251
A31
0-20
3
767-
332
A31
0-32
4
Aircraft Types
Bia
s C
orre
ctio
ns in
Deg
rees
C
SFC-700 700-500 500-300 300-150 b)
ACARS Temperature Bias Corrections January 2007 minus Same from July 2007
-1.4
-1.2
-1
-0.8
-0.6
-0.4
-0.2
0
0.2
0.4
0.6
757-
222
757-
223
757-
24AP
F
737-
3H4
757-
232
767-
34AF
A30
0F4-
60
737-
522
MD
-11F
737-
832
MD
-88
757-
251
A310
-203
767-
332
A310
-324
Aircraft Types
Cor
rect
ions
Diff
eren
ces
in D
egre
es C
SFC-700 700-500 500-300 300-150 Fig. 15 Proposed ACARS temperature bias corrections for aircraft types for different pressures with highest total data counts for a) July 2007 and b) difference to same for January 2007
Accepted for publication in Bulletin, American Meteorological Society. 50
a)
Proposed NUS-AMDAR Temperature Bias Corrections January 2007
-1.5
-1
-0.5
0
0.5
1
JP
A320
-200
737-
300
-737 AU
A319
-100 B
-
AF
-747
A321
-100 NZ
A340
-300
MD
-11F
A34
0-
Aircraft Types
Bia
s C
orre
ctio
ns in
Deg
rees
C
SFC-700 700-500 500-300 300-150
b)
NUS-AMDAR Temperature Bias Corrections January 2007 Minus Same from December 2006
-1.5
-1
-0.5
0
0.5
1
JP
A320
-200
737-
300
737-
AU
A319
-100
B-
AF
747-
A321
-100
NZ
A340
-300
MD
-11F
A340
-
Aircraft Types
Cor
rect
ion
Diff
eren
ces
in D
egre
es C
SFC-700 700-500 500-300 300-150
Fig. 16 Same as in Fig. 14 but for NUS-AMDAR data