investigation of potential trapping bias in malaise traps
TRANSCRIPT

Brigham Young University Brigham Young University
BYU ScholarsArchive BYU ScholarsArchive
Theses and Dissertations
2010-07-09
Investigation of Potential Trapping Bias in Malaise Traps Due to Investigation of Potential Trapping Bias in Malaise Traps Due to
Mesh Gauge, in Two Habitats Mesh Gauge, in Two Habitats
David Jensen Betts Brigham Young University - Provo
Follow this and additional works at: https://scholarsarchive.byu.edu/etd
Part of the Biology Commons
BYU ScholarsArchive Citation BYU ScholarsArchive Citation Betts, David Jensen, "Investigation of Potential Trapping Bias in Malaise Traps Due to Mesh Gauge, in Two Habitats" (2010). Theses and Dissertations. 2561. https://scholarsarchive.byu.edu/etd/2561
This Thesis is brought to you for free and open access by BYU ScholarsArchive. It has been accepted for inclusion in Theses and Dissertations by an authorized administrator of BYU ScholarsArchive. For more information, please contact [email protected], [email protected].
Investigation of Potential Trapping Bias of Insects in Malaise Traps
Due to Mesh Gauge, in Two Habitats
David J. Betts
A thesis submitted to the faculty of Brigham Young University
in partial fulfillment of the requirements for the degree of
Master of Science
Nikki L. Hanegan, Chair, C. Riley Nelson Russell B. Rader
Department of Biology
Brigham Young University
August 2010
Copyright © 2010 David J. Betts
All Rights Reserved
ABSTRACT
Investigation of Potential Trapping Bias of Insects in Malaise Traps
Due to Mesh Gauge, in Two Habitats
David J. Betts
Department of Biology
Master of Science
Malaise traps are a common tool for collecting insects used by many researchers.
Although there have been variations in the models and materials used for Malaise traps, the potential for sampling bias due to mesh gauge has been explored inadequately. This study compared coarse and fine mesh Townes model Malaise traps in two habitats on the Grand Staircase-Escalante National Monument. The two habitats next to the Lick Wash trailhead were defined by dominant vegetation type – sagebrush and grasses or Piñon-Juniper. We collected from three sites per habitat type, over three consecutive days in June in both 2006 and 2007. A pair of Malaise traps consisting of one coarse mesh and one fine mesh trap was used at each site in order to compare differences in the diversity and in the average size of individuals collected by each type of Malaise trap. We measured diversity using both presence-absence data such as richness scores and Jaccard’s Index of Similarity, and abundance-based measures of comparison, including Simpson’s Index of Diversity and non-metric multidimensional scaling. We identified all individuals according to Order, and because of our interest in flies and their abundance, we further identified the Diptera to the Family level. Average insect size was determined by categorizing individuals according to one of 14 distinct size-classes. In sum, 71 samples totaling approximately 62,500 insects were identified and sized. Because we sampled from two adjacent habitats, we also discuss beta diversity across the sample sites. Although mesh-size appears to have a significant effect on the diversity of the catch according to some tests, not all of our analysis agrees. In addition, the gain in the amount of diversity collected by incorporating both mesh-sizes may not be worth the costs of that kind of sampling. Other means of collection may adequately make up that difference. Habitat on the other hand was a clear marker for difference in diversity. Size was not found to be significant overall, but there still may be reasons to examine the effect of mesh-size with respect to the Hymenoptera.
Keywords: Malaise traps, sampling bias, insects, Diptera (flies), Grand Staircase-Escalante National Monument, Utah, body-size, richness, abundance, similarity indices, Simpson’s Index of Diversity, Jaccard’s Index, beta diversity

ACKNOWLEDGMENTS
My thanks first go to the members of my committee, Drs. Nikki L. Hanegan, C. Riley
Nelson, Russell B. Rader. Thank you for your knowledge in discussing the ideas of this study
and for the material support you provided in collecting and analyzing this data. Thanks also to
Utah’s Biodiversity Experiences for Students and Teachers (UBEST) Program, which was
funded by the Grand Staircase-Escalante National Monument, the Utah State Office of Education
and Brigham Young University, and its many participants who provided the opportunity and
funding to collect this data. The Charles Redd Center for Western studies also provided some
funding to help sort the collected samples.
Thanks also to Dr. Dennis L. Eggett of the Department of Statistics at Brigham Young
University for performing the statistical analysis with the SAS software.
A combination of many students provided hundreds of hours in the lab sizing and sorting
the thousands of insects that were collected for this study, including but probably not limited to:
Andrew Wilmore, Trevor Hess, Marta Dagvasuren, Sara (Morrison) Wursten, Karen Froerer,
Laura (Price) Chisholm, Roger Stimpson, Brad Mortenson, Denton Davenport, Scott Murdock,
Samuel Zmolek and of course the many UBEST participants.
Both my parents and my wife’s parents have been an unending source of support. Laura
and I will forever be in your debt for your generosity. Thanks to the rest of our families for at
least trying to understand my answer to your question of “Why bugs?”
And finally, thanks to my girls, Laura, Maggie, and Chloe, for continually giving me
something to look forward to each day and at the end of this project.

iv
Table of Contents
Table of Contents ........................................................................................................................... iv
Introduction ..................................................................................................................................... 1
Cataloging Biodiversity ............................................................................................................... 1
Mitigating Sampling Bias for More Accurate Estimates of natural populations ........................ 1
Malaise Traps: a common method of collection ......................................................................... 2
Current use ............................................................................................................................... 2
Past research with respect to sampling bias ............................................................................. 3
Research Question .......................................................................................................................... 4
Influence of Mesh-size ................................................................................................................ 4
Diversity Across Habitats ............................................................................................................ 5
Materials and methods .................................................................................................................... 5
Sampling Methods ....................................................................................................................... 5
Malaise traps ............................................................................................................................ 5
Sampling location ..................................................................................................................... 6
Habitat assessment ................................................................................................................... 6
Trapping sites ........................................................................................................................... 7
Sampling schedule .................................................................................................................... 8
Sample-bias Analysis .................................................................................................................. 8
Taxonomic diversity ................................................................................................................. 8
Insect size ................................................................................................................................. 9
Results ........................................................................................................................................... 10
Overall diversity ........................................................................................................................ 10
Richness ..................................................................................................................................... 13
Similarity comparisons .............................................................................................................. 13
v
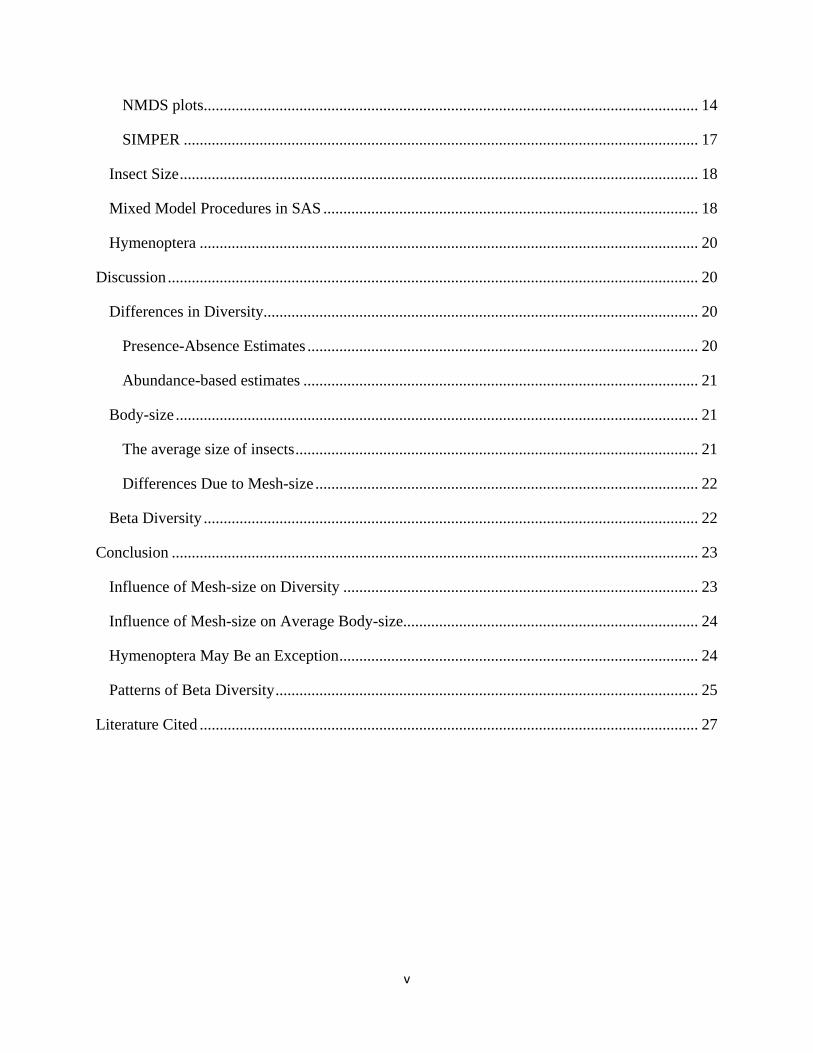
NMDS plots............................................................................................................................ 14
SIMPER ................................................................................................................................. 17
Insect Size .................................................................................................................................. 18
Mixed Model Procedures in SAS .............................................................................................. 18
Hymenoptera ............................................................................................................................. 20
Discussion ..................................................................................................................................... 20
Differences in Diversity............................................................................................................. 20
Presence-Absence Estimates .................................................................................................. 20
Abundance-based estimates ................................................................................................... 21
Body-size ................................................................................................................................... 21
The average size of insects ..................................................................................................... 21
Differences Due to Mesh-size ................................................................................................ 22
Beta Diversity ............................................................................................................................ 22
Conclusion .................................................................................................................................... 23
Influence of Mesh-size on Diversity ......................................................................................... 23
Influence of Mesh-size on Average Body-size.......................................................................... 24
Hymenoptera May Be an Exception .......................................................................................... 24
Patterns of Beta Diversity .......................................................................................................... 25
Literature Cited ............................................................................................................................. 27

1
Introduction
Cataloging Biodiversity
Part of the work of Biology is to catalogue communities and their components (Wilson
1992; Magurran 2004). Whether your concern is with conservation and preservation, taxonomy
and systematics, ecological and community relationships, or a single taxon or subset of taxa there
remains the basic need of getting an estimate of community composition.
Insects are the most abundant taxon within the animal kingdom (Wilson 1987; Dial and
Marzluff 1988; Wilson 1988; Wilson 1992) Insects play significant roles in their communities
and with respect to humanity. There are familiar negative roles as pests to humans, crops, and
livestock, or as vectors for disease. Insects also have positive characters as pollinators,
decomposers, and as significant links in the food chain(Brown 2005). From a human standpoint,
insects have also been used as bioindicators (Lenat 1988; Burgio and Sommaggio 2007), as
models in genetics and evolution (Mitchell-Olds 2001; Celniker and Rubin 2003), and multiple
other aspects of scientific research (Wigglesworth 1985; Papaj and Lewis 1992; Finlay, Thomas
et al. 2006). Inadequate sampling due to sampling bias could very well result in a
misunderstanding of not only the diversity and biogeography of insects, but perhaps humanity
may overlook other potential explanatory patterns and models (Brown 2005; Fraser, Dytham et
al. 2008).
Mitigating Sampling Bias for More Accurate Estimates of natural populations
As scientists, we also have to recognize the limitations of time and money with respect
trying to maximize efficiency of collecting. Past research has shown that with insects, more than
one method of trapping is needed in order to collect a high percentage of the available taxa

2
(Covell and Freytag 1979; Darling and Packer 1988; Brown 1995; Brown and Feener 1995;
Faulds and Crabtree 1995; Campos, Pereira et al. 2000; Suh, Spurgeon et al. 2003; Bartholomew
and Prowell 2005; Brown 2005; Holusa and Drapela 2006; Fraser, Dytham et al. 2008; Mazon
and Bordera 2008; van Hennekeler 2008; Missa 2009). These and other studies recognize that
there are limitations to each collection method, passive or active.
Regardless of the sampling method(s) used, efforts should always be made to reduce bias
in order to obtain better estimates of diversity of natural populations. Even with highly
successful trapping methods – success being measured strictly by the number of individuals
captured – it should not be assumed that every available taxon is captured or that each taxon
captured is captured proportionally to the natural population (Magurran 2004).
If a sampling bias is present, an understanding of this bias will help us to better mitigate
these limitations and increase the economy of our sampling efforts (Darling and Packer 1988;
Campos, Pereira et al. 2000).
Malaise Traps: a common method of collection
Current use
Our concern for this paper is the Malaise trap. The first model was developed by René
Malaise, a Hymenopterist, in 1934 (Malaise 1937), and the trap was well adopted into use by at
least the 1960s . By the mid 1970s, several trap designs and modifications had been made and
experimented with and some consensus has been arrived in using the Townes model (Townes
1972; Matthews and Matthews 1983). The Townes model is the model we used in this study.
The Malaise trap is used in particular for Hymenopterans (Darling and Packer 1988;
Noyes 1989; Saaksjarvi, Haataja et al. 2004; Bartholomew and Prowell 2005; Fraser, Dytham et

3
al. 2008; Mazon and Bordera 2008) and Dipterans (Cerretti, Whitmore et al. 2004; Brown 2005;
Fritzler 2006; Marinoni, Marinoni et al. 2006; Ziegler 2006; Tschorsnig, Domingo-Quero et al.
2007; Wilson 2007; Ackland 2008). Several other orders have also been listed as taxa of interest
in studies citing the use Malaise traps, including: Lepidoptera (Covell and Freytag 1979;
Tangmitcharoen, Takaso et al. 2006; Liska and Modlinger 2007; Dapporto and Strumia 2008),
Coleoptera (Cook ; Ulyshen, Hanula et al. ; Cunningham and Murray 2007; Noguera, Chemsak
et al. 2007; Abdullah, Sina et al. 2008; Linzmeier and Ribeiro-Costa 2008), Psocoptera (Read ;
Chan and Yang 2005); Hemiptera (Quednau ; Gonzon, Bartlett et al. 2006; Inoue, Goto et al.
2007), Thysanoptera (Olsen and Midtgaard 1996), and even some apparently stubborn
Collembola (Riedel, Marinoni et al. 2008).
The Malaise trap finds preference because it is a passive form of collection with minimal
maintenance (Matthews and Matthews 1971). Catches can be collected and traps refreshed easily
after periods as long as one or two weeks. Malaise traps are also popular because of the large
numbers of individuals it collects. (Brown and Feener 1995; Bartholomew and Prowell 2005)
Past research with respect to sampling bias
There has been some recognition that not all Malaise traps are equal with regards to what
they collect. Some studies have focused on the shape or model of the trap (Platt, Caldwell et al. ;
Roberts 1972; Townes 1972; Matthews and Matthews 1983), others have asked questions with
regards to materials (Darling and Packer 1988), age of materials (Roberts 1975), color (Roberts
1970; Barbosa, Henriques et al. 2005), the addition of baits (Blume, Miller et al. ; Davis, Zwick
et al. ; Roberts ; Schreck, Kline et al. 1993; Rohrig 2008), or placement (Noyes 1989; Schreck,
Kline et al. 1993; Suh, Spurgeon et al. 2003; Grimbacher and Stork 2007; Irvine and Woods
2007; Vance, Smith et al. 2007; van Hennekeler 2008). Even with the variety of studies

4
comparing Malaise trap efficiency, the term Malaise trap is most frequently generalized in the
literature regardless of the model or materials from which it is made, as evidenced by the sources
cited in this paper and as noted by others (Campos, Pereira et al. 2000).
We have found just one study besides our own that attempts to address the possible bias
due to the gauge of the mesh used to construct the trap (Darling and Packer 1988). This study
does recognize the potential influence that mesh-size may have on the diversity of insects
collected, and notes the possibility that body-size of the insects may be a part of the mechanism
influencing that outcome. Unfortunately their experimental design was based on two traps that
still differed in color. There are also other potential limitations due to the fact that Darling and
Packer used only two individual traps.
Research Question
Influence of Mesh-size
Our research question is this: Are the kinds of insects collected in a Malaise trap different
due to mesh-size? We examine this question via two means. First, is the diversity of insects
collected different according to mesh-size? Second, are the sizes of insects different according
to mesh-size? As with the Darling and Packer paper (1988), we are going to use insect body-size
as a stand-in for potential influence of mesh-size. As to what aspect of behavior, perception or
other factor is reflected by the size of insects collected per mesh-size we cannot say with this
study.
We expected that the Malaise samples would show a difference due to habitat. We
recognize that there are potential differences due to the year in which samples were collected, but
we will only briefly discuss comparisons of year to help provide context to the two main

5
variables (mesh-size and habitat) that we are most interested in. Recognizing the possibility that
some insects may be able to pass through the larger mesh-size, our expectation of a difference if
we were to find one would favor more small individuals trapped with the fine mesh.
Diversity Across Habitats
We chose to sample in two habitats in order to provide greater strength to our
comparisons of the influence of mesh-size. With the data we collected, we will also discuss
some patterns we found with respect to beta diversity.
Materials and methods
Sampling Methods
Malaise traps
Our samples were collected with standard commercially available Townes’ model
Malaise traps, purchased from www.santetraps.com. Color, age, and dimension of all the traps
were equal. The traps did differ according to the gauge of the holes in the mesh, which are listed
as “coarse mesh” and “fine mesh” by the vendor. The holes in the coarse mesh are
approximately 1.0mm in diameter (Fig. 1) while the holes in the fine mesh are between 0.3mm
and 0.5mm (Fig. 2).

6
Fig. 1 - Coarse mesh (scale = 1mm) Fig. 2 - Fine mesh (scale = 1mm)
Sampling location
Our sampling location was in the Grand Staircase-Escalante National Monument near
Kanab, Utah which is located in Southern Utah between the Zion, Bryce Canyon, and Capitol
Reef National Parks and the Grand Canyon. We sampled from the sagebrush and grass dominant
community (Flat) along Skutumpah Road at the head of Lick Wash, and within an adjacent plant
community dominated by woody plants such as Piñon Pines, Utah Junipers, and various shrubs
on the hillside (Hill) rising above the wash. Both habitats are open to grazing.
Habitat assessment
We completed vegetative surveys within 16 m2 blocks adjacent to each of the sample
sites. These surveys were done on a presence absence basis only. We were unable to identify
all of the plants in each site. Nevertheless, comparing the number and kinds of woody species
alone we were confident in the distinction between the two habitat sites. The grasses and forbs
that were positively identified only strengthen this distinction. Overall, essentially all of the
plants were indentified to the Family level, with many identified at the species level. The
overwhelming majority of plants were identified to at least the level of Genus.
7
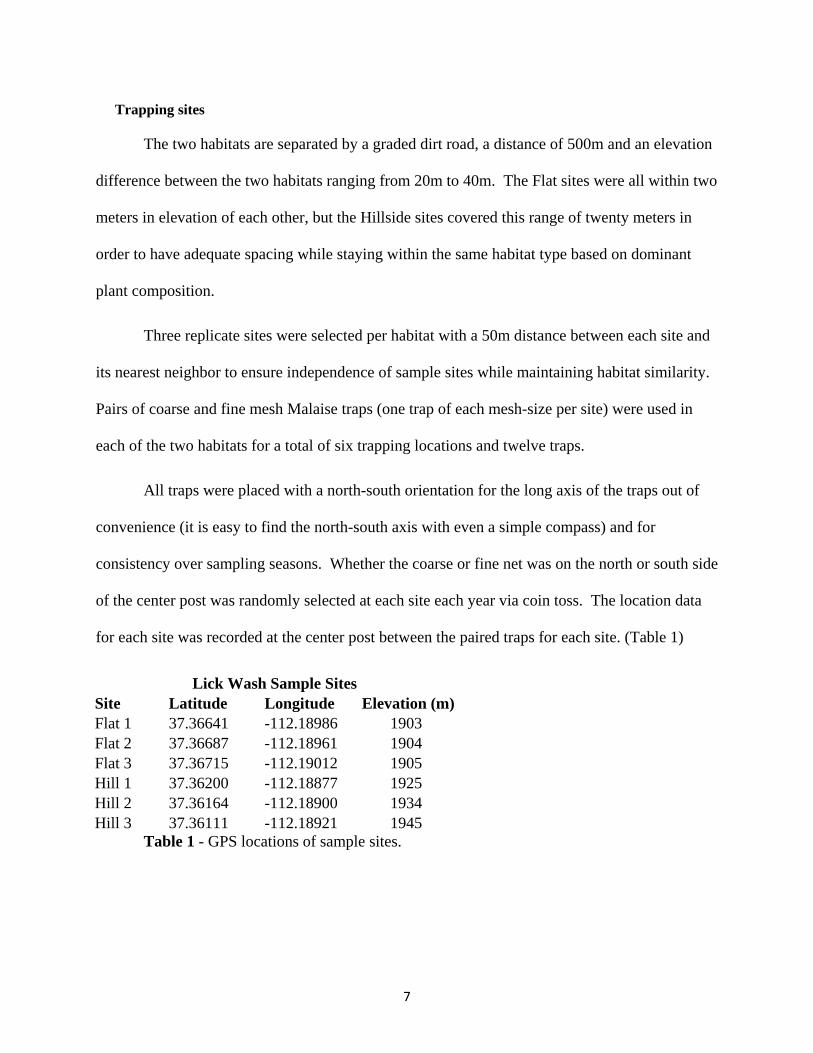
Trapping sites
The two habitats are separated by a graded dirt road, a distance of 500m and an elevation
difference between the two habitats ranging from 20m to 40m. The Flat sites were all within two
meters in elevation of each other, but the Hillside sites covered this range of twenty meters in
order to have adequate spacing while staying within the same habitat type based on dominant
plant composition.
Three replicate sites were selected per habitat with a 50m distance between each site and
its nearest neighbor to ensure independence of sample sites while maintaining habitat similarity.
Pairs of coarse and fine mesh Malaise traps (one trap of each mesh-size per site) were used in
each of the two habitats for a total of six trapping locations and twelve traps.
All traps were placed with a north-south orientation for the long axis of the traps out of
convenience (it is easy to find the north-south axis with even a simple compass) and for
consistency over sampling seasons. Whether the coarse or fine net was on the north or south side
of the center post was randomly selected at each site each year via coin toss. The location data
for each site was recorded at the center post between the paired traps for each site. (Table 1)
Lick Wash Sample Sites Site Latitude Longitude Elevation (m) Flat 1 37.36641 -112.18986 1903 Flat 2 37.36687 -112.18961 1904 Flat 3 37.36715 -112.19012 1905 Hill 1 37.36200 -112.18877 1925 Hill 2 37.36164 -112.18900 1934 Hill 3 37.36111 -112.18921 1945
Table 1 - GPS locations of sample sites.

8
Sampling schedule
Our samples were collected approximately every twenty-four hours in an attempt to
encompass a complete diurnal cycle of activity for three consecutive days in June each year. The
samples were collected on the 20th, 21st and 22nd in both 2006 and 2007. The traps were set up
and collected from by the participants in the Utah Biodiversity Experiences of Students and
Teachers (UBEST) program; by both the secondary science teachers enrolled in the program and
the instructors and students from Brigham Young University in charge of directing the UBEST
program.
Sample-bias Analysis
Taxonomic diversity
Our first means of comparing potential effects of mesh-size is to compare the diversity of
the samples collected. Trap samples have been sorted down to the Order level, including the
occasional non-insect arthropods. One trap sample is defined by the combination of day,
location, and mesh-size – e.g. 20 Jun 2006, Flat habitat, coarse mesh. Because of the abundance
of flies in the samples and our interest in this group, the Diptera were sorted to the Family level.
Similarity will be measured using both presence-absence data and similarities based on
abundance.
We used a simple richness score as our presence-absence measure per trap. To balance
out against richness, we use Simpson's Index of Diversity (1 − 𝐷; 𝐷 = ∑ 𝑛𝑖(𝑛𝑖𝑠𝑖 −1)𝑁(𝑁−1)
) as one of our
abundance measures. Richness by nature is strongly influenced by rare taxa, while Simpson's
Index is less easily swayed by these taxa. Richness and Simpson’s Index of Diversity were
compared using mixed model analysis with the SAS statistical software.
9
Bray-Curtis estimates are another abundance-based diversity measure used to compare
diversity between trap samples. Primer 6 was used to calculate the majority of these indices and
much of analyses of diversity. Within Primer 6 we performed non-metric multi-dimensional
scaling tests (NMDS), analysis of similarities (ANOSIM), and similarity percentages (SIMPER)
to test for the similarity between mesh-size (Coarse vs. Fine), habitats (Flat vs. Hill), and years
(2006 vs. 2007) in addition to trap site locations. We compared trap sites simply as a part of our
discussion on beta diversity.
In addition, we will consider pair-wise comparisons of similarity using Jaccard's Index of
similarity in order to examine the relationship between the flora and fauna of our sample sites, as
well as to discuss the nature of presence-absence versus abundance measures when discussing
diversity.
Insect size
To compare the potential for size-bias, individuals were sized using a template with
circles of various diameters. (Fig. 3) The smallest circle has a diameter of 1mm and the largest
circle has a diameter of 60mm. All individuals were placed into one of the 14 categories. Each
individual was categorized according to the smallest diameter circle within which their entire
body, including wings and legs, would fit. No individuals exceeded the largest circle. Because
the size categories were neither in strict linear increments or followed a true logarithmic scale,
our size estimates are based on the mid-point between categories.

10
Fig. 3 – Sizing sheet used for categorizing individuals (not to scale).
Average insect size per trap was compared in the same mixed model tests as richness and
Simpson’s Index of Diversity, using the SAS software. Because the traps were set up in pairs,
coarse and flat nets are not truly independent. The mixed models analysis performed modified
paired t-tests using the differences between the pairs of coarse and fine mesh traps, blocking the
samples by day (six categories), and maintaining the variable for habitat (two categories).
Results
Overall diversity
71 of the possible 72 samples were sorted according to our protocol. One sample was
lost before sorting was completed. A total of 62,497 individuals were identified and sized. The
average number of individuals per trap was 880 insects, with a range from 239 individuals to
2,382 individuals. There are 13 orders, two of which were non-insect orders (Table 2 & Fig. 4).

11
As Brown (2005) noted with his citations, Malaise traps collect mostly flies. The Diptera
clearly formed the overwhelming majority of the individuals collected (Fig. 4), with the Family
Chloropidae alone constituting more than half of all individuals collected (Fig. 5). Even with
such a high percentage of the total catch, chloropids have a range of 19 individuals to 2021
individuals per trap.
Arachnida
Araneae 22
Ixodida 53
Insecta
Coleoptera 316
Collembola 1
Diptera 50471
Hemiptera 744
Homoptera 2128
Hymenoptera 3687
Lepidoptera 4771
Neuroptera 177
Orthoptera 13
Psocoptera 8
Thysanoptera 106
Table 2 - Number of individuals per Order
Fig. 4 - Relative abundance per Order
Diptera81%
Lepidoptera 8%
Hymenoptera6%
Homoptera 3%
Hemiptera 1%
Remaining taxa1%

12
The total richness for the entire study included 55 taxa, once Diptera had been sorted to
the Family level. The seven most abundant taxa have over 92 percent of the total number of
individuals collected (Fig. 5). The remaining 48 taxa are individually less than 1% of the total
number of individuals, and 23 of those are individually less than 0.1% of the total number of
individuals collected. There were seven singletons represented by a single individual: one
collembolan and six Diptera families. All other taxa were collected from two or more samples,
with the seven most abundant taxa collected in every trap.
Fig. 5 - Relative abundance of Orders and Families
Chloropidae 56%
Cecidomyiidae 12%
Lepidoptera 8%
Dolichopodidae 6%
Hymenoptera6%
Homoptera 3%
Hemiptera 1%
Tachinidae 1%
Anthomyiidae 1%
Remaining 46 Taxa
6%
13
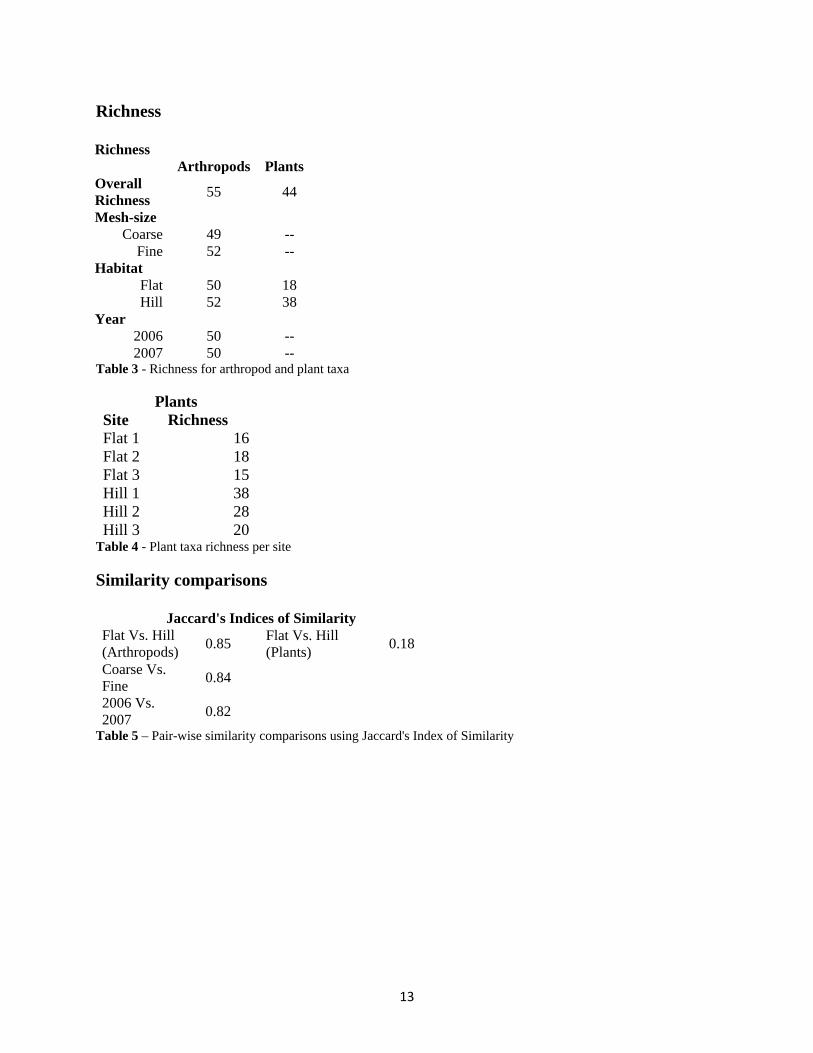
Richness
Richness
Arthropods Plants
Overall Richness 55 44
Mesh-size Coarse 49 --
Fine 52 -- Habitat
Flat 50 18 Hill 52 38
Year 2006 50 --
2007 50 -- Table 3 - Richness for arthropod and plant taxa
Plants Site Richness Flat 1 16 Flat 2 18 Flat 3 15 Hill 1 38 Hill 2 28 Hill 3 20
Table 4 - Plant taxa richness per site
Similarity comparisons
Jaccard's Indices of Similarity Flat Vs. Hill (Arthropods) 0.85
Flat Vs. Hill (Plants) 0.18
Coarse Vs. Fine 0.84 2006 Vs. 2007 0.82
Table 5 – Pair-wise similarity comparisons using Jaccard's Index of Similarity

14
NMDS plots
Fig. 6 - Similarity comparison of mesh-size (Coarse vs. Fine)
15
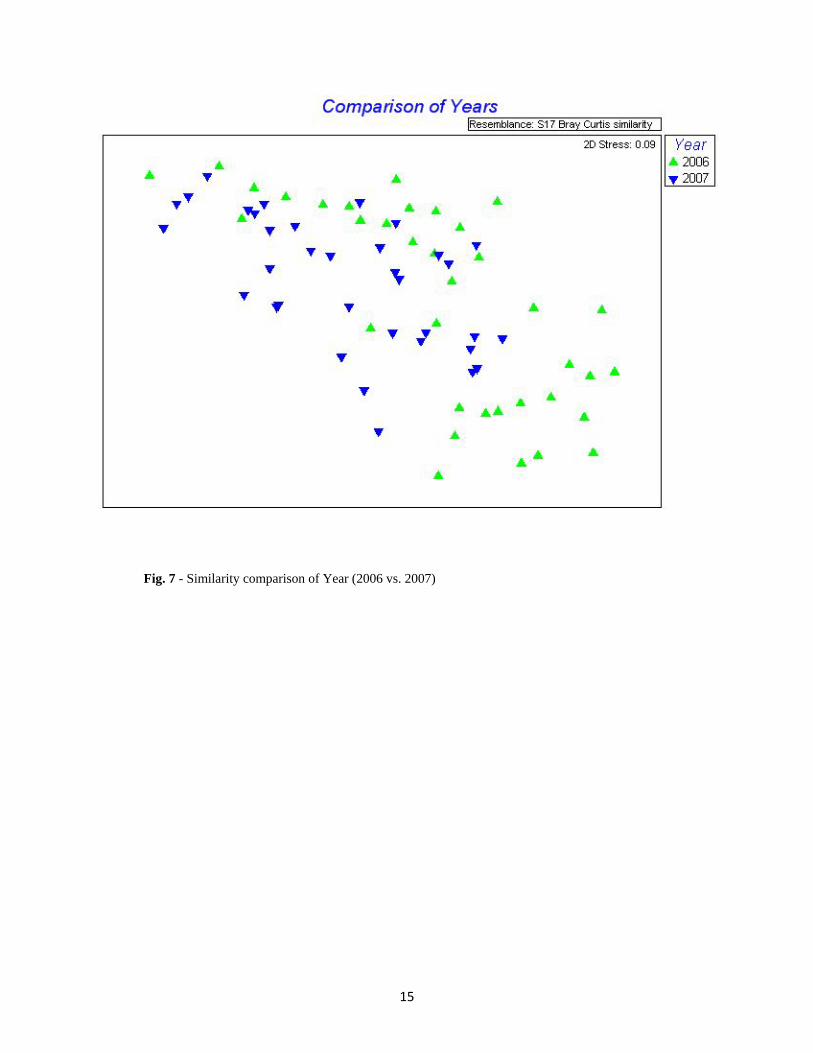
Fig. 7 - Similarity comparison of Year (2006 vs. 2007)
16
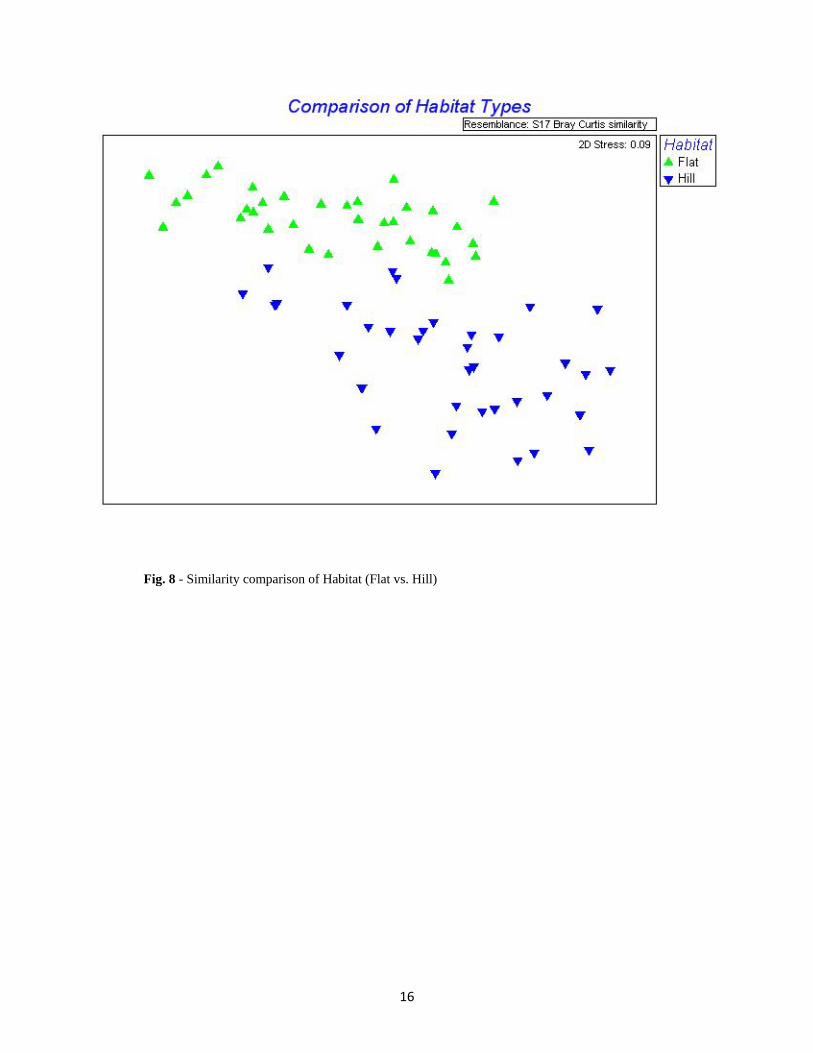
Fig. 8 - Similarity comparison of Habitat (Flat vs. Hill)

17
Fig. 9 - Similarity comparison of trap sites
ANOSIM p-values
Factor p-value Mesh-size 0.029 Year 0.004 Habitat 0.001 Trap Site 0.001
Table 6 - Corresponding p-values to the NMDS plots
SIMPER
SIMPER lists the taxa most responsible for the characterization of the trap samples, and we
compared results across each of the four factors represented in the NMDS plots (Figs. 6, 7, 8 &
9). The results of all comparisons largely followed the relative abundance of all 55 taxa (Fig. 5).
Chloropidae was nearly always the taxa responsible for the largest percentage of similarity. In

18
order to reach the 90% level of characterization using SIMPER, there was only moderate
variation away from the overall abundance levels.
Insect Size
0
5000
10000
15000
20000
25000
0.5 1.5 2.5 3.5 4.5 5.5 6.5 7.5 8.5 9.5 12.5
17.5 25 45
Fig. 10 - Insect abundance per size category. (Size in mm).
Mixed Model Procedures in SAS
Although all 71 samples were used with the analysis with the analysis using Primer 6, the
sample without a corresponding pair (Flat 1, Fine, 21 Jun 2007) was left out of the analysis using
SAS.

19
Richness
Type 3 Tests of Fixed Effects
Num Den
Effect DF DF
F Value Pr > F
Habitat 1 10 0.53 0.4814
Least Squares Means
Standard Effect Habitat Estimate Error DF t Value Pr > |t|
Habitat Flat 0.4118 0.8942 10 0.46 0.655
Habitat Hill -0.5 0.8691 10 -0.58 0.5778
Table 7 - Analysis of the effect of mesh-size on richness
Simpson's
Type 3 Tests of Fixed Effects
Num Den
Effect DF DF F Value Pr > F
Habitat 1 10 0.18 0.6783
Least Squares Means
Standard Effect Habitat Estimate Error DF t Value Pr > |t|
Habitat Flat 0.009488 0.04462 10 0.21 0.8359
Habitat Hill -0.01709 0.04336 10 -0.39 0.7018
Table 8 - Analysis of the effect of mesh-size on Simpson's Index of Diversity
Average Size
Type 3 Tests of Fixed Effects
Num Den
Effect DF DF F Value Pr > F
Habitat 1 10 2 0.1876
Least Squares Means
Standard Effect Habitat Estimate Error DF t Value Pr > |t|
Habitat Flat 0.3922 0.3386 10 1.16 0.2736
Habitat Hill 1.066 0.3351 10 3.18 0.0098
Table 9 - Analysis of the effect of mesh-size on Average body-size per trap

20
Hymenoptera
Total individuals (Hymenoptera) per mesh type
Coarse 757 Fine 2119
Individuals (Hymenoptera) per trap
Standard Standard
95.0% LCL
95.0% UCL
Variable Count Mean Deviation Error of Mean of Mean Individuals Coarse 35 21.62857 10.20405 1.7248 18.12336 25.13379 Individuals Fine 36 58.86111 29.71787 4.952978 48.80603 68.91619
Table 10 - Number of individual Hymenoptera per trap Average Size (mm) per trap - Hymenoptera
Standard Standard
95.0% LCL
95.0% UCL
Variable Count Mean Deviation Error of Mean of Mean AvgSize_Coarse 35 6.791719 2.308826 0.390263 5.99861 7.584829 AvgSize_Fine 36 4.051429 1.392027 0.232004 3.580435 4.522423
Table 11 - Average size (mm) of Hymenoptera per trap
Discussion
Differences in Diversity
Presence-Absence Estimates
The Jaccard’s Index of Similarity of 0.18 for the two plant communities (Table 5) and the
difference in richness scores across habitats (Table 3) support our initial visual assessment of
distinct habitat types. In comparison, the corresponding indices for the arthropod communities
are much more similar.
Arthropod richness is essentially equal both within and between the three variables we
listed: mesh-size, habitat, and year (Table 3). It is no surprise that the mixed model analysis
gave no evidence of a difference in richness due to mesh-size; p-value = 0.48 (Table 7). The
Jaccard’s Indices for these same variables also show a high degree of similarity, with all three

21
indices between 0.82 and 0.85 (Table 5). From a presence-absence standpoint, the arthropod
communities across each variable are highly similar.
Abundance-based estimates
When we examine abundance on an per trap basis, the mixed model analysis of
Simpson’s Index of Similarity gives no evidence that there is a difference due to mesh-size; p-
value = 0.68 (Table 8). With both the Simpson’s Index and with richness, these scores are
calculated with no reference to the other samples or groups of samples. Two samples could have
equal richness scores or Simpson’s Indices, while being comprised of entirely different taxa. In
order to compare abundance-based diversity relative to other samples we used the tools in
Primer 6.
The Stress value of 0.09 for the NMDS plots (Figs. 6, 7, 8 & 9) gives evidence that much
of the diversity of the insects we collected is well represented by the two-dimensional plots. The
ANOSIM p-values of all the variables displayed with the NMDS plots are significant (Table 6).
Including abundance levels that have relationships across samples has modified our view of what
is similar. There is a statistically discernable difference due to these variables.
Body-size
The average size of insects
On a purely individual basis, insects are small (Fig. 10). Overall more taxa were at the
smaller end of the size scale on average and the most abundant taxa were prominently
categorized in these lower size-classes.
One size-class pattern that may not be easily apparent due to the scale of the graph is a
second concentration of individuals around the size class of 12.5mm. The most abundant Orders

22
besides Diptera (Lepidoptera and Hymenoptera) (Fig. 4) had many individuals in these upper
size-classes. In addition, several fly families, but especially the calypterate flies which had some
of the more abundant taxa (Tachinidae, Anthomyiidae, Muscidae, etc.) (Fig. 5) also had size
distributions that more closely centered near the 12.5mm size class. While most of the insects
we sampled are small, there appears to be a second mode of size distribution close to 12.5mm.
Differences Due to Mesh-size
The mixed model analysis in SAS was our only means of comparing the effect of mesh-
size on the diversity of body-size. Although the individual t-tests give some support that body-
size is influenced by mesh-size, overall we do not have enough evidence (p-value = 0.19) to
conclude that mesh-size affects the average size of insect collected per trap (Table 9).
Beta Diversity
Both the data comparing plant communities (Tables 3, 4 & 5) and the data comparing
arthropod communities (Figs. 8 & 9) show how easily beta diversity can change over a short
distance. As noted earlier, our habitats were 500m apart and immediately adjacent.
While our intent was to sample from two distinct habitats, the NMDS plot based on
sample site location (Fig. 9) provides strong evidence that the Hill habitat was not homogenous.
The groupings of the samples from the Flat sites in this figure are indistinguishable, while the
proximity of the sites in the Hill habitat to the Flat habitat is reflected by the groupings in the
NMDS plot. Differences in elevation correlate with this same plot. The lowest sample sites
from an effectively equal elevation group together. The remaining samples sites fall in line in
the plot according to increasing elevation.

23
The data with respect to the plant community also reflects this pattern of proximity to the
Flat habitat. The richness scores of each sample site should be noted (Table 4). The plant
richness scores from the Flat sites show a strong sense of equality, while the highest richness
score of the Hill sites is found in the site nearest the Flat habitat and the remaining scores
decrease with the corresponding increase in distance from the Flat habitat. We suggest that some
of this heterogeneity of the Hill habitat is due to an intermediate zone between the plants at the
lowest elevation of our study and the highest elevation. For example, the presence of sagebrush
(Artemesia tridentata) decreased according to elevation. Site Hill 1 was placed within the first
grouping of Piñons and Junipers where much sagebrush was still present, while site Hill 3 was
entirely devoid of sagebrush and Hill 2 was at some intermediate level. We do not have specific
abundance data for the plants, but perhaps the high richness score of site Hill 1 is due to the
overlapping of two plant communities.
Conclusion
Influence of Mesh-size on Diversity
The main purpose of this study was to determine the influence of mesh-size on sampling
bias, because of the potential influence on experimental design. We found evidence that mesh-
size influences the diversity of the overall sample of insects collected, although not all forms of
our analysis agreed (Tables 3 & 4 as compared to Figs. 6, 7 & 8). The corresponding ANOSIM
p-value to the NMDS plot comparing mesh-size (Fig. 6) gives evidence that the insect diversity
collected by the two mesh types are not the same. The large overlap with respect to diversity as
present in the NMDS plot is perhaps evidence enough that although the differences in diversity
are statistically significant, these differences may not be biologically significant. It should be

24
recognized that our sampling periods were limited to three days each summer and that we
sampled a total of six sites. Accounting for the differences we found in future sampling efforts
may be too labor intensive for the small gains that would be achieved with a detailed
experimental design with respect to mesh-size. The same may be said with respect to the
differences due to year. The differences we found in the diversity of our samples might be
overcome at a lower cost with more traps, the combination of other trapping methods, an
extended trapping season, or any combination of those or other variables.
Influence of Mesh-size on Average Body-size
We found no evidence to support the hypothesis that mesh-size influences the average
body-size of insects collected overall. The results from the mixed model analysis give evidence
that perhaps we might find a true difference if we could increase the power of our test (Table 9),
but again that kind of study is most likely not worth the effort to find a difference that might not
be biologically significant. The estimated average differences in body-size were 1.1mm for the
Hill habitat and 0.39mm for the Flat habitat. For insects as a whole, the meaning of those
differences still needs to be explored.
Hymenoptera May Be an Exception
There is one caveat to these assessments of the influence of mesh-size – the
Hymenoptera. Hymenoptera are the one Order of insects that is probably of interest to those
who use Malaise traps as often as or more often than the Diptera. Our analysis was with regard
to overall diversity and average body-size across all taxa collected; Diptera being the largest
portion. Knowing that Hymenopterists would be the next most likely group interested in this
study, we compared the sampling patterns of the Hymenoptera alone.

25
The data collected do not meet the requirements of a t-test, but the descriptive statistics
we include in Tables 10 and 11 do provide some evidence that further examination of our data
may be warranted. First of all, the fine mesh Malaise traps collected a total of 2119 individuals
(excluding the Formicidae); while the coarse mesh Malaise traps collected only 757 individuals
(excluding the Formicidae). The means and their confidence intervals for the number of
individuals captured per trap (Table 10), and the average body-size per trap (Table 11) do not
overlap. The fine mesh Malaise traps not only collected more individuals of all categories, but
collected insects belonging to higher size categories that were not collected by the coarse mesh
Malaise traps. These results agree with the results from Darling and Packer that the fine mesh
may be more effective than the coarse mesh at collecting the smaller Hymenoptera (1988).
Again, this data has not been properly analyzed, but we think that there is sufficient
evidence for those interested in this taxon to take a closer look. Likewise, for those interested in
collecting small taxa, e.g. parasitic wasps, or for those who are trying to reduce their work load
by excluding smaller taxa, there may be undiscovered valid reasons to consider the mesh-size of
the Malaise traps you use.
Patterns of Beta Diversity
As biologists, we want to find what is different. Differences within the context of
overarching relationships and similarities are the keys to discovery of pattern and process. To
continue the advancement of our biological understanding, being able to predict where
differences are found would improve the way we study Biology. We could better diversify and
standardize our sampling. We would more closely understand where to look for the next
unknown species, population, community, etc.

26
In this study we see a change in diversity at some level across all variables. With only
500m between sites, we do not have to go far to find different plant communities. In an even
shorter distance within the Hill habitat, we can see further evidence of changes in beta diversity
when we use the abundance data for the arthropods. Even our limited scope in time of three days
per year displays how differences can be found (Fig. 7).
In addition, this same design and locality was used in the summer of 2005, but that data
was not included in this analysis because several samples were lost in the intervening time
between collection and identification. In 2005 sampling was done during the first week, rather
than the third week of June. With preliminary identification, community composition already
appeared to be different from the 2006 and 2007 data. In 2006 and 2007, we did not catch a
single individual from the family Tipulidae. With our incomplete sorting of the 2005 data, we
have found nearly ten tipulids per sample. Time also appears to provide a broad opportunity for
collecting new levels of diversity.
As researchers we should recognize that when concerned with plants or insects, we may
not have to go far geographically in order to find different communities. We should also
consider that to discover the composition of a community, our sampling seasons should match
the natural community cycles. Our brief sampling does not define the boundaries of these
seasons, but does support how much can change over a short period of time.

27
Literature Cited
Abdullah, F., I. Sina, et al. (2008). "The ground beetle fauna (Coleoptera: Carabidae) of Kenyir water catchment, Terengganu, Peninsular Malaysia." Pakistan Journal of Biological Sciences
Ackland, D. M. (2008). "Diptera Stelviana. A dipterological perspective on a changing Alpine landscape: results from a survey of the biodiversity of Diptera (Insecta) in the Stilfserjoch National Park (Italy). Volume 1: 4.3.04 Anthomyiidae."
11(21): 2478-2483.
Studia Dipterologica Supplement
Barbosa, M. G. V., A. L. Henriques, et al. (2005). "Species diversity and similarity between sites in Tabanidae (Insecta: Diptera) of a terra firme forest (Adolpho Ducke Reserve) in Central Amazonia, Brazil."
16: 107-116.
AmazonianaBartholomew, C. S. and D. Prowell (2005). "Pan compared to malaise trapping for bees
(Hymenoptera: Apoidea) in a longleaf pine savanna."
18(3-4): 251-266.
Journal of the Kansas Entomological Society
Blume, R. R., J. A. Miller, et al. "Trapping tabanids with modified malaise traps baited with CO2."
78(4): 390-392.
Mosquito NewsBrown, B. (1995).
(1): 90. Phorid flies, malaise traps, and pan traps: Collections in a tropical biodiversity
surveyBrown, B. V. (2005). "Malaise trap catches and the crisis in Neotropical dipterology."
. American
EntomologistBrown, B. V. and D. H. J. Feener (1995). "Efficiency of Two Mass Sampling Methods for
Sampling Phorid Flies (Diptera: Phoridae) in a Tropical Biodiversity Survey."
51(3): 180-183.
Contributions in ScienceBurgio, G. and D. Sommaggio (2007). "Syrphids as landscape bioindicators in Italian
agroecosystems."
(459): 1-10.
Agriculture, Ecosystems & EnvironmentCampos, W. G., D. B. S. Pereira, et al. (2000). "Comparison of the efficiency of flight-
interception trap models for sampling Hymenoptera and other insects. ."
120(2-4): 416-422.
An. Soc. Entomol. Bras.
Celniker, S. E. and G. M. Rubin (2003). "The Drosophila melanogaster genome." 29(3): 381-389.
Annual Review of Genomics and Human Genetics
Cerretti, P., D. Whitmore, et al. (2004). "Survey on the spatio-temporal distribution of tachinid flies - using Malaise traps (Diptera, Tachinidae)." 229-256.
4: 89-117.
Chan, M. L. and J. T. Yang (2005). Psocoptera Survey by Using Malaise Trap in Central Taiwan
Cook, S. P. "Beetle (Coleoptera) diversity in mixed pine-hardwood stands in the Ouachita highlands five years following tree harvests."
.
Southwestern entomologistCovell, C. V., Jr. and P. H. Freytag (1979). "The malaise trap as a means of sampling butterfly
populations in Kentucky."
27(3/4): 269.
Journal of the Lepidopterists' SocietyCunningham, S. A. and W. Murray (2007). "Average body length of arboreal and aerial beetle
(Coleoptera) assemblages from remnant and plantation Eucalyptus forests in southwestern Australia."
33(3): 153-161.
OecologiaDapporto, L. and F. Strumia (2008). "A rapid assessment of Lepidoptera biogeography in the
Tuscan Archipelago using economical Malaise traps."
151(2): 303.
Italian Journal of Zoology (Modena) 75(2): 219-224.

28
Darling, D. C. and L. Packer (1988). "Effectiveness of Malaise traps in collecting Hymenoptera: the influence of trap design, mesh size, and location." Canadian entomologist
Davis, H. G., R. W. Zwick, et al. "Perimeter traps baited with synthetic lures for suppression of yellowjackets in fruit orchards."
120(8/9): 787-796.
Environmental entomologyDial, K. P. and J. M. Marzluff (1988). "Are the Smallest Organisms the Most Diverse?"
2(4): 569. Ecology
Faulds, W. and R. Crabtree (1995). "A system for using a Malaise trap in the forest canopy."
69(5): 1620-1624.
New Zealand EntomologistFinlay, B. J., J. A. Thomas, et al. (2006). "Self-similar patterns of nature: insect diversity at local
to global scales."
18: 97-99.
Proceedings of the Royal Society B. Biological sciencesFraser, S. E. M., C. Dytham, et al. (2008). "The effectiveness and optimal use of Malaise traps
for monitoring parasitoid wasps."
273: 1935.
Insect Conservation and DiversityFritzler, C. J. (2006). "Diversity of Syrphidae (Diptera) in central Appalachian
forests."
1: 22-31.
Proceedings of the Entomological Society of WashingtonGonzon, A. T., C. R. Bartlett, et al. (2006). "Planthopper (Hemiptera: Fulgoroidea) Diversity in
the Great Smokey Mountains National Park."
108(4): 964-976.
Transactions of the American Etnomological Society
Grimbacher, P. S. and N. E. Stork (2007). "Vertical stratification of feeding guilds and body size in beetle assemblages from an Australian tropical rainforest."
132(3/4): 243-260.
Austral Ecology
Holusa, J. and K. Drapela (2006). "Yellow sticky boards: a possible way of monitoring little spruce sawfly (Pristiphora abietina) (Hymenoptera: Tenthredinidae)."
32(1): 77-85.
Journal of Forest Science
Inoue, T., H. Goto, et al. (2007). "Cicadas (Hemiptera: Cicadidae) collected with Malaise traps set in natural forests and plantations in the northeastern part of Ibaraki Prefecture."
52(1): 13-21.
Shinrin Sogo Kenkyujo Kenkyu HokokuIrvine, K. M. and S. A. Woods (2007). "Evaluating shading bias in Malaise and window-pane
traps."
6(4): 249-252.
J. Acad. Entomol. Soc.Lenat, D. R. (1988). "Water Quality Assessment of Streams Using a Qualitative Collection
Method for Benthic Macroinvertebrates."
3: 38-48.
Journal of the North American Benthological Society
Linzmeier, A. M. and C. S. Ribeiro-Costa (2008). "Seasonality and temporal structuration of Alticini community (Coleoptera, Chrysomelidae, Galerucinae) in the Araucaria Forest of Parana, Brazil."
7(3): 222-233.
Revista Brasileira de Entomologia [Rev. Bras. Entomol.]. Vol. 52
Liska, J. and R. Modlinger (2007). "Investigation of lepidopteran fauna (Insecta, Lepidoptera) of montane spruce forest in the massive of Trojmezna Mt. in the Bohemian forest."
52(2): 289-295.
Silva Gabreta
Magurran, A. E. (2004). 13(1): 57-64.
Measuring Biological DiversityMalaise, R. (1937). "A new insect trap."
. Malden, MA, Blackwell Publishing. Entomologisk Tidskrift
Marinoni, L., R. C. Marinoni, et al. (2006). "Most abundant species of Syrphidae (Diptera) collected during two years with Malaise traps in Parani, Brazil."
58: 148-160.
Revista Brasileira de Zoologia
Matthews, R. W. and J. R. Matthews (1971). "The Malaise trap: its utility and potential for sampling insect populations."
23(4): 1071-1077.
Michigan Entomologist 4(4): 117-122.

29
Matthews, R. W. and J. R. Matthews (1983). "Malaise traps: the Townes Model catches more insects." Contributions of the American Entomological Institute
Mazon, M. and S. Bordera (2008). "Effectiveness of two sampling methods used for collecting Ichneumonidae (Hymenoptera) in the Cabaneros National Park (Spain)."
: 428.
European Journal of Entomology
Missa, O. (2009). "Monitoring arthropods in a tropical landscape: relative effects of sampling methods and habitat types on trap catches [electronic resource]."
105(5): 879-888.
Journal of insect conservation
Mitchell-Olds, T. (2001). "Arabidopsis thaliana and its wild relatives: a model system for ecology and evolution."
13(1): 103-118.
Trends in Ecology & EvolutionNoguera, F. A., J. A. Chemsak, et al. (2007). "A faunal study of Cerambycidae (Coleoptera)
from one region with tropical dry forest in Mexico: San Buenaventura, Jalisco."
16(12): 693-700.
Pan-Pacific Entomologist
Noyes, J. S. (1989). "A study of five methods of sampling Hymenoptera (Insecta) in a tropical rainforest, with special reference to the Parasitica."
83(4): 296-314.
Journal of Natural History
Olsen, A. J. and F. Midtgaard (1996). "Malaise trap collections of thrips from the islands Haoya and Ostoya in Oslofjorden, South Norway."
23(2): 285 - 298.
Norwegian J. Entomol.Papaj, D. R. and A. C. Lewis (1992).
43: 63-68. Insect Learning: Ecological and Evolutionary Perspectives
Platt, J., J. S. Caldwell, et al. "An easily replicated, inexpensive malaise-type trap design."
, Springer.
Journal of entomological scienceQuednau, F. W. "A survey of aphid fauna (Homoptera: Aphididae) in Quebec hardwood forest
stands by means of Malaise trap catches."
34(1): 154.
Rapport d'information LAU-X - Laurentian Forest Research Centre
Read, R. W. J. "Psocoptera activity as monitored by a Malaise trap." (67).
Entomologists' monthly magazine
Riedel, R., R. C. Marinoni, et al. (2008). "Spatio-temporal trends of insect communities in southern Brazil."
114(pub. 1979): 94.
Journal of EntomologyRoberts, R. H. "Tabanidae collected in a Malaise trap baited with CO2."
5(6): 369-380. Mosquito News
Roberts, R. H. (1970). "Color of Malaise trap and the collection of Tabanidae." (1): 52.
Mosquito News
Roberts, R. H. (1972). "The effectiveness of several types of Malaise traps for the collection of Tabanidae and Culicidae."
30(4): 567-571.
Mosquito NewsRoberts, R. H. (1975). "Influence of trap screen age on collections of tabanids in -Malaise
traps."
(4): 542.
Mosquito newsRohrig, E. (2008). "Comparison of Parasitic Hymenoptera Captured in Malaise Traps Baited
with two Flowering Plants, Lobularia maritima (Brassicales: Brassicaceae) and Spermacoce verticillata (Gentianales: Rubiaceae) [electronic resource]."
(4): 538.
Florida entomologist
Saaksjarvi, I. E., S. Haataja, et al. (2004). "High local species richness of parasitic wasps (Hymenoptera: Ichneumonidae: Pimplinae and Rhyssinae) from the lowland rainforests of Peruvian Amazonia."
91(4): 621-627.
Ecological entomologySchreck, C. E., D. L. Kline, et al. (1993). "Field evaluations in malaise and canopy traps of
selected targets as attractants for tabanid species (Diptera: Tabanidae)."
29: 735.
Journal Of The American Mosquito Control Association 9(2): 182.

30
Suh, C. P. C., D. W. Spurgeon, et al. (2003). "Evaluation of sticky traps for monitoring cotton fleahopper movement into cotton." Proceedings Beltwide Cotton Conferences
Tangmitcharoen, S., T. Takaso, et al. (2006). "Insect biodiversity in flowering teak (Tectona grandis L.f.) canopies: comparison of wild and plantation stands."
2003: 1444-1447.
Forest Ecology and Management
Townes, H. (1972). "A light-weight Malaise trap." 222(1-3): 99-107.
Entomological NewsTschorsnig, H. P., T. Domingo-Quero, et al. (2007). "Tachinidae (Diptera) from the Caldera de
Taburiente National Park, La Palma (Canary Islands)."
83(9): 239-247.
GraellsiaUlyshen, M. D., J. L. Hanula, et al. "Using Malaise traps to sample ground beetles (Coleoptera:
Carabidae)."
63(1): 43-51.
Canadian entomologistvan Hennekeler, K. (2008). "A comparison of trapping methods for Tabanidae (Diptera) in North
Queensland, Australia."
137: 251.
Medical And Veterinary EntomologyVance, C. C., S. M. Smith, et al. (2007). "Differences Between Forest Type and Vertical Strata in
the Diversity and Composition of Hymenpteran Families and Mymarid Genera in Northeastern Temperate Forests."
22(1): 26-31.
Environmental Entomology [Environ. Entomol.]. Vol. 36
Wigglesworth, V. B. (1985). 36(5): 1073-1083.
Insect PhysiologyWilson, E. O. (1987). "The Little Things That Run the World (The Importance and Conservation
of Invertebrates)."
, Springer.
Conservation BiologyWilson, E. O. (1988). The Current State of Biodiversity.
1(4): 344-346. Biodiversity
Wilson, E. O. (1992).
. E. O. Wilson and F. M. Peter. Washington, National Academy Press. vol. 1: 3-18.
The Diversity of LifeWilson, R. D. (2007). "Altitudinally restricted communities of Schizophoran flies in
Queensland's Wet Tropics: vulnerability to climate change [electronic resource]."
. New York, W.W. Norton & Co.
Biodiversity and conservationZiegler, J. (2006). "The "Diptera stelviana" project. A dipterological perspective on a changing
alpine landscape."
16(11): 3163-3177.
Studia Dipterologica
13(2): 195-202.