investigation of morphology and … investigation of morphology and impurity of nuclear grade...
TRANSCRIPT

1
INVESTIGATION OF MORPHOLOGY AND IMPURITY OF
NUCLEAR GRADE GRAPHITE, AND LEACHING MECHANISM OF CARBON-14
�
��
�
R. TAKAHASHI, M. TOYAHARA, S. MARUKI, H. UEDA, Toshiba Corporation, Kawasaki, Japan T. YAMAMOTO
The Japan Atomic Power Company, Tokyo, Japan �
Abstract. Leaching of 14C from irradiated graphite waste seems to depend on its morphology. We have investigated morphology and impurities of nuclear-grade graphite in order to reveal the leaching mechanism of 14C.
Observation of SEM photograph revealed that planar graphite sheets existed everywhere in the graphite, thus indicating that graphite blocks contained many single-crystal grains. The degree of graphitization for a nuclear-grade graphite sample was obtained by using powder X-ray diffraction method and estimated to be 0.85. The value was large compared with that of artificial graphite, 0.9. It should be noted that the crystalline quality of nuclear-grade graphite is good.
In order to estimate the 14C concentration of nuclear-grade graphite with neutron bombardment, 14N content in nuclear-grade graphite was identified by measuring thermal conductivity of produced gas accompanying melting a graphite sample in tin alloy at 2800oC. Also, the sample was prior heated at 400oC, and then the total amount of nitrogen was measured by the same method to estimate nitrogen absorbed on the surface of the graphite block sample. Further, by SIMS analysis 26CN- depth profile in graphite block was obtained in order to determine the distribution of nitrogen.
Overall nitrogen content of graphite block, 40 ƒÊg g-1, is consistent with the nitrogen concentration obtained by calculation of neutron activation using 14C content in irradiated graphite. The results of SIMS analysis indicated that nitrogen content was rather large on the surface.
Taking into account the leaching data of 14C and distribution of nitrogen, it was suggested that the bulk of 14C activity remained in graphite matrix which was quite stable and that only 14C localized on the surface of the irradiated graphite was released.
�
1. INTRODUCTION
The graphite-moderated reactor operated by the Japan Atomic Power Company stores about
1.6 �106 kg of irradiated graphite. This plant is to be dismantled, and so the large amount of
graphite waste will be generated. The graphite contains a large amount of 14C. Thus, it is essential to estimate carefully what would be the public exposure after waste disposal by landfill. Therefore, studies have been undertaken in order to acquire an understanding of 14C leaching from graphite and the optimum treatment method for 14C, and thus provide a basis for estimation of the release ratio for use in disposal safety assessment. � A leaching test of irradiated graphite has been conducted and, based on the results obtained, it was reported that only a little amount of 14C was released into the leachant and that the leaching ratio of 14C was about 10-5 for 720 days as shown in Table I. Further, even in the case of the leaching in H2SO4/KMnO4 solution, which is used to accelerate its leaching, over 90% of 14C activities remained in graphite.
The graphite used in the reactor operated by the Japan Atomic Power Company, Tokai, was manufactured by Pechiney SA in France, and the manufacturing method was not well defined. However, several reports concerning the graphite of Pechiney are available. [1-5] Pechiney products are prepared by baking a paste made of oil coke and pitch, and graphitized by electrical heating. Although little is known concerning the microstructure of nuclear-grade

2
graphite, its raw materials include large amounts of aromatic compounds which seem to form the components with graphite structure by graphitizing at high temperature. The radioactive release from graphite depends on its crystalline forms. Usually, the hexagonal-graphite is thermodynamically stable, because it has planar hexagonal nets of carbon atoms. [1, 6] On the other hand, 14C is continuously being formed by 14N(n.p)14C reaction with thermal neutron and predominantly originates in 14N. Nuclear-grade graphite block is made from good quality crystalline graphite and amorphous carbon, and seems to have various structural matrices. Thus, study of its structure may provide the key to an understanding of the release of 14C.
TABLE I. LEACHING TEST PARAMETERS OF CARBON-14 FROM MODERATOR IN TOKAI PLANT IN ALKALINE SOLUTION FOR 720 DAYS
Lot No. Arel /Bq 1)� Ared/Bq
2)� Aova /Bq3)� Leaching ratio
4)�
TM-D06-71 18.4 2.72 × 10⁵� 2.72 × 10
5� 6.78 × 10⁻⁵�
TM-D06-74 17.4 2.65 × 10⁵� 2.65 × 10
5� 6.56 × 10⁻⁵�
TM-D06-75 2.0 2.67 × 10⁵� 2.67 × 10
5� 7.50 × 10⁻⁶�
TM-D08-65 17.3 2.70 × 10⁵� 2.70 × 10
5� 6.41 × 10⁻⁵�
TM-D010-51 10.7 2.19 × 10⁵� 2.19 × 10
5� 4.89 × 10⁻⁵�
TM-D010-44 1.8 2.13 × 10⁵� 2.13 × 10
5� 8.49 × 10⁻⁶�
Amount of 14C released into leachant, 2) Amount of residual 14C in graphite sample after leaching test, 3) Amount of overall 14C content in graphite sample before leaching test, 4) Leaching ratio is calculated by Arel/Aova.
�
It has been reported that leaching ratio of 14C is about 10-5�� 10-4 and noted that those
numerical values are small compared to 14C inventory [7-10]. When the formed 14C displaces a carbon atom in a graphite lattice position or penetrates into a sequence of stacking of layers in the crystal, it is considered that hardly any 14C is released out of graphite crystalline matrices.
These assumptions motivated us to study not only the structure of nuclear-grade graphite but also the amount and distribution of nitrogen in it. One goal of this study is the theoretical deduction of the numerical values of the leaching rate for the release of 14C from the irradiated graphite waste.
We examined morphology and microstructure of nuclear-grade graphite with a scanning electron microscope(SEM) and powder X-ray diffraction. Also, investigation of impurities included in nuclear-grade-graphite was performed, focusing on nitrogen content and distribution of nitrogen in a graphite sample block.
In this paper, we report morphology and distribution of nitrogen in nuclear-grade graphite and estimate the depth from which 14C is released from graphite.
2. EXPERIMENTAL
2.1. Graphite Sample
The nuclear-grade graphite block which was not irradiated was supplied by the Japan Atomic Power Company. Firstly, thickness of ca. 5 mm on the graphite block surface was cut away to remove its contamination. The block samples were prepared by cutting them using ceramic cutter. For powder sample, three kinds of particle size were prepared by crushing and grinding the graphite block into powder. They ranged in particle size from 100 to 500 ƒÊm, 50 to 100 ƒÊm, and less than 50 ƒÊm, respectively. �
3
2.2. Observation of surface and measurement of degree of graphitization for nuclear-grade graphite
We examined morphology, microstructure and degree of graphitization for the nuclear-grade
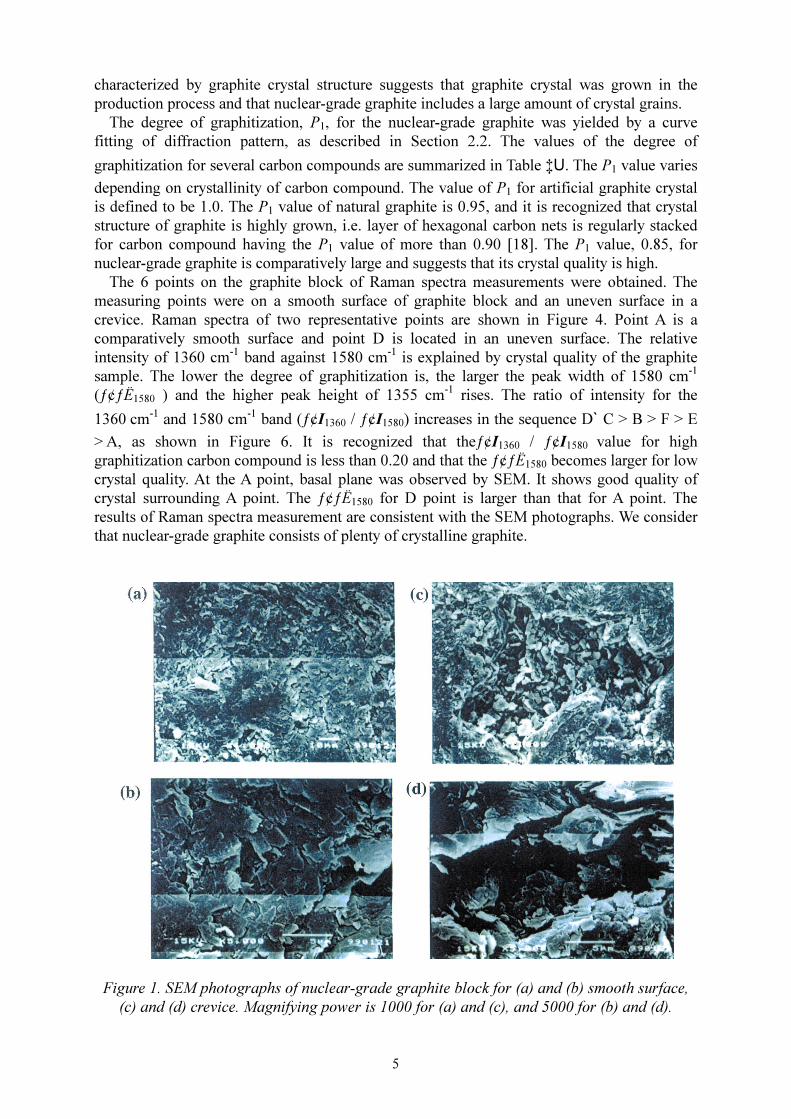
graphite with a scanning electron microscope(SEM) and powder X-ray diffraction [11, 12]. The crystallinity of powder graphite was analyzed by X-ray diffraction. The degree of
graphitization is evaluated by fitting a smooth curve to observed intensity I (2Į) of (h,k) diffraction pattern as follows:
�
I(2ƒÆ)=KmF2(1+cos22ƒÆ)/4sinƒÆ(sin2ƒÆ-sin2ƒÆ0)1/2ƒ°An(hk)cos(2ƒÎnh3) eq. 1
h3=(sin2Į-sin2Į0)1/2Co/ă eq.2
where An is the Fourier coefficient, K is the constant, m is the multiplicity, F is the structural factor, n is the number of the sheets of hexagonal carbon net, C0 is the lattice constant of c
axis(6.708 �10-10 m), ƒÉ is the X-ray wave length(CuKƒ¿ 1.5406�10-10 m), and ƒÆ0 is the
degree of diffraction angle of (hk0) plane. The h3 denotes the periodic function. The probability of observing two neighboring hexagonal carbon nets in graphite structure is
calculated as follows:
�
P1 = -2¥A1(10) =A1(11) eq. 3
�
2.3 Raman spectra measurement
The crystallinity of the graphite block sample was also examined by Raman spectra measurement. The points of measurement were arbitrarily decided with an optical microscope. Raman spectra of the C=C stretching modes of graphite in 1580 cm-1 [13] and a band in 1350 cm-1 assigned to distortion caused by lattice defect [14-17] were measured. Raman spectra measurement was recorded with a Ramaonor T-64000 and NEC GLG3460 argon ion laser (ă= 514.5 nm, power was 10 mW).
�
2.4. Measurements of specific surface area
For four kinds of samples, i.e. one block and three kinds of nuclear-grade-graphite powder, the isothermic curves of adsorption for nitrogen gas were measured at 77 K. Previously, samples were degassed at 150oC in vacuum. The isothermic curves were recorded with a BELSORP 36. Specific surface area was obtained by optimizing the curves with BET adsorption isotherm.
�
2.5. Measurement of density
For the block sample, bulk and net density were measured. Bulk density was determined with its weight and volume. True density estimated by excluding the opening in graphite was obtained by measureing net volume of the block sample. The block sample of volume Vsamp was placed in a cell of volume Vcell. Pressure in the cell including sample was controlled at Pcell, and then the cell was connected to another one of volume Vexp. When pressure in the cell connected to another one is allowed to equal Pexp, Vsamp is calculated using Boyle-Charles’ law as follows;
4
Vsamp = Vcell – Vexp(Pcell/Pexp – 1) eq. 4 Helium (purity > 0.99999) was used for measurement of net density. The weight of graphite was corrected by measuring buoyancy in air. 2.6. Measurement of overall nitrogen content in graphite
In order to estimate the 14C concentration of the nuclear-grade graphite with neutron
bombardment, 14N concentration was identified by measuring thermal conductivity of produced gas after melting nuclear-grade graphite samples with tin alloy at 2800oC. Also, the sample was prior heated at 400oC, and then the total amount of nitrogen was measured by the same method to estimate nitrogen absorbed on the surface of the graphite block. The measurement procedure is shown in Figure 7.
Firstly, the graphite crucible was thoroughly heated in He atmosphere at 2800oC to remove gas in it. Then, a 0.5 g piece of tin piece was weighed out into the crucible to melt the graphite sample, and degassed in the same manner. The graphite sample and a nickel capsule were put into the crucible and melted completely at 2800oC. In the solid solution of graphite and metal, nitrogen compound contained in the graphite samples is converted to nitrogen gas. The gases generated from solid solution were detected to quantify the amount of overall nitrogen content in the graphite sample. In order to investigate the dependence of nitrogen content on the specific surface area of the powder samples, the nitrogen contents were measured for three different particle sizes of powder graphite samples.
�
2.7 Measurement of nitrogen concentration in deep direction The distribution of nitrogen as a function of distance from graphite surface was obtained by
Secondary Ion Mass Analyzer(SIMS) using Cs+ as primary ion. The energy of Cs+ was 6 keV
and the current was 50 nA. The size of the graphite block was 10 mm � 10 mm � 5 mm. The
analyzing area was 50 ƒÊm � 50 ƒÊm.
�
2.8. Measurement of involatile inpurity in graphite The samples were subjected to combution in inert gas and converted to ash. The ash was
dissolved in acidic solution and metals in the solution were identified by ICP emission spectrochemical analysis. Also, X-ray fluoroscence analysis was performed on graphite powder to determine impurity contents.
3 RESULTS AND DISCUSSION 3.1 Morphology of nuclear-grade graphite
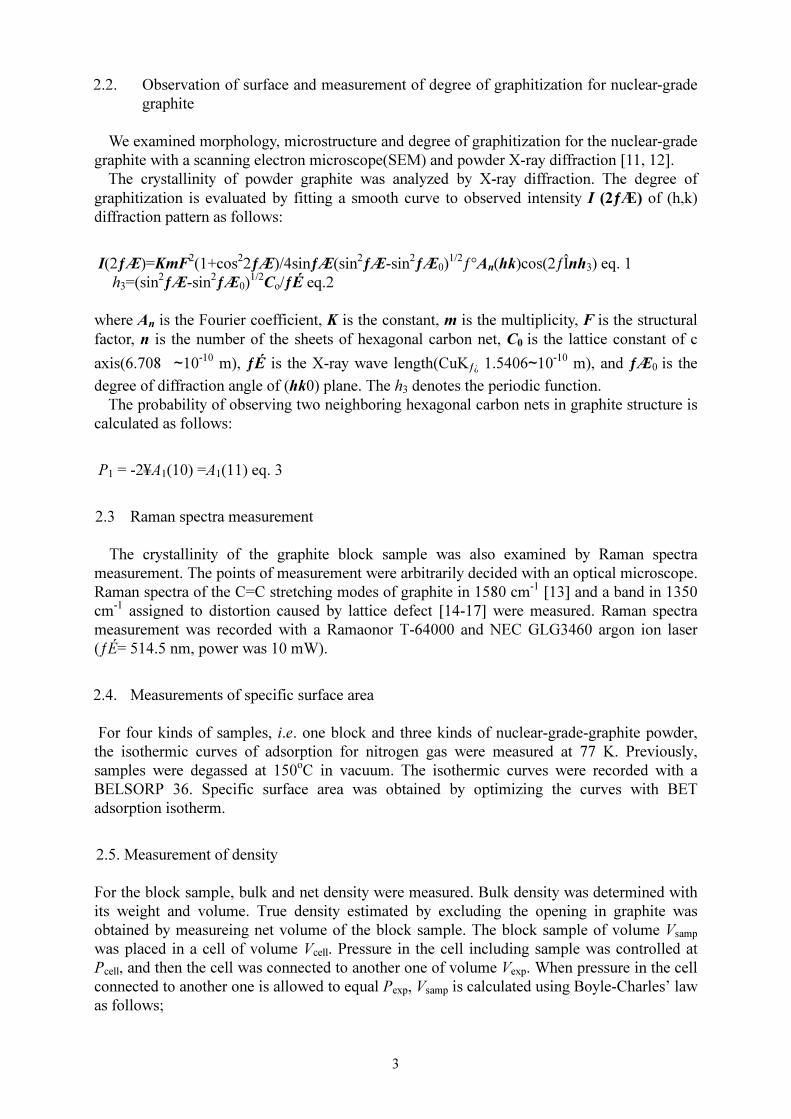
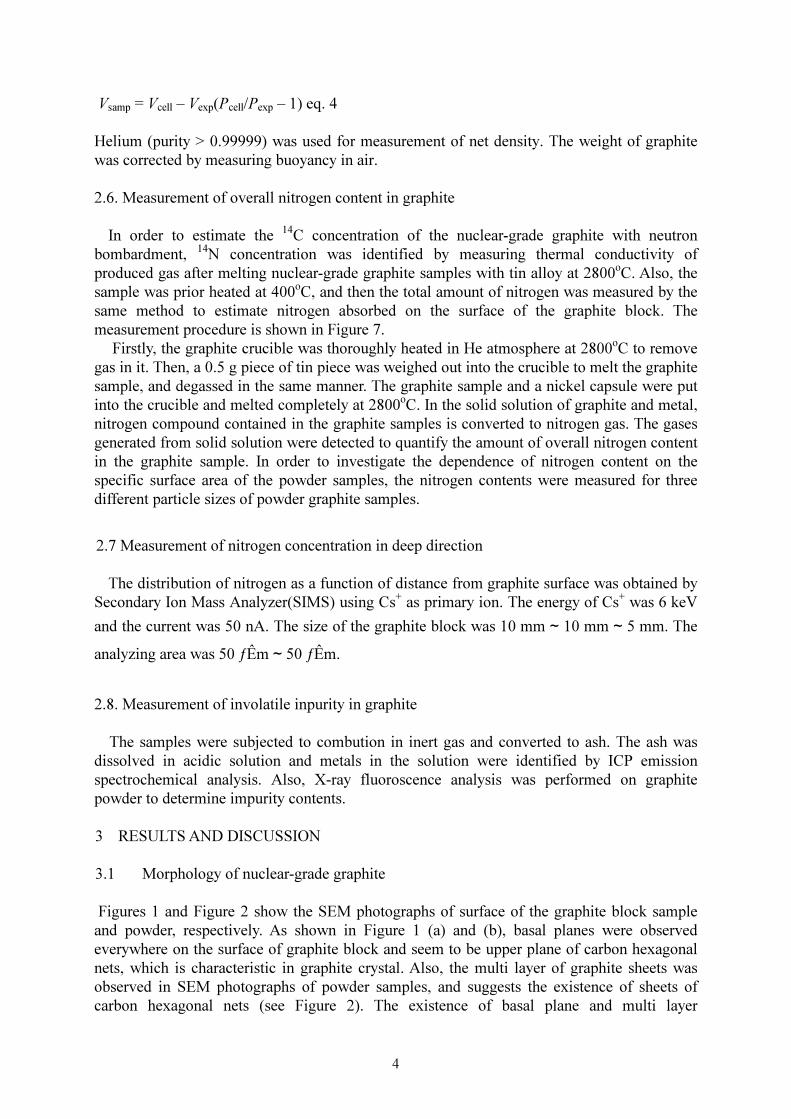
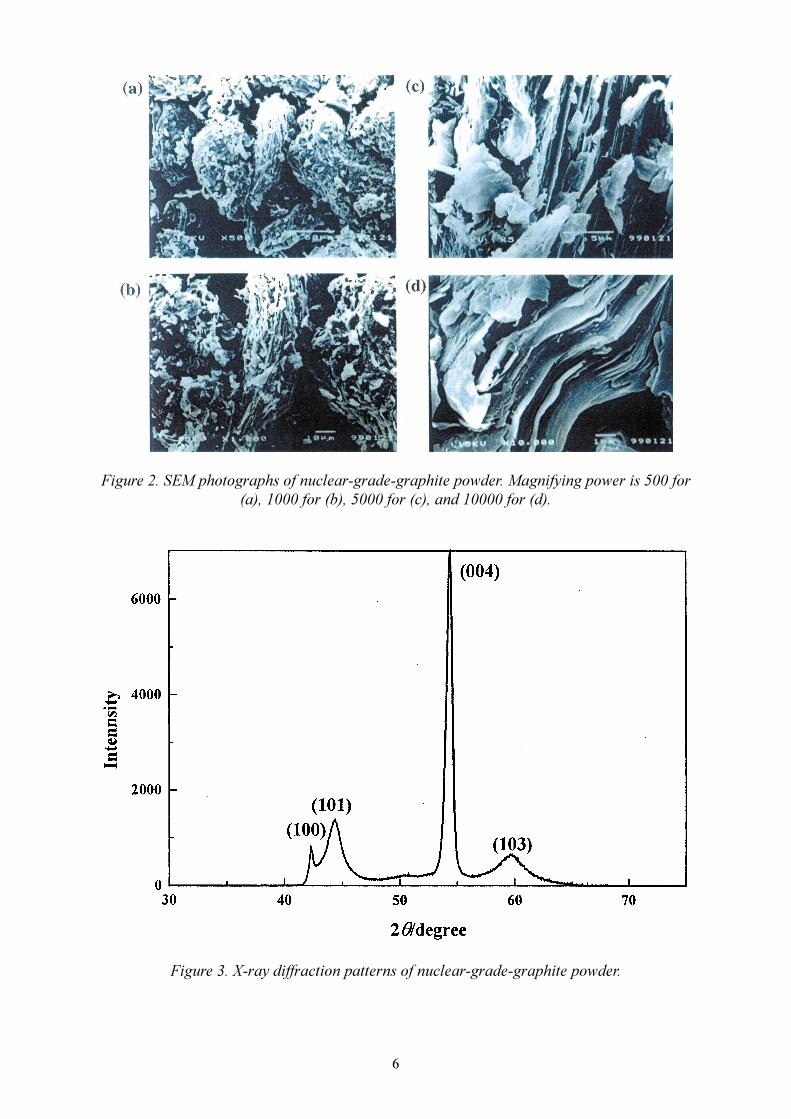
Figures 1 and Figure 2 show the SEM photographs of surface of the graphite block sample and powder, respectively. As shown in Figure 1 (a) and (b), basal planes were observed everywhere on the surface of graphite block and seem to be upper plane of carbon hexagonal nets, which is characteristic in graphite crystal. Also, the multi layer of graphite sheets was observed in SEM photographs of powder samples, and suggests the existence of sheets of carbon hexagonal nets (see Figure 2). The existence of basal plane and multi layer
5
characterized by graphite crystal structure suggests that graphite crystal was grown in the production process and that nuclear-grade graphite includes a large amount of crystal grains.
The degree of graphitization, P1, for the nuclear-grade graphite was yielded by a curve fitting of diffraction pattern, as described in Section 2.2. The values of the degree of
graphitization for several carbon compounds are summarized in Table ‡�. The P1 value varies
depending on crystallinity of carbon compound. The value of P1 for artificial graphite crystal is defined to be 1.0. The P1 value of natural graphite is 0.95, and it is recognized that crystal structure of graphite is highly grown, i.e. layer of hexagonal carbon nets is regularly stacked for carbon compound having the P1 value of more than 0.90 [18]. The P1 value, 0.85, for nuclear-grade graphite is comparatively large and suggests that its crystal quality is high.
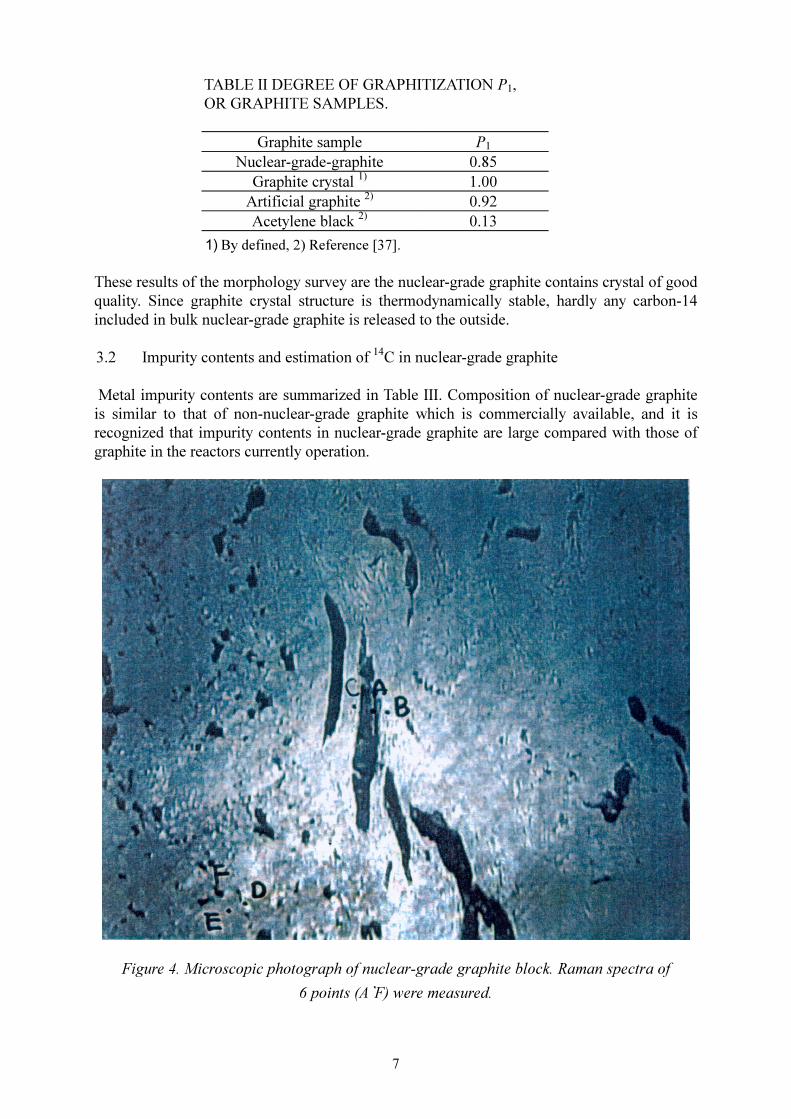
The 6 points on the graphite block of Raman spectra measurements were obtained. The measuring points were on a smooth surface of graphite block and an uneven surface in a crevice. Raman spectra of two representative points are shown in Figure 4. Point A is a comparatively smooth surface and point D is located in an uneven surface. The relative intensity of 1360 cm-1 band against 1580 cm-1 is explained by crystal quality of the graphite sample. The lower the degree of graphitization is, the larger the peak width of 1580 cm-1
(ƒ¢ƒË1580 ) and the higher peak height of 1355 cm-1 rises. The ratio of intensity for the
1360 cm-1 and 1580 cm-1 band (ƒ¢I1360 / ƒ¢I1580) increases in the sequence D� C > B > F > E
> A, as shown in Figure 6. It is recognized that theƒ¢I1360 / ƒ¢I1580 value for high graphitization carbon compound is less than 0.20 and that the ƒ¢ƒË1580 becomes larger for low crystal quality. At the A point, basal plane was observed by SEM. It shows good quality of crystal surrounding A point. The ƒ¢ƒË1580 for D point is larger than that for A point. The results of Raman spectra measurement are consistent with the SEM photographs. We consider that nuclear-grade graphite consists of plenty of crystalline graphite.�
Figure 1. SEM photographs of nuclear-grade graphite block for (a) and (b) smooth surface, (c) and (d) crevice. Magnifying power is 1000 for (a) and (c), and 5000 for (b) and (d).
6
Figure 2. SEM photographs of nuclear-grade-graphite powder. Magnifying power is 500 for
(a), 1000 for (b), 5000 for (c), and 10000 for (d).
Figure 3. X-ray diffraction patterns of nuclear-grade-graphite powder.
7
TABLE II DEGREE OF GRAPHITIZATION P1, OR GRAPHITE SAMPLES.
Graphite sample P1�
Nuclear-grade-graphite 0.85 Graphite crystal 1)
� 1.00 Artificial graphite 2)
� 0.92 Acetylene black 2)
� 0.13
���By defined, 2) Reference [37].�
These results of the morphology survey are the nuclear-grade graphite contains crystal of good quality. Since graphite crystal structure is thermodynamically stable, hardly any carbon-14 included in bulk nuclear-grade graphite is released to the outside. 3.2 Impurity contents and estimation of 14C in nuclear-grade graphite
Metal impurity contents are summarized in Table III. Composition of nuclear-grade graphite is similar to that of non-nuclear-grade graphite which is commercially available, and it is recognized that impurity contents in nuclear-grade graphite are large compared with those of graphite in the reactors currently operation.
Figure 4. Microscopic photograph of nuclear-grade graphite block. Raman spectra of
6 points (A�F) were measured.

8
14C is continuously being formed by 14N(n.p)14C reaction with thermal neutrons and originates predominantly in 14N. The kinetic energy of a formed 14C atom ranges is about 470 kJ mol-1. The numerical value is equivalent to that of the bond energy between C-C bond and C = C bond. Therefore, it is suggested that the formed 14C atom stays at the same position as 14N locates. Investigation of distribution of nitrogen in non-radioactive nuclear-grade graphite offers the key to distribution of 14C in radioactive nuclear-grade graphite. We investigated overall concentration and distribution of nitrogen in non-radioactive nuclear-grade graphite.�
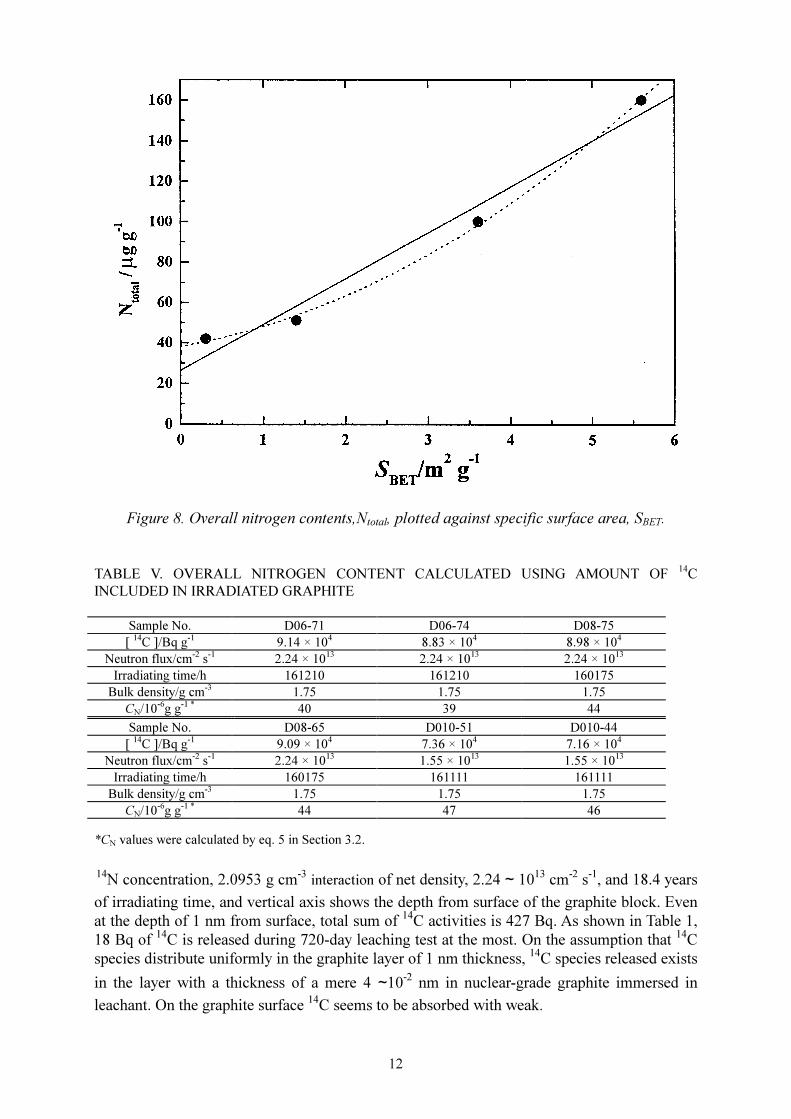
Overall contents of nitrogen, Ntotal, in the nuclear-grade graphite are summarized in Table IV. The Ntotal values increase in proportion to specific surface area of graphite sample and are plotted against specific surface area as shown in Figure 8. It suggests that N2 molecules are absorbed on the graphite surface stably. Nitrogen concentration is independent of temperature. The Ntotal values at 400 oC is consistent with non-heated samples, suggesting that nitrogen molecules are absorbed on surface under the irradiated condition. Also, Table V shows nitrogen concentration, CN, calculated by using the amount of 14C included in an irradiated graphite, neutron flux, irradiating time and density of nuclear-grade graphite. The CN value is calculated by using the following equation;
CN = [ 14C ] d / Nab / A(14N) / NA /ƒÐ/ƒ³/[1-exp(-ƒÉt)] eq. 5
�
where [14C] denotes overall concentration of 14C in irradiated graphite, d is bulk density of nuclear-grade graphite, Nab is natural abundance of 14N, A(14N) is atomic weight of nitrogen, NA is Avogadro’s number, ƒÐ is activation cross section of 14N, ƒ³ is neutron flux, ƒÉ is decay constant of 14C and t is irradiating time.
�
Figure 5. Raman spectra of nuclear-grade-graphite surfaces for A and D shown in Figure 4.��

9
�
�
Figure 6. Variation of I1360/I1600 along ƒ¢ƒË1600 in Raman spectra of
nuclear-grade-graphite surfaces.� TABLE III. IMPURITY CONTENTS IN NUCLEAR-GRADE GRAPHITE/10-6 G G-1
� B Si S Cl K Ca
Nuclear-grade graphite
- 30 20 20 <10 20
Pechiney product 1)� 0.3 - - - - -
Graphite 2)� <1 12 21 <10 0.92 4.7
� Ti V Mn Fe Ni
Nuclear-grade graphite
20 100 10 30 20
Pechiney product 1)� 15 23 0.1 15 -
Graphite 2)� 33 40 <0.2 26 4
1) Reference [2], 2) Non-nuclear-grade graphite available in the market.
�
�
�
10
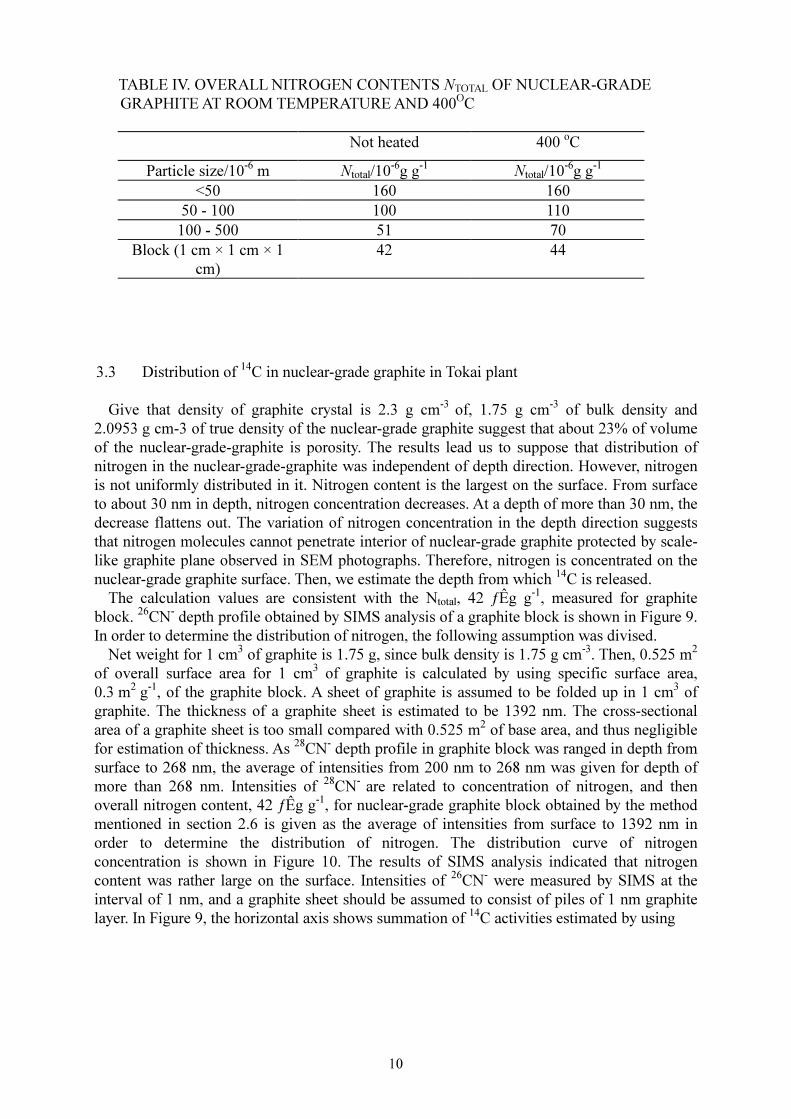
TABLE IV. OVERALL NITROGEN CONTENTS NTOTAL OF NUCLEAR-GRADE GRAPHITE AT ROOM TEMPERATURE AND 400OC
� Not heated 400 oC
Particle size/10-6 m Ntotal/10-6g g-1� Ntotal/10-6g g-1
�
<50 160 160 50 - 100 100 110 100 - 500 51 70
Block (1 cm × 1 cm × 1 cm)
42 44
�
�
�
3.3 Distribution of 14C in nuclear-grade graphite in Tokai plant Give that density of graphite crystal is 2.3 g cm-3 of, 1.75 g cm-3 of bulk density and
2.0953 g cm-3 of true density of the nuclear-grade graphite suggest that about 23% of volume of the nuclear-grade-graphite is porosity. The results lead us to suppose that distribution of nitrogen in the nuclear-grade-graphite was independent of depth direction. However, nitrogen is not uniformly distributed in it. Nitrogen content is the largest on the surface. From surface to about 30 nm in depth, nitrogen concentration decreases. At a depth of more than 30 nm, the decrease flattens out. The variation of nitrogen concentration in the depth direction suggests that nitrogen molecules cannot penetrate interior of nuclear-grade graphite protected by scale-like graphite plane observed in SEM photographs. Therefore, nitrogen is concentrated on the nuclear-grade graphite surface. Then, we estimate the depth from which 14C is released.
The calculation values are consistent with the Ntotal, 42 ƒÊg g-1, measured for graphite block. 26CN- depth profile obtained by SIMS analysis of a graphite block is shown in Figure 9. In order to determine the distribution of nitrogen, the following assumption was divised.
Net weight for 1 cm3 of graphite is 1.75 g, since bulk density is 1.75 g cm-3. Then, 0.525 m2 of overall surface area for 1 cm3 of graphite is calculated by using specific surface area, 0.3 m2 g-1, of the graphite block. A sheet of graphite is assumed to be folded up in 1 cm3 of graphite. The thickness of a graphite sheet is estimated to be 1392 nm. The cross-sectional area of a graphite sheet is too small compared with 0.525 m2 of base area, and thus negligible for estimation of thickness. As 28CN- depth profile in graphite block was ranged in depth from surface to 268 nm, the average of intensities from 200 nm to 268 nm was given for depth of more than 268 nm. Intensities of 28CN- are related to concentration of nitrogen, and then overall nitrogen content, 42 ƒÊg g-1, for nuclear-grade graphite block obtained by the method mentioned in section 2.6 is given as the average of intensities from surface to 1392 nm in order to determine the distribution of nitrogen. The distribution curve of nitrogen concentration is shown in Figure 10. The results of SIMS analysis indicated that nitrogen content was rather large on the surface. Intensities of 26CN- were measured by SIMS at the interval of 1 nm, and a graphite sheet should be assumed to consist of piles of 1 nm graphite layer. In Figure 9, the horizontal axis shows summation of 14C activities estimated by using
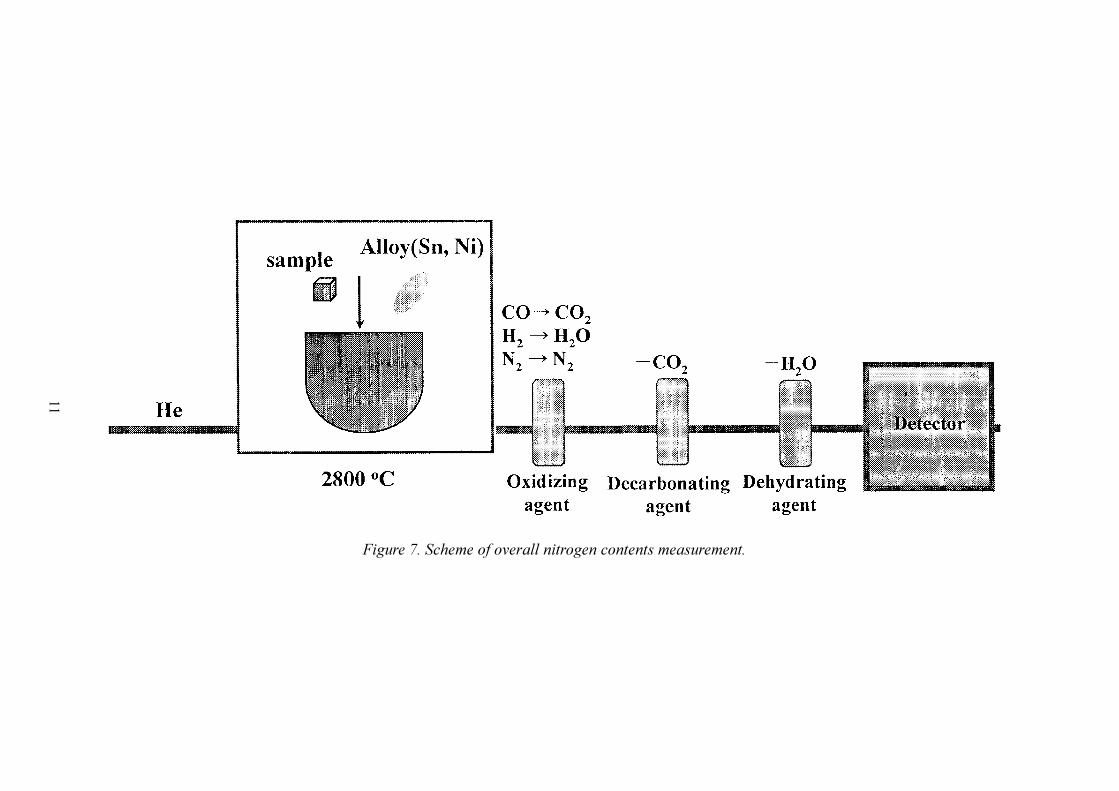
Figure 7. Scheme of overall nitrogen contents measurement.
11
12
Figure 8. Overall nitrogen contents,Ntotal, plotted against specific surface area, SBET.
TABLE V. OVERALL NITROGEN CONTENT CALCULATED USING AMOUNT OF
14C
INCLUDED IN IRRADIATED GRAPHITE
Sample No. D06-71 D06-74 D08-75
[ 14C ]/Bq g-1� 9.14 × 10⁴
� 8.83 × 10⁴� 8.98 × 10⁴
�
Neutron flux/cm-2 s-1� 2.24 × 10¹³
� 2.24 × 10¹³� 2.24 × 10¹³
�
Irradiating time/h 161210 161210 160175
Bulk density/g cm-3� 1.75 1.75 1.75
CN/10-6g g-1 *� 40 39 44
Sample No. D08-65 D010-51 D010-44
[ 14C ]/Bq g-1� 9.09 × 10⁴
� 7.36 × 10⁴� 7.16 × 10⁴
�
Neutron flux/cm-2 s-1� 2.24 × 10¹³
� 1.55 × 10¹³� 1.55 × 10¹³
�
Irradiating time/h 160175 161111 161111
Bulk density/g cm-3� 1.75 1.75 1.75
CN/10-6g g-1 *� 44 47 46
*CN values were calculated by eq. 5 in Section 3.2.�
14N concentration, 2.0953 g cm
-3 interaction of net density, 2.24 � 10
13 cm
-2 s-1
, and 18.4 years
of irradiating time, and vertical axis shows the depth from surface of the graphite block. Even
at the depth of 1 nm from surface, total sum of 14
C activities is 427 Bq. As shown in Table 1,
18 Bq of 14
C is released during 720-day leaching test at the most. On the assumption that 14
C
species distribute uniformly in the graphite layer of 1 nm thickness, 14
C species released exists
in the layer with a thickness of a mere 4� �10-2
nm in nuclear-grade graphite immersed in
leachant. On the graphite surface 14
C seems to be absorbed with weak.

Figure 9. Profile of CN- relative intensity with depth from sample surface.
Figure 10. Distribution of nitrogen concentration with depth from sample surface.

14
Figure 11. Variation of 14
C accumulation with depth from sample surface.
Taking into account the leaching data of 14
C and distribution of nitrogen, it is suggested that
the bulk of 14
C activity remained in graphite matrix which was quite stable, and only 14
C
localized on the surface of the irradiated graphite was released.
�
�
4 CONCLUSION
Composition of impurities included in the nuclear-grade graphite sample provided by the
Japan Atomic Power Company was similar to that of non-nuclear-grade graphite available on
the market.
The degree of graphitization was estimated to be 0.85 for nuclear-grade graphite, and nearly
equal to that for artificial graphite. In SEM photographs, basal plane and piles of graphite
layer were observed, consisting of hexagonal carbon nets characteristic of graphite crystal.
Graphite crystal is too thermodynamically stable to decompose in the disposal environment.
Nitrogen concentration obtained by the method in which converts nitrogen species, e.g.
nitride, to nitrogen gas is consistent with the calculated values using 14
C inventory of
irradiated graphite. Also, distribution of nitrogen suggests that nitrogen molecules were
absorbed on surface of graphite with weak interaction. Therefore, we concluded that hardly
any 14
C included in bulk crystal structure can be released to the outside.
�
ACKNOWLEDGEMENTS
�
We would like to thank the Japan Atomic Power Company for provide samples of nuclear-
grade graphite. We are grateful Mr. Tadashi Fujita, associate deputy general manager, Japan
Atomic Power Company and Mr. Shigefumi Kuroyama, adviser, Nuclear Services Company,
for providing advice through this work.
REFERENCES
�
[1] Peter A. H. Tee and Braian L. Tonge, J. Chem. Educ., 40 (1963) 117-123.
���� L. M. Currie, V. C. Hamister and H. G. MacPherson, Proceedings of the International
Conference on the Peaceful Uses of Atomic Energy, Vol. 8, New York, 1956, 451-473.�
���� P. Legendre, L. Mondet, Ph. Arrongon, P. Cornuault, J. Gueron and H. Hering, Proceedings of the International Conference on the Peaceful Uses of Atomic Energy,
Vol. 8, New York, 1956, 474-477.�
���� A. Legendre, J. Gueron and H. Hering, Proceedings of the International Conference on
the Peaceful Uses of Atomic Energy, Vol. 4, Genea, 1958, 243-256.�
���� P. Leveque, Proceedings of the International Conference on the Peaceful Uses of Atomic
Energy, Vol. 9, New York, 1965, 326-331.�
��� F. P. Bundy and J. S. Kasper, J. Chem. Phys., 46 (1967) 3437-3446.�
��� I. F. White, G. M. Smith, L.J. Saunders, C. J. Kaye, T. J. Martin, G. H. Clarke and M. W.
Wakerley, “Assessment of Management Models for Graphite from Reactor
Decommissioning”, Comm. European Communities Report, EUR9232, 1984.�
[8] W. J. Gray and Morgan, “Leaching of 14
C and 36
Cl from Hanford Reactor Graphite”,
Pacific Northwest Laboratory Report, PNL-6769, 1988.
[9] W. J. Gray and Morgan, “Leaching of 14
C and 36
Cl from Hanford Reactor Graphite”,
Pacific Northwest Laboratory Report, PNL-6789, 1989.
[10] A. J. Wicham, B. J. Marsden, R. M. Sellers, and N. J. Pilkington, “Technologies for gas
cooled reactor decommissionig, fuel storage and waste disposal”, International Atomic
Energy Agency Report, IAEA-TECDOC-1043, 1998.
[11] B. E. Warren, Phys. Rev., 59 (1941) 693-699.
[12] C. R. Houska and B. E. Warren, J. Appl. Phys., 25 (1954) 1503-1509.
[13] S. Bhagavantan and T. Venkatarayudu, “Theory of Groups and its Application to Physical
Problems”, Academic Press, 1969, 140.
[14] F. Tuintra, and J. L. Koening, J. Chem. Phys., 53 (1970) 1126-1130.
[15] M. Nakamizo, R. Kammerick and P. L. Walker, Jr., Carbon, 12 (1974) 259-267.
[16] M. Nakamizo, H. Honda and M. Inagaki, Carbon, 16 (1978) 281-283.
[17] M. Inagaki, M. Endo, A. Oberlin, S. Kimura, M. Nakamizo, Y. Hishiyama and H.
Fujimaki, “Tanso”, 1979 [No.99] 130-137.
[18] R. E. Franklin, Proc. Roy. Soc., A209 (1951) 196-218.
�
�