investigation of mineral-based by-product use as a soil ... · investigation of mineral-based...
TRANSCRIPT

Investigation of Mineral-Based By-Product Use as a Soil Amendment: Results from the Bullsbrook Turf Farm, WA
G. Douglas, L. Wendling, J. Adeney, K. Johnston and S. Coleman
A Report for the Western Australia Water Foundation
July 2010

Water for a Healthy Country Flagship Report series ISSN: 1835-095X
Australia is founding its future on science and innovation. Its national science agency, CSIRO, is a powerhouse of ideas, technologies and skills.
CSIRO initiated the National Research Flagships to address Australia’s major research challenges and opportunities. They apply large scale, long term, multidisciplinary science and aim for widespread adoption of solutions. The Flagship Collaboration Fund supports the best and brightest researchers to address these complex challenges through partnerships between CSIRO, universities, research agencies and industry.
The Water for a Healthy Country Flagship aims to provide Australia with solutions for water resource management, creating economic gains of $3 billion per annum by 2030, while protecting or restoring our major water ecosystems. The work contained in this report is collaboration between CSIRO, Iluka Resources, Ltd., and the Western Australian Government through the Water Foundation and the Department of Water.
For more information about Water for a Healthy Country Flagship or the National Research Flagship Initiative visit www.csiro.au/org/HealthyCountry.html
Citation: Douglas, G., L. Wendling, J. Adeney, K. Johnston and S. Coleman. 2010. Investigation of Mineral-Based By-Product Use as a Soil Amendment: Results from the Bullsbrook Turf Farm, WA. July 2010. CSIRO: Water for a Healthy Country National Research Flagship. 142 pp.
Copyright and Disclaimer © 2010 CSIRO To the extent permitted by law, all rights are reserved and no part of this publication covered by copyright may be reproduced or copied in any form or by any means except with the written permission of CSIRO.
Important Disclaimer: CSIRO advises that the information contained in this publication comprises general statements based on scientific research. The reader is advised and needs to be aware that such information may be incomplete or unable to be used in any specific situation. No reliance or actions must therefore be made on that information without seeking prior expert professional, scientific and technical advice. To the extent permitted by law, CSIRO (including its employees and consultants) excludes all liability to any person for any consequences, including but not limited to all losses, damages, costs, expenses and any other compensation, arising directly or indirectly from using this publication (in part or in whole) and any information or material contained in it.
The views expressed are not necessarily the views of the Government of Western Australia, the Department of Water nor the Water Foundation.
Cover Photograph: From CSIRO’s ScienceImage: www.scienceimage.csiro.au File: BU4485.jpg Description: Pivot irrigated turf farm at Bungendore, NSW. 1999. Photographer: Gregory Heath © 2010 CSIRO

Investigation of Mineral-Based By-Product Use as a Soil Amendment: Results from the Bullsbrook Turf Farm, WA Page i
CONTENTS Acknowledgments ........................................................................................................v Executive Summary.....................................................................................................vi 1. Introduction .........................................................................................................1
1.1. Project motivation and background .......................................................................... 1 1.1.1. Aim and Scope of the Work...................................................................................1
1.2. Project delivery ......................................................................................................... 3 1.3. Trial details and key dates ........................................................................................ 4
2. Methods................................................................................................................5 2.1. Lysimeter installation and sampling.......................................................................... 5 2.2. NUA incorporation..................................................................................................... 7 2.3. Fertilizer type and incorporation ............................................................................... 7 2.4. Grass establishment and harvesting ........................................................................ 7 2.5. Irrigation .................................................................................................................... 8 2.6. Sample collection (NUA, fertilizer, soils and grass runners)................................... 13 2.7. Major and Trace Element Analysis ......................................................................... 13
2.7.1. X-ray fluorescence (XRF) analysis - fusion .........................................................13 2.7.2. X-ray fluorescence (XRF) analysis – pressed powders .......................................14 2.7.3. Data set preparation ............................................................................................14
2.8. Mineralogy .............................................................................................................. 14 2.9. Strontium, neodymium and lead isotope analysis .................................................. 15 2.10. U-Th series, 40K and 137Cs analysis........................................................................ 15 2.11. Lysimeter leachate analysis.................................................................................... 16
2.11.1. Metal and metalloid analysis via ICP-OES and ICP-MS......................................16 2.11.2. Anions, pH, Electrical conductivity, Total Kjeldahl Nitrogen.................................16
3. Results ...............................................................................................................19 3.1. Lysimeter geochemistry – time series in control and NUA-amended plots ............ 19
3.1.1. Physico-chemical parameters (pH, EC), major cations and anions (Na, K, Ca, Mg, Cl, SO4, total alkalinity), Si, Fe and Mn .....................................................................19
3.1.2. Nutrients and average lysimeter flux ...................................................................20 3.1.3. Minor elements: Al, As, B, Ba, Cd, Co, Cr, Cu, F, La, Ni, Pb, Rb, Sc, Se, Sr, Th, Ti, U, V,
Zn ........................................................................................................................21 3.2. Lysimeter geochemistry – estimated loss to groundwater for control and NUA-amended
plots ........................................................................................................................ 31 3.3. Gingin lysimeter geochemistry – time series of nutrients in harvested and transplanted
control and NUA-amended plots............................................................................. 36 3.4. Bullsbrook trial, soils, NUA and fertilizer – major and trace element geochemistry38 3.5. Bullsbrook turf – major and trace element geochemistry ....................................... 40 3.6. Mineralogy .............................................................................................................. 42 3.7. Geochemical modelling – background.................................................................... 43 3.8. Saturation of specific mineral species in Bullsbrook lysimeter leachates............... 44 3.9. Sr-Nd isotope geochemistry ................................................................................... 49 3.10. Pb isotope geochemistry ........................................................................................ 52 3.11. U-Th series, 40K and 137Cs isotope geochemistry................................................... 54
3.11.1. A brief background to U-Th series isotope geochemistry ....................................54 3.11.2. Radionuclide distribution .....................................................................................55
4. Discussion .........................................................................................................59

Investigation of Mineral-Based By-Product Use as a Soil Amendment: Results from the Bullsbrook Turf Farm, WA Page ii
4.1. Control and NUA-amended soil leachate geochemistry......................................... 59 4.2. Sr-Nd-Pb, U-Th series, 137Cs and 40K isotope geochemistry.................................. 61 4.3. Environmental radioactivity – U-Th-series and 40K radionuclides .......................... 62 4.4. Turf export evaluation (Gingin transplanted turf) .................................................... 65 4.5. Environmental implications of the application of NUA to turf farms on the Swan Coastal
Plain ........................................................................................................................65 5. Conclusion.........................................................................................................67 Appendix 1: Chronic algal growth rate ecotoxicity test results............................. 70 Appendix 2: Acute cladoceran immobilisation ecotoxicity test results................ 78 Appendix 3: Results of laboratory column experiments using NUA to attenuate DOC, N
and P in surface waters from the Swan Coastal Plain ................................... 85 Appendix 4: Statement from the Radiological Council of WA with regard to NUA use as
a soil amendment on turf farms.....................................................................118 Appendix 5: Independent radiological assessment of the application of NUA to soils
..........................................................................................................................120 6. References .......................................................................................................131

Investigation of Mineral-Based By-Product Use as a Soil Amendment: Results from the Bullsbrook Turf Farm, WA Page iii
LIST OF FIGURES Figure 1. Soil leachate lysimeter being installed and levelled. .......................................................5
Figure 2. Lysimeter being installed and packed with local sandy soil. ...........................................6
Figure 3. Field sampling apparatus (suction pump) used to sample buried lysimeters with sampling and breather tube emerging from the established turf. ....................................................6
Figure 4. NUA spread on the surface of the amended site (left) and the control site (right) prior to incorporation into the soil profile. Note the overhead “Floppy Sprinkler” irrigation system.............8
Figure 5. NUA in the amended site after incorporation (background) and the control site (foreground). ...................................................................................................................................9
Figure 6. Spreading of the pelletised fertilizer using a Marshall Multispreader. .............................9
Figure 7. Planting of Palmetto soft leaf buffalo grass runners using a muck spreader. ...............10
Figure 8. Palmetto soft leaf buffalo grass runners were planted into the surface 5 cm of the soil using a rotary hoe fitted with a roller. ............................................................................................10
Figure 9. Harvesting of the turf using a tractor-mounted harvester..............................................11
Figure 10. Turf regeneration 50 days after harvest in the NUA-amended soils (top) and control soils (bottom). ...............................................................................................................................12
Figure 11. Trial site at Gingin (NUA-amended turf on right, control turf on left), 13 days after planting (14 days after harvest). ...................................................................................................13
Figure 12. Physico-chemical parameters, lysimeter flux and major and trace element geochemistry of control and NUA-amended soil leachates. .........................................................24
Figure 13. Lysimeter geochemistry – fluxes (kg/ha/year calculated using lysimeter geochemistry and leachate flux) for control and NUA-amended plots. ...............................................................32
Figure 14. Lysimeter geochemistry – ratio of control to amended fluxes (calculated using lysimeter geochemistry and leachate flux) for control and NUA-amended plots. ..........................33
Figure 15. Accumulation of PO4-P in NUA-amended (pink) and control (blue) lysimeters expressed as loss (mg/m2) over the 1,357 days of the Bullsbrook Turf Farm field trial. ...............34
Figure 16. pH, nutrient geochemistry and lysimeter flux of control (blue) and NUA-amended (red) soil leachates from turf transferred to Iluka’s Gingin site. .............................................................37
Figure 17. X-ray diffraction spectrum of soil (Bassendean Sand) from the Bullsbrook Turf Farm trial site. ........................................................................................................................................42
Figure 18. X-ray diffraction spectrum of NUA. .............................................................................43
Figure 19. Geochemical modelling of Bullsbrook Turf Farm lysimeter leachates - Fe-minerals...45
Figure 20. 143Nd/144Nd versus 87Sr/86Sr isotope geochemistry of the NUA-amended and control soils, fertilizer, NUA, control and NUA-amended turf, NUA and control lysimeter leachates (both grouped in ellipses) and irrigation water. ......................................................................................49
Figure 21. 206Pb/204Pb versus 207Pb/204Pb isotope geochemistry of the NUA-amended and control soils, fertilizer, NUA, the control and amended turf, Broken Hill ore and Perth atmospheric Pb sources. ........................................................................................................................................53
Figure 22. 206Pb/204Pb versus 208Pb/204Pb isotope geochemistry of the NUA-amended and control soils, fertilizer, NUA, the control and amended turf, Broken Hill ore and Perth atmospheric Pb sources. ........................................................................................................................................54
Figure 23. 230Th/238U versus 234U/238U activity diagram for NUA-amended and control soils and lysimeter leachates, fertilizer, NUA and control and NUA-amended turf.......................................57
Investigation of Mineral-Based By-Product Use as a Soil Amendment: Results from the Bullsbrook Turf Farm, WA Page iv
LIST OF TABLES Table 2. Summary of metal/metalloid analytical suite for ICP-MS or ICP-OES analysis and detection limits for the lysimeter leachates. ..................................................................................17
Table 3. Summary of analytical methods for anions, pH, EC total Kjeldahl nitrogen and alkalinity, APHA Method code, detection limits and a brief description of the method of analysis for lysimeter leachates. .....................................................................................................................................18
Table 4. Summary of leachate fluxes (kg/ha/yr) for control and amended plots sorted in the order of an increasing percent change of control versus amended (final column). ................................35
Table 5. Major (%) and trace (μg/g) element geochemistry of pre-amended, control and post NUA-amended soils, Post Archean Australian Shale (PAAS), NUA and fertilizer.........................39
Table 6. Major (%) and trace (μg/g) element geochemistry of the first turf harvested during growth from the Bullsbrook control and NUA-amended sites. ......................................................41
Table 7. Quantitative X-ray diffraction (XRD) analysis of trial soil (Bassendean Sand) and NUA.......................................................................................................................................................42
Table 8. Sr-Nd-Pb isotope geochemistry of the NUA-amended and control soils, fertilizer, NUA, the control and NUA-amended turf, NUA and control lysimeter leachates, irrigation water, Broken Hill ore and Perth atmospheric Pb sources...................................................................................51
Table 9. Summary of U-Th series, 40K and 137Cs mean isotopic composition of NUA-amended and control soils, fertilizer, NUA and control and amended turf, Darling Scarp gravel/soil, red mud, fly ash, red clay bricks, concrete/cement, phosphogypsum, and UNSCEAR guidelines (1998). All radionuclide units are in Bq/kg with standard errors generally 5-10% of the mean. 238U and 232Th decay chains grouped together.....................................................................................................58

Investigation of Mineral-Based By-Product Use as a Soil Amendment: Results from the Bullsbrook Turf Farm, WA Page v
ACKNOWLEDGMENTS The authors gratefully acknowledge Iluka Resources, Ltd., the CSIRO Water for a Healthy Country Flagship, and the Western Australian Government for support provided through the Water Foundation and the Department of Water.
We would also like to formally acknowledge:
• the support and assistance of the owner of Bullsbrook Turf Farms, John Maas, and his staff throughout the turf farm field trial;
• the Iluka Resources staff from the Gingin mine site for lysimeter sampling;
• Brian McLoughlin and John Bultitude-Paull, both formerly of Iluka Resources, for assistance in initiating the NUA turf farm field trial project and Mike Harwood, also formerly of Iluka Resources, for his on-going support of the project;
• Helen Waldron and the staff from Genalysis Laboratories for meeting sometimes demanding deadlines for sample analysis;
• Gary Hancock and technicians from CSIRO Land and Water Laboratories in Canberra for the U-Th series radionuclides analyses;
• Mark Norman from RSES, Australian National University for Sr, Nd and Pb isotope analyses; and
• Mark Raven and the staff at CSIRO Mineralogical and Geochemical Services for X-ray diffraction and X-ray fluorescence analyses.

Investigation of Mineral-Based By-Product Use as a Soil Amendment: Results from the Bullsbrook Turf Farm, WA Page vi
EXECUTIVE SUMMARY Results from a 1,357 day field trial comparing soils amended with Neutralized Used Acid (NUA) to an untreated (control) soil at the Bullsbrook Turf Farm, Western Australia are presented. The NUA was incorporated at the rate of 150 t/ha into the upper 15 cm of the soil profile, equating to 5% by mass. The NUA is a by-product derived from synthetic rutile manufacture at Iluka Resources heavy mineral operations at Capel, WA. Results are also presented for 209 days of transferred turf leachate geochemistry from NUA-amended and control soils.
Average soluble phosphorous (PO4-P) fluxes to the shallow groundwater measured over the Bullsbrook Turf Farm field trial were 0.7 and 26.6 kg/ha/yr for the NUA-amended and control sites respectively. This equated to a net 97% reduction of PO4-P in leachates from the NUA-amended experimental plots. Nitrogen fluxes for both ammonia (NH3-N) and nitrate (NO3-N) were reduced by 82% and 40% respectively, in the NUA-amended soil leachates.
Following the application of NUA, there was an increase of ~1-1.5 pH units to typically between 7.0 and 8.5 in lysimeter leachates from the NUA-amended soils relative to the control soils. This increase in pH was sustained throughout the majority of the field trial. In addition, total lysimeter flux (litres of soil water leachate collected between each sampling period) was 1.8 times higher in the control soils relative to the NUA-amended soils.
A geochemically diverse suite of elements displayed substantial reductions in the NUA-amended leachates relative to the control leachates. In addition to dissolved N and P species, the control soil leachates were enriched relative to NUA-amended soil leachates (in decreasing order) in La, As, Cd, Cr, Th, Fe, Al, Pb, Si, Ti, Se, K, Rb, Na, V, Sc, Cu, Cl, U, Co, Ba, B, Ni, Zn, F and Mn. Increased element fluxes from the NUA-amended site relative to the control site occurred for the alkali and alkaline earth cations such as Ca, Mg, Na and Sr, and the major anions S (as SO4
2-), and total alkalinity (as CO3
2- + HCO3- + OH-), due primarily to gypsum dissolution.
Geochemical modelling of soil leachate chemistry indicated that within the NUA-amended soil was a general increase in the degree of oversaturation or transition from under- to oversaturation of a range of Fe-containing and some Al-containing minerals, and of calcite and hydroxyapatite. The net result was the formation of a range of minerals with a well-documented ability to either directly adsorb PO4-P, (e.g. ferrihydrite – Fe(OH)3) or incorporate PO4-P into their structure (as calcite - CaCO3 or hydroxyapatite - Ca5[PO4]3OH). Geochemical modelling also indicated that the NUA-amended soil leachate was in equilibrium with gypsum for the majority of the field trial.
Following the application of NUA, there was an increase in turf vigour and general “health” observed by the report authors and the Bullsbrook Turf Farm management during both the initial turf growth phase and post-harvesting turf regeneration. This increased growth may correspond to increased pools of nutrient and trace element retained within the root-zone of the NUA-amended soil.
A comparison of the composition of turf cultivated on the NUA-amended and control soils indicated the major element geochemistry was similar for both types of turf with relative enrichments or depletions generally <10%. The only exceptions were Si (possibly due to traces of Bassendean Sand adhering to the grass), and Fe, Mn and S enriched in the turf grown on NUA-amended soil. Both Mg and to a lesser extent P were enriched in turf grown on the control soil.

Investigation of Mineral-Based By-Product Use as a Soil Amendment: Results from the Bullsbrook Turf Farm, WA Page vii
Transferred turf also displayed promising nutrient and water retention characteristics. At Iluka Resources Gingin minesite, where Bullsbrook-grown turf was transferred, the pH and PO4-P concentrations were similar in soil leachates collected beneath the transplanted control and NUA-amended turf over 209 days. Lysimeter fluxes were ~1.7 times greater beneath the transplanted control turf, similar to the Bullsbrook site ratio of ~1.9. Approximately 2.8 times more PO4-P was lost to the control turf leachates compared to the turf grown on NUA-amended soil. Similarly, control soil leachate fluxes of NH3-N and NO3-N were ~3.3 and 1.3 times higher, respectively, than in the NUA-amended soil leachate.
A suite of U- and Th-series radionuclides and Cs and K radionuclides were measured in NUA, control and amended soils, fertilizer and grass during the Bullsbrook field trial. In general, the fertilizer had the greatest mean concentration of a range of U-Th series radionuclides (derived from the 238U decay chain), and 40K. In contrast, NUA was enriched in radionuclides derived from the 232Th decay chain. Both the control and NUA-amended turf had the greatest 137Cs relative to all other phases. Turf grown on the NUA-amended soil had ~5 and ~2 times the 226Ra and 40K activity, respectively, of the control soil turf.
Calculated radioactivity absorbed dose rates (D) were greatest for the fertilizer (331 nGy/h) and NUA (263 nGy/h). Unamended Bullsbrook soils had a low D (3-4 nGy/h), increasing ~4-5 times following 5% NUA amendment (17 nGy/h), comparable to the lowest rates for concrete (14 nGy/h) and clay bricks (15 nGy/h). Absorbed dose rates for turf varied between 52 and 93 nGy/h for the control and NUA-amended turf, respectively. By comparison, Western Australia’s Darling Scarp soils have D values between 35 and 378 nGy/h (average 195 nGy/h). Red mud, previously trialled as a soil amendment in the south west of Western Australia, would, at an application rate of 5%, have an absorbed dose rate of ~54 nGy/h, or ~3 times that of NUA.
Analysis of Sr, Nd and Pb isotopes in NUA, soils, fertilizer, grass and groundwater allowed the identification of the fluxes of these elements on the NUA-amended and control soils. Most Pb in soils, groundwater and turf at Bullsbrook was dominated by atmospheric Pb derived from vehicle emissions. Control soils, once amended with NUA, were dominated by the NUA Sr-Nd isotopic/geochemical signature. Turf grown on control soils had a composition reflecting a contribution of both fertilizer and groundwater. In contrast, turf grown on NUA-amended soils reflected a mixture of NUA and fertilizer. Control soil leachates had an Sr-Nd isotope geochemistry intermediate between that of control soils and fertilizer while NUA-amended soil lysimeter leachates were dominated by NUA with minor groundwater and fertilizer contributions.
Based on the results of the 1,357-day Bullsbrook Turf Farm field trial, NUA appears to constitute a low risk material in terms of its specific use as a soil amendment on turf farms. Furthermore, NUA appears to be a promising material to increase the nutrient and trace element retention capacity and for solute retention within the sandy soils on the Swan Coastal Plain.
Calculations based on results of this field trial indicate that incorporation of NUA at 150 tonnes/ha over the ~700 ha of turf farms on the Swan Coastal Plain (105,000 tonnes of NUA in total) would yield a reduction of 84 tonnes of leached P and 115 to 287 tonnes of leached TN per year. In addition, a potential may exist for a reduction in turf irrigation and fertilizer use, particularly if nutrients are effectively retained within the root zone in a bioavailable form.

Investigation of Mineral-Based By-Product Use as a Soil Amendment: Results from the Bullsbrook Turf Farm, WA 1
1. INTRODUCTION
1.1. Project motivation and background Leaching of applied nutrients, particularly P, is recognised as a major problem in the largely unretentive soils in coastal regions of South West Western Australia. In an attempt to redress this problem, the application of a Neutralised Used Acid (NUA) by-product generated from heavy mineral processing was trialled. The Fe-rich NUA residue has a high P sorption capacity, and thus if incorporated into the upper layers of unretentive soils has the potential to ameliorate many of the problems of P leaching. The NUA is generated during the production of synthetic rutile from ilmenite where sulfuric acid is used to leach impurities from the reduced ilmenite. The spent acid is then neutralised with quicklime to form NUA. The main chemical reaction involved in the generation of NUA is:
2Fe3+ + 3SO42- + 3CaO +3H2O → 2FeOOH + 3CaSO4·2H2O
which forms an intimate mixture of Fe-oxyhydroxides (FeOOH and related Fe-minerals) and gypsum (CaSO4·2H2O). A substantial quantity of Mn present within the system also precipitates upon neutralization, but at a lower pH than other minerals in the system. The synthetic rutile industry generates significant quantities of NUA which is normally disposed of in lined storage systems.
The high P sorption capacity of NUA may be useful in situations where fertilizers are used extensively on soils which are largely unretentive for P (e.g. Ellen Brook and Peel/Harvey catchments) to prevent or diminish the rate of nutrient export to adjacent waterways. Prior investigations (e.g. MERIWA Projects M122, M208, M230 and M344 www.doir.wa.gov.au/meriwa) and other industry research have demonstrated that NUA has value as a soil conditioner and P sorbent. However, the stability of the nutrient (P) fixation over time and trace element mobility under varying soil conditions was not addressed.
Three Western Australian synthetic rutile production sites are within catchments that experience eutrophication, giving rise to algal blooms and presenting associated public and environmental health risks. It is widely accepted that improved nutrient retention within the respective catchments both in the short- and long-term will lead to improved quality in the receiving waters. Thus, based on existing information, and the prospect for potential broader scale use of this material as a soil amendment, the continued evaluation of NUA was warranted.
1.1.1. Aim and Scope of the Work
A research program was conducted to investigate and quantify the mobility of trace elements and radionuclides, and nutrient retention characteristics of NUA on turf farms in South West Western Australia.
The primary goal of the study was to investigate the extent of migration (if any) of a range of elements and radionuclides from sites growing turf. The study objectives reflected the potential benefits of using NUA, including enhanced P retention at both the turf farm and properties where the turf is laid, greater moisture retention of NUA-amended soil, trace element retention by NUA and enhanced turf productivity. From this study it was envisaged that a generic understanding of the degree of P, trace element and radionuclide retention would be obtained rather than a simple

Investigation of Mineral-Based By-Product Use as a Soil Amendment: Results from the Bullsbrook Turf Farm, WA 2
analysis of site specific differences. Three specific sites that encompass geographical locations on the Swan Coastal Plain and South West and a range of agricultural production practices were initially proposed: Bullsbrook, Serpentine and V&V Walsh (Bunbury). This report documents the results obtained at the Bullsbrook Turf Farm site. The Serpentine site was abandoned soon after inception due to cross-contamination of control and NUA-amended sites. Similarly, the trial at the Bunbury site was abandoned for logistical reasons.
On the remaining Bullsbrook Turf farm site, where the remaining focus was directed, the aims of the project were to:
Investigate the extent of migration (if any) of a range of elements and radionuclides within NUA-amended soils, shallow groundwater leachate and turf biomass relative to control soils.
Investigate potential benefits of using NUA including enhanced P retention at both the turf farm and properties where the harvested turf is laid, higher moisture retention of the soil, and the potential for enhanced turf farm productivity.
Gain a detailed understanding of the mechanisms governing the degree of P, trace element and radionuclide retention.
Investigate whether harvested and exported turf produced in soils amended with NUA exhibited improved P and nutrient retention properties.
Outcomes from this work may include:
Reduction of solid waste to landfill.
Improvement of physico-chemical structure sandy soils (augment texture and moisture holding capacity).
Improvement of ground and surface water quality (retention of P and other potential contaminants in NUA-amended soil).
Enhanced turf growing productivity.
Reduced fertilizer application rates.
Enhanced trace element availability via retention in root zone of NUA-amended soil.
The formation of a basis for investigation of the use of NUA in other areas of intensive agriculture, such as dairy farming and feedlots, which also may result significant offsite nutrient export.

Investigation of Mineral-Based By-Product Use as a Soil Amendment: Results from the Bullsbrook Turf Farm, WA 3
1.2. Project delivery The comprehensive geochemical study proceeded through a number of stages:
Stage 1: Multiple control and experimental areas were established at each site. Over a period of nearly four years there was periodic sampling and analysis for the following:
Soil pore water profiles (pH, conductivity, major anions and cations, Al, Fe, Mn, Si, F and nutrients – N and P species) using lysimeters.
Soil profiles, applied fertilizers and soil amendment material(s) were sampled and analysed for:
o Major and trace element geochemistry (fusion and pressed powder X-ray fluorescence - XRF).
o Nd, Sr and Pb isotopes.
o U-Th series radionuclides (alpha and gamma spectrometry).
Total biomass was sampled and analysed for:
o Major and trace element geochemistry (fusion and pressed powder XRF).
o Nd, Sr and Pb isotopes.
o U-Th series radionuclides, 40K and 137Cs (alpha and gamma spectrometry).
Stage 2: Results from the information obtained from the above analyses were used as the basis for:
Geochemical modelling (PHREEQC) to determine the speciation of selected elements within the soil profiles, with a view to understanding factors controlling P, trace element and radionuclide mobility.
Evaluation of major and trace element and radionuclide mobility/retention within the soil profile or transfer to biomass. This understanding was particularly enhanced by the analysis of Nd, Sr and Pb isotopes which possess considerably different chemistry but are present in the natural soils, soil amendment material and applied fertilizers used in this study.
Eventual product registration with national regulatory authorities (e.g. NICNAS) for widespread use.
Development of a more generic understanding of the retention and/or fate of P, trace elements and radionuclides in amended soils under a variety of farming practices and geographical locations.
Stage 3: Turf export evaluation:
Evaluation of exported turf was based on results obtained in the first two years of monitoring and evaluation at turf farm trial sites, but focused only on the key parameters required to assess trace element and/or radionuclide migration.

Investigation of Mineral-Based By-Product Use as a Soil Amendment: Results from the Bullsbrook Turf Farm, WA 4
1.3. Trial details and key dates The Bullsbrook component of the Iluka-NUA field trial was undertaken at Bullsbrook Turf Farm, owned by Mr John Maas of Cooper Rd. Bullsbrook, WA, 6084. This is the site where turf was cultivated on both NUA-amended and control soils. Harvested NUA-amended and control turf was also transplanted and maintained at the administration block of Iluka Resources Gingin Mine.
The Bullsbrook site was of approximately 1 ha in size with a gently sloping aspect, containing rectangular, paired 0.5 ha NUA-amended and control plots, respectively. The soils at the trial site were structure-less pale yellow to grey, medium to coarse Bassendean Sands. A full description of the chemistry and mineralogy of the sands is given later. Both the NUA-amended and control sites had a previous history of turf cultivation; however, no turf had been grown for at least the preceding five years. Basic site preparation for both plots involved rotary hoeing, rolling and levelling to control weeds, homogenization of the surface of the soil profile and production of a smooth surface. The herbicide Nufarm Broadside™ was also applied approximately 190 days into the trial to control broadleaf weeds.
A number of key dates pertinent to the Bullsbrook and Gingin turf trials are given below.
1/1/2005: Nominal date of trial commencement following site preparation in December 2004.
2/2/2005: Installation of lysimeters in experimental and control plots at Bullsbrook Turf Farm.
4/2/05: Spreading of NUA on experimental plots.
6/2/05: Incorporation of NUA into top 10 cm of soil in experimental plots at Bullsbrook Turf Farm.
7/2/05: Planting of soft leaf buffalo grass (Palmetto - Stenotaphrum secundatum) in control and experimental plots at Bullsbrook Turf Farm.
9/3/2005 - 16/3/2005: Application of fertilizer to control and experimental plots at Bullsbrook Turf Farm.
19/1/06: Commencement of turf harvest.
4/8/06: Installation of turf from Bullsbrook Turf Farm at Gingin.
17/9/08: Cessation of Bullsbrook Turf Farm field trial (1,357 days, final lysimeter sample).

Investigation of Mineral-Based By-Product Use as a Soil Amendment: Results from the Bullsbrook Turf Farm, WA 5
2. METHODS
2.1. Lysimeter installation and sampling The lysimeter catch vessel was composed of polyethylene and had a cone-shaped base with a plastic tube (10 mm diameter) exiting from the lowest point (Figure 1 and Figure 2). The top of the lysimeter was buried to a depth of 15 cm below the soil surface at the interface of the NUA-amended soil and unamended lower soil. The vessel was prepared by placing a filter fabric over the opening in the base, and then packing the vessel with soil collected from the site. The lysimeter catch vessel was 24 cm in diameter (giving an overall catchment area of 0.0453 m2) and 10 cm deep. Four lysimeters were installed in both the control and NUA-amended sites. Leachate collected from the individual lysimeters was aggregated and total volumes recorded.
Figure 1. Soil leachate lysimeter being installed and levelled.

Investigation of Mineral-Based By-Product Use as a Soil Amendment: Results from the Bullsbrook Turf Farm, WA 6
Figure 2. Lysimeter being installed and packed with local sandy soil.
The tube from the base of the vessel was fitted into the lid of a sealed 10 L polyethylene jerry can installed below the vessel (gravity feed). Two 2 mm polyethylene tubes were also fitted into the lid of the jerry can, one extending to the base of the jerry can (suction tube) to recover the soil leachate, and the other terminating just inside the jerry can (breather tube). Any leachate that passed through the soil profile was stored in the jerry can until it was extracted, usually between monthly and bi-monthly intervals using a suction pump (Figure 3).
Figure 3. Field sampling apparatus (suction pump) used to sample buried lysimeters with sampling and breather tube emerging from the established turf.

Investigation of Mineral-Based By-Product Use as a Soil Amendment: Results from the Bullsbrook Turf Farm, WA 7
2.2. NUA incorporation The NUA was applied to the experimental plot at the rate of 150 dry tonnes per ha (ca. 230 m3/ha, Figure 4). The NUA was dumped adjacent to the site prior to application and had the appearance of a dry friable dark brown to chocolate loam. The NUA was incorporated into the soil to a depth of approximately 10-15 cm using a rotary hoe with a roller mounted on the back (this allowed the depth of incorporation to be better controlled). During incorporation, most lumps within the NUA quickly dispersed during the mechanical phase or during initial post-application watering (Figure 5). In addition, further homogenization of the NUA into the existing soil occurred during the incorporation of the grass runners (see later).
2.3. Fertilizer type and incorporation Approximately 7 tonnes of Nitrophoska Blue, a pelletized fertilizer specifically formulated for the turf industry and imported from Germany was applied to the 1 ha trial site. The fertilizer was spread using a Marshall Multispreader (Figure 6). These machines use a belt feeder and spinners to evenly distribute the fertilizer. Given a P content of approximately 6.2% in the fertilizer, this equates to 434 kg of applied P during the duration of the field trial.
Fertilizer applied to the NUA-amended and control sites was supplied on an as required basis as determined by the owner and staff and Bullsbrook turf farms. Contrary to the recommendations of CSIRO and Sports Turf technology, single supplementary Fe-Mn and N (as urea) foliar sprays were also applied during the trial to both the NUA-amended and control sites.
2.4. Grass establishment and harvesting A commercial soft leaf buffalo (Palmetto- Stenotaphrum secundatum) turf was established using a muck spreader to distribute runners (Figure 7). The runners were derived from shredded instant turf using an industry standard ratio of 1 m2 of instant turf to 10 m2 of plot (NUA-amended or control) site. The runners were stolonised (incorporated) into the upper 50 mm of the NUA-amended or control soils using a rotary hoe fitted with a roller (Figure 8).
Grass harvesting was undertaken using a tractor-mounted harvester (Figure 9). After harvesting, remnant grass strips were watered and fertilized to facilitate their growth and re-establishment over the NUA-amended and control sites (Figure 10).
Grass rolls of approximately 2.5 m in length and 0.4 m in width which also contained a few millimetres of the underlying NUA-amended or control soil were transported to Iluka’s Gingin Mine where they were laid on a pre-prepared site consisting of a sandy loam base and a pre-installed pop-up sprinkler system (Figure 11). Three lysimeters each underlying the NUA-amended and control transferred turf were also installed prior to the application of the turf at the Gingin site. This allowed monitoring of the leachate chemistry derived from the transported NUA-amended and control turf respectively.

Investigation of Mineral-Based By-Product Use as a Soil Amendment: Results from the Bullsbrook Turf Farm, WA 8
2.5. Irrigation The trial site was watered with a new generation irrigation system commonly termed a “Floppy Sprinkler”. These irrigation systems have a high uniformity of water coverage even in windy conditions while only having a low output of approximately 5 mm per hour. During the “grow in” phase of the turf under summer conditions, the system needs to run at least twice per day for about 45 minutes each time. This applies approximately 7.5 mm of irrigation per day and just over 50 mm per week. The irrigation water was sourced from an on-site bore which abstracted the water from the superficial aquifer using a submersible pump.
Figure 4. NUA spread on the surface of the amended site (left) and the control site (right) prior to incorporation into the soil profile. Note the overhead “Floppy Sprinkler” irrigation system.

Investigation of Mineral-Based By-Product Use as a Soil Amendment: Results from the Bullsbrook Turf Farm, WA 9
Figure 5. NUA in the amended site after incorporation (background) and the control site (foreground).
Figure 6. Spreading of the pelletised fertilizer using a Marshall Multispreader.

Investigation of Mineral-Based By-Product Use as a Soil Amendment: Results from the Bullsbrook Turf Farm, WA 10
Figure 7. Planting of Palmetto soft leaf buffalo grass runners using a muck spreader.
Figure 8. Palmetto soft leaf buffalo grass runners were planted into the surface 5 cm of the soil using a rotary hoe fitted with a roller.

Investigation of Mineral-Based By-Product Use as a Soil Amendment: Results from the Bullsbrook Turf Farm, WA 11
Figure 9. Harvesting of the turf using a tractor-mounted harvester.

Investigation of Mineral-Based By-Product Use as a Soil Amendment: Results from the Bullsbrook Turf Farm, WA 12
Figure 10. Turf regeneration 50 days after harvest in the NUA-amended soils (top) and control soils (bottom).

Investigation of Mineral-Based By-Product Use as a Soil Amendment: Results from the Bullsbrook Turf Farm, WA 13
Figure 11. Trial site at Gingin (NUA-amended turf on right, control turf on left), 13 days after planting (14 days after harvest).
2.6. Sample collection (NUA, fertilizer, soils and grass runners) Grab samples of ca. 1 kg of NUA were collected from stockpiles prior to application on the experimental site. Similar ca. 1 kg grab samples of fertilizer were also collected from randomly selected 25 kg bags. Prior to and after application and incorporation of the NUA to the experimental plot (see later for methods) depth profiles from 0-10 cm, 10-20 cm, 20-30 cm and 30-60 cm were collected from both this and the control plot from four sites adjacent to the lysimeters. For the NUA-amended soil, the average composition is from the upper depth interval only (0-10 cm) from four sites corresponding to just above the depth of incorporation (ca. 15 cm) of the NUA. Soil samples were obtained using a 56 mm diameter soil corer with samples collected in clear polythene bags. On return to the laboratory, all samples were homogenised, dried at 105°C, and a sub-sample ground using a WC ring mill which was rinsed with clean, coarse river sand and compressed air to clean the mill between each sample.
Grass samples from NUA-amended and control sites were collected at selected periods during the growth phase using clean stainless steel scissors and washed in distilled water to removed any adhering soil. The grass runners were then dried in open brown paper bags over a series of increasing temperatures up to a final temperature of 105°C. After drying the grass was ground using a WC ring mill as described above.
2.7. Major and Trace Element Analysis
2.7.1. X-ray fluorescence (XRF) analysis - fusion
Soil, fertilizer, NUA and fertilizer samples were analysed by X-ray fluorescence (XRF) for major elements (expressed as weight percent oxides): SiO2, Al2O3, Fe2O3, MnO, MgO, CaO, Na2O, K2O, TiO2, P2O5, and trace elements (expressed as µg/g): Ba, Ce, Cl, Cr, Co, Cu, Ga, La, Ni, Nb, Pb, Rb, S, Sr, V, Y, Zn, and Zr using fused glass discs, at CSIRO Land and Water Laboratories,

Investigation of Mineral-Based By-Product Use as a Soil Amendment: Results from the Bullsbrook Turf Farm, WA 14
Adelaide, Australia using the methods of Norrish and Chappell (1977). Approximately 1 g of each oven dried sample (105°C) was accurately weighed with 4 g of 12-22 lithium borate flux. The mixtures were fused at 1050°C in a Pt/Au crucible for 20 minutes then poured into a 32 mm Pt/Au mould heated to a similar temperature. The melt was cooled quickly over a compressed air stream and the resulting glass disks were analysed on a Philips PW1480 wavelength dispersive XRF system using a dual anode Sc/Mo tube and algorithms developed in the CSIRO Adelaide laboratory.
2.7.2. X-ray fluorescence (XRF) analysis – pressed powders
Soil, fertilizer, NUA and fertilizer samples were also analysed by XRF for major elements (expressed as weight percent element): Si, Al, Fe, Mn, Mg, Ca, Na, K, Ti, P, S, and trace elements (expressed as µg/g): Ag, As, Ba, Bi, Br, Cd, Ce, Co, Cr, Cs, Cu, Ga, Ge, Hf, Hg, I, In, La, Mo, Ni, Nb, Nd, Pb, Pr, Rb, Sb, Se, Sm, Sn, Sr, Ta, Te, Th, Tl, U, V, W, Y, Yb, Zn, and Zr using pressed powders. Approximately 4 g of each sample was accurately weighed with 1 g of Licowax binder. The mixtures were shaken vigorously for 30 seconds using a laboratory test tube shaker. The mixtures were pressed to 10 tonnes with a boric acid backing and the resulting pellets analysed on a Spectro X-Lab 2000 energy dispersive XRF system using a Pd X-ray tube and 5 secondary excitation targets.
2.7.3. Data set preparation
The final XRF data set consisted of the major elements expressed as weight percent oxides from the fusion analysis. Where common trace elements existed between the fusion and pressed powder analysis existed the internal consistency was compared pair-wise with generally the technique with the lowest detection limit being used. Due to the use of the WC ring mill during sample preparation, W has been removed from the list of analytes while low (<10-20 μg/g) Co concentrations as a trace element contaminant should be interpreted with caution.
2.8. Mineralogy Approximately 1 g of samples of NUA and Bassendean Sand collected from the turf farm were micronized for 10 minutes under ethanol in a McCrone Micronizing mill. The slurries were oven dried at 60°C then well mixed in an agate mortar and pestle. The finely powdered samples were lightly back pressed into stainless steel holders for X-ray diffraction (XRD) analysis. The XRD patterns were recorded with a PANalytical X’Pert Pro microprocessor-controlled diffractometer using Co Kα radiation, automatic divergence slit, graphite post-diffraction monochromator and X’Celerator fast Si strip detector. The diffraction patterns were recorded in steps of 0.05° 2Θ with a 0.5 second counting time per step, and logged to data files on a PC for analysis using HighScore Plus and XPLOT.

Investigation of Mineral-Based By-Product Use as a Soil Amendment: Results from the Bullsbrook Turf Farm, WA 15
2.9. Strontium, neodymium and lead isotope analysis Strontium, Nd and Pb isotope measurements were carried out at the Research School of Earth Sciences, Australian National University. The powdered samples were dissolved in HF-HNO3 in screw-cap Teflon vials. Strontium and the rare earth elements - REE including Nd were separated from matrix elements by cation-exchange chromatography, following the procedures presented in Crock et al. (1984) and Rehkamper et al. (1996), in a dedicated positive pressure laboratory equipped with HEPA-filtered clean air stations. Neodymium was further purified using chromatography columns loaded with hexyl di-ethyl hydrogen phosphate (HDEHP)-coated Teflon powder (following Richard et al. 1976). Distilled reagents and ultrapure (18 MΩ resistivity) water were used for all procedures.
Isotope ratios were measured by thermal ionisation mass spectrometry following Wasserburg et al. (1981) and Mittlefehldt and Wetherill (1979), using a Thermo-Finnigan Triton TI multi-collector mass spectrometer in static mode. Strontium was run on single Ta filaments after loading in H3PO4. Neodymium isotopes were run on Ta (evaporation) – Re (ionisation) double filaments after loading in HNO3 and dilute H3PO4. All filaments were outgassed at 4 A for 30 min prior to loading the sample.
Each analysis consisted of 150 cycles using 8.4 s integrations and online corrections for Rb (85Rb/87Rb = 2.5907), Ce (140Ce/142Ce = 7.9928) and Sm (147Sm/144Sm = 4.7690; 147Sm/150Sm = 1.5087) interferences. To correct for mass fractionation, Sr isotope ratios were normalised to 86Sr/88Sr = 0.1194 and Nd ratios normalised to 146Nd/144Nd = 0.7219. Reference values for 87Sr/86Sr and 143Nd/144Nd measured on the Triton mass spectrometer during this study are 0.710224 ± 0.000011 (2σ, n=6) for the NIST SRM-987 Sr standard, and 0.512135 ± 0.000010 (2σ, n=4) for the Ames nNd-1 standard, respectively. This value for nNd(0) corresponds to a value of the La Jolla Nd standard of 0.511860. εNd(0) values (deviation from bulk silicate earth value in parts in 10,000) were calculated relative to 143Nd/144Nd=0.512638.
In the Pb isotope analysis, samples were digested in either concentrated HNO3 (grass) or HF+HNO3 (all other samples), dried, and brought up in 0.8 N HBr for isolation of the Pb by anion exchange chromatography. The samples were then dried, spiked with a Tl solution of known isotopic composition (NBS 997), and brought to approx. 0.5 mL final volume in 2% HNO3. Lead isotopic compositions were measured by multi-collector, magnetic sector ICPMS using a Finnigan Neptune mass spectrometer. Samples were aspirated using a concentric glass nebuliser, and instrumental mass bias was corrected by normalising each analysis to 205Tl/203Tl = 2.3873. The NBS 981 Pb isotope standard was measured several times along with the samples for quality control.
2.10. U-Th series, 40K and 137Cs analysis Gamma spectrometry was used for the determination of 226Ra, 210Pb, 228Th, and followed the methods of Murray et al. (1987). Briefly, soil and fertilizer samples were dried at 50°C, ground in a ring mill and then compressed into sealed perspex container of known geometry. The dried plant material was heated at 450°C and residual ash prepared for gamma spectrometry as for soil/fertilizer samples. The samples were counted for 1-2 days using intrinsic Ge gamma detectors. The detectors were calibrated using CANMET uranium ore BL-5, and thorium nitrate refined in 1906 (Amersham International). Both 40K and 137Cs were also determined by gamma spectrometry.

Investigation of Mineral-Based By-Product Use as a Soil Amendment: Results from the Bullsbrook Turf Farm, WA 16
Alpha spectrometry was used to measure 238U, 234U, 232Th and 230Th in the soil fertilizer and turf ash (Martin and Hancock, 2004). This method involves the addition of a tracer isotope (232U and 229Th) to the samples, and the sample dissolved using strong acids, including HNO3, HCl, HF and HClO4. Radiochemical separation procedures were used to isolate the radionuclides of interest (U and Th). The purified solutions were electroplated and the alpha-particle disintegrations counted and analysed by high resolution alpha spectrometry. The chemical yield of the procedure was determined from the known activity of the added tracer isotopes.
2.11. Lysimeter leachate analysis All lysimeter samples were filtered through a syringe-mounted 0.45 μm cellulose nitrate filter prior to analysis. Samples for metals/metalloids analysis were acidified by adding 0.1 mL of Superpure HNO3 to 100 mL lysimeter leachate in a plastic sample bottle. Anion samples were filled completely so that no headspace was present in the plastic bottle. All samples were stored in darkness at 4oC prior to analysis at Genalysis Laboratory Services Pty Ltd, Maddington, WA. All analytical methods based on APHA Standard Methods for the Examination of Water and Wastewater are referenced to the 21st Edition (2005) except for NH3-N which is from the 18th Edition (1992).
2.11.1. Metal and metalloid analysis via ICP-OES and ICP-MS
Lysimeter leachates were analysed on a Perkin Elmer Elan 9000 ICP-MS or Optima 5300 ICP-OES using standard laboratory methods. These methods are described in APHA Standard Methods for the Examination of Water and Wastewater and are referenced to the 21st Edition (2005). Samples blanks, replicate samples and standard waters of a similar matrix type were included in each analytical run. A summary of the analytical suite, method and detection limit is given in Table 1.
2.11.2. Anions, pH, Electrical conductivity, Total Kjeldahl Nitrogen
A summary of analytical methods for anions, pH, EC total Kjeldahl nitrogen and alkalinity, their APHA Method code (2005), detection limits and a brief description of the of analytical method for the Bullsbrook lysimeter leachates is given in Table 2.

Investigation of Mineral-Based By-Product Use as a Soil Amendment: Results from the Bullsbrook Turf Farm, WA 17
Table 1. Summary of metal/metalloid analytical suite for ICP-MS or ICP-OES analysis and detection limits for the lysimeter leachates.
Element Method Detection Units Element Method Detection Units
As /MS 0.001 mg/L Cu /OES 0.1 mg/L
Ba /MS 0.5 µg/L Fe /OES 0.1 mg/L
Cd /MS 0.2 µg/L K /OES 1 mg/L
Co /MS 0.001 mg/L Mg /OES 0.1 mg/L
La /MS 0.02 µg/L Mn /OES 0.1 mg/L
Pb /MS 0.005 mg/L Na /OES 1 mg/L
Rb /MS 0.2 µg/L Ni /OES 0.1 mg/L
Se /MS 0.005 mg/L P /OES 1 mg/L
Sr /MS 0.2 µg/L S /OES 1 mg/L
Th /MS 0.05 µg/L Sc /OES 0.1 mg/L
U /MS 0.05 µg/L Si /OES 0.5 mg/L
Al /OES 0.1 mg/L Ti /OES 0.1 mg/L
B /OES 0.1 mg/L V /OES 0.1 mg/L
Ca /OES 0.1 mg/L Zn /OES 0.1 mg/L
Cr /OES 0.1 mg/L

Investigation of Mineral-Based By-Product Use as a Soil Amendment: Results from the Bullsbrook Turf Farm, WA 18
Table 2. Summary of analytical methods for anions, pH, EC total Kjeldahl nitrogen and alkalinity, APHA Method code, detection limits and a brief description of the method of analysis for lysimeter leachates.
Element Method Detection Units Method code APHA Description
Cl- /COL 5 mg/L 4500-Cl E colorimetric analysis: highly coloured ferric thiocyanate is formed in solution, the intensity is proportional to the chloride concentration
NH3-N /COL 0.5 mg/L 4500-NH3 C colorimetric analysis: NH3 measured by nesslerization by producing a yellow colour
NO3-N /COL 0.5 mg/L 4500-NO3 B and G colorimetric analysis: UV screening followed by reduction of NO3 to NO2 and colorimetric determination of NO2 as a pink azo dye
PO4-P /COL 0.05 mg/L 4500-P E colorimetric analysis: orthophosphate is reacted in acid solution to form a blue colour
EC /METER 10 µS/cm 2510A conductivity meter
pH /METER 0.1 NONE 4500-H pH meter
F- /SIE 0.1 mg/L 4500-F C ion selective electrode measurement in a buffered solution
Acidity /VOL 5 mg CaCO3/L 2310B titration with sodium hydroxide
CO32- /VOL 5 mg CaCO3/L 2320B titration with dilute
hydrochloric acid and calculation of CO3, HCO3 and OH
HCO32 /VOL 5 mg CaCO3/L 2320B as above
OH- /VOL 5 mg CaCO3/L 2320B as above
TKN /VOL 0.2 mg/L 4500-N B digestion of sample to convert all N to ammonia which is then distilled and titrated with acid

Investigation of Mineral-Based By-Product Use as a Soil Amendment: Results from the Bullsbrook Turf Farm, WA 19
3. RESULTS
3.1. Lysimeter geochemistry – time series in control and NUA-amended plots
Leachate data expressed as an average composition obtained from the four control or four experimental lysimeters is shown in Figure 12a – am. The leachate data has been grouped into three categories to aid interpretation:
Physico-chemical parameters (pH, electrical conductivity - EC), major cations and anions (Na, K, Ca, Mg, Cl, SO4, total alkalinity), Si, Fe and Mn (Figure 12a – l).
Nutrients including PO4-P, NH3-N, NO3-N, total inorganic nitrogen (TIN = NH3-N + NO3-N), and total Kjeldahl nitrogen (TKN = NH3-N + organic N), and average lysimeter flux (Figure 12m – r).
Minor elements in alphabetical order: Al, As, B, Ba, Cd, Co, Cr, Cu, F, La, Ni, Pb, Rb, Sc, Se, Sr, Th, Ti, U, V, Zn (Figure 12s - am).
Units for the majority of analytes are expressed as mg/L except for As, Ba, Cd, Co, La, Rb, Se, Sr, Th and U which are expressed in μg/L. Detection limits vary for some elements due to the use of different analytical techniques and improvement in analysis during the course of the study. At the conclusion of the study the highest detection limit will be quoted to avoid confusion in data interpretation.
3.1.1. Physico-chemical parameters (pH, EC), major cations and anions (Na, K, Ca, Mg, Cl, SO4, total alkalinity), Si, Fe and Mn
After the application of the NUA to the experimental site on day 35 and incorporation on day 37 of the field trial there was a substantial rise of approximately 1 pH unit which was generally sustained throughout the remaining period of the field trial (Figure 12a). The largest incremental increase in the average pH of 1.5 units in the NUA-amended site and 1.9 units in the control site leachate respectively occurred between days 91 and 106 (Figure 12a). No pH was recorded between days 47 and 91 in the NUA-amended site as no leachate accumulated in the lysimeters. After day 106 the average pH in the NUA-amended site leachate had a narrow variation of generally between pH7 and 8. During the corresponding period until the end of the field trial, the control site had a more erratic variation in pH of between 5 and 7.5 and was in general 1 – 1.5 pH units lower than the NUA-amended site leachate (Figure 12a). Towards the end of the trial the pH in both the NUA-amended site and the control site leachate declined by approximately 1 – 1.5 pH units with one episodic decline in the control leachate to pH 3.6.
The average EC of the soil leachates is shown in Figure 12b. As with pH, day 91 marked a major turning point in leachate composition with the average NUA-amended site EC in general 3 – 5 times higher than that of the control site. In general both sites display a similar but somewhat erratic pattern with a major increases and declines over the trial. The maximum average EC of ca. 7.9 mS/cm occurs on day 470 in the NUA-amended soil leachate, while the maximum control soil leachate of ca. 5.0 mS/cm occurred on day 847 (Figure 12b).

Investigation of Mineral-Based By-Product Use as a Soil Amendment: Results from the Bullsbrook Turf Farm, WA 20
Average major cation and anion concentrations in leachate (Na, K, Ca, Mg, Cl, SO4, total alkalinity) followed EC with differing degrees of fidelity. In general Na, and to a lesser extent Cl and total alkalinity, most closely resembled the temporal EC profile (Figure 12c, Figure 12g, Figure 12i), with these three major ions constituting the majority of leachate ions. Other ions such as K, Ca and SO4 displayed a similar pattern in concentration, but of different relative intensity compared to EC (Figure 12d, Figure 12e, Figure 12h). Differences in average Ca and SO4 concentrations in particular for the NUA-amended soil leachates compared to the control soil leachates are related gypsum dissolution from the NUA and are discussed later. The average temporal concentration profile displayed by Mg was similar in profile to average EC after day ca. 100. Prior to this, average Mg concentrations in the NUA-amended leachate were approximately twice that of the remainder of the trial (Figure 12f).
Average Si concentrations displayed an exponential-like decay concentration profile with a similar average concentration in both the control and NUA-amended soil leachates (Figure 12j). Despite having a maximum average concentration of 9.5 and 5.5 mg/L in the control and NUA-amended leachates, respectively, after day 106, average Si concentrations rarely exceeded 3 mg/L in the NUA-amended leachate and only intermittently in the control leachate over the 1,357 days of the field trial.
As noted for other leachates, day 106 marked a major change in average Fe leachate chemistry. Leachate Fe concentrations begin to substantially increase by day 106, with a maximum solute concentration occurring on day 118 of ca. 1.7 and 2.3 mg/L in the control and NUA-amended soil leachates, respectively. Thereafter, NUA-amended soil leachate Fe concentrations intermittently exceeded 0.5 mg/L and sometimes 1.0 mg/L (Figure 12k).
Average lysimeter concentrations of Mn were generally below 0.2 mg/L for both the control and NUA-amended sites throughout the 1,357 days of monitoring of the field trial (Figure 12l). While initial Mn concentrations are approximately 2-3 times higher in the NUA-amended leachate they are indistinguishable from Mn concentrations in the control leachate for a period of approximately 300 days thereafter. Both the NUA-amended and control soil leachates had spikes in concentration of up to 0.45 and 0.15 mg/L, respectively, in the latter half of the trial; however, for the majority of the last ca. 400 days of the trial average solute concentrations are generally below 0.05 mg/L in both the control and NUA-amended leachates.
3.1.2. Nutrients and average lysimeter flux
From the commencement of monitoring on day 38 of the field trial, average PO4-P concentrations in the NUA-amended soil leachates did not exceed ca. 1.1 mg/L, and were generally less than 0.5 mg/L (Figure 12m). In contrast, average leachate concentrations from control soils were up to 12 mg/L and were erratic, on 12 occasions exceeding 5 mg/L. In general, average control leachate PO4-P concentrations were 10 to 100 times that of the NUA-amended leachate concentrations. The maximum ratio occurred on day 151 with the average control leachate PO4-P concentration ca. 650 times that of the average NUA-amended leachate concentration (Figure 12m).
The highest NH3-N, NO3-N, and hence TIN occurred in the first 100 days of the field trial (Figure 12n, Figure 12o, Figure 12p). In general NO3-N concentrations were 1 – 2 orders of magnitude greater than NH3-N concentrations within both the average control and NUA-amended leachates. After the first 100 days concentrations of NO3-N and NH3-N rarely exceeded 5 mg/L and hence,

Investigation of Mineral-Based By-Product Use as a Soil Amendment: Results from the Bullsbrook Turf Farm, WA 21
TIN greater than 10 mg/L. The TKN, a measure of the total organic nitrogen and NH3-N in the leachates, was only analysed after day 630 until the end of the field trial on day 1,357 (Figure 12q). In general, TIN constituted between 0.5 and 1.0 as a fraction of TKN in both the average control and NUA-amended samples suggesting a substantial organic N fraction was present in some leachates. The TKN was consistently higher in the average control relative to the NUA-amended leachates by ca. 50% with the majority of this due to NH3-N and organic-N forms as little NO3-N was present in either type of leachate during the latter part of the field trial (Figure 12o).
The total lysimeter flux (litres of leachate collected between each sampling period, Figure 12r) was consistently higher in the control section relative to the NUA-amended section except for one instance on day 167, where the latter flux during the previous sampling period was ca. 10% higher. In general, the leachate flux to the control lysimeter was 1.5 – 5 times that to the NUA-amended, however, on 7 occasions the flux was at least 5 times greater to the control lysimeter with a maximum of ca. 15 times on day 658. Another major difference between the control and NUA-amended lysimeter fluxes was the absence of any leachate accumulating in the NUA-amended lysimeters between days 38 and 83 inclusive. Control lysimeter fluxes for the corresponding period were also amongst the lowest measured for the trial, being between 0.1 and 0.2 L. Over the entire 1,357 days of the Bullsbrook field trial, 363.2 L of leachate were collected beneath the control soils (annual mean 90.8 ± 12.7L, μ ± 1σ). In contrast, only 199.5 L of leachate was collected beneath the NUA-amended soils (annual mean 49.9 ± 12.3L μ ± 1σ). This equates to approximately 1.8 times greater leachate loss beneath the control soils over 1,357 days.
3.1.3. Minor elements: Al, As, B, Ba, Cd, Co, Cr, Cu, F, La, Ni, Pb, Rb, Sc, Se, Sr, Th, Ti, U, V, Zn
Average concentrations of a number of minor elements, in particular Cd, Co, Cu, La, Ni, Pb, Sc, Ti and V were frequently close to or below analytical detection limits (Figure 12w, Figure 12x, Figure 12z, Figure 12ab – ad, Figure 12af, Figure 12aj, Figure 12al). In addition, some of these elements have had varying analytical detection limits during the course of the field trial which obscured any primary trends in the data. Nonetheless, trends between the abovementioned elements were sometime quite similar with isolated spikes in concentration often replicated between control and NUA-amended leachates. Importantly, detection limits (which sometimes varied between analyses) for elements such as Cd, which is known for its toxicity to biota, were extremely low (0.01 μg/L). Due to the abovementioned factors the elements listed above will not be discussed further.
During the first part of the field trial average Al leachate concentrations are similar for both the control and NUA-amended sites. After approximately 300 days, however, Al concentrations in the NUA-amended leachate generally did not exceed 0.2 mg/L, while those of the control leachate were 0.3 – 0.4 mg/L (Figure 12s). Only on day 658 was the Al concentration of 0.20 mg/L higher in the NUA-amended leachate than the control. In the last days of the field trial the average dissolved Al concentrations in the control leachate was ca. 3.1 mg/L, approximately six times higher than on any previous sampling.
The average concentration of As in the control leachate describes a similar temporal profile to that of P with a maximum of 7 μg/L (Figure 12t, Figure 12m). In contrast, the NUA-amended
Investigation of Mineral-Based By-Product Use as a Soil Amendment: Results from the Bullsbrook Turf Farm, WA 22
lysimeter leachates are generally between 0-3 μg/L and generally less than that of the control leachate.
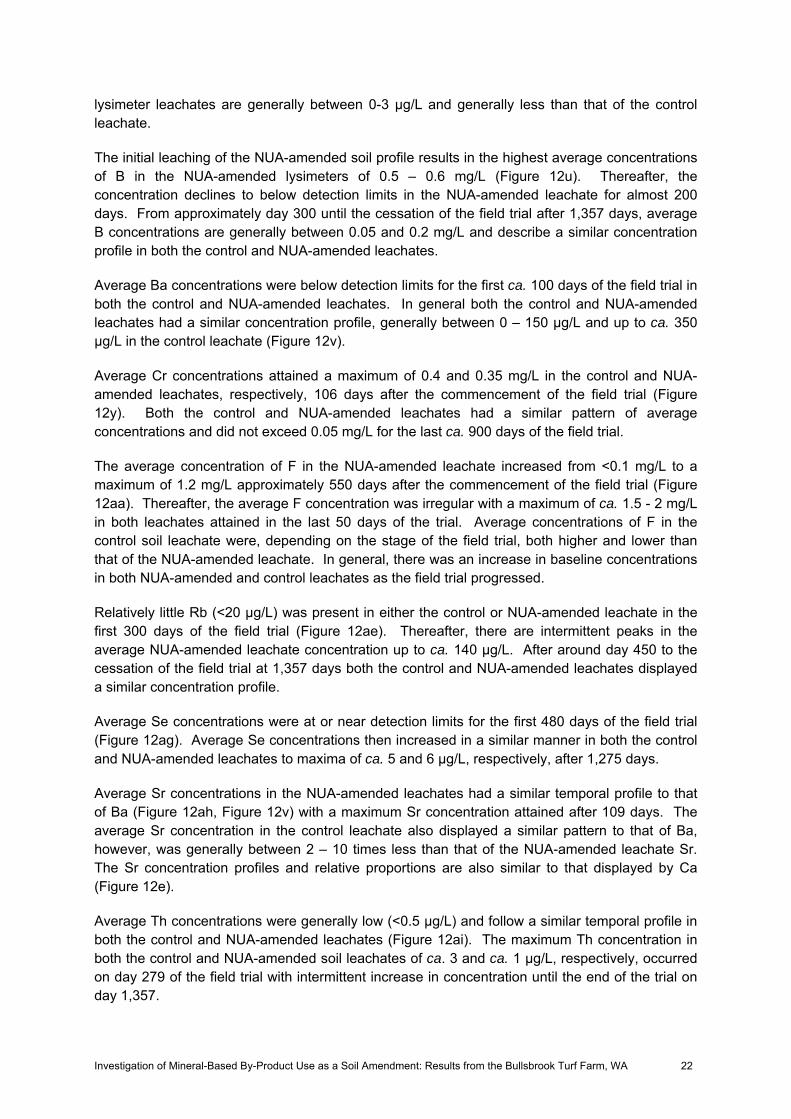
The initial leaching of the NUA-amended soil profile results in the highest average concentrations of B in the NUA-amended lysimeters of 0.5 – 0.6 mg/L (Figure 12u). Thereafter, the concentration declines to below detection limits in the NUA-amended leachate for almost 200 days. From approximately day 300 until the cessation of the field trial after 1,357 days, average B concentrations are generally between 0.05 and 0.2 mg/L and describe a similar concentration profile in both the control and NUA-amended leachates.
Average Ba concentrations were below detection limits for the first ca. 100 days of the field trial in both the control and NUA-amended leachates. In general both the control and NUA-amended leachates had a similar concentration profile, generally between 0 – 150 μg/L and up to ca. 350 μg/L in the control leachate (Figure 12v).
Average Cr concentrations attained a maximum of 0.4 and 0.35 mg/L in the control and NUA-amended leachates, respectively, 106 days after the commencement of the field trial (Figure 12y). Both the control and NUA-amended leachates had a similar pattern of average concentrations and did not exceed 0.05 mg/L for the last ca. 900 days of the field trial.
The average concentration of F in the NUA-amended leachate increased from <0.1 mg/L to a maximum of 1.2 mg/L approximately 550 days after the commencement of the field trial (Figure 12aa). Thereafter, the average F concentration was irregular with a maximum of ca. 1.5 - 2 mg/L in both leachates attained in the last 50 days of the trial. Average concentrations of F in the control soil leachate were, depending on the stage of the field trial, both higher and lower than that of the NUA-amended leachate. In general, there was an increase in baseline concentrations in both NUA-amended and control leachates as the field trial progressed.
Relatively little Rb (<20 μg/L) was present in either the control or NUA-amended leachate in the first 300 days of the field trial (Figure 12ae). Thereafter, there are intermittent peaks in the average NUA-amended leachate concentration up to ca. 140 μg/L. After around day 450 to the cessation of the field trial at 1,357 days both the control and NUA-amended leachates displayed a similar concentration profile.
Average Se concentrations were at or near detection limits for the first 480 days of the field trial (Figure 12ag). Average Se concentrations then increased in a similar manner in both the control and NUA-amended leachates to maxima of ca. 5 and 6 μg/L, respectively, after 1,275 days.
Average Sr concentrations in the NUA-amended leachates had a similar temporal profile to that of Ba (Figure 12ah, Figure 12v) with a maximum Sr concentration attained after 109 days. The average Sr concentration in the control leachate also displayed a similar pattern to that of Ba, however, was generally between 2 – 10 times less than that of the NUA-amended leachate Sr. The Sr concentration profiles and relative proportions are also similar to that displayed by Ca (Figure 12e).
Average Th concentrations were generally low (<0.5 μg/L) and follow a similar temporal profile in both the control and NUA-amended leachates (Figure 12ai). The maximum Th concentration in both the control and NUA-amended soil leachates of ca. 3 and ca. 1 μg/L, respectively, occurred on day 279 of the field trial with intermittent increase in concentration until the end of the trial on day 1,357.

Investigation of Mineral-Based By-Product Use as a Soil Amendment: Results from the Bullsbrook Turf Farm, WA 23
Average U concentrations were generally low, rarely exceeding 0.2 μg/L in either the control or NUA-amended soil leachates (Figure 12ak). The highest average dissolved U concentration of 0.9 μg/L occurred on day 847 in the control leachate with a similar concentration in the NUA-leachate.
Average Zn concentrations generally varied between 0.05 and 0.3 mg/L in both the control and NUA-amended leachates (Figure 12am). The highest average Zn concentrations of ca. 0.5 mg/L occurred in the NUA-amended leachate on day 847; however, on occasions the control soil leachate concentrations could be 2 – 3 times that of the NUA-amended soil leachates.

Investigation of Mineral-Based By-Product Use as a Soil Amendment: Results from the Bullsbrook Turf Farm, WA 24
Figure 12. Physico-chemical parameters, lysimeter flux and major and trace element geochemistry of control and NUA-amended soil leachates.
a
3
4
5
6
7
8
9
0 200 400 600 800 1000 1200 1400Days
pH
pH
pH*
b
0
1
2
3
4
5
6
7
8
0 200 400 600 800 1000 1200 1400Days
EC (m
S/cm
)
EC
EC*
c
0
200
400
600
800
1000
1200
0 200 400 600 800 1000 1200 1400Days
Na
(mg/
L)
Na
Na*
d
0
50
100
150
200
250
300
0 200 400 600 800 1000 1200 1400Days
K (m
g/L)
K
K*
e
0
200
400
600
800
1000
1200
1400
0 200 400 600 800 1000 1200 1400Days
Ca
(mg/
L)Ca
Ca*
f
0
50
100
150
200
250
300
0 200 400 600 800 1000 1200 1400Days
Mg
(mg/
L)
Mg
Mg*

Investigation of Mineral-Based By-Product Use as a Soil Amendment: Results from the Bullsbrook Turf Farm, WA 25
Figure 12 (cont’d). Physico-chemical parameters, lysimeter flux and major and trace element geochemistry of control and NUA-amended soil leachates.
g
0
200
400
600
8001000
1200
1400
1600
1800
0 200 400 600 800 1000 1200 1400Days
Cl (
mg/
L)
Cl
Cl*
h
0
500
1000
1500
2000
2500
3000
3500
0 200 400 600 800 1000 1200 1400Days
SO4-
S (m
g/L)
SO4_S
SO4_S*
i
0
20
40
60
80
100
120
140
0 200 400 600 800 1000 1200 1400Days
Alka
linity
(mg/
L C
aCO
3)
AlkalinityAlkalinity*
j
0123456789
10
0 200 400 600 800 1000 1200 1400Days
Si (m
g/L)
Si
Si*
k
0
0.5
1
1.5
2
2.5
0 200 400 600 800 1000 1200 1400Days
Fe (m
g/L)
Fe
Fe*
l
0.00
0.10
0.20
0.30
0.40
0.50
0 200 400 600 800 1000 1200 1400Days
Mn
(mg/
L)
Mn
Mn*

Investigation of Mineral-Based By-Product Use as a Soil Amendment: Results from the Bullsbrook Turf Farm, WA 26
Figure 12 (cont’d). Physico-chemical parameters, lysimeter flux and major and trace element geochemistry of control and NUA-amended soil leachates.
m
0.0
2.0
4.0
6.0
8.0
10.0
12.0
0 200 400 600 800 1000 1200 1400Days
P-PO
4 (m
g/L)
P-PO4
P-PO4*
n
0
10
20
30
40
0 200 400 600 800 1000 1200 1400Days
N-N
H3
(mg/
L)
N-NH3
N-NH3*
o
0
20
40
60
80100
120
140
160
180
0 200 400 600 800 1000 1200 1400Days
N-N
O3
(mg/
L)
N-NO3
N-NO3*
p
0
50
100
150
200
250
0 200 400 600 800 1000 1200 1400Days
TIN
(mg/
L)
TIN
TIN*
q
0
5
10
15
20
25
30
0 200 400 600 800 1000 1200 1400Days
TKN
(mg/
L)
TKN
TKN*
r
0
2
4
6
8
0 200 400 600 800 1000 1200 1400Days
Flux
(L)
Lysimeter f lux
Lysimeter f lux*

Investigation of Mineral-Based By-Product Use as a Soil Amendment: Results from the Bullsbrook Turf Farm, WA 27
Figure 12 (cont’d). Physico-chemical parameters, lysimeter flux and major and trace element geochemistry of control and NUA-amended soil leachates.
s
0.0
0.5
1.0
1.5
2.0
2.5
3.0
3.5
0 200 400 600 800 1000 1200 1400Days
Al (m
g/L)
Al
Al*
t
0
1
2
3
4
5
6
7
0 200 400 600 800 1000 1200 1400Days
As (u
g/L)
As
As*
u
0.0
0.1
0.2
0.3
0.4
0.5
0.6
0 200 400 600 800 1000 1200 1400Days
B (m
g/L)
B
B*
v
0
50
100
150
200
250
300
350
400
0 200 400 600 800 1000 1200 1400Days
Ba (u
g/L)
Ba
Ba*
w
0
20
40
60
80
100
120
0 200 400 600 800 1000 1200 1400Days
Cd
(ug/
L)
Cd
Cd*
x
0
20
40
60
80
100
120
0 200 400 600 800 1000 1200 1400Days
Co
(ug/
L)
Co
Co*

Investigation of Mineral-Based By-Product Use as a Soil Amendment: Results from the Bullsbrook Turf Farm, WA 28
Figure 12 (cont’d). Physico-chemical parameters, lysimeter flux and major and trace element geochemistry of control and NUA-amended soil leachates.
y
0.00
0.05
0.10
0.15
0.200.25
0.30
0.35
0.40
0.45
0 200 400 600 800 1000 1200 1400Days
Cr (
mg/
L)
Cr
Cr*
z
0
0.01
0.02
0.03
0.04
0.05
0.06
0 200 400 600 800 1000 1200 1400Days
Cu
(mg/
L)
Cu
Cu*
aa
0
0.5
1
1.5
2
2.5
0 200 400 600 800 1000 1200 1400Days
F (m
g/L)
F
F*
ab
0
10
20
30
4050
60
70
80
90
0 200 400 600 800 1000 1200 1400Days
La (u
g/L)
La
La*
ac
0.00
0.05
0.10
0.15
0.20
0.25
0 200 400 600 800 1000 1200 1400Days
Ni (
mg/
L)
Ni
Ni*
ad
0.000
0.002
0.004
0.006
0.008
0.010
0 200 400 600 800 1000 1200 1400Days
Pb (m
g/L)
Pb
Pb*

Investigation of Mineral-Based By-Product Use as a Soil Amendment: Results from the Bullsbrook Turf Farm, WA 29
Figure 12 (cont’d). Physico-chemical parameters, lysimeter flux and major and trace element geochemistry of control and NUA-amended soil leachates.
ae
0
20
40
60
80
100
120
140
160
0 200 400 600 800 1000 1200 1400Days
Rb
(ug/
L)
Rb
Rb*
af
0
0.01
0.02
0.03
0.04
0.05
0.06
0 200 400 600 800 1000 1200 1400Days
Sc (m
g/L)
Sc
Sc*
ag
0
1
2
3
4
5
6
0 200 400 600 800 1000 1200 1400Days
Se (u
g/L)
Se
Se*
ah
0
2000
4000
6000
8000
10000
12000
14000
0 200 400 600 800 1000 1200 1400Days
Sr (u
g/L)
Sr
Sr*
ai
0.0
0.5
1.0
1.5
2.0
2.5
3.0
0 200 400 600 800 1000 1200 1400Days
Th (u
g/L)
Th
Th*
aj
0.00
0.01
0.02
0.03
0.04
0.05
0.06
0.07
0.08
0 200 400 600 800 1000 1200 1400Days
Ti (m
g/L)
Ti
Ti*

Investigation of Mineral-Based By-Product Use as a Soil Amendment: Results from the Bullsbrook Turf Farm, WA 30
Figure 12 (cont’d). Physico-chemical parameters, lysimeter flux and major and trace element geochemistry of control and NUA-amended soil leachates.
ak
0.000.100.200.300.400.500.600.700.800.901.00
0 200 400 600 800 1000 1200 1400Days
U (u
g/L)
U
U*
al
0.00
0.01
0.02
0.03
0.04
0.05
0.06
0 200 400 600 800 1000 1200 1400Days
V (m
g/L)
V
V*
am
0.00
0.10
0.20
0.30
0.40
0.50
0.60
0 200 400 600 800 1000 1200 1400Days
Zn (m
g/L)
Zn
Zn*

Investigation of Mineral-Based By-Product Use as a Soil Amendment: Results from the Bullsbrook Turf Farm, WA 31
3.2. Lysimeter geochemistry – estimated loss to groundwater for control and NUA-amended plots
An estimated flux rate to the groundwater has been calculated for the control and NUA-amended sites based on lysimeter geochemistry and leachate flux (Figure 13). These fluxes have been arranged in the order of increasing element flux in the NUA-amended soil leachates. The largest element fluxes from the NUA-amended site relative to the control site occurred from the alkali and alkaline earth cations such as Ca, Mg, Na and Sr and the major anions S (as SO4
2-) and CO32-,
HCO3-, and OH- (total alkalinity). In contrast, in the control site more substantial element fluxes
occur for elements such as P (as PO4), As (as AsO4), Cd, La, Th, Cr and N (as NH3).
A plot of the ratio of control to NUA-amended soil fluxes demonstrates that the NUA-amended soil leachates are enriched (in decreasing order) in S (as SO4), Sr, Ca, total alkalinity and Mg (Figure 14). In contrast control soil leachates are enriched relative to NUA-amended soil leachates (in decreasing order) in P (as PO4), La, As, Cd, TKN, N (as NH3), Cr, Th, Fe, Al, Pb, Si, Ti, Se, K, Rb, Na, V, Sc, Cu, Cl, U, Co, Ba, B, Ni, N (as NO3), Zn, F, and Mn. A summary of the elemental fluxes is presented in Table 3.
Average fluxes of PO4-P to the shallow groundwater measured over 1,357 days of the field trial are 0.7 and 26.6 kg/ha/yr for the NUA-amended and control sites, respectively. This equates to a net reduction of 97% in PO4-P in the amended leachate for the duration of the field trial.
In terms of nitrogen, both NH3-N and NO3-N are similarly reduced by 82% and 40%, respectively, in the NUA-amended soil leachates (Figure 13, Figure 14, Table 3). When expressed as TN, the average reduction is 82%. In addition to the nutrients, N and P, a geochemically diverse suite of metals and metalloids also display substantial reductions in the NUA-amended leachate, often for extended periods, relative to the control. The reasons for this are discussed further in Section 4.
Analysis of the cumulative PO4-P (mg/m2) flux in NUA-amended and control lysimeters (270 mg/m2 and 9,902 mg/m2, respectively, over 1,357 days) indicates a curve-linear accumulation rate with time (Figure 15). These cumulative plots emphasise the relative performance of NUA-amended and control soils in PO4-P retention.

Investigation of Mineral-Based By-Product Use as a Soil Amendment: Results from the Bullsbrook Turf Farm, WA 32
Figure 13. Lysimeter geochemistry – fluxes (kg/ha/year calculated using lysimeter geochemistry and leachate flux) for control and NUA-amended plots.
0.0001
0.001
0.01
0.1
1
10
100
1000
10000
U Th Cd As
La Pb
Co Cr
Cu
Rb Sc Ti V Ni
Mn
Ba Zn B Fe Al
P-P
O4 F
Se
N-N
H3
TKN TN Si
Sr
N-N
O3
TIN K
Mg
Alk
alin
ity Na Cl
Ca
S-S
O4
ANALYTE
FLU
X k
g/ha
/yr
Control
Amended

Investigation of Mineral-Based By-Product Use as a Soil Amendment: Results from the Bullsbrook Turf Farm, WA 33
Figure 14. Lysimeter geochemistry – ratio of control to amended fluxes (calculated using lysimeter geochemistry and leachate flux) for control and NUA-amended plots.
0.1
1
10
100
S-SO
4 Sr Ca
Alka
linity Mg
Mn F Zn
N-N
O3 Ni B Ba C
o U Cl
Cu
Sc V Na
TIN
Rb K Se Ti Si Pb Al Fe Th Cr
TN
N-N
H3
TKN Cd
As La
P-PO
4
ANALYTE
ENR
ICH
MEN
T/D
EPEL
ETI
ENRICHED IN CONTROL LEACHATE
ENRICHED IN NUA-AMENDED LEACHATE

Investigation of Mineral-Based By-Product Use as a Soil Amendment: Results from the Bullsbrook Turf Farm, WA 34
Figure 15. Accumulation of PO4-P in NUA-amended (pink) and control (blue) lysimeters expressed as loss (mg/m2) over the 1,357 days of the Bullsbrook Turf Farm field trial.
0
1000
2000
3000
4000
5000
6000
7000
8000
9000
10000
0 100 200 300 400 500 600 700 800 900 1000 1100 1200 1300 1400Days
Cum
ulat
ive
P-PO
4 (m
g/m
2)
P-PO4
P-PO4*

Investigation of Mineral-Based By-Product Use as a Soil Amendment: Results from the Bullsbrook Turf Farm, WA 35
Table 3. Summary of leachate fluxes (kg/ha/yr) for control and amended plots sorted in the order of an increasing percent change of control versus amended (final column).
Element Control Amended Percent change or species kg/ha/year kg/ha/year Control vs. Amended
SO4-S 1505 4810 -220 Sr 4.5 13.9 -211 Ca 719 1908 -165
Alkalinity 154 230 -50 Mg 156 185 -19 Mn 0.22 0.17 22 F 2.8 1.9 33
Zn 0.46 0.29 37 NO3-N 47.5 28.4 40
Ni 0.18 0.10 43 B 0.59 0.33 44
Ba 0.48 0.26 46 Co 0.01 0.01 47 U 0.0007 0.0003 48 Cl 2106 1092 48 Cu 0.09 0.05 50 Sc 0.11 0.05 51 V 0.12 0.06 51
Na 912 450 51 TIN 64.6 31.4 51 Rb 0.11 0.05 53 K 354 167 53
Se 6.2 2.7 56 Ti 0.13 0.05 60 Si 15.5 6.2 60 Pb 0.02 0.01 61 Al 1.98 0.60 70 Fe 1.70 0.46 73 Th 0.0016 0.0004 75 Cr 0.21 0.04 80 TN 27.8 5.0 82
NH3-N 17.1 3.0 82 TKN 19.5 3.4 83 Cd 0.008 0.001 86 As 0.019 0.002 88 La 0.029 0.003 91
PO4-P 26.6 0.7 97

Investigation of Mineral-Based By-Product Use as a Soil Amendment: Results from the Bullsbrook Turf Farm, WA 36
3.3. Gingin lysimeter geochemistry – time series of nutrients in harvested and transplanted control and NUA-amended plots
As described previously, turf grown on both control and NUA-amended soils was transferred to the administrative area of Iluka’s Gingin mineral sand mining operations. Results for the nutrients collected in the lysimeter leachate are presented in Figure 16a - af. Major and trace element results are not shown in this report but do follow similar trends and have similar concentration ranges to those waters collected during the original establishment of the control and NUA-amended turf grown at the Bullsbrook Turf Farm.
Concentrations of dissolved P displayed a similar temporal profile in both the leachates collected beneath the transplanted control and NUA-amended turf (Figure 16a). At all stages the control leachate concentrations were higher which resulted in approximately 2.8 times more P being exported within the leachates during the 209 days of the Gingin trial.
Both NH3-N and NO3-N and hence, TIN displayed more complex concentration profiles in both the control and NUA-amended leachates (Figure 16b-d). Over the course of the trial, however, fluxes of NH3-N and NO3-N and TIN in the control leachates were approximately 3.3, 1.3 and 1.7 times higher, respectively, than in the NUA-amended leachates.
The pH profile in the control and experimental leachates was very similar, varying between approximately 6 and 8 (Figure 16e). In contrast, lysimeter fluxes varied substantially beneath the transplanted control and experimental turf. Lysimeter fluxes beneath the control turf varied between approximately 8 and 12 L per collection period, while those in those beneath the experimental turf were between approximately 0 and 8 L. Thus, the loss of leachate (and associated nutrients) was approximately 1.7 times greater beneath the transplanted control turf. This is similar to the ratio at the Bullsbrook Turf Farm site of approximately 1.8.

Investigation of Mineral-Based By-Product Use as a Soil Amendment: Results from the Bullsbrook Turf Farm, WA 37
Figure 16. pH, nutrient geochemistry and lysimeter flux of control (blue) and NUA-amended (red) soil leachates from turf transferred to Iluka’s Gingin site.
a
0.00
0.05
0.10
0.15
0.20
0.25
0.30
0 50 100 150 200 250Days
P-PO
4 (m
g/L)
P-PO4
P-PO4*
b
0.0
0.5
1.0
1.5
2.0
0 50 100 150 200 250Days
N-N
H3
(mg/
L)
N-NH3
N-NH3*
c
0
1
2
3
4
5
6
0 50 100 150 200 250Days
N-N
O3
(mg/
L) N-NO3
N-NO3*
d
0
1
2
3
4
5
6
7
0 50 100 150 200 250Days
TIN
(mg/
L)
TIN
TIN*
e
6.0
6.5
7.0
7.5
8.0
0 50 100 150 200 250Days
pH
pH
pH*
f
0
2
4
6
8
10
12
14
0 50 100 150 200 250Days
Flux
(L)
Lysimeter f lux
Lysimeter f lux*

Investigation of Mineral-Based By-Product Use as a Soil Amendment: Results from the Bullsbrook Turf Farm, WA 38
3.4. Bullsbrook trial, soils, NUA and fertilizer – major and trace element geochemistry
A summary of the average major and trace element geochemistry of the pre-amended, control, and post NUA-amended soils, NUA, the Post Archaean Australian Shale (PAAS) (Taylor and McLennan, 1985), and fertilizer are given in Table 4. Both the pre-amended soil (prior to amendment with NUA) and the control soil had a very similar composition with SiO2 >98%, indicative of the high quartz content of the soil (Bassendean Sand). Apart from a small amount of Al2O3 (0.11–0.17%) and Fe2O3 (0.39–0.42%), other major element concentrations were low. Similarly, trace elements were generally impoverished in the pre-amended and control soils, with the only trace element enrichments of note being Cr, Zr and the light rare earth elements (LREE - La, Ce, Pr). Total N in Bullsbrook soils was low (0.02 – 0.03%).
The geochemistry of the NUA is dominated by the presence of five major elements (expressed as oxides): Fe2O3, CaO, SO3 and to a lesser extent TiO2 and SiO2 (Table 4). Collectively these four oxides constitute over 87.6% of the mass of the NUA. Trace elements that display some enrichment (≥2 times) in the NUA, particularly when compared to the pre-amended and control soils include V, Ni, Cu, Zn, Ga, As, Se, Sr, Y, Nb, Ce, Tl, Pb, Bi and Th. Elements in the NUA depleted relative to the pre-amended and control soils include Cr, Mo, Sn, Ba and Nd. A small uncertainty exists in the robustness of Co, Zr and the LREE, particularly in the NUA sample potentially due to matrix effects in the XRF analysis . Total N in NUA was low (0.03%).
The PAAS is commonly used as an estimate of the average major and trace element geochemistry of the continental crust. In comparison to the PAAS, the pre-amended/control soils are highly enriched in SiO2 and largely impoverished in all other major and trace elements (Table 4). In contrast, the NUA-amended soils, which display a hybrid composition of the control/pre-amended soils and the NUA in the proportion of approximately 90-95%:5-10% by mass, respectively, have a major and trace element composition more similar to that of the PAAS.
The geochemical analysis of the Nitrophoska Blue fertilizer indicated it is principally composed of K2O, P2O5, CaO, SO3, Cl, Fe2O3 and TN. These components constituted over 78% of the mass of the fertilizer. Trace element enrichments are common in the fertilizer relative to both the NUA and the pre-amended and control soils. Enrichments of note were Cu, Zn, Br, Cd, I and U.

Investigation of Mineral-Based By-Product Use as a Soil Amendment: Results from the Bullsbrook Turf Farm, WA 39
Table 4. Major (%) and trace (μg/g) element geochemistry of pre-amended, control and post NUA-amended soils, Post Archean Australian Shale (PAAS), NUA and fertilizer.
Element Pre-amended Control NUA-amended PAAS NUA Fertilizer SiO2 98.21 98.13 82.13 62.80 3.64 0.64 Al2O3 0.11 0.17 1.30 18.90 0.38 0.28 Fe2O3 0.39 0.42 4.18 7.22 19.30 3.11 MgO 0.00 0.00 0.18 2.20 1.33 0.30 CaO 0.07 0.06 3.22 1.30 21.41 7.01 Na2O 0.00 0.00 0.01 1.20 0.41 1.21 K2O 0.00 0.00 0.03 3.70 0.13 17.89 P2O5 0.07 0.08 0.45 0.16 1.17 14.19 MnO 0.00 0.00 0.03 0.11 3.23 0.04 TiO2 0.00 0.00 0.60 1.00 1.50 0.04 SO3 0.02 0.02 2.43 n/a 30.46 19.60 Cl 0.00 0.00 0.04 n/a 0.20 5.30 TN 0.03 0.02 0.03 n/a <0.02 10.66
TOTAL 98.90 98.92 94.61 98.59 83.16 80.26 V 9 9 27 150 71 48 Cr 287 287 158 110 80 83 Co < 2.0 < 2.0 16 23 172 < 2.0 Ni 16 15 19 55 90 4 Cu 3 2 14 50 44 56 Zn 3 3 13 85 30 232 Ga 1 1 4 20 26 0 Ge < 0.4 < 0.4 < 0.4 n/a < 0.4 0.5 As < 0.4 < 0.4 0.4 n/a 10 < 0.4 Se 1 2 2 n/a 5.4 2 Br 2 2 7 n/a <2 247 Rb 2 3 5 160 6 28 Sr 7 9 133 200 725 115 Y 5 6 13 27 19 34 Zr 72 69 263 210 16 20 Nb 8 10 17 19 17 6 Mo 14 17 8 1 3 14 Ag 0.3 0.3 0.3 n/a 0.3 0.4 Cd 0.5 0.6 0.4 n/a <0.1 1.4 Sn 2 2 1 4 3 1 Sb < 0.8 < 0.8 < 0.8 n/a 0.4 2 Te n/a n/a n/a n/a <0.1 n/a I 1 1 1 n/a 1 4
Cs 3 5 2 15 1 1 Ba 21 24 13 650 38 18 La 30 34 26 38 35 11 Ce 39 41 54 80 95 14 Yb 1 1 1 2.8 1 1 Hf 0 1 8 5 1 4 Hg 1 2 1 n/a <0.01 1 Tl 3 3 4 n/a 0.07 4 Pb 3 5 13 20 21 9 Bi 1 3 5 0.25 0.03 1 Th 7 9 34 14 112 15 U < 0.9 < 0.9 < 0.9 3 6 19

Investigation of Mineral-Based By-Product Use as a Soil Amendment: Results from the Bullsbrook Turf Farm, WA 40
3.5. Bullsbrook turf – major and trace element geochemistry A summary of major (as wt% oxides) and trace element (as µg/g) geochemistry of two harvests of Bullsbrook turf (leaves and runners only) from the control and NUA-amended plots is presented in Table 5.
A comparison of the composition of turf cultivated on the NUA-amended and control soils suggests a similar composition occurs irrespective of the soil substrate although there is some variability within and between turf types with relative element enrichments or depletions generally <10%. The only exceptions are SiO2 which is relatively enriched (perhaps due to minor adhering sand) in the second control and NUA-amended samples. A range of other major elements and some trace elements are also sometimes enriched in the second control and NUA-amended samples relative to the first harvested samples (Table 5).
Concentration ranges of MnO are similar in the control turf (0.013 – 0.020%) to that of the NUA-amended turf (0.007 – 0.037%). The second control turf sample has the highest Cr, Ni, Zn, Ge and Sn while the first harvested control turf sample has measurable concentrations of the light rare earth elements La, Ce and Pr. Both Th (6.8 – 7.7 µg/g) and U (all <0.9 µg/g) concentrations are similar in both turf types. Concentrations of Pb (1.6 – 2.3 µg/g) are similar in both turf types. Cadmium is detectable in both control turf samples (0.4 – 0.6 µg/g) relative to the NUA-amended turf samples (both <0.5 µg/g).

Investigation of Mineral-Based By-Product Use as a Soil Amendment: Results from the Bullsbrook Turf Farm, WA 41
Table 5. Major (%) and trace (μg/g) element geochemistry of the first turf harvested during growth from the Bullsbrook control and NUA-amended sites.
Element units Control 1 Control 2 NUA 1 NUA 2 SiO2 % 0.47 5.49 0.31 3.04 Al2O3 % 0.01 0.08 0.01 0.07 Fe2O3 % 0.08 0.22 0.02 0.15 MgO % 0.02 0.19 0.13 0.17 CaO % 0.56 0.51 0.57 0.64 Na2O % 0.96 1.16 1.05 1.23 K2O % 2.85 3.03 2.68 3.43 P2O5 % 0.43 0.78 0.62 0.61 MnO % 0.020 0.013 0.007 0.037 TiO2 % 0.004 0.021 0.004 0.022 SO3 % 0.47 0.35 0.23 0.48 Cl % 1.57 1.75 1.64 1.94
TOTAL % 7.44 13.60 7.27 11.83 V µg/g < 15 < 15 < 15 < 15 Cr µg/g < 5 99 < 5 15 Co µg/g < 2.0 < 2.0 < 2.0 < 2.0 Ni µg/g < 0.8 30 < 0.8 < 0.8 Cu µg/g 7 10 < 0.6 12 Zn µg/g 38 42 29 39 Ga µg/g < 0.5 < 0.5 < 0.5 < 0.5 Ge µg/g < 0.4 0.5 < 0.4 < 0.4 As µg/g < 0.4 < 0.4 < 0.4 < 0.4 Se µg/g 0.6 < 0.4 1.5 0.6 Br µg/g 80 34 91 48 Rb µg/g 13 10 11 12 Sr µg/g 38 36 31 43 Y µg/g 6 6 7 7 Zr µg/g 11 25 12 31 Nb µg/g 10 8 10 8 Mo µg/g 16 <0.5 17 <0.5 Ag µg/g < 0.5 < 0.5 < 0.5 < 0.5 Cd µg/g 0.6 0.4 < 0.3 < 0.3 In µg/g < 0.5 < 0.5 < 0.5 1.0 Sn µg/g < 0.5 2 < 0.5 0.8 Sb µg/g < 0.8 < 0.8 < 0.8 < 0.8 Te µg/g < 1.0 < 1.0 < 1.0 < 1.0 I µg/g < 1.5 < 1.5 < 1.5 < 1.5
Cs µg/g < 1.5 < 1.5 < 1.5 < 1.5 Ba µg/g 14 13 11 8 La µg/g 11 < 2.0 < 2.0 < 2.0 Ce µg/g 14 < 2.5 < 2.5 < 2.5 Pr µg/g 45 < 3.0 19 < 3.0 Nd µg/g < 3.0 < 3.0 < 3.0 < 3.0 Sm µg/g < 2.0 < 2.0 < 2.0 < 2.0 Yb µg/g < 2.0 < 2.0 < 2.0 < 2.0 Hf µg/g 0.7 0.4 0.2 0.2 Ta µg/g < 1.5 < 1.5 < 1.5 < 1.5 W µg/g < 1.5 < 1.5 < 1.5 < 1.5 Hg µg/g < 1.5 < 1.5 < 1.5 < 1.5 Tl µg/g 3.3 2.0 2.4 < 1.5 Pb µg/g 2.3 2.2 2.1 1.6 Bi µg/g < 1.5 < 1.5 < 1.5 < 1.5 Th µg/g 7.5 6.8 6.8 7.7 U µg/g < 0.9 < 0.9 < 0.9 < 0.9

Investigation of Mineral-Based By-Product Use as a Soil Amendment: Results from the Bullsbrook Turf Farm, WA 42
3.6. Mineralogy The mineralogy of the soil at the Bullsbrook Turf Farm trial site and the NUA applied to the trial site is summarised in Table 6, and in Figure 17 and Figure 18. The soils at the Bullsbrook trial site are a unit of the Bassendean Sand. Hence, these soils are predominantly composed of quartz with only traces of halite and calcite. In contrast, the NUA is principally composed of gypsum with minor quartz and magnetite. Gilkes et al. (1994) also conducted extensive mineralogical analysis on NUA (then termed NAEW). Their study identified the principal mineralogy to be gypsum, calcite, magnetite and haematite. Transmission electron microscopy (TEM) studies also conducted at this time identified the NUA (NAEW) as consisting of both acicular crystals and anhedral plates of 0.1-2 μm in size often occurring as aggregates with a surface area of ca. 40 m2/g.
Table 6. Quantitative X-ray diffraction (XRD) analysis of trial soil (Bassendean Sand) and NUA.
Sample Quartz Calcite Halite Gypsum Hematite Magnetite Trial soil 99.5 0.2 0.1 - 0.2 - NUA Sept 2008 6.7 - - 86.1 - 7.2
46- 1045 QUARTZ, SYN 5- 628 HALITE, SYN 5- 586 CALCITE, SYN 33- 664 HEMATITE, SYN
File Name: c:\...\x'pert~1\25535.xpt
Bassendean Sand
2-Theta Angle (deg)10.00 20.00 30.00 40.00 50.00 60.00 70.00
9
18
27
36
45
Inte
nsity
(Cou
nts)
X 1
000
4.258
3.691
3.344
3.251 3.029 2.8222.699 2.527
2.458 2.282
2.2362.129
1.980
1.819
1.695
1.6721.660
1.610
1.542
1.4541.419
Figure 17. X-ray diffraction spectrum of soil (Bassendean Sand) from the Bullsbrook Turf Farm trial site.

Investigation of Mineral-Based By-Product Use as a Soil Amendment: Results from the Bullsbrook Turf Farm, WA 43
46- 1045 QUARTZ, SYN 33- 311 GYPSUM, SYN 19- 629 MAGNETITE, SYN
File Name: c:\...\x'pert~1\25537.xpt
NUA Sep 2008
2-Theta Angle (deg)10.00 20.00 30.00 40.00 50.00 60.00 70.00
8
16
24
32
40
Inte
nsity
(Cou
nts)
X 1
00
7.614
4.741
4.281
3.800
3.343
3.2463.173
3.065
2.969
2.874
2.786
2.683
2.593
2.532
2.493
2.453
2.405 2.281
2.218
2.0862.075
2.0451.9941.952
1.899
1.878
1.867
1.812
1.797
1.778
1.714
1.6851.6651.649
1.620
1.5831.5421.520
1.483
1.459
1.439
1.4181.402
Figure 18. X-ray diffraction spectrum of NUA.
3.7. Geochemical modelling – background Geochemical modelling of the Bullsbrook lysimeter leachates from control and NUA-amended sites was undertaken using PHREEQC for Windows V1.5.10 (Parkhurst, 1995). The PHREEQC calculations involved calculation of the saturation index (SI) of selected mineral phases, in particular, those of Al and Fe minerals. Both Al and Fe minerals were modelled as it is likely that minerals formed from these two elements will also strongly influence the speciation of the majority of other major and trace elements in the Bullsbrook lysimeter leachates over a wide range of pH.
The saturation index (SI) for a given mineral is defined as:
SI = log IAP/Ksp
where IAP = ion activity product of the chemical species involved in the reaction, and
Ksp = the solubility product for the designated mineral
The SI gives an estimation of the degree of over- (SI > 0), under- (SI < 0) or equilibrium (SI = 0) saturation of a particular mineral phase for the prevailing leachate chemistry. The SI is commonly plotted as a function of solution pH to examine the effect of pH on mineral equilibria and hence, saturation/solubility. Solubilities for Al and Fe minerals containing sulfate were calculated in the presence of gypsum (CaSO4) as a solubility-controlling phase. Plots of saturation indices and pH for the Bullsbrook lysimeters are shown in Figure 19a - q. Preliminary solubility calculations suggested that this boundary condition was satisfied for the NUA-amended soil leachates where

Investigation of Mineral-Based By-Product Use as a Soil Amendment: Results from the Bullsbrook Turf Farm, WA 44
leachate chemistry remained close to gypsum equilibrium over a wide range of pH (Figure 19j). This was expected given the high gypsum content of the NUA amendment. Also modelled were a range of other non-Fe- and Al-mineral phases (e.g. calcite) likely to be influential in regulating the major ion chemistry of the Bullsbrook lysimeter leachates.
3.8. Saturation of specific mineral species in Bullsbrook lysimeter leachates
Results of the SI modelling for Fe-bearing minerals in Bullsbrook Turf Farm lysimeter leachates generally displayed a linear trend of increasing SI with pH (Figure 19a – e). In general, both the NUA-amended and control leachates displayed a similar degree of saturation at a given pH. The modelling results suggest that ferrihydrite (Fe(OH)3) was strongly oversaturated over approximately pH 7 and goethite remained strongly oversaturated over approximately pH 5. Of the jarosites, K-jarosite (KFe3(SO4)2(OH)6) displayed some oversaturation for both NUA-amended and unamended soil leachates, while Na-jarosite (NaFe3(SO4)2(OH)6) was always undersaturated. Schwertmannite (Fe8O8(OH)6SO4) in both unamended and NUA-amended soil leachates increased from high under- to oversaturation with increasing pH. At the higher pH there was considerable variability in the calculated SI relative to other Fe-bearing minerals.
Results of the modelling of the SI for Al-bearing minerals indicated that these minerals had a convex saturation pattern with maxima in estimated SI generally occurring between pH 5.5 and 6.5. In general, both the NUA-amended and control leachates displayed a similar degree of saturation at a given pH. Alunite (KAl3(SO4)2(OH)6), basaluminite (Al4SO4(OH)10.5H2O) and gibbsite (Al(OH)3) changed from under- to oversaturation as a function of pH (Figure 19f-h). Modelling results suggested that jurbanite (AlOHSO4) was undersaturated over all pH (Figure 19i).
Gypsum (CaSO4·2H2O) remained in equilibrium with solution for the NUA-amended soil leachates as a boundary condition of the solubility calculations. As noted above, this was reflected in actual model estimates of gypsum solubility in the NUA-amended soil leachates. In the control soil leachates, gypsum was undersaturated for all samples over a wide range of pH. Of the other non Fe- and Al-bearing minerals, calcite (CaCO3), fluorite (CaF2) and hydroxyapatite (Ca5[PO4]3OH) displayed a trend of increasing SI with pH. Both calcite and hydroxyapatite typically became oversaturated above a pH 7 - 7.5. Fluorite did not become saturated in the control soil leachates, while it was near or slightly over saturation for a number of the NUA-amended soil leachates.
The SI of the Mn minerals rhodochrosite (MnCO3), pyrolusite (MnO2) and manganite (MnOOH) are plotted in Figure 19n – p. All remained undersaturated; however, rhodochrosite approached saturation at the highest pH (ca. 8) in the NUA-amended soil leachates.
Amorphous silica (SiO2 (am), Figure 19q) was undersaturated in both the control and NUA-amended soil leachates at all pH. The degree of undersaturation generally increased with increasing pH in both control and NUA-amended soil leachates.

Investigation of Mineral-Based By-Product Use as a Soil Amendment: Results from the Bullsbrook Turf Farm, WA 45
Figure 19. Geochemical modelling of Bullsbrook Turf Farm lysimeter leachates - Fe-minerals.
a
3.5 4.0 4.5 5.0 5.5 6.0 6.5 7.0 7.5 8.0 8.5-10
-9
-8
-7
-6
-5
-4
-3
-2
-1
0
1
2
3
4
SI
pH
Ferrihydrite control Ferrihydrite amended
b
3.5 4.0 4.5 5.0 5.5 6.0 6.5 7.0 7.5 8.0 8.5-3
-2
-1
0
1
2
3
4
5
6
7
8
9
10
SI
pH
Goethite controlGoethite amended
c
3.5 4.0 4.5 5.0 5.5 6.0 6.5 7.0 7.5 8.0 8.5-25
-20
-15
-10
-5
0
5
SI
pH
K-jarosite control K-jarosite amended
d
3.5 4.0 4.5 5.0 5.5 6.0 6.5 7.0 7.5 8.0 8.5-30
-25
-20
-15
-10
-5
0
5
SI
pH
Na-jarosite control Na-jarosite amended
e
3.5 4.0 4.5 5.0 5.5 6.0 6.5 7.0 7.5 8.0 8.5-60
-50
-40
-30
-20
-10
0
10
20
30
40
SI
pH
Schwertmannite control Schwertmannite amended

Investigation of Mineral-Based By-Product Use as a Soil Amendment: Results from the Bullsbrook Turf Farm, WA 46
Figure 19 (cont’d). Geochemical modelling of Bullsbrook Turf Farm lysimeter leachates - Al-minerals.
f
3.5 4.0 4.5 5.0 5.5 6.0 6.5 7.0 7.5 8.0 8.5-4
-2
0
2
4
6
SI
pH
Alunite control Alunite amended
g
3.5 4.0 4.5 5.0 5.5 6.0 6.5 7.0 7.5 8.0 8.5-12
-10
-8
-6
-4
-2
0
2
4
6
SI
pH
Basaluminite controlBasaluminite amended
h
3.5 4.0 4.5 5.0 5.5 6.0 6.5 7.0 7.5 8.0 8.5
-3
-2
-1
0
1
2
3
SI
pH
Gibbsite control Gibbsite amended
i
3.5 4.0 4.5 5.0 5.5 6.0 6.5 7.0 7.5 8.0 8.5-6
-5
-4
-3
-2
-1
0
SI
pH
Jurbanite control Jurbanite amended

Investigation of Mineral-Based By-Product Use as a Soil Amendment: Results from the Bullsbrook Turf Farm, WA 47
Figure 19 (cont’d). Geochemical modelling of Bullsbrook Turf Farm lysimeter leachates - Ca-minerals.
j
3.5 4.0 4.5 5.0 5.5 6.0 6.5 7.0 7.5 8.0 8.5-3.5
-3.0
-2.5
-2.0
-1.5
-1.0
-0.5
0.0
0.5
SI
pH
Gypsum control Gypsum amended
k
3.5 4.0 4.5 5.0 5.5 6.0 6.5 7.0 7.5 8.0 8.5
-5
-4
-3
-2
-1
0
1
SI
pH
Calcite control Calcite amended
l
3.5 4.0 4.5 5.0 5.5 6.0 6.5 7.0 7.5 8.0 8.5
-6
-5
-4
-3
-2
-1
0
1
SI
pH
Fluorite Control Fluorite Amended
m
3.5 4.0 4.5 5.0 5.5 6.0 6.5 7.0 7.5 8.0 8.5-20
-15
-10
-5
0
5
10
SI
pH
Hydroxyapatite controlHydroxyapatite amended

Investigation of Mineral-Based By-Product Use as a Soil Amendment: Results from the Bullsbrook Turf Farm, WA 48
Figure 19 (cont’d). Geochemical modelling of Bullsbrook Turf Farm lysimeter leachates - Mn minerals and SiO2(a).
n
3.5 4.0 4.5 5.0 5.5 6.0 6.5 7.0 7.5 8.0 8.5-26
-24
-22
-20
-18
-16
-14
-12
-10
-8
SI
pH
Pyrolusite control Pyrolusite amended
o
3.5 4.0 4.5 5.0 5.5 6.0 6.5 7.0 7.5 8.0 8.5-6
-5
-4
-3
-2
-1
0
SI
pH
Rhodochrosite control Rhodochrosite amended
p
3.5 4.0 4.5 5.0 5.5 6.0 6.5 7.0 7.5 8.0 8.5-20
-18
-16
-14
-12
-10
-8
-6
-4
-2
0
SI
pH
Manganite control Manganite amended
q
3.5 4.0 4.5 5.0 5.5 6.0 6.5 7.0 7.5 8.0 8.5-3.0
-2.5
-2.0
-1.5
-1.0
-0.5
0.0
SI
pH
SiO2(a) control SiO2(a) amended

Investigation of Mineral-Based By-Product Use as a Soil Amendment: Results from the Bullsbrook Turf Farm, WA 49
3.9. Sr-Nd isotope geochemistry Radiogenic isotopes in the Nd as (143Nd/144Nd), Sr (87Sr/86Sr) and Pb (e.g. 207Pb/204Pb) systems have extremely long half-lives. Hence, the isotopic ratios are effectively stable over the relative short time of mixing of soil, NUA and fertilizer, and subsequent leaching and potential plant uptake, and can be used as a tracer for these processes. Thus, Nd and Sr isotopes (and stable Pb isotopes) represent a powerful tool to identify the source and relative contribution of these elements.
The Sr and Nd isotope geochemistry (as 143Nd/144Nd versus 87Sr/86Sr) of the NUA-amended and control soils, fertilizer, NUA and the control and amended turf, NUA and control and lysimeter leachates and irrigation water used in turf production are summarised in Table 7 and Figure 20. Theoretical mixing lines between key end members in the Sr-Nd isotopic system such as between fertilizer and NUA and control soils and NUA are also plotted.
0.706
0.708
0.710
0.712
0.714
0.716
0.718
0.720
0.722
0.5112 0.5114 0.5116 0.5118 0.5120 0.5122 0.5124 0.5126143Nd/144Nd
87S
r/86S
r
NUANUA-amended SoilTurf NUALysimeter NUAControl SoilTurf ControlLysimeter ControlFertilizerIrrigation WaterFertiliser-NUAFertiliser-Control SoilFertiliser-Irrigation WaterNUA-Control Soil
Figure 20. 143Nd/144Nd versus 87Sr/86Sr isotope geochemistry of the NUA-amended and control soils, fertilizer, NUA, control and NUA-amended turf, NUA and control lysimeter leachates (both grouped in ellipses) and irrigation water.
Control soils had the highest 87Sr/86Sr of approximately 0.718-0.722 and the greatest internal Sr isotope variation. After mixing with the NUA, which had a comparatively high Sr concentration of 725 μg/g as compared to 9 μg/g in the control soil, the NUA amended soil had a 87Sr/86Sr ratio close to that of the NUA (Table 7). There was a similar 143Nd/144Nd isotopic ratio in both the NUA and control soils of between approximately 0.5112 and 0.5114 such that there was little change in

Investigation of Mineral-Based By-Product Use as a Soil Amendment: Results from the Bullsbrook Turf Farm, WA 50
the amended soil after the addition of the NUA. In comparative terms, the fertilizer had a high 143Nd/144Nd ratio of approximately 0.5124 and the lowest 87Sr/86Sr ratio of 0.708, with little internal isotopic variation. Nonetheless, as fertilizer is a blend of ingredients it is possible that internal isotopic variation was present in individual components. Irrigation waters used in overhead sprinklers and collected over approximately two years had only a small degree of internal Sr and Nd isotopic variation with a composition of approximately 0.716 and 0.5114, respectively (Figure 20).
Turf grown on the control soils occurred above a theoretical fertilizer-irrigation water mixing line (higher 87Sr/86Sr ratio and/or 143Nd/144Nd isotopic ratio). Turf grown on the NUA-amended soil occurred adjacent to a theoretical mixing line between the fertilizer and NUA amended soil, consistent with mixing between these two Sr and Nd sources (Figure 20). The offset of the turf from the theoretical mixing line may relate to isotopic inhomogeneity in the fertilizer and incongruent dissolution of individual components giving rise to the observed signature. The estimated relative contributions of fertilizer and NUA-amended soil were approximately 10% and 90%, respectively.
Lysimeter leachates in the NUA-amended soils had a similar Sr and Nd isotopic composition to that of NUA/NUA-amended soils with potential contributions from both the irrigation water and fertilizer of between 10% and 100%. Lysimeter leachates in the control soils had a Sr and Nd isotopic composition consistent with derivation from irrigation water modified with a fertilizer signature, the latter component contributing ca. 5-10% with some contribution from irrigation water also possible.

Investigation of Mineral-Based By-Product Use as a Soil Amendment: Results from the Bullsbrook Turf Farm, WA 51
Table 7. Sr-Nd-Pb isotope geochemistry of the NUA-amended and control soils, fertilizer, NUA, the control and NUA-amended turf, NUA and control lysimeter leachates, irrigation water, Broken Hill ore and Perth atmospheric Pb sources.
Sample 143Nd/144Nd 87Sr/86Sr 206Pb/204Pb 207Pb/204Pb 208Pb/204Pb
Turf NUA 0.512211 0.71297 17.82 15.60 38.31
Turf Control 0.511561 0.71008 18.28 15.54 37.91
NUA 0.511457 0.70951 17.60 15.60 39.21
NUA 0.511461 0.70961 17.64 15.66 39.38
NUA 0.511448 0.70959 17.62 15.59 39.27
Fertilizer 0.512408 0.70780 21.72 15.76 38.34
Fertilizer 0.512415 0.70780 20.49 15.71 38.23
Fertilizer 0.512400 0.70774 21.47 15.52 37.79
Control Soil 0.511426 0.72164 20.01 15.95 40.48
Control Soil 0.511272 0.71787 21.31 16.28 40.67
Control Soil 0.511382 0.72002 24.18 16.45 42.64
NUA-amended Soil 0.511373 0.71093 19.55 15.87 40.83
NUA-amended Soil 0.511363 0.71099 19.97 16.01 41.63
NUA-amended Soil 0.511347 0.71098 20.78 16.06 41.43
NUA-amended Soil 0.511257 0.71122 19.60 15.94 41.45
Lysimeter Control 0.511403 0.71151 18.39 15.67 37.99
Lysimeter Control 0.511503 0.71249 18.35 15.65 37.86
Lysimeter Control 0.511385 0.71216 18.49 15.67 38.17
Lysimeter Control 0.511383 0.71456 18.10 15.63 37.88
Lysimeter Control 0.511437 0.71421 18.46 15.68 38.22
Lysimeter Control 0.511389 0.71465 18.21 15.64 38.08
Lysimeter NUA 0.511338 0.71168 17.91 15.61 37.77
Lysimeter NUA 0.511626 0.70980 18.11 15.62 37.55
Lysimeter NUA 0.511534 0.70979 18.50 15.67 37.54
Lysimeter NUA 0.511361 0.71020 17.82 15.58 37.65
Lysimeter NUA 0.511438 0.71016 17.94 15.60 37.83
Lysimeter NUA 0.511431 0.71020 17.72 15.58 37.63
Irrigation Water 0.511404 0.71632 17.06 15.52 37.10
Irrigation Water 0.511425 0.71601 17.00 15.52 37.06
Irrigation Water 0.511415 0.71658 - - -
Broken Hill - - 16.00 15.40 35.70
Perth Atmosphere - - 16.56 15.46 36.22
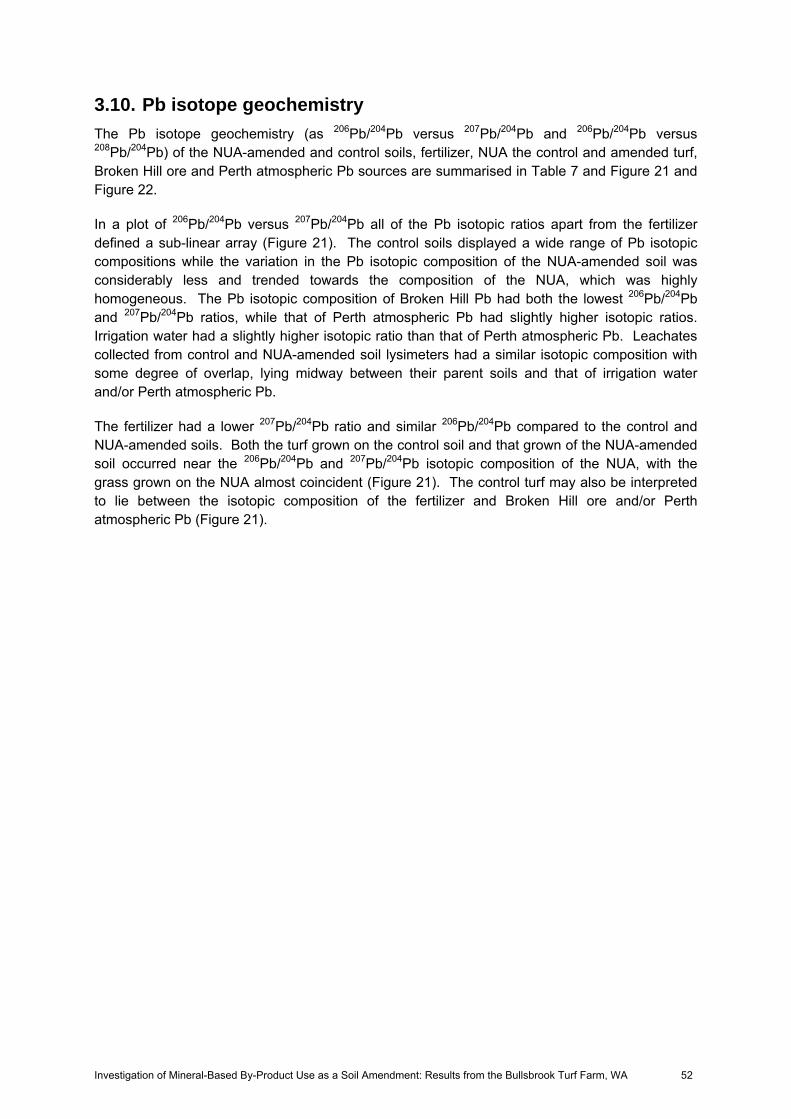
Investigation of Mineral-Based By-Product Use as a Soil Amendment: Results from the Bullsbrook Turf Farm, WA 52
3.10. Pb isotope geochemistry The Pb isotope geochemistry (as 206Pb/204Pb versus 207Pb/204Pb and 206Pb/204Pb versus 208Pb/204Pb) of the NUA-amended and control soils, fertilizer, NUA the control and amended turf, Broken Hill ore and Perth atmospheric Pb sources are summarised in Table 7 and Figure 21 and Figure 22.
In a plot of 206Pb/204Pb versus 207Pb/204Pb all of the Pb isotopic ratios apart from the fertilizer defined a sub-linear array (Figure 21). The control soils displayed a wide range of Pb isotopic compositions while the variation in the Pb isotopic composition of the NUA-amended soil was considerably less and trended towards the composition of the NUA, which was highly homogeneous. The Pb isotopic composition of Broken Hill Pb had both the lowest 206Pb/204Pb and 207Pb/204Pb ratios, while that of Perth atmospheric Pb had slightly higher isotopic ratios. Irrigation water had a slightly higher isotopic ratio than that of Perth atmospheric Pb. Leachates collected from control and NUA-amended soil lysimeters had a similar isotopic composition with some degree of overlap, lying midway between their parent soils and that of irrigation water and/or Perth atmospheric Pb.
The fertilizer had a lower 207Pb/204Pb ratio and similar 206Pb/204Pb compared to the control and NUA-amended soils. Both the turf grown on the control soil and that grown of the NUA-amended soil occurred near the 206Pb/204Pb and 207Pb/204Pb isotopic composition of the NUA, with the grass grown on the NUA almost coincident (Figure 21). The control turf may also be interpreted to lie between the isotopic composition of the fertilizer and Broken Hill ore and/or Perth atmospheric Pb (Figure 21).

Investigation of Mineral-Based By-Product Use as a Soil Amendment: Results from the Bullsbrook Turf Farm, WA 53
15.2
15.4
15.6
15.8
16.0
16.2
16.4
16.6
15 16 17 18 19 20 21 22 23 24 25206Pb/204Pb
207 P
b/20
4 Pb
NUANUA-amended SoilTurf NUALysimeter NUAControl SoilTurf ControlLysimeter Control FertilizerIrrigation WaterBroken Hill Pb orePerth atmospheric Pb
Figure 21. 206Pb/204Pb versus 207Pb/204Pb isotope geochemistry of the NUA-amended and control soils, fertilizer, NUA, the control and amended turf, Broken Hill ore and Perth atmospheric Pb sources.
As observed in the plot of 206Pb/204Pb versus 207Pb/204Pb isotopic ratios, a plot of 206Pb/204Pb versus 208Pb/204Pb Pb isotopic ratios apart from the fertilizer also defined a similar sub-linear array with similar associations amongst the control and NUA-amended soils, lysimeter leachates, turf types and Pb sources represented by Broken Hill ore and Perth atmospheric deposition (Figure 22). Similarly, the fertilizer had a lower 208Pb/204Pb ratio and similar 206Pb/204Pb compared to the control and NUA-amended soils. Both the turf grown on the control soil and that grown of the NUA-amended soil had a similar 206Pb/204Pb isotopic composition to the NUA, but had a lower 208Pb/204Pb isotopic ratio. As described above, the control turf may also be interpreted to lie between the isotopic composition of the fertilizer and Broken Hill ore and/or Perth atmospheric Pb (Figure 22). Similarly, the NUA-amended turf also contained a component of fertilizer-derived Pb.

Investigation of Mineral-Based By-Product Use as a Soil Amendment: Results from the Bullsbrook Turf Farm, WA 54
35
36
37
38
39
40
41
42
43
15 16 17 18 19 20 21 22 23 24 25206Pb/204Pb
208 Pb
/204 Pb
NUANUA-amended SoilTurf NUALysimeter NUAControl SoilTurf ControlLysimeter ControlFertilizerIrrigation WaterBroken Hill Pb orePerth atmospheric Pb
Figure 22. 206Pb/204Pb versus 208Pb/204Pb isotope geochemistry of the NUA-amended and control soils, fertilizer, NUA, the control and amended turf, Broken Hill ore and Perth atmospheric Pb sources.
3.11. U-Th series, 40K and 137Cs isotope geochemistry
3.11.1. A brief background to U-Th series isotope geochemistry
Because U is generally more mobile than Th due to its greater solubility, during weathering 230Th/238U activity ratios are generally expected to be >1 in particulate (e.g. soil) phases due to the loss of the more mobile U to the solution phase. In addition, because of α-recoil effects, 234Th can be ejected from the solid and the rapid decay of 234U (t1/2 = 24 days) can induce 234Th/238U ratios of <1 in the residual products of weathering. If, however, the rate of removal by water is not significant (and/or after a long sample storage time) it can be expected to be in secular equilibrium with its parent (i.e. 234Th/238U = 1). Hence, these differences in the solubility of U and Th, and the differences in behaviour during radioactive decay can act as a tracer for the origin of various radionuclides and also provide an insight into processes operative in multi-component systems such as the NUA-soil-fertilizer-turf-leachate system at Bullsbrook Turf Farm. Excess 210Pb, effectively that derived from the difference between supported Pb (as measured by 226Ra activity) and the total 210Pb, 40K and 137Cs were also measured as part of a standard radionuclide analytical suite.

Investigation of Mineral-Based By-Product Use as a Soil Amendment: Results from the Bullsbrook Turf Farm, WA 55
3.11.2. Radionuclide distribution
A summary of the U-Th series, 40K and 137Cs isotopic composition and selected isotopic ratios of NUA-amended and control soils, fertilizer, NUA the control and amended turf and Darling Scarp gravel/soil is given in Table 8. In general, the fertilizer had the highest mean concentration of a range of radionuclides, specifically: 238U, 234U, 230Th, 226Ra, 210Pb, 210Pbex derived from the 238U decay chain, and 40K. NUA had the highest mean concentrations of 232Th, 228Ra, and 228Th which were derived from the 232Th decay chain and, hence the NUA-amended soils had intermediate activities of these radionuclides relative to the NUA and control soils. Both the control and NUA-amended turf had the highest 137Cs relative to all other phases (Table 8). Caesium is likely to be concentrated in plant materials relative to both the NUA-amended and control soils and is discussed later. Interestingly, the turf grown on the NUA-amended soil also had approximately 5 times the 226Ra of the turf grown on the control soil and double the 40K activity. The reasons for these differences may relate to differential retention of elements changes in the relative congruency of dissolution within the different soil types.
U-Th series analysis of depth samples (not shown) indicated little variation within the pre-amendment soil profile. After incorporation of the NUA, the amended soil profile inherited a hybrid of the radionuclide characteristics of the NUA and control soil to a depth of approximately 10 cm. The only exception was 40K, which often had 2-3 times the activity in the 0-10 cm depth interval than deeper soils.
The absorbed dose rate in air (D, Table 8) at 1 m above a semi-infinite plane was calculated using the equation:
D = 0.427 x 238U + 0.662 x 232Th + 0.043 x 40K
where D is the absorbed dose rate in air (nGy/h), and 238U, 232Th, and 40K are the activity concentrations in Bq/kg (Toussaint, 2005). This formula was used for turf, NUA, control and NUA-amended soils, lysimeter leachates, groundwater and the fertilizer used during the trial. For reference materials (building materials - Beretka and Mathew; 1985, building materials - Papastefanou et al. 2005; fertilizers - Khater and Sewaidan, 2008) where only 226Ra, 232Th and 40K activities were available, a similar equation was from Papastefanou et al. (2005) was used:
D = 0.462 x 226Ra + 0.604 x 232Th + 0.042 x 40K
A comparison of the calculated absorbed dose rates indicated that the fertilizer (331 nGy/h) was the highest, followed by NUA (263 nGy/h). Prior to NUA incorporation the Bullsbrook soils were 3-4 nGy/h, while after NUA amendment the soil was 17 nGy/h (Table 8). The calculated D for samples of turf varied between 52 and 93 nGy/h for the control and NUA-amended turf respectively. In comparison, Darling Scarp samples have D values between 35 and 378 nGy/h (average 195 nGy/h; Toussaint, 2005). The UNSCEAR quoted range is 11-54 nGy/h (average 33 nGy/h; UNSCEAR, 1998). For a “transferred soil”, i.e. a soil harvested and transplanted offsite, consisting of an industry-standard 2 mm of soil adhering to the harvested grass, and 148 mm of underlying control (unamended) soil at the planting site, individual isotope activities and the D are likely to be indistinguishable from measurement errors (Table 8). If fertilizer was applied to the transferred turf twice a year at an estimated 25 g/m2, then the increment in absorbed dose rate in the first year would be similar to that of the transferred turf alone (Table 8).
The major features of the U-Th isotope geochemistry series are also summarised in an activity ratio diagram of 230Th/238U versus 234U/238U (Figure 23). Generally, during weathering the
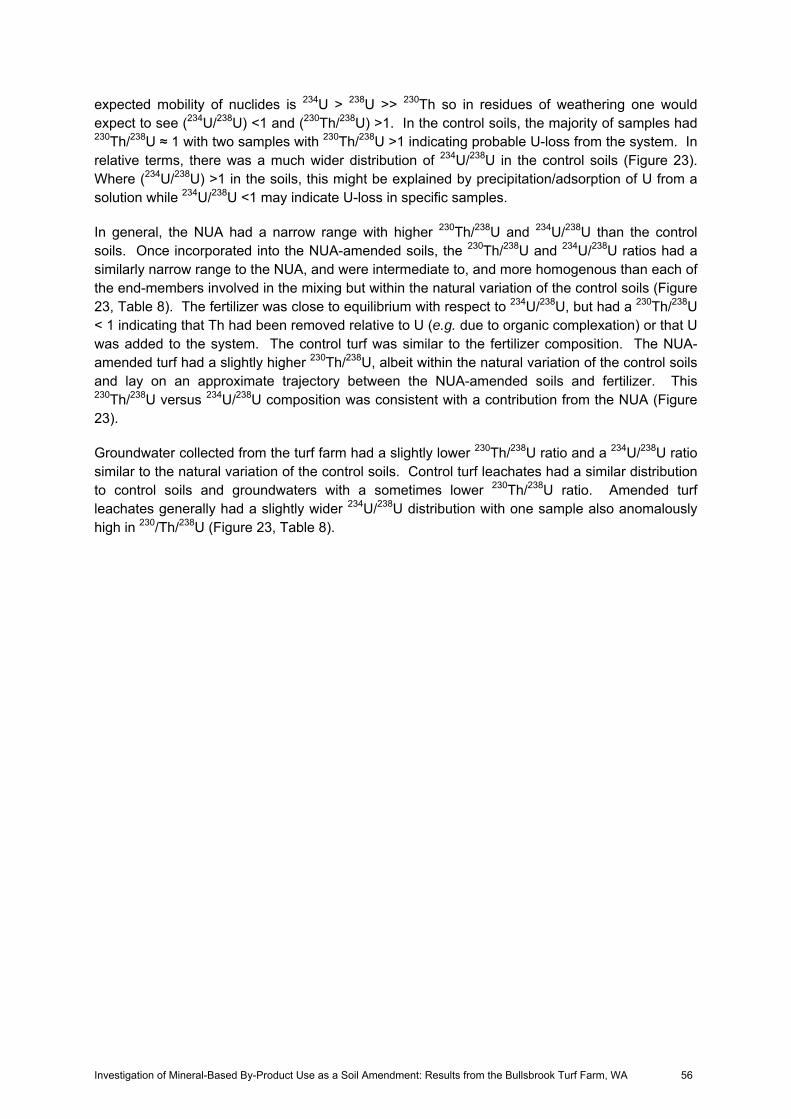
Investigation of Mineral-Based By-Product Use as a Soil Amendment: Results from the Bullsbrook Turf Farm, WA 56
expected mobility of nuclides is 234U > 238U >> 230Th so in residues of weathering one would expect to see (234U/238U) <1 and (230Th/238U) >1. In the control soils, the majority of samples had 230Th/238U ≈ 1 with two samples with 230Th/238U >1 indicating probable U-loss from the system. In relative terms, there was a much wider distribution of 234U/238U in the control soils (Figure 23). Where (234U/238U) >1 in the soils, this might be explained by precipitation/adsorption of U from a solution while 234U/238U <1 may indicate U-loss in specific samples.
In general, the NUA had a narrow range with higher 230Th/238U and 234U/238U than the control soils. Once incorporated into the NUA-amended soils, the 230Th/238U and 234U/238U ratios had a similarly narrow range to the NUA, and were intermediate to, and more homogenous than each of the end-members involved in the mixing but within the natural variation of the control soils (Figure 23, Table 8). The fertilizer was close to equilibrium with respect to 234U/238U, but had a 230Th/238U < 1 indicating that Th had been removed relative to U (e.g. due to organic complexation) or that U was added to the system. The control turf was similar to the fertilizer composition. The NUA-amended turf had a slightly higher 230Th/238U, albeit within the natural variation of the control soils and lay on an approximate trajectory between the NUA-amended soils and fertilizer. This 230Th/238U versus 234U/238U composition was consistent with a contribution from the NUA (Figure 23).
Groundwater collected from the turf farm had a slightly lower 230Th/238U ratio and a 234U/238U ratio similar to the natural variation of the control soils. Control turf leachates had a similar distribution to control soils and groundwaters with a sometimes lower 230Th/238U ratio. Amended turf leachates generally had a slightly wider 234U/238U distribution with one sample also anomalously high in 230/Th/238U (Figure 23, Table 8).

Investigation of Mineral-Based By-Product Use as a Soil Amendment: Results from the Bullsbrook Turf Farm, WA 57
0.0
0.5
1.0
1.5
2.0
2.5
3.0
0.6 0.8 1.0 1.2 1.4 1.6 1.8234U/238U
230 Th
/238 U
NUANUA-amended SoilTurf NUALysimeter NUASoil ControlGrass ControlLysimeter ControlFertilizerIrrigation Water
Figure 23. 230Th/238U versus 234U/238U activity diagram for NUA-amended and control soils and lysimeter leachates, fertilizer, NUA and control and NUA-amended turf.

Investigation of Mineral-Based By-Product Use as a Soil Amendment: Results from the Bullsbrook Turf Farm, WA 58
Table 8. Summary of U-Th series, 40K and 137Cs mean isotopic composition of NUA-amended and control soils, fertilizer, NUA and control and amended turf, Darling Scarp gravel/soil, red mud, fly ash, red clay bricks, concrete/cement, phosphogypsum, and UNSCEAR guidelines (1998). All radionuclide units are in Bq/kg with standard errors generally 5-10% of the mean. 238U and 232Th decay chains grouped together.
Sample 238U 234U 230Th 226Ra 210Pb 210Pbex 232Th 228Ra 228Th 40K 137Cs D
Turf NUA 1.1 1.2 1.1 10.0 37.2 27.2 0.4 8.3 2.9 2154 2. 7 93
Turf Control 1.0 1.0 1.3 1.8 22.1 20.4 2.4 3.0 2.2 1158 3.4 52
Fertilizer 346 340 275 160 176 25.2 8.1 6.7 4.8 4147 0.5 331
NUA 55 71 112 12.8 14.4 1.7 360 128 187 28.8 0.3 263 Control Soil 2.5 2.5 2.7 4.8 5.2 1.3 4.3 4.5 4.9 3.2 0.4 4.0
NUA-amended Soil 5.0 5.7 7.1 6.1 7.9 1.8 21.7 15.1 15.6 6.6 0.6 17
NUA leachate 0.92 1.00 0.58 20 3.06 -17.4 0.20 26 9.1 1.0 n/a 0.6
Control leachate 1.52 1.66 1.01 15 4.09 -10.5 0.56 15 2.4 1.1 n/a 1.1
Groundwater 2.09 2.32 1.39 6 3.60 -2.0 1.47 25 8.8 0.6 n/a 1.9
Transferred Soil(1) 2.5 2.5 2.8 4.8 5.3 1.3 4.5 4.7 5.0 3.2 0.41 4.2
Transferred Soil*(2) 2.6 2.6 2.8 4.9 5.3 1.3 4.5 4.7 5.0 4.1 0.41 4.3
Darling Scarp Soil(3) (mean)
20 – 110 (70)
40 – 500
(250)
35 – 378 (195)
Red Mud(3) (Red Mud + Gypsum)
400 (310) 310
(270) 310
(350)
1300 (1300)
1150 (1140)
1350 (1160)
350 (310)
1046
(1006) Fly ash (mean)
33 – 178
(113)
63 – 315 (166)
59 – 677
(433)
58 – 276 (171)
Red clay bricks (mean)
18 – 60
(41) 5 – 79 (53)
100-1001 (733)
15 – 117
(82) Cement/Concrete (mean)
8 – 138
(48) 8 – 46 (21)
14 – 92 (21)
14 – 92
(48) Phosphogypsum (mean)
585 – 688
(635)
3 – 8 (4)
5 - 26 (12)
273 - 320
(297) Fertilizer (mean)
54 – 780
(343)
11 – 67 (30)
3 – 4000 (1301)
134 – 398
(231) UNSCEAR (mean)
10 – 50 (30)
10 – 50
(30)
11 – 54 (33)
(1) – calculation based on 2mm thickness of transferred turf and 148mm of the control soil to simulate the transfer of soil offsite. (2) – transferred turf as described in (1) plus first year of fertilizer application. (3) - activity range with mean in parentheses - Toussaint (2005).

Investigation of Mineral-Based By-Product Use as a Soil Amendment: Results from the Bullsbrook Turf Farm, WA Page 59
4. DISCUSSION
4.1. Control and NUA-amended soil leachate geochemistry The incorporation of NUA at the rate of 150 t/ha into the upper 10-15 cm of the Bullsbrook soil profile (equating to approximately 5-10% by mass) conferred major changes in the major and trace element geochemistry. With the incorporation of the NUA, the major and trace element geochemistry of the NUA-Bullsbrook hybrid soil was driven towards a composition and overall geochemical character more consistent with the PAAS, an estimate of the average crustal composition. Thus, many of the major and trace element concentrations were more in keeping with an average soil type. With the co-incorporation of NUA and a clay mineral such as kaolinite (which would raise the Al2O3 content) the hybrid soil would even more closely resemble the PAAS composition.
Upon the commencement of irrigation by the overhead sprinkler system using a local groundwater source the major element geochemistry of the NUA-amended soil leachate became dominated by Ca and SO4 as a result of gypsum dissolution (Figure 12e, Figure 12h, Figure 19j). This is unsurprising given the high (ca. 65%) gypsum content of the NUA, and its fine grain size after physical incorporation and dispersion through the upper soil profile. Geochemical modelling using PHREEQC also independently supported the concept of an amended soil leachate in equilibrium with gypsum dissolution for the majority of the Bullsbrook field trial, and this was thus used as one of the boundary conditions (an equilibrium phase) of the geochemical modelling for the NUA-amended soils (Figure 19j).
A major outcome of the incorporation of the NUA into the upper soil profile was an immediate increase in leachate pH. Commensurate with this increase in pH was the general increase in the degree of oversaturation or transition from under to oversaturation of a range of Fe- containing and some Al-containing minerals and of calcite and hydroxyapatite (Figure 19a-q). The net result of these changes in predicted mineralogy was the formation of a range of phases with a well-documented ability to either directly adsorb PO4-P, or incorporate PO4-P into their primary structure (as calcite CaCO3 or hydroxyapatite - Ca5[PO4]3OH). Thus, within the NUA-amended soils there were a number of well defined mineralogical “sinks” for PO4-P. Hence, this change in mineralogy due to the formation of the abovementioned Fe-, Al- or Ca- minerals was the likely mechanism that lead to the large and sustained reduction of PO4-P in the NUA-amended leachate relative to the control leachate over the 1,357 days of the Bullsbrook Turf Farm field trial.
An alternate mechanism for the reduced flux of PO4-P in the NUA-amended leachate may be related to the substantial decrease in leachate flux and the increase in turf vigour and general “health” which was noted anecdotally by both the authors and the staff of Bullsbrook Turf Farm during the initial turf growth phase and post-harvesting regeneration (Figure 10, Figure 11). It may be speculated that the PO4-P (and forms of N and trace elements) was less rapidly leached, present in a mineralogically bio-available form, and hence may have had a longer residence time within the root zone, thus allowing increased uptake efficiency. Nonetheless, similar P contents were present within both the turf grown on the control and NUA-amended turf, although the latter had an increased ground coverage/biomass. Efforts are ongoing to quantify differences in turf growth rate and elemental composition between control and NUA-amended plots.
A preliminary PO4-P budget for the control and NUA-amended soils was estimated based on a knowledge of the amount of applied fertilizer and the total flux of PO4-P collected over the duration of the field trial (refer to Table 1, reproduced below). In terms of PO4-P inputs, approximately 7 tonnes of Nitrophoska Blue were applied to the 1 ha trial site. Given that the

Investigation of Mineral-Based By-Product Use as a Soil Amendment: Results from the Bullsbrook Turf Farm, WA 60
fertilizer contains 6.2% P, then approximately 434 kg of P was applied per hectare or 217 kg each in the 0.5 ha NUA-amended and control sites. If it is assumed that 75% of the PO4-P is reasonably water soluble over the duration of the trial with the remainder of the PO4-P soluble over a much greater period, then the effective bio-available applied PO4-P pool size was approximately 163 kg each for the control and NUA-amended soil plots.
Table 1. Preliminary PO4-P budget for the control and NUA-amended soils.
Quantity (kg) Control soil NUA-amended soil Control soil uptake (est.) 25 25 Exported turf 50 75 NUA – uptake* n/a 50 TOTAL 75 150 Nitrophoska Blue – PO4-P 163 163 *estimated from lysimeter flux
In terms of PO4-P loss or uptake, there are three separate components. It is estimated that the 150 mm of grey sand above the lysimeters could hold a maximum of 50 kg of PO4-P per ha. The vegetative material in the turf (including the exported roll which was harvested once) would hold about a further 100 kg of PO4-P per ha in the control and 150 kg of PO4-P per ha in the amended soil. The final component is the removal of PO4-P by the NUA amendment which by difference between the PO4-P lysimeter fluxes was 26.6 kg/ha/yr and 0.7 kg/ha/yr for the NUA-amended and control soils, respectively. For the 1,357 day duration of the field trial this equates to approximately 50 kg and 1 kg, respectively. Thus, based on the above assumptions, there is reasonable agreement between the mass balance of soil inputs and outputs (163 versus 150 kg, respectively) within the NUA-amended soil. The difference in the control soil inputs and outputs is approximately 83 kg, which equates to a 54% loss of fertilizer-applied PO4-P to the shallow groundwater.
In addition to PO4-P, the concentration of a range of N species, specifically, NH3-N, NO3-N, and hence TIN and TKN, and hence flux (due to a lower leachate volume), were lower in the NUA-amended leachate. It has previously been noted in laboratory trials of the ability of NUA (and similar heavy mineral processing residues produced by TiWest) to adsorb substantial quantities of NH3-N and NO3-N in addition to PO4-P and that varying quantities of these nutrients have been available in bio-available (i.e. readily de-sorbable) form depending on the proportion and blend of NUA with soils or other materials (Gilkes et al., 1994, Hamon and McLaughlin, 2002, Waddell, et al., 2002).
A comparison of NUA-amended and control soil leachates indicated that trace element uptake was substantially higher in the former. Apart from the leaching of B derived from the NUA, which was restricted to the first few days of the field trial, a suite of trace elements with a wide and potentially variable (depending on Eh-pH conditions) range of geochemical behaviours were effectively bound within the NUA-amended soils. The increased uptake of a suite of trace elements was undoubtedly due to the mechanisms described above for PO4-P sorption, in particular sorption and co-precipitation with Fe- and Al-bearing mineral phases. Mn-bearing minerals, although generally noted for their high trace element sorption capacity, did not, on the basis of the PHREEQC geochemical modelling, appear to form an important phase in this respect. The similar (and low) fluxes of Mn in both the control and NUA-amended leachate, despite the intermittent increased concentration in the soil profile of the latter due to the

Investigation of Mineral-Based By-Product Use as a Soil Amendment: Results from the Bullsbrook Turf Farm, WA 61
incorporation of NUA (Figure 12l) suggested that effective co-precipitation mechanisms, most probably with Fe-minerals may have retarded Mn mobility.
The mobility of F and often similar temporal concentration profile within both the NUA-amended and control soil leachates is of some interest (Figure 12aa). Geochemical modelling indicates that later in the trial (ca. day 450), and with an intermittently high Ca concentration in the NUA-amended leachate, fluorite (CaF2) becomes a significant mineral that potentially regulates dissolved F concentrations.
The total lysimeter flux (litres of leachate collected between each sampling period) was consistently higher in the control section relative to the NUA-amended section. In general, the leachate flux to the control lysimeter was 1.5 – 5 times that to the NUA-amended, however, on 7 occasions the flux was at least 5 times (and up to 15 times) greater to the control lysimeter. Over the entire 1,357 days of the Bullsbrook field trial, 363.2 L of leachate were collected beneath the control soils (annual mean 90.8 ± 12.7 L, μ ± 1σ). In contrast only 199.5 L of leachate were collected beneath the NUA-amended soils (annual mean 49.9 ± 12.3 L μ ± 1σ). This equates to approximately 1.8 times greater leachate loss beneath the control soils over 1,357 days. Actual rates of leachate generation, particularly in the control soils where leachate loss was greater due to their less water-retentive nature, broadly correspond to average monthly rainfall with the relationship partially confounded by the use of the overhead irrigation sprinkler system which was used on an “as required” basis.
The major differences that occurred in the sample to sample and aggregate lysimeter flux over the 1,357 days of the Bullsbrook field trial had a major influence on net flux of elements delivered to the shallow groundwater. Beneath the control soils 363.2 L of leachate were collected and only 199.5 L of leachate collected beneath the NUA-amended soils. Thus, there is a ca. 1.8 times decrease in leachate flux alone. As a consequence of reduced leachate flux and increased retention on NUA-amended soil, retardation of a range of nutrients and trace elements occurred. These varied from ca. 97% for PO4-P, 88% for As, 80% for Cr, 75% for Th, 82% for NH3-N, 61% for Pb, and 40% for NO3-N (Table 3). In contrast, primarily due to gypsum dissolution, there were substantial enrichments in the NUA-amended leachate that varied from ca. 220% for SO4-S, 211% for Sr, 165% for Ca and 50% for total alkalinity. Due to the higher concentration of major ions, particularly Ca and SO4-S, EC is also substantially increased in the NUA-amended soil leachate, although increases only occurred intermittently throughout the field trial.
4.2. Sr-Nd-Pb, U-Th series, 137Cs and 40K isotope geochemistry The Sr, Nd and Pb, U-Th series, 137Cs and 40K isotope geochemistry of the NUA-amended and control soils, fertilizer, NUA and the control and amended turf provide a preliminary insight into the relative contributions and cycling of these components (as 143Nd/144Nd versus 87Sr/86Sr in Figure 20, and 206Pb/204Pb versus 207Pb/204Pb, Figure 21, and 206Pb/204Pb versus 208Pb/204Pb, Figure 22, Table 7, 230Th/238U versus 234U/238U , Figure 23, Table 8). In many ways these isotopic systems act as a general surrogate for other elements and thus may provide insight into more general geochemical processes. Strontium has a similar geochemical behaviour to Ca which is abundant in both the NUA and fertilizer (compare Figure 12e, Figure 12ah, composition in Table 4), and thus provides a fingerprint to sources and sinks to for example, turf and lysimeter leachate. Correspondingly, Pb, as a heavy metal with well documented health effects is of particular interest, and under certain Eh-pH conditions provides an insight into the behaviour of some transition metals with similar geochemical characteristics. Neodymium, as one of the rare earth elements, provides a general indicator of behaviour of 13 other rare earth elements of similar geochemical character which are present in the soils, NUA and fertilizer (Table 4). As

Investigation of Mineral-Based By-Product Use as a Soil Amendment: Results from the Bullsbrook Turf Farm, WA 62
described previously, weathering and a range of geochemical reactions may profoundly affect isotopic ratios in the U-Th system. The U-Th isotope series was viewed with particular importance in this study given the origin of the NUA from heavy mineral processing and thus has the potential to contain U and Th daughter enrichment from monazite. There was also a perception of a potential increase in environmental radioactivity in amended turf farm soils. This was due partly to the concurrent use of fertilizers which are also known to be enriched in U-Th series radionuclides.
Due to the distinct Sr, Nd, Pb, isotopic signatures, the influence of both fertilizer and NUA on the turf can be identified. In addition, Pb isotopes allow the probable contribution of atmospheric Pb (as derived from leaded petrol) to be identified.
The analysis of Sr, Nd and Pb isotopes in NUA, soils, fertilizer, grass and groundwater allowed the identification of the sources of these elements to turf cultivated on the NUA-amended and control sites. The majority of Pb in soils, groundwater and turf at Bullsbrook was dominated by atmospheric Pb derived from vehicle sources (Broken Hill-derived Pb). This was consistent the pervasive atmospheric Pb signature and a history of use of farm vehicles that formerly used leaded petrol. In addition, NUA had only a low Pb concentration of 21 μg/g (Table 4). On the basis of lysimeter results Pb was not readily leached from the NUA matrix (maximum NUA-amended leachate concentration of ca. 8 μg/L, Figure 12ad).
Analysis of Sr and Nd isotopes in the fertilizer, turf, lysimeter leachates, groundwater and soils at the Bullsbrook site revealed complex mixing between these geochemical pools. Control soils had an inherently variable Sr-Nd geochemistry perhaps related to previous fertilizer applications, but once amended these soils were dominated by the NUA isotopic/geochemical signature. Turf grown on control soils had a Sr-Nd isotopic composition reflecting a contribution of both fertilizer and groundwater. In contrast, turf grown on NUA-amended soils was dominated by a mixture of NUA and fertilizer Sr-Nd geochemistry. Control lysimeter leachates had an isotope geochemistry intermediate between that of control soils and fertilizer with a possible groundwater contribution while amended lysimeter leachates had a geochemistry most closely resembling that of NUA with minor groundwater and fertilizer contributions.
4.3. Environmental radioactivity – U-Th-series and 40K radionuclides Absorbed dose rates (D) provide a weighted integral of activities that allow direct comparison of often geochemically–diverse materials with a range of radionuclides and activities. Comparison of the activities and D of NUA, the control and NUA-amended soils and turf is important to place the environmental radioactivity associated with the Bullsbrook turf farm trial in context.
Absorbed dose rates have been calculated here for all of the components (NUA, soils, waters, fertilizer, turf) present in this study in addition to common building materials, fertilizers and industrial by-products. Central to the comparison of adsorbed does rates used here is the comparison of NUA both as an undiluted by-product and also once incorporated as ca. 5% by weight in soil as occurred in the Bullsbrook Turf Farm field trial. The NUA as sourced from Iluka Resources and used in the Bullsbrook turf farm field trial in an undiluted form had a D of 263 nGy/h, but once incorporated into the soil the D value was reduced to 17 nGy/h (Table 7). This is approximately half that of the UNSCEAR guideline average of 33 nGy/h (UNSCEAR, 1998). A comparison in terms of D to other components present in the Bullsbrook turf farm trial is made below.

Investigation of Mineral-Based By-Product Use as a Soil Amendment: Results from the Bullsbrook Turf Farm, WA 63
Calculated D values (Table 8) indicate that the fertilizer used in the trial (331 nGy/h) was the highest, followed by NUA (263 nGy/h). Unamended Bullsbrook soils had a comparatively low D (3-4 nGy/h), approximately one-hundredth of the fertilizer value, increasing approximately 4-5 times after NUA amendment (17 nGy/h). The calculated D for samples of turf varied between 52 and 93 nGy/h for the control and NUA-amended turf respectively. Importantly, over 96% and 99%, respectively, of the absorbed dose rate can be attributed to the 40K component, which is predominantly fertilizer-derived. Some Cs enrichment was noted in both the control and NUA-amended turf. The transfer and concentration of Cs in general, and in this case 137Cs, was likely due to active transport into plant tissue via the Na-K transport mechanism (White and Broadley, 2000). Chemical similarities between Cs and K permit active uptake of Cs through transport pathways designed for the uptake of K, an essential plant nutrient (Gommers et al., 2000). Comparison of the U and Th-series radionuclides for the NUA-amended and control turf suggested little, if any transfer of NUA-associated radionuclides, and in particular 232Th series which had the highest activity, from the NUA into the turf biomass. Indeed, 232Th was lower in the NUA-amended turf (0.4 Bq/kg) than the control turf (2.4 Bq/kg) although 228Ra was higher in the NUA-amended turf (8.3 Bq/kg) than the control turf (3.0 Bq/kg, Table 7).
The average D for turf farm groundwater was 1.9, approximately half that of the control soil. Similarly, average leachate absorbed dose rates for control and NUA-amended leachates were 1.9 and 0.6, respectively, lower than the groundwater from which the leachates were sourced. The NUA-amended leachate was less than one third of the control leachate indicating less leaching of radionuclides to the shallow groundwater with the application of NUA as a soil amendment.
Darling Scarp samples have an absorbed dose rate between 35 and 378 nGy/h (average 195 nGy/h; Toussaint, 2005). In comparison the UNSCEAR quoted range is 11-54 nGy/h (average 33 nGy/h; UNSCEAR, 1999). Thus, the fertilizer as routinely applied, the NUA as a raw material, and many Darling Scarp soils exceed UNSCEAR guidelines. NUA-amended soil was at the lower end of the guideline range, approximately half the average. The control turf absorbed dose rate was near the upper UNSCEAR range while the NUA-amended turf was approximately 1.7 times higher, but was only 28% of the fertilizer and 49% times the average and 25% of the average and maximum Darling Scarp soils, respectively.
Importantly, for a “transferred soil”, i.e. a soil harvested and transplanted offsite, individual isotope activities and D are likely to be indistinguishable from measurement errors (Table 7). In practical terms, the absorbed dose rate of the transferred turf is likely to be more influenced by initial and subsequent applications of lawn fertilizers, in particular for parts of the 238U series, 232Th series and more specifically for 40K activities which increase by 28% in the first year alone (Table 7). Depending on the degree of retention of particular radionuclides (or loss due to mechanisms such as leaching or uptake and loss of biomass, e.g. by mowing) a substantially different radionuclide profile may evolve.
To further place the environmental radioactivity of the Bullsbrook Turf Farm trial in context, a comparison was made between a range of common materials including building materials (concrete/cement and bricks), fertilizers other than that used in the trial (phosphogypsum and a range of common fertilizers) and industrial by-products (fly ash and red mud) and NUA both as an undiluted by-product and once incorporated ca. 5% by weight in soil as occurred in the Bullsbrook Turf Farm field trial (Table 9). The comparison to building materials is particularly pertinent given that average rates of occupancy by the general public in the built environment is approximately 80% or 7000 hours per year (Papastefanou et al., 2005) while exposure to NUA-amended soil either in-situ on a turf farm or as transferred soil could be reasonably estimated to be <1%.

Investigation of Mineral-Based By-Product Use as a Soil Amendment: Results from the Bullsbrook Turf Farm, WA 64
Common building materials such as cement/concrete and clay bricks have a wide range of U and Th decay chain activities and hence absorbed dose rate reflecting their diverse origin (Beretka and Mathew, 1985, Papastefanou et al, 2005). Average 226Ra for both of these materials of 113 and 48 Bq/kg, respectively, is substantially higher than that of NUA-amended soil at Bullsbrook which was ca. 13 Bq/kg (Table 7). 232Th activity for NUA (360 Bq/kg) was somewhat higher than mean activities for cement/concrete (21 Bq/kg) and clay bricks (53 Bq/kg), however, once incorporated into the Bassendean Sand present at the Bullsbrook Turf Farm was similar (22 Bq/kg) to that of an average cement and ca. 40% of that of clay bricks. The activity of 40K within NUA (29 Bq/kg) was similar to that of cement/concrete (21 Bq/kg) and only ca. 4% of clay bricks. The diluted NUA absorbed dose rate of 17 nGy/h (i.e. once incorporated into the Bassendean Sand) was comparable to the lowest absorbed dose rates of concrete (14 nGy/h) and clay bricks (15 nGy/h).
Comparison of the activity of NUA to eight fertilizers analysed from around the world (Khater and Sewaidan, 2008) and phosphogypsum (Papastefanou et al, 2005) indicated that average 226Ra in NUA (13 Bq/kg) was only 4% and 2%, respectively, of these more common materials (Table 7). As in the case of concrete/cement and clay bricks, the activity of 232Th in NUA (360 Bq/kg) was much higher than either fertilizer (30 Bq/kg) or phosphogypsum (4 Bq/kg), but attained similar activities to the fertilizer once incorporated into the Bassendean Sand (ca. 22 Bq/kg). As a comparison to other countries, to minimize environmental and health risks, in the US a 226Ra concentration of <370 Bq/kg is recommended for phosphogypsum use in agriculture (USEPA, 1992). The fertilizer in the field trial at Bullsbrook was ca. 43% of this value while the NUA was <3.5% and the control and experimental grasses were <0.5% and <3%, respectively.
Activities of 40K in the NUA (ca. 29 Bq/kg) and average phosphogypsum (12 Bq/kg) were similar and were only ca. 2% of an average fertilizer (1301 Bq/kg). Importantly, the absorbed dose rate was only 7% of that of average fertilizers and 6% of phosphogypsum, both of which are applied repeatedly during turf establishment and growth by farm workers and intermittently by the general public once turf is transferred to a domestic setting. In contrast it is projected that NUA would be incorporated into a turf farm soil once every 5-10 years.
Average fly ash (113 Bq/kg) has a much higher 226Ra than NUA and 232Th (166 Bq/kg) that is approximately half that of NUA, although the range of 232Th activities (61 – 315 Bq/kg) indicate some samples may have comparable activity (Table 7). Fly ash has a substantially higher average 40K activity (433 Bq/kg) than NUA (ca. 29 Bq/kg). The average absorbed dose rate of fly ash is 171, approximately 10 times that of NUA-amended soil.
Red mud has previously been trialled as a soil amendment, particularly in the South West of Western Australia (e.g. Summers et al., 1993, Summers et al., 2001). Hence, it is prudent to make a direct comparison of activity of its activity relative to NUA. The average activity of 238U in red mud of 310 Bq/kg is approximately six times that of NUA which was 55 Bq/kg. Similarly, average 226Ra activity in red mud of 270 Bq/kg is ca. 21 times that of NUA which had a 226Ra activity of 12.8 Bq/kg (Table 7). In addition, average activities for 232Th in red mud of 1,300 Bq/kg are almost four times that of NUA at 360 Bq/kg. In terms of 40K activity, average red mud (350 Bq/kg) is over 12 times that of NUA (ca. 29 Bq/kg). Hence, red mud has considerably higher activities than NUA for a diverse range of radionuclides. In comparison to NUA, a similar application of red mud at ca. 5% by mass would yield an absorbed dose rate of approximately 54 nGy/h, or around three times that of NUA.
An independent radiological assessment was undertaken on the application of NUA to the Bullsbrook site (Appendix 5). On the basis of this actual dose-rate data, the NUA amended soil was deemed most unlikely to contribute to an effective gamma radiation dose significantly greater

Investigation of Mineral-Based By-Product Use as a Soil Amendment: Results from the Bullsbrook Turf Farm, WA 65
than what is considered as a normal background gamma radiation dose from soils in Western Australia. The radiological impact (and hence public health risk) of the NUA amended soil is thus likely to be very low.
4.4. Turf export evaluation (Gingin transplanted turf) An important component in determining the efficacy of NUA-amendment of sandy soils used to grow commercial turf on the Swan Coastal Plain is the ability of the transferred turf including the associated amended soil to act as an on-going sorbent for nutrients already present with the soil profile and for nutrients (e.g. as lawn food) generally applied during the early establishment phase of transplanted turf. The Gingin site was selected as it was entirely under Iluka control, was secure and facilitated easy sampling by on-site staff.
The results of leachate analysis collected beneath transplanted control and experimental turf at Iluka’s Gingin site over 209 days suggested that transferred experimental turf and the associated NUA conferred a substantially improved ability to retain nutrients, in particular NH3-N and PO4-P which were approximately 3.3 and 2.8 times more retentive relative to the control, respectively. In addition, the considerably greater flux of leachate from the control turf (ca. 1.7 times) relative to the experimental turf at the Gingin site has important implications for water use where transferred turf is established. Thus, a potential exists for a reduced watering regime at the transplanted site if water is preferentially retained within the root zone of the amended turf. Importantly, major and trace element analysis of the control and amended turf also suggested that there was little difference irrespective of the substrate on which the turf was cultivated. Similar results were also found by Summers et al. (2003) where elements such as Hg, Cd and U were in fact reduced in plant material grown on soils amended with pelletised NUA.
As previously mentioned, results of an independent radiological assessment on the application of NUA to the Bullsbrook site (Appendix 5) indicate that NUA amended soil is most unlikely to contribute to an effective gamma radiation dose significantly greater than a normal background gamma radiation dose from Western Australian soils. Thus, the public health risk of NUA-amended soil is likely to be very low. The radiological impact of transferred turf grown in NUA-amended soil, assuming incorporation of 5 mm of amended soil in turf rolls, is even lower than that for the NUA-amended soils.
4.5. Environmental implications of the application of NUA to turf farms on the Swan Coastal Plain
A preliminary estimate of the potential for enhanced P-uptake for the turf industry on the Swan Coastal Plain using NUA as a soil amendment has been made. This estimate is preliminary in nature given it is based solely on the results of the 1,357 day study of the performance of NUA at Bullsbrook Turf Farm, Bullsbrook, Western Australia.
It has been estimated that there is currently 700 ha of turf in production on the Swan Coastal Plain (A. Pitsikas, Greenacres Turf and President WA Turf Growers Association, pers comm.). Based on the agronomic practices at Bullsbrook Turf Farm there were 7 tonnes of fertilizer applied over 1 ha at 6.2% P and 10.7% TN over 1,357 days. This equates to ca. 2 tonnes/ha/year or 124 kg P/ha/yr and 201 kg TN/ha/yr. This estimate of N is probably an underestimate as within the N budget it is likely that a proportion of N may be lost during nitrification-denitrification within the soil profile as well as uptake by biomass (turf leaves and root

Investigation of Mineral-Based By-Product Use as a Soil Amendment: Results from the Bullsbrook Turf Farm, WA 66
system). Complicating the N budget are additional N applications via manure or inorganic fertilizers (e.g. as foliar applications). In general it is estimated that approximately ca. 500 kg N/ha/yr is applied on Swan Coastal Plain turf farms.
Based on removal rates for P of 97% and TN of 82% (Table 3), this equates to 120 kgP/ha/yr and 165 kg TN/ha/yr or 410 kg TN/ha/yr at the higher TN application rate. If NUA were to be incorporated at a similar rate (150 tonnes/ha) over the 700 ha of turf farms on the Swan Coastal Plain (105,000 tonnes of NUA in total) this would yield a reduction in leached P of 84 tonnes of P and 115 – 287 tonnes of TN per year. With an estimated life of 10 years for NUA for P adsorption, this would equate to 840 tonnes of P and 1150 – 2870 tonnes of TN removed from shallow groundwater beneath turf farms.
Preliminary toxicity tests indicated that NUA leachate had low toxicity with respect to both freshwater algae and to cladoceran (Appendix 1 and 2). A 72-h chronic algal growth rate toxicity test using the freshwater alga Chlorella sp. 12 demonstrated low toxicity of NUA leachate to algal growth, with an IC50 value (IC50 = concentration at which 50% of the test organisms exhibit growth inhibition) of >100% (Appendix 1). The undiluted NUA leachate inhibited algal growth rates by only ca. 20%. A 48-h acute immobilisation toxicity test using Ceriodaphnia dubia indicated that the NUA leachate was not toxic to cladoceran, with no immobile cladocerans observed in any concentration of leachate tested (Appendix 2).
Laboratory-based column trials over the course of six months using NUA mixed with Bassendean Sand and Ellen Brook water demonstrated a similar performance of NUA to that observed in the Bullsbrook field trial. Phosphate breakthrough was not observed in the column trials, suggesting a high P-uptake capacity even in the presence of high DOC, typically 50 mg/L in Ellen Brook water (Appendix 3).
In addition to the benefits outlined above, a suite of trace elements including Cd, As and Cr would be retained to varying extents within the soil profile as a result of amendment with NUA. Furthermore, the ca. 45% reduction in leachate volume resulting from soil amendment with NUA suggests that the potential may exist for a reduction in turf irrigation requirements. Further investigation is required to quantify turf irrigation requirements in control and NUA-amended soils. Preliminary testing of soil profiles late in the trial at Bullsbrook also revealed substantially higher retention of carbon in the NUA-amended soil (0.33% C) relative to control soils (0.22%). A further potential benefit may lie in the reduced use of fertilizer, particularly if both P and N are effectively retained and continue to be bioavailable in the soil profile. Work is ongoing to quantify turf growth in control and NUA-amended plots in the absence of fertilizer application.

Investigation of Mineral-Based By-Product Use as a Soil Amendment: Results from the Bullsbrook Turf Farm, WA 67
5. CONCLUSION
South west Western Australia currently faces a significant challenge with regard to water resources. This area, while experiencing Australia’s highest rates of climate change, rapid population growth and associated development, has also seen a substantial decrease in winter rainfall since 1975 (Swan River Trust, 2007). This reduction in rainfall has led to an increase in competition for water resources between the growing urban population and requirements for environmental flow. The safeguarding of existing water resources and investigation of alternatives to potable water supplies are critical to ensure long-term sustainability of water resources in south-west Western Australia. A major problem in the largely unretentive coastal soils of south west Western Australia is leaching of applied nutrients, particularly phosphorous. Off-site transport of nutrients is not only costly in terms of increased fertilizer requirements to maintain agricultural productivity, but is detrimental to adjoining or regional and coastal aquatic ecosystems. The presence of excess bioavailable nutrients is a major factor leading to the eutrophication of natural waters and the consequent degradation in water quality as documented in a range of south west Western Australian estuaries.
The effects of land application of industrial by-products are dependent upon the properties of both the by-product and the soil to which it is being applied, application rates, management and ambient environmental conditions (e.g., annual precipitation rates). Many changes in physicochemical characteristics followed the incorporation of NUA into native Bullsbrook Turf Farm soil at the rate of 150 t/ha into the upper 15 cm of the soil profile.
Average soluble phosphorous (PO4-P) fluxes to the shallow groundwater measured over the Bullsbrook Turf Farm field trial were 0.7 and 26.6 kg/ha/yr for the NUA-amended and control sites, respectively. This equated to a net 97% reduction of PO4-P in leachates from the NUA-amended experimental plots. Nitrogen fluxes for both ammonia (NH3-N) and nitrate (NO3-N) were reduced by 82% and 40%, respectively, in the NUA-amended soil leachates.
Following the application of NUA, there was an increase of ~1-1.5 pH units to typically between 7.0 and 8.5 in the lysimeter leachates from the NUA-amended soils relative to the control soils. This increase in pH was sustained throughout the majority of the field trial. In addition, total lysimeter flux (litres of soil water leachate collected between each sampling period) was 1.8 times higher in the control soils relative to the NUA-amended soils.
A geochemically diverse suite of elements displayed substantial reductions (in decreasing order: La, As, Cd, Cr, Th, Fe, Al, Pb, Si, Ti, Se, K, Rb, Na, V, Sc, Cu, Cl, U, Co, Ba, B, Ni, Zn, F and Mn) in the NUA-amended leachates relative to the control leachates. Increased element fluxes from the NUA-amended site relative to the control site occured for the alkali and alkaline earth cations such as Ca, Mg, Na and Sr, and the major anions S (as SO4
2-), and total alkalinity (as CO32- +
HCO3- + OH-), due primarily to gypsum dissolution.
Geochemical modelling of soil leachate chemistry indicated that within the NUA-amended soil was a general increase in the degree of oversaturation or transition from under- to oversaturation of a range of Fe-containing and some Al-containing minerals, and of calcite and hydroxyapatite. The net result was the formation of a range of minerals with a well-documented ability to either directly adsorb PO4-P, (e.g. ferrihydrite – Fe(OH)3) or incorporate PO4-P into their structure (as calcite - CaCO3 or hydroxyapatite - Ca5[PO4]3OH). Geochemical modelling also indicated that the NUA-amended soil leachate was in equilibrium with gypsum for the majority of the field trial.
Following the application of NUA, there was an increase in turf vigour and general “health” observed by the report authors and the Bullsbrook Turf Farm management during both the initial

Investigation of Mineral-Based By-Product Use as a Soil Amendment: Results from the Bullsbrook Turf Farm, WA 68
turf growth phase and post-harvesting turf regeneration. This increased growth may correspond to increased pools of nutrient and trace element retained within the root-zone of the NUA-amended soil.
A comparison of the composition of turf cultivated on the NUA-amended and control soils indicated the major element geochemistry was similar for both types of turf with relative enrichments or depletions generally <10%. The only exceptions were Si (possibly due to traces of Bassendean Sand adhering to the grass), and Fe, Mn and S enriched in the turf grown on NUA-amended soil. Both Mg and to a lesser extent P were enriched in the turf grown on the control soil.
Transferred turf also displayed promising nutrient and water retention characteristics. At Iluka Resources Gingin minesite, where Bullsbrook-grown turf was transferred, the pH and PO4-P concentrations were similar in soil leachates collected beneath the transplanted control and NUA-amended turf over 209 days. Lysimeter fluxes were ~1.7 times greater beneath the transplanted control turf, similar to the Bullsbrook site ratio of ~1.9. Approximately 2.8 times more PO4-P was lost to the control turf leachate compared to the turf grown on NUA-amended soil. Similarly, control soil leachate fluxes of NH3-N and NO3-N were ~3.3 and 1.3 times higher, respectively, than in the NUA-amended soil leachate.
A suite of U- and Th-series radionuclides and Cs and K radionuclides were measured in NUA, control and amended soils, fertilizer and grass during the Bullsbrook field trial. In general, the fertilizer had the highest mean concentration of a range of U-Th series radionuclides (derived from the 238U decay chain), and 40K. In contrast, NUA was enriched in radionuclides derived from the 232Th decay chain. Both the control and NUA-amended turf had the highest 137Cs relative to all other phases. Turf grown on the NUA-amended soil had ~5 and ~2 times the 226Ra and 40K activity, respectively, of the control soil turf.
Calculated radioactivity absorbed dose rates were highest for the fertilizer (331 nGy/h) and NUA (263 nGy/h). Unamended Bullsbrook soils had a low D (3-4 nGy/h), increasing ~4-5 times following 5% NUA amendment (17 nGy/h), comparable to the lowest rates for concrete (14 nGy/h) and clay bricks (15 nGy/h). Turf absorbed dose rates varied between 52 and 93 nGy/h for the control and NUA-amended turf, respectively. By comparison, Western Australia’s Darling Scarp soils have D values between 35 and 378 nGy/h (average 195 nGy/h; Toussaint, 2005). Red mud, previously trialled as a soil amendment in the south west of Western Australia, would, at an application rate of 5%, have an absorbed dose rate of ~54 nGy/h, or ~3 times that of NUA.
Analysis of Sr, Nd and Pb isotopes in NUA, soils, fertilizer, grass and groundwater allowed the identification of the fluxes of these elements on the NUA-amended and control soils. Most Pb in soils, groundwater and turf at Bullsbrook was dominated by atmospheric Pb derived from vehicle emissions. Control soils, once amended with NUA, were dominated by the NUA Sr-Nd isotopic/geochemical signature. Turf grown on control soils had a composition reflecting a contribution of both fertilizer and groundwater. In contrast, turf grown on NUA-amended soils reflected a mixture of NUA and fertilizer. Control soil leachates had an Sr-Nd isotope geochemistry intermediate between that of control soils and fertilizer while NUA-amended soil lysimeter leachates were dominated by NUA with minor groundwater and fertilizer contributions.
Based on the measured removal rates for P (97%) and TN (82%) from the Bullsbrook Turf Farm field trial and agronomic practices at Bullsbrook Turf Farm, nutrient attenuation by NUA equated to 120 kg P/ha/yr and 165-410 kg TN/ha/yr depending on TN application rate. Given the broad extent of the turf industry on the Swan Coastal Plain, the use of NUA by turf growers in this area to attenuate nutrient losses to shallow groundwater and retain nutrients and trace elements has

Investigation of Mineral-Based By-Product Use as a Soil Amendment: Results from the Bullsbrook Turf Farm, WA 69
the potential to substantially reduce nutrient (N and P) losses. If NUA were to be incorporated at a similar rate (150 tonnes/ha) over the ca. 700 ha of turf farms on the Swan Coastal Plain (105,000 tonnes of NUA in total) this would yield a reduction in leached P of approximately 84 tonnes and approximately 115–287 tonnes of total N per annum. With an estimated life of 10 years for NUA, this would equate to approximately 840 tonnes of P and approximately 1150 to 2870 tonnes of total N that could be retained within the soil profile, benefitting both turf farms and the wider environment.
The results of the Bullsbrook Turf Farm field trial suggest substantial potential for additional uses for NUA, including as a soil amendment for unretentive soils elsewhere on Swan Coastal Plain, or for the reduction of nutrient leaching under new urban and peri-urban development (e.g. new housing estates). Importantly, NUA may also possess further utility in the sub-catchment to catchment scale interception of nutrients within constructed wetlands or other nutrient filtration systems.

Investigation of Mineral-Based By-Product Use as a Soil Amendment: Results from the Bullsbrook Turf Farm, WA 70
APPENDIX 1: Chronic algal growth rate ecotoxicity test results

Page 1 of 7
Centre for Environmental Contaminants Research Lucas Heights Science and Technology Centre New Illawarra Road, Lucas Heights, NSW Private Mail Bag 7, Bangor, NSW, 2234, Australia Telephone 61 2 9710 6812 Fax 61 2 9710 6837
Chronic Algal Growth Test Report 08075 CAG Client: CSIRO Land and Water, Laura Wendling Project: NUA Leachate Test Performed: 72-h chronic algal growth rate toxicity test using the freshwater alga Chlorella sp.12 Sample Received: 19/5/08 Sample Prepared: 15/7/08 Test Initiated: 15/7/08 CSIRO Sample No. Sample Name Sample Description E08075 NUA Red powder Sample Physico-Chemistry and Preparation: Synthetic softwater (80-90 mg CaCO3/L), prepared according to the USEPA protocol (USEPA, 1994) was filtered through an acid-washed (10% HNO3) 0.45 µm filter and used as the diluent and control water for the algal toxicity test. Two litres of leachate were prepared according to the standard Toxicity Characteristic Leaching Procedure (TCLP – USEPA, 1986), except that synthetic softwater was used as the extraction fluid in place of acetic acid. NUA powder (50 g) was mixed with 1L of synthetic softwater in 1-L Nalgene® bottles and mixed by tumbling end-over-end at 30 ± 2 rpm for 18 h. A method blank was also prepared by filling a 1L Nalgene® bottle with synthetic softwater. This was tumbled end-over-end alongside the NUA leachate. Both the leachate and method blank were centrifuged for 7 minutes at 2500 rpm. The NUA leachate, method blank and a synthetic softwater control were then filtered through acid-washed (10% HNO3) 0.45 µm membrane filters prior to toxicity testing.
Sample Filtered Comments pH ‰ mS/cm DOa E08075 NUA Leachate, centrifuged, filtered 8.32 1.5 2855 98 Method Blank centrifuged, filtered 7.64 0.2 345 103 Synthetic softwater, filtered 7.51 0.2 320 102 ‰ = Salinity; µS/cm = Conductivity; a Dissolved Oxygen (%); Test Method: This test measures the decrease (inhibition) in algal growth rate (cell division) of the tropical freshwater alga Chlorella sp.12 after exposure to the sample for 72 h (initial cell density 2-4 x 10³ cells/mL). The test protocol is based on the OECD Test Guideline 201(1984). The 72-h IC50, LOEC and NOEC values were calculated using ToxCalc Version 5.0.23 (Tidepool Software).

Page 2 of 7
Results: There was a slight but significant decrease of algal growth in the Method Blank, compared to the QA Control. Therefore, the Method Blank was used in all statistical calculations for the NUA leachate. The NUA leachate (pH 8.2) was slightly higher in pH than the Method Blank (pH 7.6) and Control water (pH 7.6). The leachate was of low toxicity to algal growth, with an IC50 value of >100%. There was, however, significant inhibition of algal growth in test concentrations of 33% and higher, i.e. the LOEC value was 33% and the NOEC value was 11%.
Controls Growth Rate (Doublings/day) % of Control CV (%)
QA Control 2.02 100 5.0 Method Blank 1.87 92a 2.4
NUA Leachate, E08075 (%)
Method Blank 1.87 100 2.4 0.1 2.18 117 0.7 1.2 1.79 96 3.6 3.7 1.92 103 7.8 11 1.78 95 6.2 33 1.61 86b 5.9 100 1.47 79b 12
Sample IC50 (mg/L) LOEC (%) NOEC (%)
NUA Leachate >100% 33 11 a Significantly less than QA Controls. b Significantly less than Method Blank. Quality Assurance/Quality Control Criterion This Test Criterion Met? Control growth rate (doublings/day) 1.8 ± 0.5 2.0 Yes Control growth rate CV (%) <20 5.0 Yes Reference toxicant (copper, µg Cu/L) 4.6 ± 3.3 3.1 (2.7-5.0) Yes Comments: References:
OECD (1984) Guideline for testing of chemicals. Alga growth inhibition test. Test Guideline No. 201. Organisation for Economic Cooperation and Development, Paris, France.
USEPA (1986) Federal Register Vol 51 (114) Proposed Rules Part 261 – Identification and listing of hazardous waste, pp 21685-21693. USEPA (1994) Short-term methods for estimating the chronic toxicity of effluents and receiving waters to freshwater organisms – Third Edition, EPA/600-4-91-002 Environmental Monitoring Systems Laboratory, Cincinnati Test carried out by: David Spadaro Test supervised by: Monique Binet Test report prepared by: Monique Binet Experimental Scientist (ph: 02 9710 6812) Test report authorised by: Jenny Stauber Senior Research Principal Scientist (ph: 02 9710 6808) Date: 15/8/08

Page 3 of 7
Statistics - Leachate
15/07/2008 72-h Chronic Toxicity of NUA Leachate to Chlorella sp. 12
Sample pH Day 0 Day 1 Day 2 Day 3 Slope Growth Rate (dblngs/day) Pearson % Control Mean % CV (%)Vial No. Day 0 Day 3 All cell counts in (cells/mL) by x10 4 Mean
1 Method 3.1 12.5 66.9 120.6 0.02284 1.82 1.87 97% 97% 100% 2.4%2 Blank 7.64 7.99 3.1 11.5 68.5 132.8 0.02356 1.88 97% 100%3 * 3.1 12.5 63.3 149.9 0.02393 1.91 99% 102%
Mean Method Blank rate = 0.02344NUA Leachate (E08075)
1 3.1 12.5 86.0 243.6 0.02711 2.16 2.18 99% 116% 117% 0.7%2 0.1% 7.88 7.91 3.1 11.5 84.5 254.9 0.02748 2.19 99% 117%3 3.1 12.5 88.2 253.3 0.02738 2.18 99% 117%1 3.1 11.4 68.7 102.3 0.02217 1.77 1.79 95% 95% 96% 3.6%2 1.2% 7.85 8.02 3.1 13.6 68.4 103.5 0.02189 1.74 95% 93%3 3.1 12.0 64.6 133.9 0.02342 1.87 98% 100%1 3.1 12.2 64.9 122.4 0.02291 1.83 1.92 97% 98% 103% 7.8%2 3.7% 7.81 8.01 3.1 13.3 75.5 125.4 0.02316 1.85 96% 99%3 3.1 12.5 89.8 206.7 0.02630 2.10 98% 112%1 3.1 10.9 70.6 98.4 0.02208 1.76 1.78 94% 94% 95% 6.2%2 11% 7.8 7.94 3.1 11.2 84.9 127.5 0.02377 1.89 95% 101%3 3.1 9.5 53.0 85.3 0.02104 1.68 96% 90%1 3.1 9.4 32.4 77.8 0.01966 1.57 1.61 100% 84% 86% 5.9%2 33% 7.97 7.98 3.1 11.3 35.5 76.2 0.01938 1.54 99% 83%3 3.1 9.7 56.5 92.9 0.02158 1.72 96% 92%1 3.1 5.1 36.9 75.9 0.02088 1.66 1.47 94% 89% 79% 12%2 100% 8.21 8.01 3.1 4.6 22.1 37.6 0.01633 1.30 94% 70%3 3.1 7.0 30.2 55.0 0.01819 1.45 98% 78%
* Method Blank significantly less than Control, therefore, Method Blank used for statistical comparisons

Page 4 of 7
Algal Growth-72h slopeStart Date: 15/07/2008 Test ID: NUA Sample ID: E08075End Date: 18/07/2008 Lab ID: CSIRO-CECR Sample Type: NUA LeachateSample Date: Protocol: BD-FACSCalibur Flow CytometeTest Species: C12-Chlorella sp. 12Comments: Method Blank used as Control, due to significantly lower growth in MB
Conc-% 1 2 3MB 0.0228 0.0236 0.02390.1 0.0271 0.0275 0.02741.2 0.0222 0.0219 0.02343.7 0.0229 0.0232 0.026311 0.0221 0.0238 0.021033 0.0197 0.0194 0.0216
100 0.0209 0.0163 0.0182
Transform: Untransformed 1-Tailed IsotonicConc-% Mean N-Mean Mean Min Max CV% N t-Stat Critical MSD Mean N-Mean
MB 0.0234 1.0000 0.0234 0.0228 0.0239 2.357 3 0.0254 1.00000.1 0.0273 1.1656 0.0273 0.0271 0.0275 0.694 3 -3.472 2.530 0.0028 0.0254 1.00001.2 0.0225 0.9596 0.0225 0.0219 0.0234 3.606 3 0.847 2.530 0.0028 0.0233 0.91843.7 0.0241 1.0292 0.0241 0.0229 0.0263 7.834 3 -0.613 2.530 0.0028 0.0233 0.918411 0.0223 0.9512 0.0223 0.0210 0.0238 6.167 3 1.023 2.530 0.0028 0.0223 0.8785
*33 0.0202 0.8621 0.0202 0.0194 0.0216 5.923 3 2.891 2.530 0.0028 0.0202 0.7961*100 0.0185 0.7879 0.0185 0.0163 0.0209 12.387 3 4.447 2.530 0.0028 0.0185 0.7276
Auxiliary Tests Statistic Critical Skew KurtShapiro-Wilk's Test indicates normal distribution (p > 0.01) 0.954449 0.873 0.567475 0.120645Bartlett's Test indicates equal variances (p = 0.17) 9.086987 16.81189Hypothesis Test (1-tail, 0.05) NOEC LOEC ChV TU MSDu MSDp MSB MSE F-Prob dfDunnett's Test 11 33 19.05256 9.090909 0.002829 0.120684 2.41E-05 1.88E-06 5.4E-05 6, 14
Linear Interpolation (200 Resamples)Point % SD 95% CL(Exp) SkewIC05 0.774 0.766 0.383 7.756 3.9984IC10 7.059 4.158 0.000 24.919 0.2324IC15 18.606 5.597 0.000 43.481 0.3316IC20 31.970IC25 78.125IC40 >100IC50 >100
Dose-Response Plot
-0.3-0.2-0.10.00.10.20.30.40.50.60.70.80.91.0
0 50 100 150Dose %
Res
pons
e
1-tail, 0.05 levelof significance
0
0.005
0.01
0.015
0.02
0.025
0.03
MB 0.1
1.2
3.7 11 *33
*100
72h
slop
e

Page 5 of 7
Statistics– QA/QC
12/10/2005 72-h Chronic Toxicity of NUA Leachate to Chlorella sp. 12 - Quality Assurance
Sample pH Day 0 Day 1 Day 2 Day 3 Slope Growth Rate (dblngs/day) Pearson % Control Mean % CV (%)Vial No. Day 0 Day 3 All cell counts in (cells/mL) by x10 4 Mean
1 3.1 12.1 64.3 191.9 0.02535 2.02 2.02 99% 100% 100% 5.0%2 Control 7.58 7.84 3.1 13.2 71.7 241.4 0.02664 2.12 100% 105%3 3.1 14.8 82.7 149.7 0.02410 1.92 97% 95%
Mean control rate = 0.02536 Copper concentrations (µg/L)
1 3.1 6.4 37.4 71.9 0.02020 1.61 1.71 96% 80% 85% 5.3%2 2.2 7.75 8.01 3.1 6.3 34.4 104.7 0.02212 1.76 98% 87%3 3.1 6.5 29.9 113.4 0.02222 1.77 98% 88%1 3.1 1.8 10.2 21.5 0.01361 1.08 0.51 74% 54% 25% 98%2 3.7 7.73 7.84 3.1 3.2 3.5 4.5 0.00208 0.17 82% 8%3 3.1 2.7 3.5 5.6 0.00355 0.28 68% 14%1 3.1 3.3 5.5 9.2 0.00681 0.54 0.17 91% 27% 8% 202%2 7.0 7.80 7.82 3.1 3.1 3.1 2.4 -0.00133 -0.11 61% -5%3 3.1 2.7 2.5 3.7 0.00078 0.06 10% 3%1 3.1 2.7 2.5 2.3 -0.00179 -0.14 0.00 97% -7% 0% -2 7.7 7.81 7.82 3.1 3.0 3.4 5.1 0.00283 0.23 69% 11%3 3.1 2.6 3.0 2.5 -0.00091 -0.07 35% -4%
1 Method 3.1 12.5 66.9 120.6 0.02284 1.82 1.87 97% 90% 92% 2%2 Blank 7.64 7.99 3.1 11.5 68.5 132.8 0.02356 1.88 97% 93%3 3.1 12.5 63.3 149.9 0.02393 1.91 99% 94%

Page 6 of 7
Algal Growth-72h slopeStart Date: 15/07/2008 Test ID: NUA Sample ID: MBEnd Date: 18/07/2008 Lab ID: CSIRO-CECR Sample Type: Method BlankSample Date: Protocol: BD-FACSCalibur Flow CytometeTest Species: C12-Chlorella sp. 12Comments:
Conc-% 1 2 3Control 0.0254 0.0266 0.0241
MB 0.0228 0.0236 0.0239
Transform: Log 1-TailedConc-% Mean N-Mean Mean Min Max CV% N t-Stat Critical MSD
Control 0.0254 1.0000 -1.5961 -1.6180 -1.5745 -1.363 3*MB 0.0234 0.9242 -1.6301 -1.6413 -1.6211 -0.630 3 2.445 2.132 0.0296
Auxiliary Tests Statistic Critical Skew KurtShapiro-Wilk's Test indicates normal distribution (p > 0.01) 0.988055 0.713 -0.08193 -0.11078F-Test indicates equal variances (p = 0.36) 4.479756 199Hypothesis Test (1-tail, 0.05) MSDu MSDp MSB MSE F-Prob dfHomoscedastic t Test indicates significant differences 0.00167 0.065901 0.00173 0.000289 0.070798 1, 4
Dose-Response Plot
1-tail, 0.05 levelof significance
0.02
0.021
0.022
0.023
0.024
0.025
0.026
0.027
Con
trol
*MB
72h
slop
e

Page 7 of 7
Algal Growth-72h slopeStart Date: 15/07/2008 Test ID: NUA Sample ID: REF-Ref ToxicantEnd Date: 18/07/2008 Lab ID: CSIRO-CECR Sample Type: CUSO-Copper sulfateSample Date: Protocol: BD-FACSCalibur Flow CytometeTest Species: C12-Chlorella sp. 12Comments: Run alongside NUA Leachate test E08111
Conc-ug/L 1 2 3Control 0.0254 0.0266 0.0241
2.2 0.0202 0.0221 0.02223.7 0.0136 0.0021 0.0035
7 0.0068 0.0000 0.00087.7 0.0000 0.0028 0.0000
Transform: Untransformed 1-Tailed IsotonicConc-ug/L Mean N-Mean Mean Min Max CV% N t-Stat Critical MSD Mean N-Mean
Control 0.0254 1.0000 0.0254 0.0241 0.0266 5.005 3 0.0254 1.00002.2 0.0215 0.8482 0.0215 0.0202 0.0222 5.302 3 1.375 2.470 0.0069 0.0215 0.8482
*3.7 0.0064 0.2528 0.0064 0.0021 0.0136 97.910 3 6.765 2.470 0.0069 0.0064 0.2528*7 0.0025 0.0998 0.0025 0.0000 0.0068 147.243 3 8.149 2.470 0.0069 0.0025 0.0998
*7.7 0.0009 0.0372 0.0009 0.0000 0.0028 173.205 3 8.716 2.470 0.0069 0.0009 0.0372
Auxiliary Tests Statistic Critical Skew KurtShapiro-Wilk's Test indicates normal distribution (p > 0.01) 0.92743 0.835 1.109187 1.688611Bartlett's Test indicates equal variances (p = 0.13) 7.171172 13.2767Hypothesis Test (1-tail, 0.05) NOEC LOEC ChV TU MSDu MSDp MSB MSE F-Prob dfDunnett's Test 2.2 3.7 2.853069 0.00692 0.272847 0.000383 1.18E-05 1.1E-05 4, 10
Linear Interpolation (200 Resamples)Point ug/L SD 95% CL(Exp) SkewIC05* 0.7244 0.1607 0.3284 1.6344 1.1878IC10* 1.4488 0.2970 0.6568 3.0516 0.8156IC15* 2.1732 0.2201 0.9852 2.5087 -0.8673IC20 2.3213 0.0867 1.9476 2.7122 -0.6277IC25 2.4473 0.0853 2.1791 2.8920 0.7017IC40 2.8252 0.1570 2.5273 3.9681 1.6302IC50 3.0771 0.2369 2.6989 4.9537 2.1812* indicates IC estimate less than the lowest concentration
Dose-Response Plot
0.0
0.1
0.2
0.3
0.4
0.5
0.6
0.7
0.8
0.9
1.0
0 2 4 6 8 10Dose ug/L
Res
pons
e
1-tail, 0.05 levelof significance
0
0.005
0.01
0.015
0.02
0.025
0.03
Con
trol
2.2
*3.7 *7
*7.7
72h
slop
e

Investigation of Mineral-Based By-Product Use as a Soil Amendment: Results from the Bullsbrook Turf Farm, WA Page 78
APPENDIX 2: Acute cladoceran immobilisation ecotoxicity test results

Page 1 of 6
Centre for Environmental Contaminants Research Lucas Heights Science and Technology Centre New Illawarra Road, Lucas Heights, NSW Private Mail Bag 7, Bangor, NSW, 2234, Australia Telephone 61 2 9710 6808 Fax 61 2 9710 6837
Acute Cladoceran Test Report 08075 CD Client: CSIRO Land and Water Project: NUA Leachate Test Performed: 48-h acute cladoceran immobilisation test with the cladoceran, Ceriodaphnia dubia Sample Received: 19/5/08 Sample Prepared: 15/7/08 Test Initiated: 15/7/08 CSIRO Sample No. Sample Name Sample Description E08075 NUA Red powder Sample Physico-Chemistry and Preparation: Synthetic softwater (80-90 mg CaCO3/L), prepared according to USEPA protocols (USEPA, 1994) was used as the diluent for the NUA leachate toxicity test. Two litres of leachate was prepared according to the standard Toxicity Characteristic Leaching Procedure (TCLP – USEPA, 1986), except that synthetic softwater was used as the extraction fluid in place of acetic acid. NUA powder (50 g) was mixed with 1L of synthetic softwater in 1-L Nalgene® bottles and mixed by tumbling end-over-end at 30 ± 2 rpm for 18 h. A method blank was also prepared by filling a 1L Nalgene® bottle with synthetic softwater. This was tumbled end-over-end alongside the NUA leachate. Both the leachate and method blank were centrifuged for 7 minutes at 2500 rpm. The NUA leachate, method blank and a synthetic softwater control were then filtered through acid-washed (10% HNO3) 0.45 µm membrane filters and supplemented with Se and Vitamin B12 prior to toxicity testing. Dilute Mineral Water (DMW) was used as the diluent and Control water in all QA test solutions. DMW (20% Perrier® diluted in Milli-Q water with added Se and Vitamin B12 nutrient supplements) was aerated for at least 24 h prior to use. The pH, conductivity, dissolved oxygen and temperature was measured in sub-samples of test concentrations at the beginning and end of each test (see Statistics Section for more detail). Test Method: This test measures the mobility of the freshwater cladoceran Ceriodaphnia dubia during a 48-h exposure period. The test protocol is based on the USEPA (1993) acute toxicity test protocol. The 48-h EC50, LOEC and NOEC values were calculated using ToxCalc Version 5.0.23 (Tidepool Software).

Page 2 of 6
Results: All cladocerans in the DMW Control, method blank and synthetic softwater control were mobile after 48 h. For statistical calculations, values for the synthetic softwater control and method blank were pooled. The NUA leachate was not toxic to the cladoceran, with no immobile cladocerans in any concentration of leachate tested. i.e. the NOEC value was 100%.
Sample Mean Mobile (%) % of Pooled Control % Inhibition
DMW Control 100 100 0 Synthetic softwater 100 100 0 Method Blank 100 100 0 NUA Leachate 08075 0.1% 100 100 0 1.2% 100 100 0 3.7% 100 100 0 11% 100 100 0 33% 100 100 0 100% 100 100 0
Sample EC50 (%) LOEC (%) NOEC (%)
NUA Leachate >100 >100 100 a Significantly less than Pooled Control. Quality Assurance/Quality Control Criterion This Test Criterion Met? Control cladoceran mobility (%) ≥90% 100% Yes Reference toxicant EC50 (measured copper, µg Cu/L)a 7.3 ± 3.5 5.7 (4.9-6.6) Yes Comments: References: USEPA (1986) Federal Register Vol 51 (114) Proposed Rules Part 261 – Identification and listing of hazardous waste, pp 21685-21693.
USEPA (1993) Methods for measuring the acute toxicity of effluents and receiving waters to freshwater and marine organisms – Fourth Edition, EPA/600/4-90/027F, Environmental Monitoring Systems Laboratory, Cincinnati, OH.
USEPA (1994) Short-term methods for estimating the chronic toxicity of effluents and receiving waters t freshwater organisms – Third Edition, EPA/600-4-91-002 Environmental Monitoring Systems Laboratory, Cincinnati
Test carried out by: Monique Binet Test supervised by: Monique Binet Test report prepared by: Monique Binet Experimental Scientist (ph: 02 9710 6812) Test report authorised by: Jenny Stauber Senior Principal Research Scientist (ph: 02 9710 6808) Date: 15/8/07

Page 3 of 6
Statistics – NUA Leachate
Number of mobile organisms pH Conductivity D.O. Time Mean Prop'n mob Mean % Control
Rep 0 h 48 h 0 h 48 h 0 h 48 h 0 h 24 h 48 h 24 h 48 h 24 h 48 h 24 h 48 h 24 h 48 h1 5 5 5 1.00 1.002 Softwater 7.92 8.1 312 314 98% 92% 5 5 5 5.00 5.00 1.00 1.00 100% 100% 100% 100%3 Control 5 5 5 1.00 1.004 5 5 5 1.00 1.001 5 5 5 1.00 1.002 Method 7.93 8.1 319 319 97% 93% 5 5 5 5.00 5.00 1.00 1.00 100% 100% 100% 100%3 Blank 5 5 5 1.00 1.004 5 5 5 1.00 1.00
Mean Control % Mobile = 100% 100%Filtered NUA Leachate (E08075) Concentrations
1 5 5 5 1.00 1.002 0.1% 8.28 8.26 187 182 97% 93% 5 5 5 5.00 5.00 1.00 1.00 100% 100% 100% 100%3 5 5 5 1.00 1.004 5 5 5 1.00 1.001 5 5 5 1.00 1.002 1.2% 8.1 8.27 220 221 96% 95% 5 5 5 5.00 5.00 1.00 1.00 100% 100% 100% 100%3 5 5 5 1.00 1.004 5 5 5 1.00 1.001 5 5 5 1.00 1.002 3.7% 8.3 8.25 303 304 96% 94% 5 5 5 5.00 5.00 1.00 1.00 100% 100% 100% 100%3 5 5 5 1.00 1.004 5 5 5 1.00 1.001 5 5 5 1.00 1.002 11% 8.31 8.3 533 537 96% 94% 5 5 5 5.00 5.00 1.00 1.00 100% 100% 100% 100%3 5 5 5 1.00 1.004 5 5 5 1.00 1.001 5 5 5 1.00 1.002 33% 8.17 8.12 1155 1169 96% 92% 5 5 5 5.00 5.00 1.00 1.00 100% 100% 100% 100%3 5 5 5 1.00 1.004 5 5 5 1.00 1.001 5 5 5 1.00 1.002 100% 8.22 8 2806 2809 98% 91% 5 5 5 5.00 5.00 1.00 1.00 100% 100% 100% 100%
Mean Mobile (%)
15/07/2008 C. dubia 48-h Immobility test - Filtered NUA Leachate, CSIRO ID: E08075
3 5 5 5 1.00 1.004 5 5 5 1.00 1.00

Page 4 of 6 Ceriodaphnia Survival and Reproduction Test-48 Hr Survival
Start Date: 15/07/2008 Test ID: NUA Sample ID: E08075End Date: 17/07/2008 Lab ID: CSIRO-CECR Sample Type: NUA LeachateSample Date: Protocol: EPAF 91-EPA Freshwater Test Species: CD-Ceriodaphnia dubiaComments:
Conc-% 1 2 3 4Control 1.0000 1.0000 1.0000 1.0000
MB 1.0000 1.0000 1.0000 1.00000.1 1.0000 1.0000 1.0000 1.00001.2 1.0000 1.0000 1.0000 1.00003.7 1.0000 1.0000 1.0000 1.000011 1.0000 1.0000 1.0000 1.000033 1.0000 1.0000 1.0000 1.0000
100 1.0000 1.0000 1.0000 1.0000
Transform: Arcsin Square Root Rank 1-TailedConc-% Mean N-Mean Mean Min Max CV% N Sum Critical
Pooled 1.0000 1.0000 1.3453 1.3453 1.3453 0.000 80.1 1.0000 1.0000 1.3453 1.3453 1.3453 0.000 4 26.00 12.001.2 1.0000 1.0000 1.3453 1.3453 1.3453 0.000 4 26.00 12.003.7 1.0000 1.0000 1.3453 1.3453 1.3453 0.000 4 26.00 12.0011 1.0000 1.0000 1.3453 1.3453 1.3453 0.000 4 26.00 12.0033 1.0000 1.0000 1.3453 1.3453 1.3453 0.000 4 26.00 12.00
100 1.0000 1.0000 1.3453 1.3453 1.3453 0.000 4 26.00 12.00
Auxiliary Tests Statistic Critical Skew KurtShapiro-Wilk's Test indicates normal distribution (p > 0.01) 1 0.904 -1.21228 -0.57011Equality of variance cannot be confirmedThe control means are not significantly different (p = 1.00) 0 2.446912Hypothesis Test (1-tail, 0.05) NOEC LOEC ChV TUWilcoxon Rank Sum Test 100 >100 1
Dose-Response Plot
0
0.1
0.2
0.3
0.4
0.5
0.6
0.7
0.8
0.9
1
Pool
ed 0.1
1.2
3.7 11 33 100
48 H
r Su
rviv
al

Page 5 of 6
Statistics – QA Controls
15/07/2008 C. dubia 48-h Immobilit
y test - Copper Reference Toxicant Number of mobile organisms pH Conductivity D.O. Time Mean Prop'n mob Mean % Control Rep Nominal Measured 0 h 48 h 0 h 48 h 0 h 48 h 0 h 24 h 48 h 24 h 48 h 24 h 48 h 24 h 48 h 24 h 48 h
1 5 5 5 1.00 1.002 DMW <2 8.26 8.23 180 177 96% 92% 5 5 5 5.00 5.00 1.00 1.00 100% 100% 100% 100%3 Control 5 5 5 1.00 1.004 5 5 5 1.00 1.00
Mean Control % Mobile = 100% 100%1 5 5 5 1.00 1.002 Method <2 7.93 8.1 319 319 97% 93% 5 5 5 5.00 5.00 1.00 1.00 100% 100% 100% 100%3 Blank 5 5 5 1.00 1.004 5 5 5 1.00 1.00
1 5 5 5 1.00 1.002 2.5 2.5 8.25 8.26 177 178 96% 95% 5 5 5 5.00 5.00 1.00 1.00 100% 100% 100% 100%3 5 5 5 1.00 1.004 5 5 5 1.00 1.001 5 4 2 0.80 0.402 5.0 5.7 8.24 8.27 177 181 99% 94% 5 3 2 4.25 3.00 0.60 0.40 85% 60% 85% 60%3 5 5 3 1.00 0.604 5 5 5 1.00 1.001 5 1 0 0.20 0.002 10 9 8.21 8.3 177 181 97% 95% 5 0 0 0.75 0.25 0.00 0.00 15% 5% 15% 5%3 5 1 1 0.20 0.204 5 1 0 0.20 0.001 5 0 0 0.00 0.002 20 19 8.21 8.29 179 181 95% 95% 5 0 0 0.00 0.00 0.00 0.00 0% 0% 0% 0%3 5 0 0 0.00 0.004 5 0 0 0.00 0.001 5 0 0 0.00 0.002 40 36 8.10 8.29 180 181 96% 93% 5 0 0 0.00 0.00 0.00 0.00 0% 0% 0% 0%3 5 0 0 0.00 0.004 5 0 0 0.00 0.00
Experimental 48-h Control % Mobile = 100%Acceptable 48-h Control % Monile = 90%
Copper (µg/L) Mean Mobile (%)

Page 6 of 6
Ceriodaphnia Survival and Reproduction Test-48 Hr SurvivalStart Date: 15/07/2008 Test ID: NUA Sample ID: REF-Ref ToxicantEnd Date: 17/07/2008 Lab ID: CSIRO-CECR Sample Type: CUSO-Copper sulfateSample Date: Protocol: EPAF 91-EPA Freshwater Test Species: CD-Ceriodaphnia dubiaComments: Run alongside NUA Leachate, Measured copper concentrations
Conc-ug/L 1 2 3 4Control 1.0000 1.0000 1.0000 1.0000
2.5 1.0000 1.0000 1.0000 1.00005.7 0.4000 0.4000 0.6000 1.0000
9 0.0000 0.0000 0.2000 0.000019 0.0000 0.0000 0.0000 0.000036 0.0000 0.0000 0.0000 0.0000
Transform: Arcsin Square Root Rank 1-Tailed Number TotalConc-ug/L Mean N-Mean Mean Min Max CV% N Sum Critical Resp Number
Control 1.0000 1.0000 1.3453 1.3453 1.3453 0.000 4 0 202.5 1.0000 1.0000 1.3453 1.3453 1.3453 0.000 4 18.00 10.00 0 205.7 0.6000 0.6000 0.9002 0.6847 1.3453 34.607 4 12.00 10.00 8 20*9 0.0500 0.0500 0.2850 0.2255 0.4636 41.771 4 10.00 10.00 19 2019 0.0000 0.0000 0.2255 0.2255 0.2255 0.000 4 20 2036 0.0000 0.0000 0.2255 0.2255 0.2255 0.000 4 20 20
Auxiliary Tests Statistic Critical Skew KurtShapiro-Wilk's Test indicates non-normal distr ibution (p <= 0.01) 0.749849 0.844 1.68134 5.272309Equality of variance cannot be confirmedHypothesis Test (1-tail, 0.05) NOEC LOEC ChV TUSteel's Many-One Rank Test 5.7 9 7.162402
Trimmed Spearman-KarberTrim Level EC50 95% CL
0.0% 5.7131 4.9070 6.65165.0% 5.6962 4.8569 6.6806
10.0% 5.7796 4.8112 6.942820.0% 5.9448 4.5563 7.7564
Auto-0.0% 5.7131 4.9070 6.6516
Dose-Response Plot
0.0
0.1
0.2
0.3
0.4
0.5
0.6
0.7
0.8
0.9
1.0
1 10 100
Dose ug/L
Res
pons
e
0
0.1
0.2
0.3
0.4
0.5
0.6
0.7
0.8
0.9
1
Con
trol
2.5
5.7 *9 19 36
48 H
r Su
rviv
al

Investigation of Mineral-Based By-Product Use as a Soil Amendment: Results from the Bullsbrook Turf Farm, WA Page 85
APPENDIX 3: Results of laboratory column experiments using NUA to attenuate DOC, N and P in surface waters from the Swan Coastal Plain
Assessment of the Ability of NUA to Remove Organic Carbon and Nutrients from Surface Waters of the Swan Coastal Plain
SUMMARY Recent trials to intercept nutrients that enter the Swan Canning Estuary in drains that
interact with groundwater have shown that organic forms of nutrients (which often comprise the main source of total nitrogen) and dissolved phosphorous are not attenuated by some soil amendments nominally considered to have a high nutrient uptake capacity. The organic nitrogen may, under some circumstances, be transformed into inorganic species potentially available for algal uptake.
The primary objective of this study was to assess the ability of Neutralised Unused
Acid (NUA), a by-product of heavy mineral processing generated by Iluka Resources Ltd, to remove high concentrations of dissolved organic carbon and hence, organic nitrogen in addition to dissolved phosphorus from typical urban drainage waters from the Swan Coastal Plain.
A series of column sorption experiments were conducted to examine the removal of
nutrients and dissolved organic carbon (DOC) from surface waters.
The NUA was mixed with non-sorptive Bassendean Sand and placed within one-metre long stainless steel experimental columns. A mixture of Ellen Brook and Southern River water was passed through experimental columns and column influent and eluents analysed for DOC, soluble reactive phosphorous (PO4-P), total phosphorous (TP), dissolved organic nitrogen (DON), ammonical nitrogen (NH3-N), nitrite/nitrate (NOx-N), and total nitrogen (TN).
The NUA demonstrated substantial sorption capacity for DOC; over the course of
nearly 180 d, analysis of effluents from NUA-packed columns yielded more than a 39% decrease in DOC as compared to the Bassendean Sand reference column.
The NUA also demonstrated excellent capacity for capacity for sorption of N species
in column trials. The ca. 26% reduction in DON observed in NUA column effluent is likely primarily due to the retention of dissolved organic matter, and hence DON, within the solid matrix. The NUA exhibited excellent removal of both NOx-N and NH3-N species from influent water as compared to the Bassendean Sand reference column.
The NUA was particularly effective in the removal of PO4-P and TP (mostly present
as PO4-P) from influent water, exhibiting more than 95% PO4-P and TP attenuation as compared to the Bassendean Sand reference column. The uptake capacity of NUA for PO4-P or TP was not reached during the course of the experiment and trends did not indicate that the NUA was approaching capacity. As such, NUA sorption capacity for PO4-P and TP were not determined in this study.
In combination with results of turf farm field trials (Douglas et al., 2007) these results
from laboratory column trials indicate that NUA exhibits an unusually high P retention capacity and as such shows particular promise as an environmental amendment for
Investigation of Trace Element and Radionuclide Mobility in NUA-Amended Soils: Results from the Bullsbrook Turf Farm, WA
93

the attenuation of soils and waters containing high concentrations of labile P and the resultant prevention or attenuation of eutrophication in freshwater systems.
Additional investigation using an acidic water source is underway to assess the
potential for application of NUA to the attenuation of acidity, and removal of nutrients, metals and DOC from acidic waste streams.
It is important to note that the NUA used in this study was ground to maximise the
reactive surface area. Larger particle sizes if used in field applications may have a compromised performance in terms of both uptake kinetics and uptake capacity.
In the specific context of Ellen Brook or other DOC, DON and inorganic P-enriched
waters on the Swan Coastal Plain, NUA could be used for broad spectrum nutrient removal medium in applications such as drain liners or constructed wetlands subject to optimisation of design parameters.
1. INTRODUCTION Extensive modification of the Swan-Canning catchment due to urbanisation and intensive agriculture have resulted in the accumulation of a substantial inventory of nutrients within the catchment. Effective removal of nutrients and other contaminants such as trace metals and pathogens from the catchment is pivotal to effective long-term management of the Swan-Canning Estuary. The use of abundant, low-cost industrial by-products as filtration media within constructed wetlands offers a potentially cost-effective solution. Treatment of waters from the Ellen Brook catchment presents a distinctive challenge given the elevated dissolved organic carbon (DOC), organic nitrogen and phosphorus concentrations and the unique groundwater-surface water interaction. While Ellen Brook delivers only about 7% of the annual flow to the Swan-Canning river system, Ellen Brook waters contribute approximately 60% of the total phosphorus, ca. 9% of the total nitrogen, and a substantial proportion of dissolved organic carbon. Recent trials to intercept nutrients that enter the Swan Canning Estuary in drains that intercept groundwater have shown that organic forms of nutrients (which often comprise the main source of total N and P) are not attenuated by traditional soil amendments. The organic N and P may, under some circumstances, be transformed into inorganic species potentially available for algal uptake. The main goal of this study was to examine the use of NUA to remove high concentrations of organic nitrogen and phosphorus from urban, agricultural or industrial drainage water. The aim is to assess the utility of NUA for specific environmental applications. An additional benefit of the productive reuse of this nominally ‘zero-value’ by-product is to reduce the environmental footprint of the heavy minerals processing industry. Critical NUA material performance indicators include nutrient and organic carbon uptake capacity, transformations and stabilisation. If appropriate environmental applications can be identified, a prospect exists to further evaluate the efficacy of NUA in field trials in urban environments.
Investigation of Trace Element and Radionuclide Mobility in NUA-Amended Soils: Results from the Bullsbrook Turf Farm, WA
94

2. EXPERIMENTAL DESIGN
2.1. Design of Laboratory Columns Laboratory column sorption experiments were conducted to examine the removal of nutrients and DOC from surface waters by NUA. Experimental columns (1.0 m long, 2.2 cm ID, volume 380 cm3) were constructed from stainless steel with fittings at either end. To prevent column material blocking column influent and effluent, glass wool with a fine stainless steel mesh filter was placed within fittings at each end of the columns. Bassendean Sand from the Swan Coastal Plain was used as the non-sorptive phase in experimental columns, and comprised 100% of reference columns. In experimental columns the NUA reactive phase was contained in a 50% mixture with Bassendean Sand in the middle third of the column. The top and bottom third of NUA experimental columns was comprised entirely of Bassendean Sand.
2.2. Source Water for Laboratory Experiments Water for use in these experiments was collected from Ellen Brook and Southern River. Source waters were mixed in a 65/35 ratio of Ellen Brook to Southern River water then spiked with 100 µg L-1 P in the form of sodium phosphate (NaH2PO4·2H2O, Sigma). Water was stored in a 1400 litre polyethylene tank in the dark at 5°C for the duration of the experiment, and transported to the laboratory in polypropylene containers as needed. Water was pumped through the columns in a saturated up-flow mode with the flow being controlled by a low volume peristaltic pump (ISMATEC) on the influent line. Nylon (Nylaflow®) tubing was used on the influent and effluent lines. Water was pumped through at a constant flow rate of ~0.5 mL min-1. A fraction collector was used to collect aqueous samples for analysis.
2.3. Analysis of Column Eluents Column eluent was collected every three days and the sample split into several sub-samples for analysis. Column eluent samples were analysed weekly. Sub-samples for measurement of UV/Vis absorbance and cation or anion determinations were filtered to 0.7 µm (Whatman GF/F filter) and acidified to pH ~2 prior to analysis. Acidified, filtered sub-samples from experimental columns were analysed by ion-coupled plasma-optical emission spectroscopy (ICP-OES) for a suite of cations including: Al, Ca, Fe, Mg, Mn, P, K, Si, S and Na. Filtered, acidified sub-samples from selected columns were analysed for As, Cd, Pb and Se using ICP-mass spectrometry (ICP-MS) in addition to the normal suite of cations. Chloride in acidified, filtered samples was determined colorimetrically using the ferricyanide method APHA 4500 Cl- E (Clesceri et al., 1998). Sulfate was calculated using S values determined by ICP-OES. Sub-samples for UV/Vis absorbance measurements at 254, 465 and 665 nm were filtered to 0.7 µm and acidified to pH ~2 prior to analysis. Dissolved organic carbon was quantified in selected samples by the high temperature oxidation technique with a Shimadzu TOC 5000. For each material, the relationship determined between measured DOC and absorbance at 254 nm was used to estimate DOC in remaining samples (Gondar et al., 2008). Nutrients were determined in non-acidified sub-samples from each experimental column filtered to 0.7 µm. Samples were prepared using an alkaline persulfate digestion method
Investigation of Trace Element and Radionuclide Mobility in NUA-Amended Soils: Results from the Bullsbrook Turf Farm, WA
95

(Patton and Kryskalla, 2003) and quantified with a Skalar San+ Automated Wet Chemistry Analyser. Sub-samples for alkalinity determination were not filtered or acidified, but were collected in a sealed container without headspace and refrigerated at 4°C until analysis.
3. RESULTS
3.1. Bassendean Sand Reference Columns A large portion of Western Australia’s Swan Coastal Plain is comprised of heavily leached, siliceous dune systems, including Bassendean Sands (Playford et al., 1976). Due to its widespread distribution underlying the Perth metropolitan area, Bassendean Sand was selected as the reference solid phase for control columns, and for fill material to mix with potentially sorptive solid phases in experimental columns. Bassendean Sands are predominantly (>98%) SiO2. Apart from a small amount of Al2O3 (0.11–0.17%) and Fe2O3 (0.39–0.42%) other major element concentrations in Bassendean Sands are low. Reference columns containing only the Bassendean Sand were assessed relative to the inlet water. All materials were assessed relative to these Bassendean Sand control columns. The Bassendean Sand exhibited no sorptive capacity for DOC (Figure 1). Results from laboratory column experiments showed a substantial initial increase of DOC in Bassendean Sand column eluents as compared to inlet water. Throughout the course of the study, the cumulative quantity of DOC in Bassendean Sand column eluents was greater than that of the inlet water (Figure 1). This increase in DOC in Bassendean Sand column eluents relative to inlet water is likely due to flushing of weakly adsorbed residual organic material though the column, and subsequent breakdown of particulate organic matter over time.
Day
0 30 60 90 120 150 180
DO
C (m
g L-
1 ) re
lativ
e to
inle
t wat
er
0
20
40
60
80
100
Figure 1. Dissolved organic carbon (DOC) in Bassendean Sand reference column relative to influent water over time. Broken line indicates zero relative to inlet water, or DOC equal to the quantity in inlet water.
Bassendean Sand controls columns exhibited a limited capacity for both TP and PO4-P sorption (Figure 2, Table 1). The removal of P from inlet water is most likely a result of P sorption to the small amounts of Al2O3 and Fe2O3 in Bassendean Sand, or complexation with residual organic material within the sand.
Investigation of Trace Element and Radionuclide Mobility in NUA-Amended Soils: Results from the Bullsbrook Turf Farm, WA
96

Day
0 30 60 90 120 150 180
Tota
l P (m
g L-
1 ) re
lativ
e to
inle
t wat
er
-0.7
-0.6
-0.5
-0.4
-0.3
-0.2
Day
0 30 60 90 120 150 18
PO
4-P
(mg
L-1 )
rela
tive
to in
let w
ater
0-0.6
-0.5
-0.4
-0.3
-0.2
-0.1
0.0
Figure 2. Total phosphorous and phosphate P (PO4-P) in Bassendean Sand reference column eluents relative to influent water over time.
Despite the initial release of a substantial quantity of N from the Bassendean Sand reference column, primarily in the form of NOx-N, the sand exhibits slight retention of NOx-N throughout the duration of the experiment (Figure 3). However, a net increase in the cumulative quantity of NH3-N, DON and TN is observed in Bassendean Sand reference column eluents as compared to inlet water indicating possible NOx-N loss (transformation) via denitrification (Table 1).
Investigation of Trace Element and Radionuclide Mobility in NUA-Amended Soils: Results from the Bullsbrook Turf Farm, WA
97

Day
0 30 60 90 120 150 180
Tota
l N (m
g L-
1 ) re
lativ
e to
inle
t wat
er
0
3
6
9
12
Day
0 30 60 90 120 150 18
NH
3-N
(mg
L-1 )
rela
tive
to in
let w
ater
0-0.5
0.0
0.5
1.0
1.5
2.0
Day
0 30 60 90 120 150 180
NO
x-N
(mg
L-1 )
rela
tive
to in
let w
ater
0
2
4
6
8
Day
0 30 60 90 120 150 180
DO
N (m
g L-
1 ) re
lativ
e to
inle
t wat
er
-2
-1
0
1
2
3
Figure 3. Total N, NH3-N, NOx-N and DON (mg L-1) concentrations in eluents from Bassendean Sand reference columns over time relative to influent water.
The increase in both DOC and N in Bassendean Sand reference column eluents as compared to inlet water indicates that the sands underlying most of the Swan Coastal Plain are essentially non-retentive for nutrients and DOC. The retention of some P is likely due to P sorption on organic matter or oxides within the solid phase.
Table 1. Calculated percent NOx-N, NH3-N, DON, TN, PO4-P, TP and DOC added or removed from inlet water by Bassendean Sand in experimental laboratory columns, and the estimated sorption capacity of Bassendean Sand for each analyte (in mg kg-1).
Analyte added/removed (%) Estimated sorption capacity (mg kg-1) NOx-N -7 ND† NH3-N +63 0 DON +7 0 TN +12 0 PO4-P -37 ND TP -37 ND DOC +5 0 †Sorption capacity not determined.
Investigation of Trace Element and Radionuclide Mobility in NUA-Amended Soils: Results from the Bullsbrook Turf Farm, WA
98

3.2. Iluka Resources Ltd. Neutralised Unused Acid (NUA) Mineralogical analysis of NUA by X-ray diffraction (XRD) indicated that the main ordered mineral phase contained in NUA is bassanite (2CaSO4·H2O), a partially dehydrated gypsum. X-ray fluorescence (XRF) analysis showed that NUA is primarily comprised of Fe2O3, principally magnetite and haematite. The NUA used in column experiments was obtained from the Capel operations of Iluka Resources Ltd and ground in a WC swing mill prior to use. Laboratory investigations using NUA to attenuate DOC, N and P in surface waters showed a substantial 39% reduction in DOC as a result of passage through the NUA packed column (Figure 4). Breakthrough of DOC in column eluents was observed following approximately 150 d column operation, indicating a DOC sorption capacity of approximately 7.3 g kg-1 NUA (Table 2).
Time (d)
0 30 60 90 120 150 180
DO
C (m
g/L)
rela
tive
to c
ontro
l
-60
-50
-40
-30
-20
-10
0
Figure 4. Dissolved organic carbon (DOC) in NUA column eluent relative to Bassendean Sand reference column over time.
The NUA exhibited excellent P removal from influent water. Greater than 95% removal of PO4-P from inlet water by NUA was observed in laboratory column trials throughout the course of the experiment (Figure 5). Total P in inlet water was reduced by more than 95% after passing through the NUA column (Figure 5, Table 2). It was not possible to calculate PO4-P or TP sorption capacities for NUA, as results yielded no clear indication of projected PO4-P or TP breakthrough in the NUA column.
Investigation of Trace Element and Radionuclide Mobility in NUA-Amended Soils: Results from the Bullsbrook Turf Farm, WA
99

Day
0 30 60 90 120 150 180
Tota
l P (m
g L-
1 )
0.0
0.1
0.2
0.3
0.4
0.5
0.6
Control NUA
Day
0 30 60 90 120 150 180
PO
4-P
(mg
L-1 )
0.0
0.1
0.2
0.3
0.4
0.5
Control NUA
Figure 5. Total phosphorus and phosphate P (PO4-P) in control and NUA column eluents over time.
The NUA exhibited good sorption of N species from inlet water, particularly inorganic N (Figure 6, Table 2). In the first day of operation, NUA removed 86% of the total N as compared to control columns. The total N removal by NUA declined with time to approximately a 2% reduction in N content relative to control column eluent after 180 d. Removal of NOx-N by NUA followed much the same pattern as that observed for total N (Figure 6). However, clear breakthrough was observed for NH3-N following 78 days column operation (Figure 6). Overall, DON and total N concentrations in NUA column eluents were reduced by 27% and 45%, respectively (Table 2). Removal of substantially greater proportions of inorganic NOx-N and NH3-N species was observed, with 79% of the NOx-N and 77% of the NH3-N retained within the NUA column as compared to Bassendean Sand reference columns.
Investigation of Trace Element and Radionuclide Mobility in NUA-Amended Soils: Results from the Bullsbrook Turf Farm, WA
100

Day
0 30 60 90 120 150 1800
3
6
9
12
15
ControlNUA
Tota
l N (m
g L-
1 )
Day
0 30 60 90 120 150 180
NH
3-N
(mg
L-1 )
0.0
0.5
1.0
1.5
2.0
2.5Control NUA
Day
0 30 60 90 120 150 180
NO
x-N
(mg
L-1 )
0
2
4
6
8
10 Control NUA
Day
0 30 60 90 120 150 180
DO
N (m
g L-
1 )
0
1
2
3
4Control NUA
Figure 6. Total N, NH3-N, NOx-N and DON (mg L-1) concentrations in eluents from NUA and Bassendean Sand reference columns over time.
Table 2. Calculated percent NOx-N, NH3-N, DON, TN, PO4-P, TP and DOC removed by NUA relative to Bassendean Sand reference in experimental laboratory columns, and the estimated sorption capacity of NUA for each analyte (in mg kg-1).
Analyte removed (%) Estimated sorption capacity (mg kg-1) NOx-N 79 127 NH3-N 77 129 DON 27 143 TN 45 396 PO4-P 96 ND† TP 96 ND† DOC 39 7,259 †Sorption capacities for PO4-P and TP not determined as no breakthrough occurred.
4. GEOCHEMICAL MODELLING Interpretation of the solute geochemistry was made on effluent from the Bassendean Sand (reference) and NUA columns. Geochemical modelling facilitates insight into the processes regulating solute chemistry and nutrient uptake within the Bassendean Sand and NUA.
Investigation of Trace Element and Radionuclide Mobility in NUA-Amended Soils: Results from the Bullsbrook Turf Farm, WA
101

Geochemical modelling of the solute major ion (Na, K, Ca, Mg, Cl, HCO3, SO4) and Fe, Al and Mn chemistry was undertaken using PHREEQC for Windows V1.5.10 (Parkhurst, 1995). Methods of column construction, operation and of the trace element behaviour are given above. The PHREEQC calculations were used to estimate the saturation index (SI) of a suite of mineral phases, in particular, those of Al, Fe and Mn minerals. Minerals comprised of these elements were modelled as it is likely that they will also strongly influence the speciation of the majority of other major and trace elements in the column and any permeable reactive barrier application. The SI of other minerals likely to strongly influence solute geochemistry such as carbonates and sulphates were also modelled. A list of these minerals is in groupings is given below in Table 3. Mineral dissolution reactions and solubility products used to calculate SIs are given in Table 4. The saturation index (SI) for a given mineral is defined as:
SI = log IAP/Ksp where IAP = ion activity product of the chemical species involved in the reaction, and
Ksp = the solubility product for the designated mineral. The SI gives an estimation of the degree of over, under or equilibrium saturation of a particular mineral phase for the prevailing solute chemistry. The SI is commonly plotted as a function of solution pH to examine the effect of pH on mineral equilibria and hence, saturation/solubility. In this study the SI was also plotted relative to time as increasing volumes of solute passed through the experimental columns containing the RS or NUA material. Table 3. Mineral groups modelled in this study.
Al minerals Alunite KAl3(SO4)2(OH)6 Basaluminite Al4SO4(OH)10:5H2O Gibbsite Al(OH)3 Jurbanite AlOHSO4 Al(OH)3 amorphous Al(OH)3(am) Fe minerals Hematite Fe2O3 Ferrihydrite Fe(OH)3 Goethite FeOOH K-jarosite KFe3(SO4)2(OH)6 Na-jarosite NaFe3(SO4)2(OH)6 Mn minerals Manganite MnOOH Rhodochrosite MnCO3 Pyrolusite MnO2 Carbonates/sulphates Calcite CaCO3 Dolomite (Ca,Mg)CO3 Anhydrite CaSO4 Gypsum CaSO4.2H2O
Investigation of Trace Element and Radionuclide Mobility in NUA-Amended Soils: Results from the Bullsbrook Turf Farm, WA
102

Table 4. Minerals, reactions and log Ksp (at 25°C) used in PHREEQC calculations†.
Mineral Reaction log K Alunite KAl3(SO4)2(OH)6 → K+ + 3Al3+ + 2SO4
2- + 6H2O -1.35 Basaluminite Al4SO4(OH)10:5H2O + 10H+ → 4Al3+ + SO4
2- + 15H2O 22.70 Calcite CaCO3 + 2H+ → Ca2+ + H2CO3 -8.48 Dolomite CaMg(CO3)2 + 4H+ → Ca2+ + Mg2+ + 2H2CO3 -17.09 Ferrihydrite Fe(OH)3 + 3H+ → Fe3+ + 3H2O 4.89 Gibbsite Al(OH)3 + 3H+ → Al3+ + 3H2O 8.77 Goethite FeOOH + 3H+ → Fe3+ + 2H2O 0.50 Gypsum CaSO4:2H2O → Ca2+ + SO4
2- + 2H2O -4.58 Jarosite-K KFe3(SO4)2(OH)6 + 6H+ → K+ + 3Fe3+ +2SO4
2- + 6H2O -14.80 Jarosite-Na NaFe3(SO4)2(OH)6 + 6H+ → Na+ + 3Fe3+ +2SO4
2- + 6H2O -11.20 Jurbanite AlOHSO4 + H+ → Al3+ + SO4
2- + H2O -3.23 Manganite MnOOH + 3H+ + e- → Mn2+ + 2H2O 25.34 Pyrolusite MnO2:H2O + 4 H+ + 2e- → Mn2+ + 3H2O 41.38 Rhodochrosite MnCO3 → Mn2+ + CO3
2- -11.13 Schwertmannite Fe8O8(OH)6SO4 + 22H+ 8Fe3+ + 14H2O + SO4
2- 18.00 †All log K derived from PHREEQC database
4.1. Geochemical Modelling of Bassendean Sand Column Variation of the SI of Al (Figure 7), Fe (Figure 8), Mn (Figure 9) and carbonate, sulphate and phosphate (Figure 10) minerals as a function of pH in the Bassendean Sand (reference) column is shown below. Variation of the SI of clay minerals and amorphous silica with pH in the Bassendean Sand (reference) column is given in Figure 11. Variation of the SI of Al (Figure 12), Fe (Figure 13), Mn (Figure 14) and carbonate, sulphate and phosphate (Figure 15) minerals with time in the Bassendean Sand (reference) column is shown below. Variation of the SI of clay minerals and amorphous SiO2 with time in the Bassendean Sand (reference) column is given in Figure 16. Variation in the concentration of major cations and anions (Figure 17, Figure 18), Al, Fe, Mn (Figure 19) and nutrients (Figure 20) with time in the Bassendean Sand (reference) column is shown below. Amorphous Al(OH)3 and gibbsite formed similar shaped distributions as a function of pH with only the latter mineral displaying saturation (Figure 7). Given the similar degree of under and oversaturation of amorphous Al(OH)3 and gibbsite, it is possible that a partially crystalline phase intermediate between these two minerals controlled Al solubility in the Bassendean Sand column. Alunite, jurbanite and basaluminite all defined portions of a suite of typically convex curves relative to pH (Figure 7). All of these minerals are undersaturated at the pH of the experiments. Ferrihydrite, goethite, hematite and schwertmannite all exceeded saturation over the pH range of the Bassendean Sand column effluent (Figure 8). Ferrihydrite was the mineral closest to saturation and hence, may have been the most influential in regulation of dissolved Fe concentrations in the Bassendean Sand column. Both Na- and K-jarosite were highly undersaturated throughout the column experiment. The three manganese minerals manganite, rhodochrosite and pyrolusite were generally all undersaturated to varying degrees during the Bassendean Sand column trial (Figure 9). Rhodochrosite, however, became close to equilibrium or saturated for a number of samples.
Investigation of Trace Element and Radionuclide Mobility in NUA-Amended Soils: Results from the Bullsbrook Turf Farm, WA
103

Gypsum and anhydrite were undersaturated over all pH (Figure 10). Calcite and dolomite, displayed a strong linear relationship with pH ranging from under- to oversaturation with increasing pH. Hydroxyapatite also displayed a strong although more complex relationship with pH with most samples of pH 7.5 oversaturated. Kaolinite was saturated throughout the entire Bassendean Sand column trial irrespective of pH (Figure 11). In contrast, Ca-montmorillonite and illite were both over and undersaturated with the degree of undersaturation most consistent above pH 8. Amorphous silica was undersaturated throughout the entire Bassendean Sand column experiment. Throughout this column trial, the saturation indices of Al- and Fe-minerals remained similar with few changes between under- and oversaturation (Figure 12, Figure 13). The most significant change in saturation indices which corresponded to a decline in a range of element concentrations occurred between day 60 and 80. Rhodochrosite became undersaturated, with gypsum and calcite becoming oversaturated (Figure 14, Figure 15). Hydroxyapatite also became oversaturated, reaching its maximum saturation of ca. 103.5 by around day 60 (Figure 15). Kaolinite remained oversaturated and SiO2(am) undersaturated over the course of the column experiment (Figure 16). In contrast, both Ca-montmorillonite and illite were both over- and undersaturated with this trend closely following pH (Figure 16). After day 10, effluent pH and major ion concentrations were similar throughout the Bassendean Sand column trial (Figure 17, Figure 18, Figure 19). Prior to day 10 concentrations major ions except Mg (which remained more or less unchanged) were 1-2 times greater than subsequent effluent concentrations for the remainder of the column trial. In general, major ion concentrations remained similar despite changes in mineral saturation indices (Figure 17). The most substantial change, however, occurred in the concentration of Mn which declined substantially after day 60 to close to detectible limits after day 80 (Figure 19). While Fe concentrations were erratic throughout the column trial, there was a general increasing trend in Fe concentrations after day 10 (Figure 19). Although there were similar initially elevated concentrations for Al, Fe and Mn during the first 10 days of the Bassendean Sand column trial, there was a further substantial decline in Mn concentrations after ca. day 80. In contrast, after the initial decline in concentration, both Fe and Al increased erratically in concentration for the remainder of the experiment with concentrations often similar to the commencement of the column trial (Figure 19). Nutrient concentrations displayed a similar pattern to that of major ions and metals with an initial, often substantial decline in concentration (note log scale, Figure 20). Major temporal variations occurred in PO4-P, NH3-N and NO3-N concentrations in the Bassendean Sand column trial (Figure 20). From the commencement of the column trial until ca. day 60 PO4-P concentrations increased by an order of magnitude from ca. 0.02 – 0.2 mg L-1. Thereafter PO4-P concentrations remained similar for the duration of the column trial. In contrast to PO4-P, NH3-N concentrations declined sharply after around day 70 by up to two orders of magnitude from ca. 1 mg L-1 to as low as 0.01 mg L-1. Similarly, NO3-N concentrations also declined, albeit less dramatically by over one order of magnitude to a low of 0.01 mg L-1. In contrast to the inorganic nitrogen species, TN retained a similar temporal concentration profile.
Investigation of Trace Element and Radionuclide Mobility in NUA-Amended Soils: Results from the Bullsbrook Turf Farm, WA
104

7 8-9
-8
-7
-6
-5
-4
-3
-2
-1
0
1
2
9
Sat
urat
ion
Inde
x (S
I)
pH
Al(OH)3(am)
Alunite Basaluminite Gibbsite Jurbanite
Figure 7. Variation in the saturation index (SI) of Al minerals with pH in the Bassendean Sand (reference) column.
7 8 9-10
-5
0
5
10
15
20
25
Sat
urat
ion
Inde
x
pH
Ferrihydrite Goethite Hematite Schwetmannite K-Jarosite Na-Jarosite
Figure 8. Variation in the saturation index (SI) of Fe minerals with pH in the Bassendean Sand (reference) column.
Investigation of Trace Element and Radionuclide Mobility in NUA-Amended Soils: Results from the Bullsbrook Turf Farm, WA
105
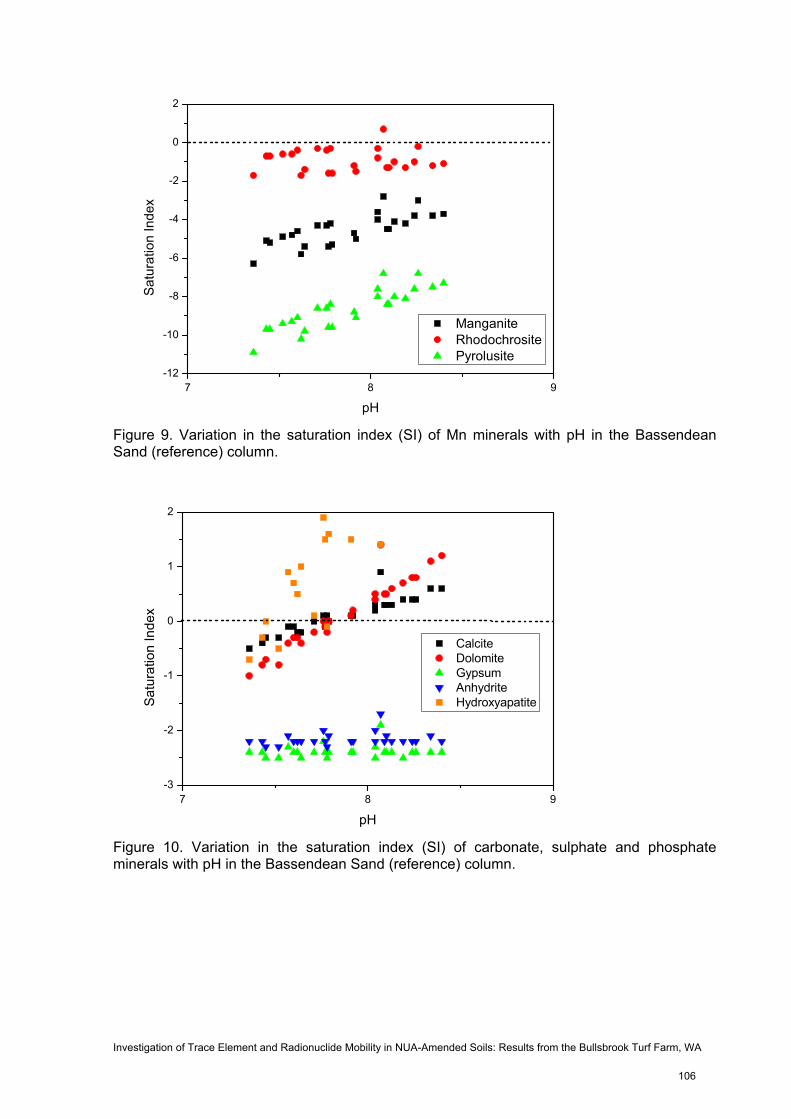
7 8 9-12
-10
-8
-6
-4
-2
0
2
Manganite Rhodochrosite Pyrolusite
Sat
urat
ion
Inde
x
pH Figure 9. Variation in the saturation index (SI) of Mn minerals with pH in the Bassendean Sand (reference) column.
7 8-3
-2
-1
0
1
2
9
Calcite Dolomite Gypsum Anhydrite HydroxyapatiteSa
tura
tion
Inde
x
pH Figure 10. Variation in the saturation index (SI) of carbonate, sulphate and phosphate minerals with pH in the Bassendean Sand (reference) column.
Investigation of Trace Element and Radionuclide Mobility in NUA-Amended Soils: Results from the Bullsbrook Turf Farm, WA
106

7 8 9-2
-1
0
1
2
3
4 Ca-montmorillonite Illite Kaolinite SiO2 (am)
Sat
urat
ion
Inde
x
pH Figure 11. Variation in the saturation index (SI) of clay minerals and SiO2(am) with pH in the Bassendean Sand (reference) column.
0 20 40 60 80 100 120 140 160 180-10
-5
0
5
10
Satu
ratio
n In
dex
(SI)
Days
pH Al(OH)3(am)
Alunite Basaluminite Gibbsite Jurbanite
Figure 12. Variation in the saturation index (SI) of Al minerals with time in the Bassendean Sand (reference) column.
Investigation of Trace Element and Radionuclide Mobility in NUA-Amended Soils: Results from the Bullsbrook Turf Farm, WA
107

0 20 40 60 80 100 120 140 160 180-20
-10
0
10
20
Sat
uarti
on In
dex
(SI)
Days
pH Hematite Ferrihydrite Goethite Jarosite-K Jarosite-Na
Figure 13. Variation in the saturation index (SI) of Fe minerals with time in the Bassendean Sand (reference) column.
0 20 40 60 80 100 120 140 160 180-15
-10
-5
0
5
10
Satu
ratio
n In
dex
(SI)
Days
pH Manganite Rhodochrosite Pyrolusite
Figure 14. Variation in the saturation index (SI) of Mn minerals with time in the Bassendean Sand (reference) column.
Investigation of Trace Element and Radionuclide Mobility in NUA-Amended Soils: Results from the Bullsbrook Turf Farm, WA
108

0 20 40 60 80 100 120 140 160 180-3
-2
-1
0
1
2
3
4
5
6
7
8
9
Sat
urat
ion
Inde
x (S
I)
Days
pH Calcite Dolomite Gypsum Anhydrite Hydroxyapatite
Figure 15. Variation in the saturation index (SI) of carbonate, sulphate and phosphate minerals with time in the Bassendean Sand (reference) column.
0 20 40 60 80 100 120 140 160 180-2
-1
0
1
2
3
4
5
6
7
8
9
Sat
urat
ion
Inde
x (S
I)
Days
pH Ca-montmorillonite Illite Kaolinite SiO2(am)
Figure 16. Variation in the saturation index (SI) of clay minerals and SiO2(am) with time in the Bassendean Sand (reference) column.
Investigation of Trace Element and Radionuclide Mobility in NUA-Amended Soils: Results from the Bullsbrook Turf Farm, WA
109

0 20 40 60 80 100 120 140 160 1800
20
40
60
80
100
120
140
Na K Ca Mg pH
Days
Con
cent
ratio
n (m
g/L)
7.0
7.5
8.0
8.5
9.0
pH
Figure 17. Variation in major cation solute concentrations and pH with time in the Bassendean Sand (reference) column.
0 20 40 60 80 100 120 140 160 1800
50
100
150
200
250 SO4
Si HCO3
Cl pH
Days
Con
cent
ratio
n (m
g/L)
7.0
7.5
8.0
8.5
9.0
pH
Figure 18. Variation in major anion solute concentrations and pH with time in the Bassendean Sand (reference) column.
Investigation of Trace Element and Radionuclide Mobility in NUA-Amended Soils: Results from the Bullsbrook Turf Farm, WA
110

0 20 40 60 80 100 120 140 160 1800.0
0.1
0.2
0.3
0.4
0.5
0.6
Al Fe Mn pH
Days
Con
cent
ratio
n (m
g/L)
7.0
7.5
8.0
8.5
9.0
pH
Figure 19. Variation in Al, Fe and Mn solute concentrations and pH with time in the Bassendean Sand (reference) column.
0 20 40 60 80 100 120 140 160 1801E-3
0.01
0.1
1
10
100 NO3-N NH3-N PO4-P TN pH
Days
Con
cent
ratio
n (m
g/L)
7.0
7.5
8.0
8.5
9.0
pH
Figure 20. Variation in nutrient concentrations and pH with time in the Bassendean Sand (reference) column.
4.2. Geochemical Modelling of NUA Column Variation of the SI of Al (Figure 21), Fe (Figure 22), Mn (Figure 23) and carbonate, sulphate and phosphate (Figure 24) minerals as a function of pH is in the NUA column is shown below. Variation of the SI of clay minerals and amorphous silica with pH in the NUA column is given in Figure 25. Variation of the SI of Al (Figure 26), Fe (Figure 27), Mn (Figure 28) and carbonate, sulphate and phosphate (Figure 29) minerals with time in the NUA column is shown below. Variation of the SI of clay minerals and amorphous silica with time in the NUA column is given in Figure 30. Variation in the concentration of major cations and anions
Investigation of Trace Element and Radionuclide Mobility in NUA-Amended Soils: Results from the Bullsbrook Turf Farm, WA
111

(Figure 31, Figure 32), Al, Fe, Mn (Figure 33) and nutrients (Figure 34) with time in the NUA column is shown below. Within the narrow pH range of ca. 7.5–8.5 in column effluent in the NUA column, amorphous Al(OH)3 and gibbsite formed similar distributions as a function of pH (Figure 21). Only gibbsite displayed saturation, however, generally by one to two orders of magnitude while amorphous Al(OH)3 was generally undersaturated by a similar margin (Figure 21). Alunite, jurbanite and basaluminite all defined portions of a suite of typically convex curves relative to pH (Figure 21). All of these minerals were in general strongly undersaturated at the pH of the NUA column. Ferrihydrite, goethite, hematite and schwertmannite all exceeded saturation over the pH range of the NUA column effluent (Figure 22). Ferrihydrite was the mineral closest to saturation and hence, may have been the most influential in regulation of dissolved Fe concentrations in the NUA column. Both Na- and K-jarosite were highly undersaturated throughout the NUA column experiment (Figure 22). The manganese minerals: manganite, and pyrolusite were generally all undersaturated at all pH in the NUA column trial (Figure 23). Rhodochrosite, however, was both over and undersaturated, typically by one to two orders of magnitude. Gypsum and anhydrite displayed both undersaturation and equilibrium with solution in the NUA column experiment (Figure 24). Calcite and dolomite, displayed a strong linear relationship with pH with increased oversaturation with increasing pH (Figure 24). Hydroxyapatite was both under- and oversaturated with no apparent relationship with pH, often being oversaturated when gypsum and anhydrite were at equilibrium (Figure 24). Kaolinite, Ca-montmorillonite and illite were both under and oversaturated during the NUA column trial (Figure 25). Amorphous silica was undersaturated by approximately two orders of magnitude throughout the entire NUA column trial (Figure 25). Throughout this column trial, the saturation indices of Al- and Fe-minerals remained similar with few changes between under- and oversaturation (Figure 26, Figure 27). The only exception was for gibbsite which was both transiently over- and undersaturated according to effluent pH (Figure 26). In a similar fashion to gibbsite, only ferrihydrite displayed transient under- and oversaturation with time (Figure 27). The largest change in the degree of saturation for Fe-minerals occurred after approximately day 40 where there were large, but intermittent increases in the degree of oversaturation for schwertmannite (Figure 27). Of the Mn-minerals, only rhodochrosite came into equilibrium with the column effluent after approximately day 60 and then gradually more oversaturated after approximately day 120 (Figure 28). Both calcite and dolomite were at saturation limits or oversaturated during the NUA column trial (Figure 29). Gypsum and anhydrite were at equilibrium with the NUA column effluent up to day 90; thereafter, both of these minerals became progressively more undersaturated (Figure 29). Hydroxyapatite, while initially oversaturated up to approximately day 110, generally became increasingly undersaturated, thereafter (Figure 29). All three of the clay minerals, kaolinite, Ca-montmorillonite and illite became changed from under- to oversaturation with time (Figure 30). Kaolinite remained near to or oversaturated for the majority of time after day 20, while Ca-montmorillonite and illite were both over and
Investigation of Trace Element and Radionuclide Mobility in NUA-Amended Soils: Results from the Bullsbrook Turf Farm, WA
112

undersaturated after day 80 (Figure 30). Amorphous silica was always undersaturated by approximately two orders of magnitude throughout the NUA column trial Effluent pH and major ion concentrations varied for Ca and SO4 by over an order of magnitude throughout the NUA column trial (Figure 31, Figure 32). In particular both Ca and sulfate concentrations declined substantially after approximately day 90 from a maximum of ca. 2500 mg L-1 to a minimum of ca. 250mg L-1 for both species (Figure 31, Figure 32). Other major ions maintained a similar temporal concentration profile throughout the NUA column trial. In contrast to Ca and SO4 concentrations, Mn concentrations initially increased after approximately day 60 and then more substantially after day 90 attaining a maximum concentration of ca. 1.3 mg L-1 in the NUA column effluent (Figure 33). Both Al and Fe concentrations increased transiently between days ca. 130 and 160 with the onset of the increase temporally associated with the second increase in Mn concentrations (Figure 33). Nutrient concentrations often displayed an erratic concentration pattern with time during the NUA column experiment (Figure 34). This was particularly apparent in the initial 60 days where there were substantial changes in PO4-P, NH3-N and NO3-N concentrations which often exceeded an order of magnitude and pH displayed its largest variation (Figure 34). After day 60 TN concentrations remained stable relative to the preceding period while PO4-P, NH3-N and NO3-N concentrations generally declined (Figure 34).
7 8 9-12-11-10-9-8-7-6-5-4-3-2-10123
Sat
urat
ion
Inde
x (S
I)
pH
Al(OH)3(am)
Alunite Basaluminite Gibbsite Jurbanite
Figure 21. Variation in the saturation index (SI) of Al minerals with pH in the NUA column.
Investigation of Trace Element and Radionuclide Mobility in NUA-Amended Soils: Results from the Bullsbrook Turf Farm, WA
113

7 8-15
-10
-5
0
5
10
15
20
25
9
Ferrihydrite Goethite Hematite Schwertmannite Jarosite-K Jarosite-Na
Sat
urat
ion
Inde
x
pH Figure 22. Variation in the saturation index (SI) of Fe minerals with pH in the NUA column.
7 8-12
-10
-8
-6
-4
-2
0
2
9
Manganite Rhodochrosite Pyrolusite
Sat
urat
ion
Inde
x
pH Figure 23. Variation in the saturation index (SI) of Mn minerals with pH in the NUA column.
Investigation of Trace Element and Radionuclide Mobility in NUA-Amended Soils: Results from the Bullsbrook Turf Farm, WA
114

7 8-3
-2
-1
0
1
2
3
9
Calcite Dolomite Gypsum Anhydrite Hydroxyapatite
Satu
ratio
n In
dex
pH Figure 24. Variation in the saturation index (SI) of carbonate, sulphate and phosphate minerals with pH in the NUA column.
7 8 9-9
-8
-7
-6
-5
-4
-3
-2
-1
0
1
2
3
4
5
Ca-montmorillonite Illite KaoliniteSiO2 (am)
Satu
ratio
n In
dex
pH Figure 25. Variation in the saturation index (SI) of clay minerals and SiO2(am) with pH in the NUA column.
Investigation of Trace Element and Radionuclide Mobility in NUA-Amended Soils: Results from the Bullsbrook Turf Farm, WA
115

0 20 40 60 80 100 120 140 160 180-15
-10
-5
0
5
10
Sat
urat
ion
Inde
x (S
I)
Days
pH Al(OH)3(am)
Alunite Basaluminite Gibbsite Jurbanite
Figure 26. Variation in the saturation index (SI) of Al minerals with time in the NUA column.
0 20 40 60 80 100 120 140 160 180-15
-10
-5
0
5
10
15
20
25
Satu
artio
n In
dex
(SI)
Days
pH Hematite Ferrihydrite Goethite Jarosite-K Jarosite-Na Schwertmannite
Figure 27. Variation in the saturation index (SI) of Fe minerals with time in the NUA column.
Investigation of Trace Element and Radionuclide Mobility in NUA-Amended Soils: Results from the Bullsbrook Turf Farm, WA
116
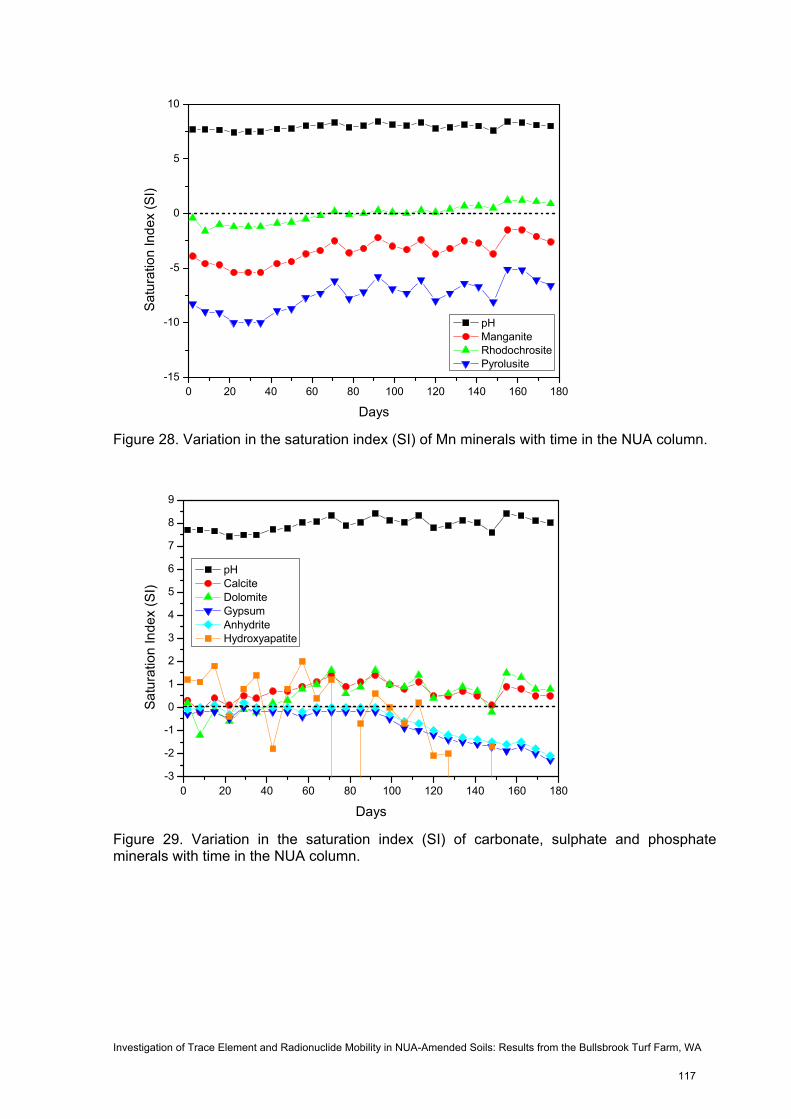
0 20 40 60 80 100 120 140 160 180-15
-10
-5
0
5
10
Satu
ratio
n In
dex
(SI)
Days
pH Manganite Rhodochrosite Pyrolusite
Figure 28. Variation in the saturation index (SI) of Mn minerals with time in the NUA column.
0 20 40 60 80 100 120 140 160 180-3
-2
-1
0
1
2
3
4
5
6
7
8
9
Satu
ratio
n In
dex
(SI)
Days
pH Calcite Dolomite Gypsum Anhydrite Hydroxyapatite
Figure 29. Variation in the saturation index (SI) of carbonate, sulphate and phosphate minerals with time in the NUA column.
Investigation of Trace Element and Radionuclide Mobility in NUA-Amended Soils: Results from the Bullsbrook Turf Farm, WA
117
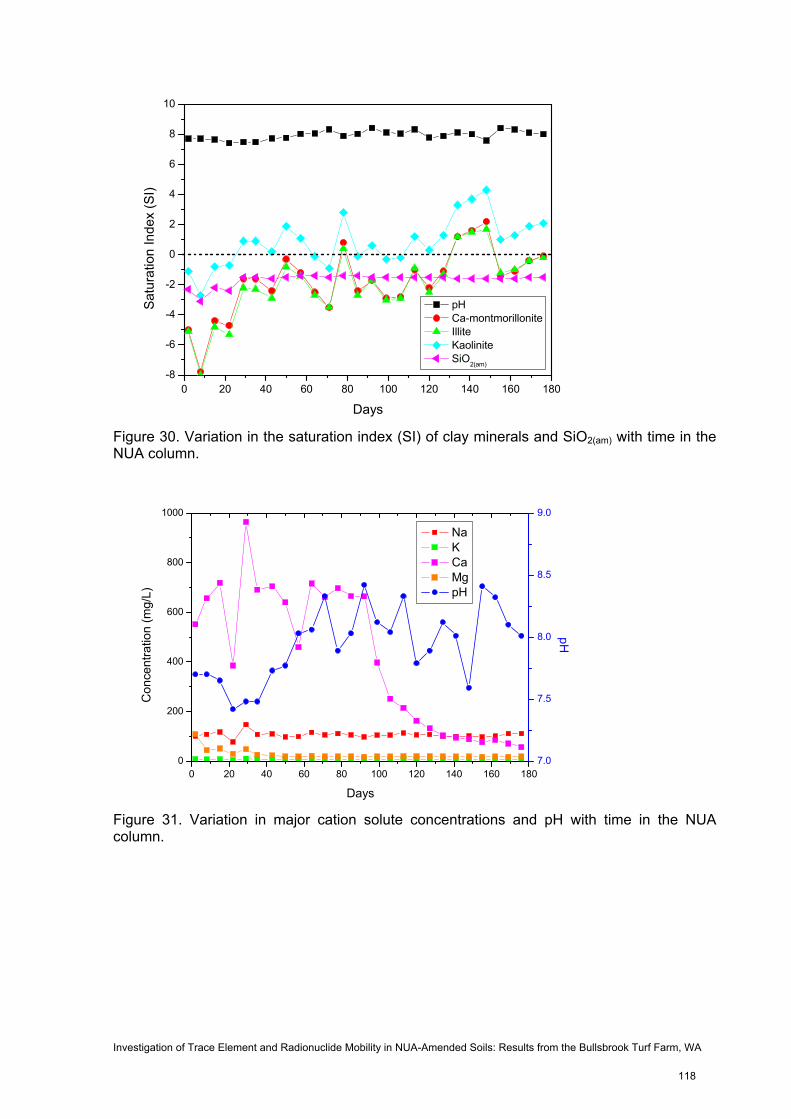
0 20 40 60 80 100 120 140 160 180-8
-6
-4
-2
0
2
4
6
8
10
Satu
ratio
n In
dex
(SI)
Days
pH Ca-montmorillonite Illite Kaolinite SiO2(am)
Figure 30. Variation in the saturation index (SI) of clay minerals and SiO2(am) with time in the NUA column.
0 20 40 60 80 100 120 140 160 1800
200
400
600
800
1000
Na K Ca Mg pH
Days
Con
cent
ratio
n (m
g/L)
7.0
7.5
8.0
8.5
9.0
pH
Figure 31. Variation in major cation solute concentrations and pH with time in the NUA column.
Investigation of Trace Element and Radionuclide Mobility in NUA-Amended Soils: Results from the Bullsbrook Turf Farm, WA
118
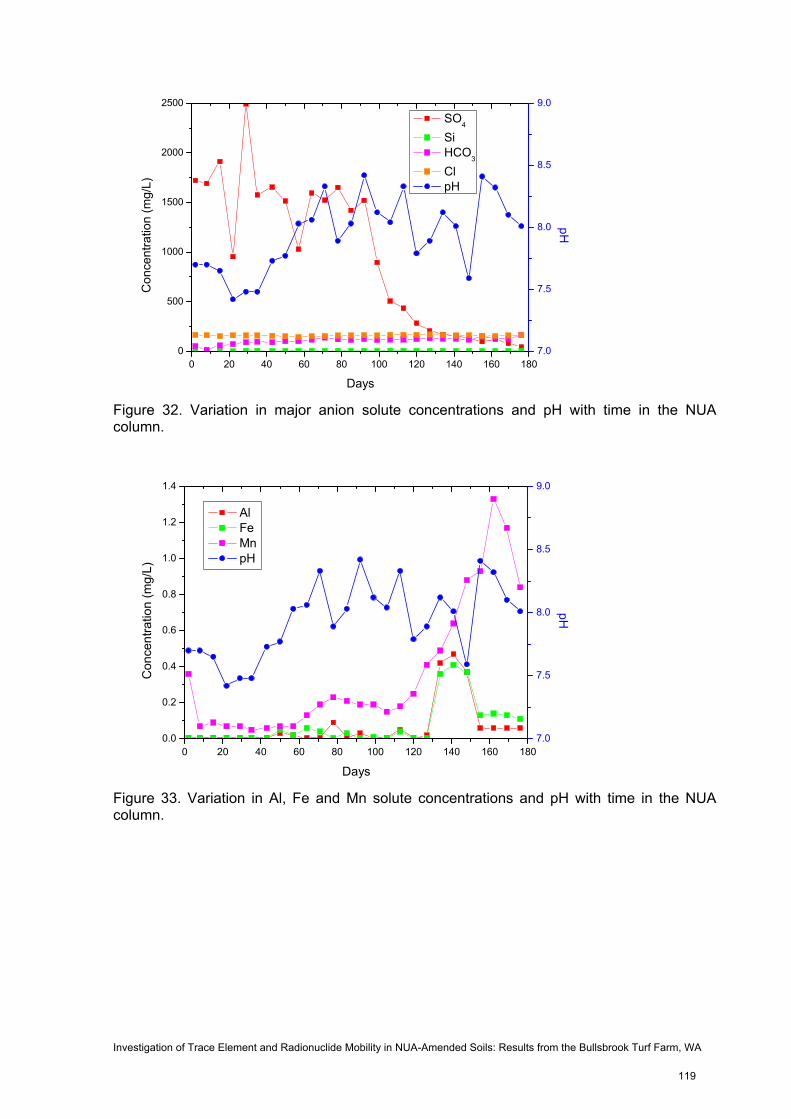
0 20 40 60 80 100 120 140 160 1800
500
1000
1500
2000
2500 SO4
Si HCO3
Cl pH
Days
Con
cent
ratio
n (m
g/L)
7.0
7.5
8.0
8.5
9.0
pH
Figure 32. Variation in major anion solute concentrations and pH with time in the NUA column.
0 20 40 60 80 100 120 140 160 1800.0
0.2
0.4
0.6
0.8
1.0
1.2
1.4
Al Fe Mn pH
Days
Con
cent
ratio
n (m
g/L)
7.0
7.5
8.0
8.5
9.0
pH
Figure 33. Variation in Al, Fe and Mn solute concentrations and pH with time in the NUA column.
Investigation of Trace Element and Radionuclide Mobility in NUA-Amended Soils: Results from the Bullsbrook Turf Farm, WA
119
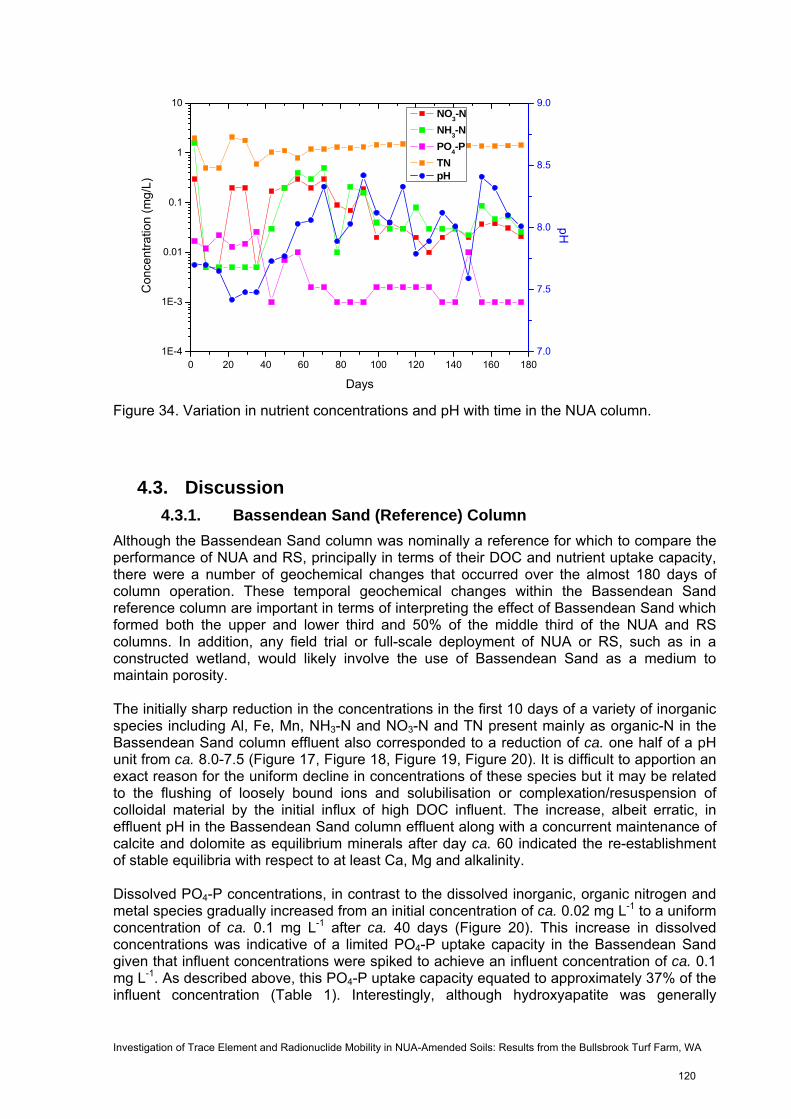
0 20 40 60 80 100 120 140 160 1801E-4
1E-3
0.01
0.1
1
10 NO3-N NH3-N PO4-P TN pH
Days
Con
cent
ratio
n (m
g/L)
7.0
7.5
8.0
8.5
9.0
pH
Figure 34. Variation in nutrient concentrations and pH with time in the NUA column.
4.3. Discussion 4.3.1. Bassendean Sand (Reference) Column
Although the Bassendean Sand column was nominally a reference for which to compare the performance of NUA and RS, principally in terms of their DOC and nutrient uptake capacity, there were a number of geochemical changes that occurred over the almost 180 days of column operation. These temporal geochemical changes within the Bassendean Sand reference column are important in terms of interpreting the effect of Bassendean Sand which formed both the upper and lower third and 50% of the middle third of the NUA and RS columns. In addition, any field trial or full-scale deployment of NUA or RS, such as in a constructed wetland, would likely involve the use of Bassendean Sand as a medium to maintain porosity. The initially sharp reduction in the concentrations in the first 10 days of a variety of inorganic species including Al, Fe, Mn, NH3-N and NO3-N and TN present mainly as organic-N in the Bassendean Sand column effluent also corresponded to a reduction of ca. one half of a pH unit from ca. 8.0-7.5 (Figure 17, Figure 18, Figure 19, Figure 20). It is difficult to apportion an exact reason for the uniform decline in concentrations of these species but it may be related to the flushing of loosely bound ions and solubilisation or complexation/resuspension of colloidal material by the initial influx of high DOC influent. The increase, albeit erratic, in effluent pH in the Bassendean Sand column effluent along with a concurrent maintenance of calcite and dolomite as equilibrium minerals after day ca. 60 indicated the re-establishment of stable equilibria with respect to at least Ca, Mg and alkalinity. Dissolved PO4-P concentrations, in contrast to the dissolved inorganic, organic nitrogen and metal species gradually increased from an initial concentration of ca. 0.02 mg L-1 to a uniform concentration of ca. 0.1 mg L-1 after ca. 40 days (Figure 20). This increase in dissolved concentrations was indicative of a limited PO4-P uptake capacity in the Bassendean Sand given that influent concentrations were spiked to achieve an influent concentration of ca. 0.1 mg L-1. As described above, this PO4-P uptake capacity equated to approximately 37% of the influent concentration (Table 1). Interestingly, although hydroxyapatite was generally
Investigation of Trace Element and Radionuclide Mobility in NUA-Amended Soils: Results from the Bullsbrook Turf Farm, WA
120

oversaturated by 2-3 orders of magnitude after day ca. 60 a stable effluent concentration of dissolved PO4-P persisted after this period (Figure 10, Figure 20). Within the Bassendean Sand (reference) column there were substantial declines in the concentrations of Mn, NO3-N and NH3-N after day ca. 70-80 (Figure 14, Figure 20). It is unlikely that the reductions, especially in the dissolved inorganic N species were related to algal growth as both the influent water (also chilled to 40C) during storage and column remained in darkness throughout. Another more likely possibility was the growth of endemic bacteria derived from the influent water and/or present within the Bassendean Sand column. Interestingly, organic nitrogen, which is known to comprise the majority of the nitrogen fraction in organic-rich waters such as those from Ellen Brook remained constant suggesting there was little apparent fractionation of nitrogen within the organic matter. The net loss of dissolved Mn after day ca. 70-80 may have indicated the establishment of bacterial biomass and anoxic conditions within the Bassendean Sand column. Hence, Mn present as coatings, perhaps on sand grains, was reduced and eluted from the column. This phase of Mn reduction may have occurred with or after Fe reduction, however, the erratic although increasing pattern of effluent Fe concentrations (Figure 13) makes this difficult to discern. The decline in dissolved Mn concentrations in the column effluent also corresponded to a change from over- to undersaturation in rhodochrosite during this period. Thus, the presence of both gypsum and calcite oversaturation after day ca. 60 (Figure 15) may have resulted in these minerals acting as a sink for reduced Mn species via co-precipitation. The Bassendean Sand demonstrated no sorption capacity for DOC; over the course of nearly 180 d analysis of effluents from Bassendean Sand-packed columns yielded more than a 5% increase in DOC as compared to influent water (Table 1). Likewise, no capacity for sorption of N species by Bassendean Sand was observed in column trials (Table 1). The small (ca. 7%) reduction in NOx-N observed in Bassendean Sand column effluent is unlikely to be an indication of NOx-N retention within the solid phase. Instead, the decrease in NOx-N concentration is likely due to the onset of reducing conditions within the Bassendean Sand column due to the upflow configuration and the exclusion of air, and resultant chemical reduction of the oxidised N species to the reduced N form, NH3-N. There are some potential explanations for the ca. 37% reduction in PO4-P and TP resulting from passage of water through the Bassendean Sand reference column (Table 1). Although P species are unlikely to be retained by SiO2, which comprises more than 98% of the Bassendean Sand solid phase, the small amounts of Al2O3 (0.11-0.17%), Fe2O3 (~0.4%) and other elements contained in Bassendean Sand may sorb trace quantities of P. Alternately, P may have been retained on <2 mm organic particulates in the Bassendean Sand, as the sand was oven-dried and sieved prior to use but organic materials were not removed. Over the long term or in the presence of substantial concentrations of P it is unlikely that Bassendean Sand will demonstrate any capacity for P sorption or retention.
4.3.2. NUA Column The effluent geochemistry of the NUA column was dominated by the near equilibrium saturation of the following minerals throughout the majority of the trial: Al(OH)3(am)/gibbsite, and kaolinite (Al) ferrihydrite (Fe), rhodochrosite (Mn) and gypsum-anhydrite/calcite-dolomite (Ca-Mg- HCO3) respectively (Figure 26, Figure 27, Figure 28, Figure 29, Figure 30). In addition, the effluent geochemistry of Ca and SO4 was strongly influenced by the presence of gypsum and anhydrite near equilibrium for the initial ca. 100 days and their subsequent increasing degree of undersaturation to over two orders of magnitude by the end of the trial near 180 d (Figure 29, Figure 31, Figure 32).
Investigation of Trace Element and Radionuclide Mobility in NUA-Amended Soils: Results from the Bullsbrook Turf Farm, WA
121

As in the case of the RS column, the effluent geochemistry was a direct legacy of the NUA mineralogy. The main ordered phase was bassanite (2CaSO4.H2O), a dehydrated gypsum which reverts on contact with water. In addition, substantial amorphous Fe-oxyhydroxide minerals and minor magnetite were also present (Douglas et al., 2006). In contrast to both the Bassendean Sand control column and the RS column there was, apart from Mn, NH3-N and NO3-N, less elution of nutrients and metals from the NUA column in the first 10 days (Figure 33, Figure 34). Furthermore, there were fluctuations in NH3-N, and of Mn concentrations in particular later in the column trial, while Fe and Al displayed transient increases in concentration (Figure 33, Figure 34). The behaviour of dissolved Mn in the NUA column was likely to have been a result of microbially-mediated reductive dissolution as anoxic conditions first established and then became increasingly prevalent within the NUA column. Although not directly associated, increasing NH3-N in the effluent also supports this hypothesis. In addition, the greatest increase in dissolved Mn occurred when there were temporally associated increases in Fe and Al, the latter element while not redox sensitive, may have been substituted within the dissolving Fe-oxyhydroxides. A smaller increase in dissolved Mn peaking at day ca. 80 was also associated with Fe release. Both this peak and the main peak of Mn release which had its zenith at day ca. 160 both subsequently declined in concentration. This transient behaviour suggests that increasingly large areas of the NUA column were subject to sustained anoxia, probably due to microbial processes. The decline in both peaks may have marked the exhaustion of reducible/labile Mn within these anoxic zones. It appears that rhodochrosite became saturated around the time of the first, albeit minor, Mn release and thus may have also been influential in regulating dissolved Mn concentrations in the NUA column. The sustained removal of PO4-P over ca. 180 days, often to below detection limits of 0.005 mg L-1 or >102 times less than the influent concentration clearly separated the performance of the NUA column relative to the Bassendean Sand and RS columns. These periods of concentrations below detectable limits generally corresponded to periods of undersaturation of hydroxyapatite of >103 as constituent concentration fell below the ion activity product. The predominance of both Ca and SO4 within the NUA column effluent attests to the importance of the dissolution of this mineral (gypsum) during the column trial. Until day ca. 90 both Ca and SO4 maintained effluent concentrations generally above 600 mg L-1 and 1500 mg L-1, respectively. This constituted a molar ratio of ca. 1:1 in accordance with bassanite stoichiometry. As the effluent concentrations of both Ca and SO4 waned, the effluent became increasingly undersaturated with respect to both gypsum and anhydrite signalling the exhaustion of this primary phase. Interestingly, at the point where Ca and SO4 concentrations began to decline the Ca:SO4 molar ratio began to progressively increase to a maximum of ca. 3 by the end of the column trial. In the absence of an increasing calcite or dolomite saturation (and no substantial change in Mg or HCO3 concentrations), the net deficit of SO4 relative to Ca may have been consumed via SO4-reduction. Another possibility, however, was the formation of schwertmannite which became increasingly oversaturated by as much as ca. 1020 times (Figure 27) and thus may have been a substantial reservoir for excess SO4. The NUA demonstrated substantial sorption capacity for DOC; over the course of nearly 180 d analysis of effluents from Bassendean Sand-packed columns yielded more than a 39% decrease in DOC as compared to the Bassendean Sand control column (Table 2). The NUA also demonstrated excellent capacity for sorption of N species in column trials (Figure 6, Table 2). The ca. 26% reduction in DON observed in NUA column effluent is likely primarily due to the retention of dissolved organic matter, and hence DON, within the solid matrix. The
Investigation of Trace Element and Radionuclide Mobility in NUA-Amended Soils: Results from the Bullsbrook Turf Farm, WA
122

NUA exhibited excellent removal of both NOx-N and NH3-N species from influent water as compared to the Bassendean Sand control column (Table 2). The NUA was particularly effective in the removal of PO4-P and TP from influent water, exhibiting more than 95% PO4-P and TP attenuation as compared to the Bassendean Sand control column (Table 2). These attenuation rates are equivalent to more than 97% removal of PO4-P and TP from influent water. The NUA did not reach capacity for PO4-P or TP during the course of the experiment and trends did not indicate that the NUA was approaching capacity. As such, NUA sorption capacity for PO4-P and TP were not determined in this study. In combination with results of turf farm field trials (Douglas et al., 2007), however, these results indicate that NUA exhibits an unusually high P retention capacity and as such it shows particular promise as an environmental amendment for the attenuation of soils and waters containing high concentrations of labile P and the resultant prevention or attenuation of eutrophication in freshwater systems.
5. CONCLUSIONS AND FUTURE WORK In terms of material performance assessment the use of the up-flow columns is a most useful empirical approach as it allows an extended assessment of the performance of NUA over time. In many ways the columns mimic the behaviour of a larger field trial far better than batch adsorption tests. While a column approach does not yield good equilibrium information such as pH and temperature dependence (which would be useful in adsorption isotherm determination), column studies give a very practical outcome at a far larger scale than batch tests and closer to that of a field trial. For effluent DOC and nutrient control, the NUA displays good broad range performance, in terms of PO4-P, and to a lesser extent NO3-N and NH3-N removal with removal of approximately 96%, 79% and 77%, respectively (Table 2). In addition, there was also substantial DOC adsorption and as a consequence TN removal which equated to approximate removal rates of 39% DOC and 45% TN (Table 2). Thus, the broad suite of nutrients and DOC, coupled with the environmentally acceptable pH of ca. 7.5-8.5 in the NUA column effluent indicate that NUA exhibits potential for the application to water treatment schemes. NUA performance in terms of P and DOC sorption, and trace element removal has also been replicated in turf field trials conducted over almost four years in Bullsbrook, north of Perth (Douglas et al., 2007). This is an excellent validation of the performance of the column at field scale, albeit with a local groundwater being used for irrigation which had substantially higher nutrient and lower DOC concentrations. A challenge now exists for the evaluation of NUA in pilot field trials with the view to full implementation of NUA as an adsorptive substrate in a constructed wetland. Results of this column study clearly indicate that NUA shows potential for nutrient and/or DOC attenuation in environmental applications. Both the characteristics of the influent water and the physical design of the treatment scheme are important considerations that will significantly influence the suitability of NUA to specific applications. An important consideration to note is that the NUA used in this study was ground to maximise the reactive surface area. Larger particle sizes if used in field applications may have a substantially compromised performance in terms of both uptake kinetics and uptake capacity. As the reactive surface area is reduced a concomitant decrease will be observed in the both the rate and extent of attenuation.
Investigation of Trace Element and Radionuclide Mobility in NUA-Amended Soils: Results from the Bullsbrook Turf Farm, WA
123

Investigation of Trace Element and Radionuclide Mobility in NUA-Amended Soils: Results from the Bullsbrook Turf Farm, WA
In the specific context of Ellen Brook or other DOC, DON and inorganic P-enriched waters on the Swan Coastal Plain, NUA could be used as a broad spectrum nutrient removal medium in applications such as drain liners or constructed wetlands, subject to optimisation of design parameters. Where acidity derived from anthropogenic or acid sulfate soils were also present other materials could also conceivably be incorporated to enhance the attenuation of acidity whilst maintaining nutrient and DOC uptake capacity. Column trials to evaluate mixtures of NUA and other by-products are necessary to validate performance prior to implementation of field trials with mixtures of by-products. Additional laboratory column trials to evaluate the behaviour of NUA under acidic conditions are currently underway.
6. REFERENCES
Clesceri, L.S., A.E. Greenberg, and A.D. Eaton, (eds.) 1998. Standard Methods for the Examination of Water and Wastewater. American Public Health Association, Washington, DC.
Douglas, G., J. Adeney, and K. Johnston. 2007. Investigation of Trace Element and Radionuclide Mobility in Amended Soils (Use of Neutralised Unused Acid in Turf Farm Applications). Results from the Bullsbrook Turf Farm, WA. Commercial-in-confidence report to Iluka Resources, Ltd. CSIRO, Perth, WA.
Douglas, G., J. Adeney, B. Patterson, M. Trefry, H. Aral, and C. Klauber. 2006. Comparison of Mining Waste By-Products in a Permeable Reactive Surface Barrier for the Retardation of Heavy Metals - Empirical Column and Geochemical Modelling. Progress Report No. 2. , pp. 44. Light Metals Flagship.
Gondar, D., S.A. Thacker, E. Tipping, and A. Baker. 2008. Functional variability of dissolved organic matter from the surface water of a productive lake. Water Res 42:81-90.
Parkhurst, D.L. 1995. Users guide to PHREEQC - A computer program for speciation, reaction-path, advective transport, and inverse geochemical calculations. USGS Water Research Investigation Report 95-4277.
Patton, C.J., and J.R. Kryskalla. 2003. Methods of Analysis by the U.S. Geological Survey National Water Quality Laboratory - Evaluation of Alkaline Persulfate Digestion as an Alternative to Kjeldahl Digestion for Determination of Total and Dissolved Nitrogen and Phosphorous in Water. U.S. geological Survey, Denver.
Playford, P.E., A.E. Cockbain, and G.H. Low. 1976. Geology of the Perth Basin Western Australia, pp. 311. Geological Survey of Western Australia, Perth.
124

Investigation of Mineral-Based By-Product Use as a Soil Amendment: Results from the Bullsbrook Turf Farm, WA Page 118
APPENDIX 4: Statement from the Radiological Council of WA with regard to NUA use as a soil amendment on turf farms

126

Investigation of Mineral-Based By-Product Use as a Soil Amendment: Results from the Bullsbrook Turf Farm, WA Page 120
APPENDIX 5: Independent radiological assessment of the application of NUA to soils


Investigation of Mineral-Based By-Product Use as a Soil Amendment: Results from the Bullsbrook Turf Farm, WA Page 131
6. REFERENCES American Public Health Association (APHA) (2005). Standard Methods for the Examination of
Water and Wastewater. 21st Edition
American Public Health Association (APHA) (1992). Standard Methods for the Examination of Water and Wastewater. 18th Edition
Beretka, J and Mathew, P.J. (1985). Natural radioactivity of Australian building materials, industrial wastes and by-products. Health Physics, 48, 87-95.
Crock, J.G., Lichte, F.E. and Wildeman, T.R. (1984) The group separation of the rare-earth elements and yttrium from geologic materials by cation-exchange chromatography. Chemical Geology, 45, 149-163.
Gilkes, R., Kanabo, I, Mosquero-Pardo, A, Newsome, D and Weatherly, D. (1994). Utilisation of Wastes from Synthetic Rutile Plants. MERIWA Projects M122 and M208. Minerals and Energy Research Institute of Western Australia.
Gommers, A., Thirty, Y., Vandenhove, H., Vandecasteele, C.M., Smolders, E. and Merckx, R. (2000). Radiocesium uptake by one-year-old willows planted as short rotation coppice. Journal of Environmental Quality, 29, 1384-90.
Hamon, R. and McLaughlin, M. (2002). Nutrient adsorption of neutralized acid effluent and blends. MERIWA Project No. 344. Environmental Projects Office, CSIRO. 42pp.
Khater, A.E.M. and Al-Sewaidan, H.A. (2008). Radiation exposure due to agricultural uses of phosphate fertilizers. Radiation Measurements, 43, 1402-1407.
Martin, P. and Hancock, G.J. (2004). Routine analysis of naturally occurring radionuclides in environmental samples by alpha-particle spectrometry. Supervising Scientist Report 180, Supervising Scientist, Darwin, N.T., Australia.
Mittlefehldt, D.W. and Wetherill, G.W. (1979) Rb-Sr studies of CI and CM chondrites. Geochimica et Cosmochimica Acta, 43, 201-206.
Murray A. S., Marten R., Johnston A., and Martin P. (1987) Analysis for naturally occurring radionuclides at environmental levels by gamma spectrometry. Journal of Radioactive and Nuclear Chemistry, 115, 263-288.
Norrish, K. and Chappell, B.W. (1977) X-ray fluorescence spectrometry. In, Physical Methods in Determinative Mineralogy, 2nd Edition. Zussman, J. (Ed.). Academic Press, London. Pp.201-272.
Papastefanou, C., Stoulos, S. and Maolopoulou, M. (2005). The radioactivity of building materials. Journal of Radioanalytical and Nuclear Chemistry, 226, 367-372.
Parkhurst, D.L. (1995) Users guide to PHREEQ-C – A computer program for speciation, reaction-path, advective transport, and inverse geochemical calculations. USGS Water Research Investigation Report 95-4277.
Rehkamper, M., Gartner, M., Galer, S.J.G., and Goldstein, S.L. (1996) Separation of Ce from other rare-earth elements with application to Sm-Nd and La-Ce chronometry. Chemical Geology, 129, 201-208.
Richard, P., Shimizu, N., and Allegre, C. (1976) 143Nd/146Nd natural tracer of geological phenomenon. EOS: Transactions of the American Geophysical Union, 57, 351-352.
Summers, K.J., O’Connor, B.H. and Fox, D.R. (1993). Radiological consequences of amending soils with bauxite residue/gypsum mixtures. Australian Journal of Soil Research, 31, 533-538.

Investigation of Mineral-Based By-Product Use as a Soil Amendment: Results from the Bullsbrook Turf Farm, WA 132
Summers, R.N., Bolland, M.D.A. and Clarke, M.F. (2001). Effect of application of bauxite residue (red mud) to very sandy soils on subterranean clover yield and P response. Australian Journal of Soil Research, 39, 979-990.
Summers, R.N., Clarke, M., McCafferty, P. and Pope, T. (2003). A slowly soluble, sulphur fertiliser from a by-product of mineral sands processing. Australian Journal of Soil Research, 41, 1213-1217.
Taylor, S.R., and McLennan, S.M. (1985). The Continental Crust: its Composition and Evolution. Blackwell, 312pp.
Toussaint, L.F. (2005). Measurements to determine the radiological impact of uranium and thorium in soils in the Darling Scarp. Intl. Congress Series, 1276, 93-96. www.ics-elsevier.com
UNSCEAR (1998). Sources, Effects and Risks of ionising Radiation. United Nations Scientific Committee on the Effects of Atomic Radiation (1983, 1993 and 1998). Report to the General Assembly, with annexes (New York, NY, United Nations).
USEPA (1992). Potential uses of phosphogypsum and associated risks: Background information document. EPA 402-R92_002. USEPA Washington, DC.
Waddell, B., Mann, S. and Allen, D. (2002). Improvement of soil quality by waste amendment. Waste and Recycle 2002 Conference
Wasserburg, G.J., Jacobsen, S.B., DePaolo, D.J., McCulloch, M.T., and Wen, T. (1981) Precise determination of Sm/Nd ratios, Sm and Nd isotopic abundances in standard solutions. Geochimica et Cosmochimica Acta, 45, 2311-2323.
White, P.J. and Broadley, M.R. (2000). Tansley Review No. 113: Mechanisms of caesium uptake by plants. New Phytologist, 147, 241-256.
