investigation of human-structure interaction through
TRANSCRIPT

Bucknell UniversityBucknell Digital Commons
Master’s Theses Student Theses
Spring 2012
Investigation of Human-Structure InteractionThrough Experimental and Analytical StudiesNicholas [email protected]
Follow this and additional works at: https://digitalcommons.bucknell.edu/masters_theses
Part of the Civil Engineering Commons
This Masters Thesis is brought to you for free and open access by the Student Theses at Bucknell Digital Commons. It has been accepted for inclusion inMaster’s Theses by an authorized administrator of Bucknell Digital Commons. For more information, please contact [email protected].
Recommended CitationNoss, Nicholas, "Investigation of Human-Structure Interaction Through Experimental and Analytical Studies" (2012). Master’s Theses.82.https://digitalcommons.bucknell.edu/masters_theses/82

I, Nicholas Noss do grant permission for my thesis to be copied.


iv
ACKNOWLEDGEMENTS
I am very grateful for having the opportunity to attend Bucknell University to earn a
Master of Science in Civil Engineering. Many wonderful people had a hand in my
success.
I would first like to thank my adviser Dr. Kelly Salyards for her assistance throughout
this journey. Dr. Salyards encouraged me to set the bar high and because of that we
accomplished a tremendous amount. I am thankful to have had the opportunity to work
with her in the fascinating world of human-structure interaction.
I would also like to thank the members of my thesis committee Dr. Christine Buffinton
and Dr. Ronald Ziemian for their advice and recommendations throughout the research
process.
Thank you to all of the individuals who participated in this research project. Without you
none of this would be possible!
Thank you Jim Gutelius for helping me build the test structure. Also I would like to thank
Larry Noss Welding for the use of their fabrication facility and Central Builders Supply
Company for their donation of concrete.
I would also like to thank my family and friends for your support over the past two years.
Thanks for helping me through this and understanding that in the world of research “free
time” does not exist.
Finally I would like to thank Dr. Brian Swartz for encouraging me to apply to Bucknell
University.

v
TABLE OF CONTENTS
LIST OF TABLES ........................................................................................................... viii
LIST OF FIGURES ........................................................................................................... ix
ABSTRACT ...................................................................................................................... xii
CHAPTER 1: INTRODUCTION AND LITERATURE REVIEW .................................. 1
1.1 Introduction ............................................................................................................... 1
1.2 Purpose of research ................................................................................................... 2
1.3 Overview of research ................................................................................................ 3
1.4 Literature review ....................................................................................................... 4
1.4.1 Vibration serviceability ...................................................................................... 4
1.4.2 Serviceability guidance ....................................................................................... 4
1.4.3 Dynamic studies ................................................................................................. 6
1.4.4 Dynamic models of the human body ................................................................ 10
1.4.5 Recent guidance ................................................................................................ 11
1.5 Thesis Overview ...................................................................................................... 12
CHAPTER 2: DESIGN AND VALIDATION OF AN EXPERIMENTAL TEST
STRUCTURE ................................................................................................................... 13
2.1 Introduction ............................................................................................................. 13

vi
2.2 Design and construction of the experimental test structure .................................... 13
....................................................................................................................................... 20
2.3 Validation of the experimental test structure .......................................................... 20
2.3.1 Experimental modal analysis ............................................................................ 20
2.3.2 Overview of experimental equipment and software ......................................... 21
2.3.3 Location and description of excitation ............................................................. 22
2.3.4 Location and description of response measurements ....................................... 24
2.4 Estimation of dynamic properties ........................................................................... 25
....................................................................................................................................... 29
2.5 Validating the finite element model ........................................................................ 31
CHAPTER 3: EXPERIMENTAL TESTING PROCEDURE ......................................... 34
3.1 Overview of testing methodology ........................................................................... 34
3.2 Participant information ............................................................................................ 34
3.3 Occupant characteristics .......................................................................................... 35
3.3.1 Posture .............................................................................................................. 35
3.3.2 Frequency and mass ratio ................................................................................. 37
3.4 Experimental testing procedure ............................................................................... 39
CHAPTER 4: EXPERIMENTAL RESULTS ................................................................. 41
4.1 Dynamic behavior of the structure and general data trends .................................... 41

vii
4.2 Analytical results from the finite element model .................................................... 45
4.3 Experimental results for natural frequency ............................................................. 46
4.3.1 Results for 4.21 Hz structural configuration .................................................... 46
4.3.2 Results for 5.41 Hz structural configuration .................................................... 48
4.3.3 Results for 6.27 Hz structural configuration .................................................... 49
4.3.4 Results for 7.30 Hz and 8.05 Hz structural configurations .............................. 51
CHAPTER 5: DISCUSSION AND CONCLUSIONS ..................................................... 55
5.1 Discussion of results................................................................................................ 55
5.1.1 Damping of the occupied structure ................................................................... 56
5.1.2 Frequency ......................................................................................................... 57
5.2 Proposed model ....................................................................................................... 58
5.3 Conclusions ............................................................................................................. 64
5.4 Future work ............................................................................................................. 66
APPENDICES .................................................................................................................. 68
Appendix A: Participant informed consent form ......................................................... 68
Appendix B: Experimental frequency and damping values of the occupied test structure
obtained from curve-fitting ........................................................................................... 70
REFERENCES ................................................................................................................. 80

viii
LIST OF TABLES
Table 1: Experimental Frequency and damping values for the first mode of vibration. .. 29
Table 2: Natural frequency data from experimental testing and the FE model. .............. 32
Table 3: Occupant weight data ......................................................................................... 34
Table 4: Experimental frequency and damping values for the first mode of vibration ... 37
Table 5: Mass ratio and natural frequency combinations tested. ..................................... 38
Table 6: 4.21 Hz structural configuration damping values. ............................................. 47
Table 7: 5.41 Hz structural configuration damping values. ............................................. 49
Table 8: 6.27 Hz structural configuration damping values. ............................................. 51
Table 9: 7.30 Hz structural configuration damping values. ............................................. 53
Table 10: 8.05 Hz structural configuration damping values. ........................................... 54

ix
LIST OF FIGURES
Figure 1: Recommended peak acceleration for human comfort for vibrations due to
human activities (Allen and Murray 1993). ........................................................................ 6
Figure 2: Occupant standing on the beam-type test structure (Ellis and Ji 1994). ............ 7
Figure 3: Occupant standing on a precast concrete plank (Brownjohn 1999). .................. 8
Figure 4: Human body model, single degree-of-freedom system (Sachse et al. 2003). .. 10
Figure 5: Rendering of test structure. .............................................................................. 14
Figure 6: FE model of test structure. ............................................................................... 14
Figure 7: Elevation view of test structure. ....................................................................... 15
Figure 8: Plan view of test structure. ............................................................................... 15
Figure 9: a) Pin connection at back span of structure. b) Knife edge support at transition
of back span and cantilever. c) Moveable support located along the back span. ............ 17
Figure 10: As-built test structure. ..................................................................................... 20
Figure 11: Electrodynamic shaker. .................................................................................. 23
Figure 12: Typical excitation force generated by the electrodynamic shaker. ................ 24
Figure 13: a) Location of accelerometers along HSS beams. b) Connection of
accelerometer to HSS beam. ............................................................................................. 25
Figure 14: Example curve-fitting in ME'scope. ................................................................ 26
Figure 15: Mode 1 of the test structure. ............................................................................ 27
Figure 16: Mode 2 of the test structure. ............................................................................ 27
Figure 17: Mode 3 of the test structure. ............................................................................ 28
Figure 18: 4.21 Hz structural configuration. ..................................................................... 29

x
Figure 19: 4.80 Hz structural configuration. .................................................................... 29
Figure 20: 5.41 Hz structural configuration. ..................................................................... 30
Figure 21: 6.27 Hz structural configuration. .................................................................... 30
Figure 23: 8.05Hz structural configuration ...................................................................... 30
Figure 22: 7.30 Hz structural configuration ..................................................................... 30
Figure 24: MAC for between FE model and experimental mode shapes for 4.21 Hz
structural configuration. .................................................................................................... 32
Figure 25: FRF generation from FE model compared to experimental FRF for 4.21 Hz
structural configuration. .................................................................................................... 33
Figure 26: Occupants standing with straight knees ......................................................... 36
Figure 27: Occupants standing with bent knees. ............................................................. 36
Figure 28: 4.21 Hz structural configuration showing the additional mode of vibration
when occupants stand with knees bent. ............................................................................ 43
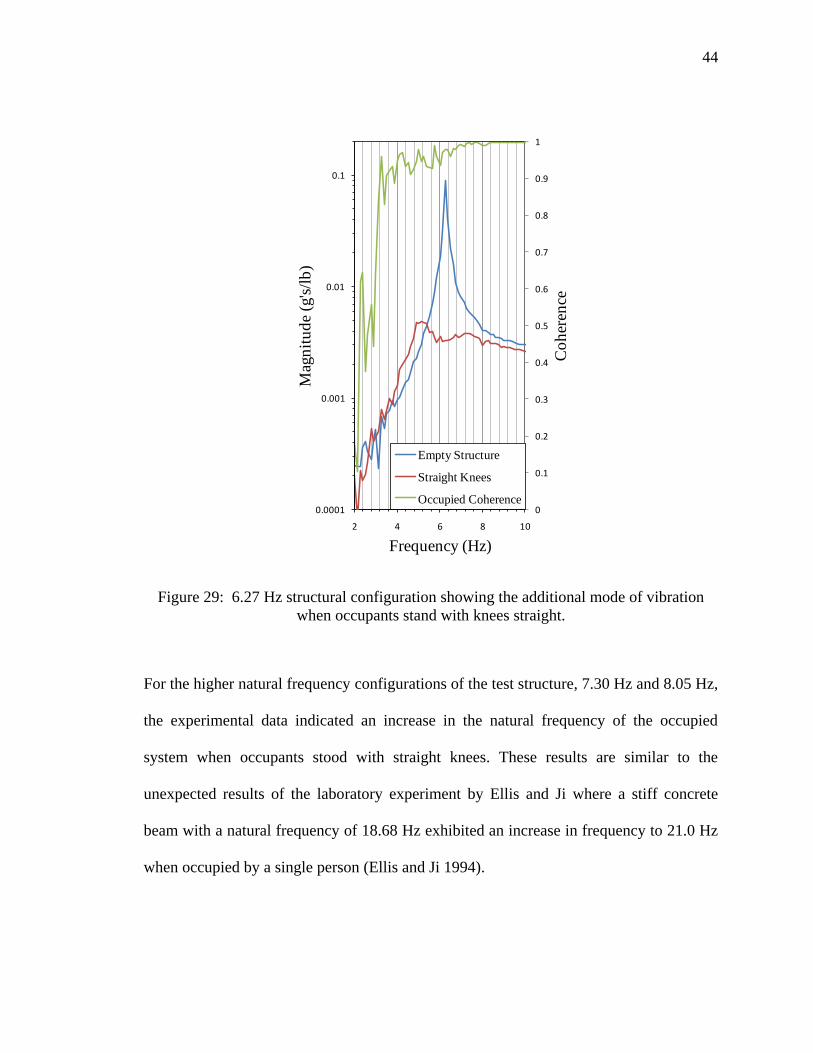
Figure 29: 6.27 Hz structural configuration showing the additional mode of vibration
when occupants stand with knees straight. ....................................................................... 44
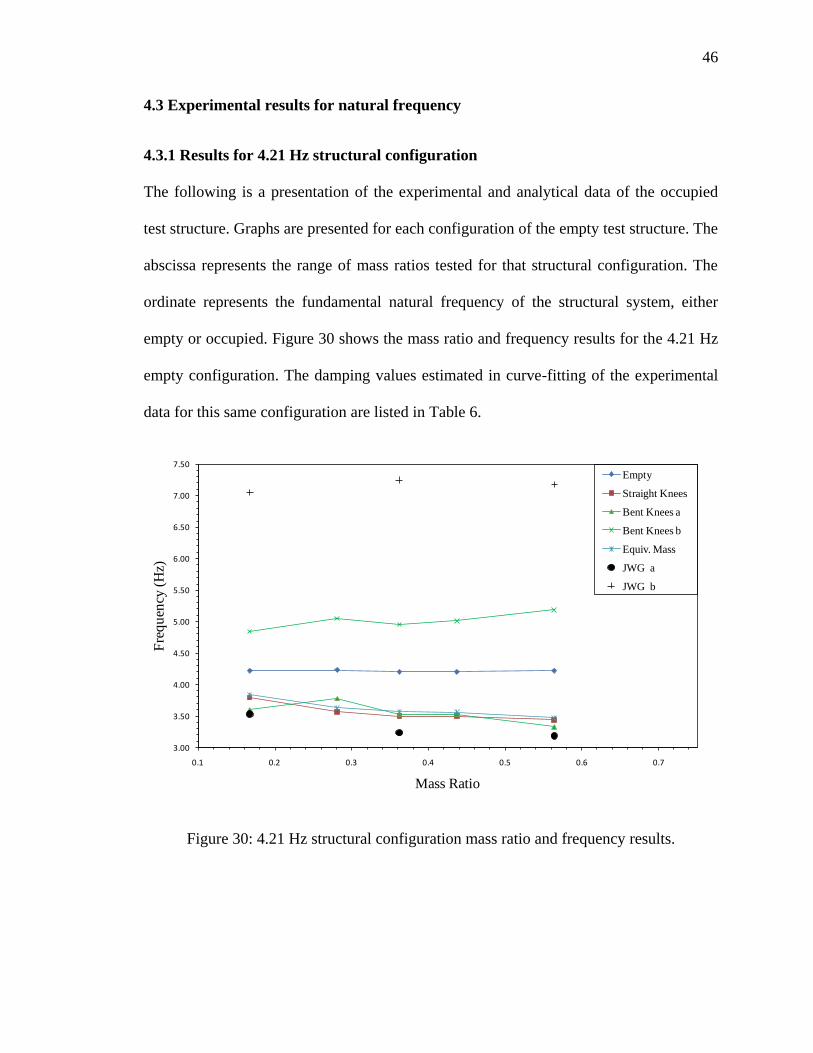
Figure 30: 4.21 Hz structural configuration mass ratio and frequency results. ................ 46
Figure 31: 5.41 Hz structural configuration mass ratio and frequency results. ............... 48
Figure 32: 6.27 Hz structural configuration mass ratio and frequency results. ............... 50
Figure 33: 7.30 Hz structural configuration mass ratio and frequency results. ............... 52
Figure 34: 8.05 Hz structural configuration mass ratio and frequency results. ............... 53
Figure 35: 4.21 Hz structural configuration experimental and modeling frequency
results. ............................................................................................................................... 60

xi
Figure 36: 4.21 Hz structural configuration experimental and modeling damping results.
........................................................................................................................................... 61
Figure 37: 5.41 Hz structural configuration experimental and modeling frequency results.
........................................................................................................................................... 62
Figure 38: 6.27 Hz structural configuration experimental and modeling frequency
results. ............................................................................................................................... 62
Figure 39: 5.41 Hz structural configuration experimental and modeling damping results.
........................................................................................................................................... 63
Figure 40: 6.27 Hz structural configuration experimental and modeling damping results.
........................................................................................................................................... 64

xii
ABSTRACT
Vibration serviceability is a widely recognized design criterion for assembly-type
structures, such as stadiums, that are likely subjected to rhythmic human-induced
excitation. Human-induced excitation of a structure occurs from the movement of the
occupants such as walking, running, jumping, or dancing. Vibration serviceability is
based on the level of comfort that people have with the vibrations of a structure. Current
design guidance uses the natural frequency of the structure to assess vibration
serviceability. However, a phenomenon known as human-structure interaction suggests
that there is a dynamic interaction between the structure and passive occupants, altering
the natural frequency of the system. Human-structure interaction is dependent on many
factors, including the dynamic properties of the structure, posture of the occupants, and
relative size of the crowd. It is unknown if the shift in natural frequency due to human-
structure interaction is significant enough to warrant consideration in the design process.
This study explores the interface of both structural and crowd characteristics through
experimental testing to determine if human-structure interaction should be considered
because of its potential impact on serviceability assessment. An experimental test
structure that represents the dynamic properties of a cantilevered stadium structure was
designed and constructed. Experimental modal analysis was implemented to determine
the dynamic properties of the empty test structure and when occupied with up to seven
people arranged in different locations and postures. Comparisons of the dynamic
properties were made between the empty and occupied testing configurations and
analytical results from the use of a dynamic crowd model recommended from the Joint
xiii
Working Group of Europe. Data trends lead to the development of a refined dynamic
crowd model. This dynamic model can be used in conjunction with a finite element
model of the test structure to estimate the dynamic influence due to human-structure
interaction due to occupants standing with straight knees. In the future, the crowd model
will be refined and can aid in assessing the dynamic properties of in-service stadium
structures.

1
CHAPTER 1: INTRODUCTION AND LITERATURE REVIEW
1.1 Introduction
As the structural engineering industry advances with more accurate design methods and
higher-strength materials, more efficient structures are being designed and constructed.
Structures such as office buildings often have open floor plans that provide people with
more options on how to occupy the space. As a result, the floor systems are constructed
with lighter and longer spans. Although these systems are meeting strength requirements,
they are often susceptible to vibration issues that can be caused by movement of the
people occupying them.
The same is true for modern-day assembly-type structures such as stadiums. Stadiums are
often constructed with long spans, utilizing cantilevered systems to achieve improved
sightlines. When compared to office buildings, however, stadiums tend to have lower
fundamental natural frequencies with a higher occupant density. Movement by stadium
crowds can be synchronized, producing substantial rhythmic loading. This crowd-
induced loading has the potential to produce vibrations in the structure that may be
perceived as annoying or uncomfortable to the occupants. If the level of vibration is
especially significant, the crowd may panic, fearing that the structure is unstable or
unsafe. Although the potential for a safety issue exists if the crowd rapidly exits the
structure, the vibration can also jeopardize the reputation of the facility and cause an
economic impact.

2
Structural engineers are faced with the task of ensuring that vibration issues described
above do not occur. In the case of stadium structures, this is of particular importance
because cantilevered grandstands have a fundamental natural frequency typically in the
range of 4 to 8 Hz, (Comer et al. 2010), which is within the frequency range that people
are most sensitive to vibrations. Designing for vibration serviceability is a difficult task
because there is a lack of understanding of how a structure will respond to crowd-induced
loading. One factor affecting this uncertainty in the dynamic response of the structure is
due to the occupants that are in contact with the structure influencing the dynamic
properties of the system. These dynamic properties include the natural frequency and
damping ratios that influence the transient response of the structure. This phenomenon of
occupants influencing the dynamic properties of the system is known as human-structure
interaction and is the primary focus of this research.
1.2 Purpose of research
The purpose of this research is to gain an understanding of the factors that influence
human-structure interaction through experimental testing and to evaluate current
parameters proposed for a dynamic crowd model. Research on the dynamic behavior of
occupied structures, dating as far back as 1966, has indicated that occupants do more than
just add mass to the structure; in fact, occupants act more like a spring-mass-damper
system on a structure. However, each individual occupant has different mass, stiffness,
and damping properties, making it a challenge to represent many occupants with a
representative and accurate dynamic model. Furthermore, previous research suggests that
the level of human-structure interaction is influenced by several factors, such as posture

3
of the occupants, level of rhythmic activity, relative mass of the crowd to the mass of the
structure, and the stiffness or natural frequency of the structure itself. The results from
previous research are noteworthy, but are limited in their application because the data is
sparse, disjointed, and lack continuity.
1.3 Overview of research
This research implements experimental testing to explore the dynamic properties of a
structure when occupied by small groups of people. For the experimental portion of this
research, a laboratory test structure was designed and constructed with variable structural
stiffness, allowing the natural frequency of the structure to be altered to allow
investigation of the phenomenon over a range of natural frequencies from 4 to 8 Hz.
Various groupings of people were studied thereby allowing for a wide range of
characteristics including variable mass, posture type, and number of the occupants on the
structure. Experimental modal analysis was implemented to estimate dynamic properties
such as natural frequency, damping, and mode shapes of the empty and occupied test
structure. With this wide range of testing capability, it was possible to investigate the
level of human-structure interaction over a range of structural frequencies with crowds of
different size and posture type based on the analysis of the change in dynamic properties
between the empty and occupied test structure. Typical trends were noted, which aided in
the recommendations for the parameters for a single-degree of freedom (SDOF) crowd
model. This crowd model is included in a finite element model of the test structure, and
the analysis simulates the dynamic properties of the system and the changes due to

4
human-structure interaction observed through the experimental component of this
research.
1.4 Literature review
1.4.1 Vibration serviceability
Determining how to better assess the vibration serviceability of structures serves as the
motivation for this study. For civil engineering structures, vibration serviceability is
based on the occupant‟s level of comfort with the motion or response of the structure.
Perception levels are dependent on the type of loading, the type of activity that the
occupant is involved in, and even the individual occupant. If occupants are at rest, such as
in an office building, peak vibration levels of 0.5 percent of the acceleration of gravity
become distinctly perceptible and annoying to most individuals. However, when an
individual is taking part in the activity causing the vibration such as dancing, jumping, or
aerobics, the threshold of perception is higher and an individual can typically tolerate
more (Murray et al. 1997). It is necessary to estimate the acceleration response during the
design of the structure to assess the whether or not the level of vibration will be
acceptable for the occupants.
1.4.2 Serviceability guidance
Current design standards in the United States used for assessing vibration serviceability
have not taken into account the effects of human-structure interaction because little is
known about its impacts. The most relevant design guidance for vibration serviceability
in the U.S. is the American Institute of Steel Construction‟s (AISC) Steel Design Guide

5
Series 11: Floor Vibrations Due to Human Activity (Murray et al. 1997). This
publication provides engineers with the basic principles and analytical tools to evaluate
steel-framed floor systems and footbridges for vibration serviceability. Design Guide 11
is not intended for the evaluation of large structures that are heavily occupied such as
sports stadiums, but it offers insight into acceptance criteria for human comfort and
design for rhythmic excitation. It recognizes that human response to motion is dependent
on the magnitude and duration of the motion and the activity that the occupants are
involved in. Figure 1 shows the recommended peak acceleration for human comfort to
vibrations due to human activities. It indicates that people are most susceptible to
vibrations in the 4 Hz to 8 Hz frequency range. Design Guide 11 recommends designing
floor structures to meet a minimum natural frequency to prevent unacceptable vibrations
based on peak acceleration response of the structure. This design method may be
acceptable for floor structures, but the assumptions made are not necessarily applicable to
stadium structures.

6
1.4.3 Dynamic studies
Human-structure interaction is an important aspect of crowd-induced vibrations;
however, its effects are not fully understood. The phenomenon of human-structure
interaction was first acknowledged in 1966 in a study by Lenzen at the University of
Kansas. The study involved a group of people occupying a steel-joist-supported floor and
it was observed that there was a decrease in natural frequency and an increase in damping
of the occupied structure. This phenomenon could not be explained by treating the
occupants as additional mass added to the structural system and was termed human-
structure interaction (Lenzen 1966). It was not further examined until 1991, when
researchers Ellis and Ji conducted in-situ monitoring of Twickenham stadium in the
Figure 1: Recommended peak acceleration for human comfort for vibrations
due to human activities (Allen and Murray 1993).

7
United Kingdom. It was observed that the occupants of a cantilevered section of the
stadium lowered the natural frequency and produced an additional mode of vibration. It
was also concluded that occupants were acting as a spring-mass-damper system rather
than just additional mass (Ellis and Ji 1991).
With the results from Twickenham, Ellis and Ji then performed a laboratory test to
determine how human-structure interaction can change the dynamic properties of a
structure. The test structure, as shown in Figure 2, was a concrete beam with a natural
frequency of 18.68 Hz. Tests were conducted using one occupant in both standing and
seated positions on the beam.
Figure 2: Occupant standing on the beam-type test structure (Ellis and Ji 1994).
With the occupant changing from standing to a seated position, the natural frequency of
the occupied structure increased from 18.68 Hz to a maximum of 21.0 Hz. An equivalent
mass test, where the occupant is replaced with a mass equal to that of the occupant,
resulted in a lower natural frequency than the empty structure as predicted by the
theoretical response of a dynamic system. This decrease in natural frequency due to

8
equivalent mass is expected; however, the increase in frequency of the occupied structure
is unlike results previously observed.
Another laboratory test was completed by Brownjohn in 1999. He performed tests using a
precast concrete plank structure (1,200 kg) with an empty natural frequency of 3.16 Hz
and one occupant (80 kg) as shown in Figure 3 (Brownjohn 1999).
Figure 3: Occupant standing on a precast concrete plank (Brownjohn 1999).
Brownjohn‟s research further investigated the influence of posture on the dynamic
properties of the occupied structure. Experimental tests were completed with an occupant
standing with straight knees, bent knees, very bent knees, and sitting on the structure.
Each posture scenario had a different effect on the natural frequency of the structure, but
in all cases, the occupants produced a lower natural frequency when compared to

9
equivalent mass tests that were performed (Brownjohn 1999). The experimental data
collected by Brownjohn confirms that the posture of an occupant influences the response
of the occupied structure.
Using a test structure with a slightly higher natural frequency, Falati performed similar
investigations using a concrete structure having a mass of 16,000 kg with both one and
two occupants. This structure had two different configurations enabling its empty natural
frequency to be 8.02 Hz or 10.15 Hz. A decrease in natural frequency and an increase in
damping were observed for both configurations and for one or two occupants. In this
testing scenario, the magnitude of the decrease in natural frequency due to occupants was
not as great when compared to previous studies (Falati 1999). This discrepancy might be
explained by the smaller mass ratio, which is defined as the mass of the occupants
divided by the mass of the empty structure. The results from both Falati‟s and
Brownjohn‟s studies suggest that the ratio of the mass of the crowd to mass of the empty
structure need to be considered in the study of human-structure interaction.
Previous research into human-structure interaction has shown varying results and that the
dynamic response of occupied structures depends on many factors including the natural
frequency of the empty structure, the posture and type of occupant activity, and the
relative size of the crowd compared with the size of the structure (Sachse et al. 2003).
The intent of the research presented in this thesis is to provide an investigation of the
effects of human-structure interaction over a range of these structural features instead of
isolated data points as previous studies have provided is needed. Previous laboratory test

10
data focused on the dynamic response of a structure occupied by only one or two
individuals, but in order to better understand human-structure interaction there is a need
for results that are more representative of the characteristics of a crowd, which includes
varying both the number of occupants and their posture.
1.4.4 Dynamic models of the human body
A number of biomechanical models of the human body have been developed for the
primary purpose of design in mechanical and aerospace engineering applications such as
vehicle seats (Griffin 1990). These models are characterized by mass, stiffness, and
viscous damping properties and can be constructed as single degree of freedom (SDOF)
system as depicted in Figure 4.
Figure 4: Human body model, single degree-of-freedom system (Sachse et al. 2003).
Unfortunately, dynamic models developed for the biomechanical industry are not directly
applicable in the study of human-structure interaction because they represent individuals,
not crowds. Dynamic properties of the body are also strongly dependent on the
magnitude of vibrations that it is exposed to, making the biomechanics models not
applicable since vibration levels in civil engineering are generally lower (Griffin 1990).
There is a need to develop a dynamic model that considers groups or crowds of people,

11
not individuals, that is relevant for the vibration levels that are common in civil
engineering applications; which is another impetus for the research presented in this
thesis.
1.4.5 Recent guidance
In 2000, a Joint Working Group was formed with members from the Institution of
Structural Engineers (IStructE), the Department for Transport, Local Government
(DTLG), and the Regions and Department for Culture, Media and Sport (DCMS) in the
United Kingdom to make recommendations in relation to the dynamic performance on
the design and appraisal of new and existing stadia. This was prompted by a noteworthy
increase in dynamic loading associated with crowd movement on assembly-type
structures (IStructE 2001). In 2008, this Joint Working Group published comprehensive
design guidance aimed specifically toward grandstands entitled “Dynamic Performance
Requirements for Permanent Grandstands Subject to Crowd Action”. Currently, this
publication is the only one to address the human-structure interaction phenomenon,
recognizing that previous recommendations for grandstands with dense crowd loading
and natural frequencies below 7 Hz gave “insufficient consideration to the nature of the
loading or to the effects of the mechanical interaction between individuals and the
structure”(IStructE 2008). The recommendations for modeling of a crowd are based on
the analytical results of a study by Dougill (2006), which have been corroborated with
experimental measurements from bobbing on a flexible test rig structure at the University
of Manchester (Dougill 2006). The guidance proposes a single degree-of-freedom
dynamic system, representing passive and active occupants, that is attached to a finite

12
element model of a stadium structure to more accurately predict the dynamic properties
of the human-structure system. The proposed SDOF systems or “body units” have
dynamic properties that are a function of the size and level of activity of the crowd. This
guidance was developed referencing only three laboratory tests, one analytical model,
and one in-service monitoring test. It is anticipated that the additional data provided in
this thesis will provide evidence of human-structure interaction that may further validate
these modeling recommendations.
1.5 Thesis Overview
Chapter 2 describes the design and construction of the test structure and the experimental
techniques used to validate a finite element model. Chapter 3 explains the experimental
testing methodology implemented in the collection of data with occupants on the test
structure. Statistics regarding the occupant characteristics of posture, location on the
structure, and mass ratio of the occupants to the empty structure are described. Results
from this study are presented in Chapter 4. This includes both experimental results from
the empty and occupied test structure and analytical results utilizing the finite element
model of the test structure and crowd models derived from the 2008 guidance by the Joint
Working Group. Typical trends are outlined and qualitatively and quantitatively
compared. Chapter 5 is a discussion of the results. Conclusions drawn from the
experimental and analytical data are presented and recommendations for a more
appropriate crowd model developed from the results of this study are offered.

13
CHAPTER 2: DESIGN AND VALIDATION OF AN EXPERIMENTAL TEST
STRUCTURE
2.1 Introduction
This chapter briefly describes the development and construction of an experimental test
structure to meet specific design criteria essential to the investigation of human-structure
interaction. Experimental techniques and methods used to confirm that the behavior of
the constructed structure is accurately represented by the finite element model are also
described.
2.2 Design and construction of the experimental test structure
To explore the phenomenon of human-structure interaction experimentally, a test
structure representing a cantilevered grandstand was developed. The test structure was
designed to offer:
An adjustable stiffness (i.e., variable natural frequencies) capable of achieving
natural frequencies in the 4 – 8 Hz range typical of cantilevered grandstands;
A decking surface large enough to accommodate small groups of occupants;
A structural mass such that the ratio of occupant mass to structural mass is within
a range representative of cantilevered grandstands.
To achieve these design criteria, the preliminary design of a cantilevered steel test
structure was developed using a finite element (FE) model created in SAP2000
(Computers and Structures 2005). A graphical rendering of the test structure and FE

14
model are shown in Figure 5 and Figure 6. A structural drawing of the elevation of the
test structure is depicted in Figure 7 and a plan view of the superstructure is shown in
Figure 8.
Figure 5: Rendering of test structure.
Figure 6: FE model of test structure.

15
Figure 7: Elevation view of test structure.
Figure 8: Plan view of test structure.
A cantilevered configuration was selected for the test structure because it is the most
practical and consistent configuration to achieve the adjustable fundamental frequency
range of 4 to 8 Hz. The range of natural frequencies is achieved through the relocation
and/or addition of the supports for the cantilevered steel superstructure. The moveable
supports are bolted to wide-flange W8x48 support beams anchored to a slab-on-grade.
The top flange of the support beams have holes drilled every 4” to provide mounting

16
locations for the moveable supports, providing a simple solution to alter the natural
frequency of the structure.
To achieve the desired natural frequency range and behavior of the structure,
“frictionless” pin connections were desired. Resistance to rotation causes an increase in
stiffness of the structure. Machined pin and bushing connections were located at the back
span of the structure and were used to limit friction and resistance to rotation. These
supports remained fixed in location and were welded directly to the wide flange support
beams as depicted in Figure 9a. The movable supports were designed as knife edge
supports that restrain movement in the vertical direction but allow rotation. The moveable
support at the transition of the back span and cantilever is shown in Figure 9b. Movement
of this pair of supports varies the natural frequency of the test structure between 4.21 Hz
and 6.27 Hz. Because lateral motion of the structure is not of interest in this study, steel
plates are attached to the knife edge supports as shown in Figure 9b to increase the
natural frequency of the lateral modes of vibration. To achieve frequencies higher than
6.27 Hz, an additional pair of supports is available for the back span. The connection in
Figure 9c was designed to restrain vertical movement and the steel plates provide
additional lateral stiffness along the back span of the test structure. With the addition of
these knife edge supports, the natural frequency of the test structure can be increased up
to 8.05 Hz.

17
a) b) c)
The steel superstructure and concrete decking surface were designed to achieve the
following criteria:
Strength requirements stipulated by standard design codes
Targets for the natural frequency range
The test structure was designed using the AISC Load and Resistance Factor Design
(LRFD, 2007) for static loading with a dynamic amplification factor of 2. ASCE 7-10:
Minimum Design Loads for Buildings and Other Structures (2010) recommends 100 psf
live loading for stadium seating. Adequate area was needed to allow for a small group of
people (1 to 9) to comfortably occupy the structure in either a seated or standing
condition. The structure was originally designed with a platform area of 36 ft2, however
Figure 9: a) Pin connection at back span of structure. b) Knife edge support at
transition of back span and cantilever. c) Moveable support located along the
back span.

18
during testing the decking surface was reduced to 24 ft2 to accommodate nine standing
occupants and allow for a wider range support conditions of the test structure.
The uniform loading of 100 psf on the decking surface was compared in the FE model to
situations where nine individuals at 95th
percentile weight (255 lbs) occupy the structure
in loading scenarios that would be non-typical in experimental testing. Examples of non-
typical loading situations include occupants gathered in a dense group near the end of the
cantilevered decking surface or unbalanced loading, distributing the majority of the load
to a single cantilevered beam. ASCE 7-10 recommended static live loading of 100 psf on
36 ft2 of the decking surface governed in design.
The superstructure of the test structure was constructed of 5”x4”x3/16” HSS sections
with a minimum yield stress of 46 ksi. The HSS cantilevers provide excellent torsional
stiffness and are compact eliminating the potential for local buckling. Connecting the two
ends of the cantilevered beams is a HSS frame that provides stability and lateral stiffness,
further increasing the natural frequency of the lateral vibration modes that are not of
interest. The deflection of the cantilever under the static design load condition is slightly
more than the AISC recommended cantilever deflection of L/140, where L is the length
of the cantilever. Deflections at service loads are approximately 0.82 in, or L/90.
However, the recommended deflection limit is not applicable as the structure is not
attached to other systems that would be impacted. In addition, the deflection is not likely
to be visually objectionable to the occupants as it is a test structure and not a regularly
occupied structure.

19
The decking surface is constructed of reinforced concrete planks, 12” wide and 5.25”
thick, spanning the cantilevered beams on roller pins. This pin connection between the
HSS cantilever and the concrete planks allows rotation and reduces composite action
between the steel superstructure and the concrete decking surface. The reinforced
concrete plank decking surface was designed with the following criteria in mind:
Additional mass was needed to achieve the lower bound of frequency of 4.21 Hz
and the desired mass ratio range of 0.06 to 0.60
Narrow planks without a mechanical connection to the steel structure limit the
level of potential composite action between the steel and concrete of the
cantilever.
Reinforced concrete planks are sufficiently rigid to resist excitation of local
vibration modes of the decking surface caused by active occupants.
Planks can be added or removed to change the area of the decking surface.
With the addition of the concrete planks, the test structure was completed. Figure 10
shows the test structure in its as-built condition.

20
2.3 Validation of the experimental test structure
2.3.1 Experimental modal analysis
The dynamic properties of the empty test structure as constructed were determined using
experimental modal analysis (EMA). EMA is a process in which the dynamic properties
of a structure are estimated through the evaluation of its dynamic response due to a
known excitation force. The equation of motion governing the response of a dynamic
system with viscous damping and forced excitation is
,
where is the mass matrix, is the viscous damping matrix, and is the stiffness
matrix for the system. The forcing function follows the solution form and
displacement . The frequency response function (FRF), comprised of the
structural response and excitation force , is a complex function taking the form
Figure 10: As-built test structure.

21
. The FRF describes the dynamic response of a structure to a known
excitation in terms of frequency. A FRF is typically presented in a Bode plot that depicts
the magnitude and phase of the complex function with respect to the frequency and
contains information about the dynamic properties of the structure. The FRF is the
fundamental component of EMA through which the dynamic properties are estimated.
EMA allows for the estimation of natural frequency, damping, and mode shapes as well
as the original mass, stiffness, and damping matrices.
Experimentally, a dynamic force is typically applied to the structure through the use of an
electrodynamic shaker, impact hammer, or heel drop. The acceleration response of the
structure is measured by accelerometers attached to the structure in various locations. The
input force and the acceleration response are analytically combined to form a response
model. From these response functions, modal properties such as natural frequencies and
mode shapes can be estimated with reasonable accuracy. The complete theory of EMA is
described in more detail in a variety of sources (Avitabile 2001, Ewins 2000).
2.3.2 Overview of experimental equipment and software
The excitation source for experimental testing of the cantilevered test structure was an
APS Dynamics Model 400 electrodynamic shaker. The structural response was measured
using PCB model 393A03 uniaxial seismic accelerometers (PCB 2012) that were
mechanically fastened along the back span and cantilever of the steel superstructure. The
data acquisition system, an IOTech Wavebook 516E with WBK18 signal conditioning
module, was used in conjunction with eZ-Analyst software (IOtech eZ-Series 2011) to

22
output an excitation force signal and collect real-time acceleration signals at a rate of 128
Hz. The experimental data collection plan consisted of collecting a minimum of three
data sets for each experimental configuration of the empty test structure. Each of the data
sets is a linear average of five complete cycles of the electrodynamic shaker (40 seconds
of data). The eZ-Analyst software generated frequency response functions (FRFs) from
the measured force input and structural response. Particular attention was paid to
coherence values which are a measurement of the quality of the data. Coherence is
defined as:
,
where and are measured FRFs. Quality FRF measurements will have a
coherence value near unity over the frequency range of interest or at least near the modes
of interest. Acceptable frequency response functions were exported to Vibrant
Technology‟s ME‟scopeVES 5.1 (Vibrant Technology 2011). Modal properties such as
natural frequencies, damping ratios, and mode shapes were estimated using curve-fitting
techniques within ME‟scope.
2.3.3 Location and description of excitation
The APS Dynamics Model 400 electrodynamic shaker (APS Dynamics 2012) was
located on the end corner of the cantilevered frame as previously shown in Figure 10. The
force input to the structure was determined through the measurement of the acceleration
of the armature of the shaker and subsequent multiplication by the moving mass. Figure
11 and 12 depict the electrodynamic shaker and typical force input to the structure. The

23
shaker was offset from the center of the structure to allow for excitation and identification
of both bending and torsional modes. The excitation signal was a sinusoidal chirp with a
frequency range of 1 to 50 Hz over an eight second time frame. A voltage output
corresponding to this chirp was generated in eZ-Analyst and amplified by an APS
Dynamics Model 145 power amplifier (APS Dynamics 2012) before being sent to the
shaker. This frequency bandwidth allowed data to be captured for at least the first three
modes of vibration for all configurations of the test structure.
Figure 11: Electrodynamic shaker.

24
Figure 12: Typical excitation force generated by the electrodynamic shaker.
2.3.4 Location and description of response measurements
The vertical acceleration of the structure was measured using ten accelerometers attached
along the back span and cantilever of the steel superstructure, as shown in Figure 13a and
Figure 13b. Accelerometers were located approximately every two feet along the HSS
steel beams to provide adequate data for development of mode shapes from the FRF data.
-10
-8
-6
-4
-2
0
2
4
6
8
10
0 1 2 3 4 5 6 7 8
Forc
e (l
bs)
Time (seconds)

25
a) b)
Figure 13: a) Location of accelerometers along HSS beams. b) Connection of
accelerometer to HSS beam.
Several experimental tests were also completed to verify the expected behavior of the
support conditions.
2.4 Estimation of dynamic properties
Data files exported from eZ-Analyst consist of 10 FRFs corresponding to the 10
accelerometer locations on the test structure. Global curve-fitting, using the orthogonal
polynomial method, was used to determine dynamic properties of the empty test
structure. Global curve-fitting of the test data provides the best approximation of
frequency and damping equations defining the modal model, fitting equations to all 10
FRFs simultaneously. Figure 14 illustrates curve-fitting the first three modes of vibration
of FRFs from a set of testing data.

26
Figure 14: Example curve-fitting in ME'scope.
The frequency value corresponding to each peak represents the approximate natural
frequency for each mode of vibration. The width and attenuation of the peak of the FRF
is an indication of the amount of damping for each mode. A wider peak indicates a
greater amount of damping; a narrower peak indicates a smaller amount of damping. A
frame model representing the geometry of the test structure was created in ME‟scope.
Modal data from each accelerometer on the test structure was paired with its
corresponding node on the ME‟scope model to facilitate an animation of the structure for
each mode of vibration.
The following describes the behavior of the first three modes of vibration that were
tested. Mode 1 will be referred to the first bending mode of vibration, which varies
between 4.21 Hz and 8.05 Hz depending on support condition of the test structure. Mode

27
1 is dominated by the vertical displacements of the cantilevered decking surface. An
illustration of this mode is given in Figure 15 from the SAP2000 finite element program.
Figure 15: Mode 1 of the test structure.
The second mode of vibration, Mode 2, is a torsional mode of the decking surface. This
mode is characterized by displacements of the cantilevered HSS beams that are 180
degrees out of phase. Mode 2, depicted in Figure 16 has a frequency in the range of 13.1
Hz to 22.0 Hz depending on the structural configuration.
Figure 16: Mode 2 of the test structure.

28
The last mode of vibration investigated in this study, known as Mode 3, is a second
bending or whip mode. Mode 3 is again dominated by the modal displacements of the
cantilever and is exhibited by a full sine wave shape of the HSS steel beams. Figure 17
depicts this mode which is excitable within the frequency range of 22 Hz to 38 Hz,
depending on the support conditions.
Figure 17: Mode 3 of the test structure.
The dynamic properties for six different configurations of the test structure were
determined. The dynamic behavior of the test structure for the first three modes of
vibration was needed for validation of the finite element model; however, for this study,
only the effects of human-structure interaction on the first bending mode are of interest.
Frequency and damping values of the first mode of vibration of the test structure for the
structural configurations are shown in Table 1. In the results to follow, structural
configurations will be designated by the natural frequency value for the first mode of
vibration of the empty structure. Figure 18 through Figure 23 illustrates the locations of
the support conditions of the each of the structural configurations using in testing.

29
Table 1: Experimental Frequency and damping values for the first mode of vibration.
Figure 18: 4.21 Hz structural configuration.
Figure 19: 4.80 Hz structural configuration.
Dynamic Properties of the Empty Structure
Frequency (Hz) Damping (%) Sample
Size (n) Average Std Dev. Average Std Dev.
4.21 0.01 0.310 0.097 10
4.80 0.005 0.231 0.003 2
5.41 0.022 0.403 0.076 8
6.27 0.007 0.511 0.057 10
7.30 0.081 0.613 0.007 4
8.05 0.000 1.180 0.000 2

30
Figure 20: 5.41 Hz structural configuration.
Figure 21: 6.27 Hz structural configuration.
Figure 23: 8.05Hz structural configuration
Figure 22: 7.30 Hz structural configuration

31
2.5 Validating the finite element model
The modal parameters of the as-built test structure varied slightly from the analytical
modal results of the original finite element model, despite the highest attention to detail
and acceptable tolerances during the construction of the structure. It was discovered that
the structure has a nonlinear response for varying levels of excitation resulting in a shift
of the FRF peaks of the first mode of vibration. This was controlled by limiting the
acceleration response of the structure within a range 0.08g and 0.10g measured at the end
on the cantilevered decking surface throughout all testing by varying the force input of
the shaker.
The natural frequencies of the test structure determined from EMA were slightly higher
than the natural frequencies predicted by the model. Two contributing factors to the
inconsistency are modeling of the connections and the slight imprecision in the cross-
sectional properties of the structural steel sections. The FE model of the test structure was
updated to match the experimental results. Table 2 displays the experimental and FE
model results for three structural configurations. The correlation of modes one and two is
most critical for this study, but attempts were also made to match the third mode.

32
Table 2: Natural frequency data from experimental testing and the FE model.
Further validation methods, beyond the numerical comparisons of natural frequency,
were also employed. The Modal Assurance Criterion (MAC) between the modal
displacements calculated by the SAP2000 FE model and the modal displacements from
the curve-fit experimental data were calculated. A MAC is statistical comparison between
mode shapes data and indicates the level of correlation between modes shape. Figure 24
shows a MAC between the FE model results and the experimental data for the 4.21 Hz
structural configuration. Perfect agreement in comparing the modal displacements of the
FE model results and experimental results would in a MAC value of 1.0.
Figure 24: MAC for between FE model and experimental mode shapes for 4.21 Hz
structural configuration.
1 4.21 4.23 5.51 5.41 6.49 6.28
2 13.1 13.4 16.6 17.2 19.3 19.6
3 29.1 29.3 35.8 32.4 40.1 34.5
Mode
4' deck, 6'-3"cantilever 4' deck, 5‟-3” cantilever 4' deck, 4'-3"‟ cantilever
Experimental
(Hz) FE Model (Hz)
Experimental
(Hz)
Experimental
(Hz) FE Model (Hz) FE Model (Hz)
33
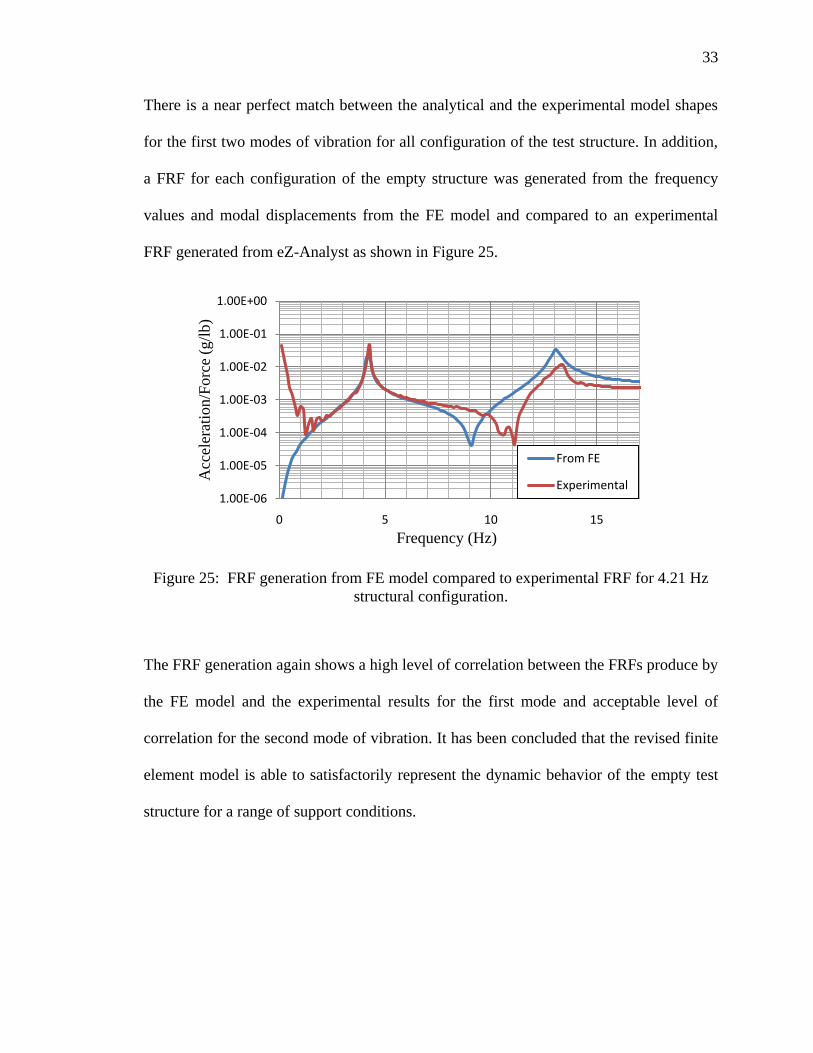
There is a near perfect match between the analytical and the experimental model shapes
for the first two modes of vibration for all configuration of the test structure. In addition,
a FRF for each configuration of the empty structure was generated from the frequency
values and modal displacements from the FE model and compared to an experimental
FRF generated from eZ-Analyst as shown in Figure 25.
Figure 25: FRF generation from FE model compared to experimental FRF for 4.21 Hz
structural configuration.
The FRF generation again shows a high level of correlation between the FRFs produce by
the FE model and the experimental results for the first mode and acceptable level of
correlation for the second mode of vibration. It has been concluded that the revised finite
element model is able to satisfactorily represent the dynamic behavior of the empty test
structure for a range of support conditions.
1.00E-06
1.00E-05
1.00E-04
1.00E-03
1.00E-02
1.00E-01
1.00E+00
0 5 10 15
Acc
eler
atio
n/F
orc
e (g
/lb)
Frequency (Hz)
From FE
Experimental

34
CHAPTER 3: EXPERIMENTAL TESTING PROCEDURE
3.1 Overview of testing methodology
The experimental testing plan that investigates human-structure interaction consisted of
two components, determining the dynamic properties of the unoccupied cantilevered test
structure which were previously identified in Chapter 2 and the dynamic properties of the
test structure when occupied. This chapter will detail the experimental testing plan with
occupants and provide information on the crowd characteristics, posture and number of
people on the structure.
3.2 Participant information
Before conducting experimental testing with occupants, approval was obtained from the
Institutional Review Board (IRB). A sample consent form can be seen in the Appendix A.
A total of eighteen different participants took part in this study (six females and twelve
males). Five students participated in this study multiple times. Potentially relevant
participant information including weight, height, age, gender and type of footwear was
collected; however, weight is the only information that was utilized in this study.
Table 3 quantifies the weight of the participants as a weighted average. The weighted
average takes into account the weight of the occupants that volunteered multiple times.
Table 3: Occupant weight data
Average Std.Dev. Minimum Maximum
Weight (lbs) 175.7 37.6 110 240

35
3.3 Occupant characteristics
3.3.1 Posture
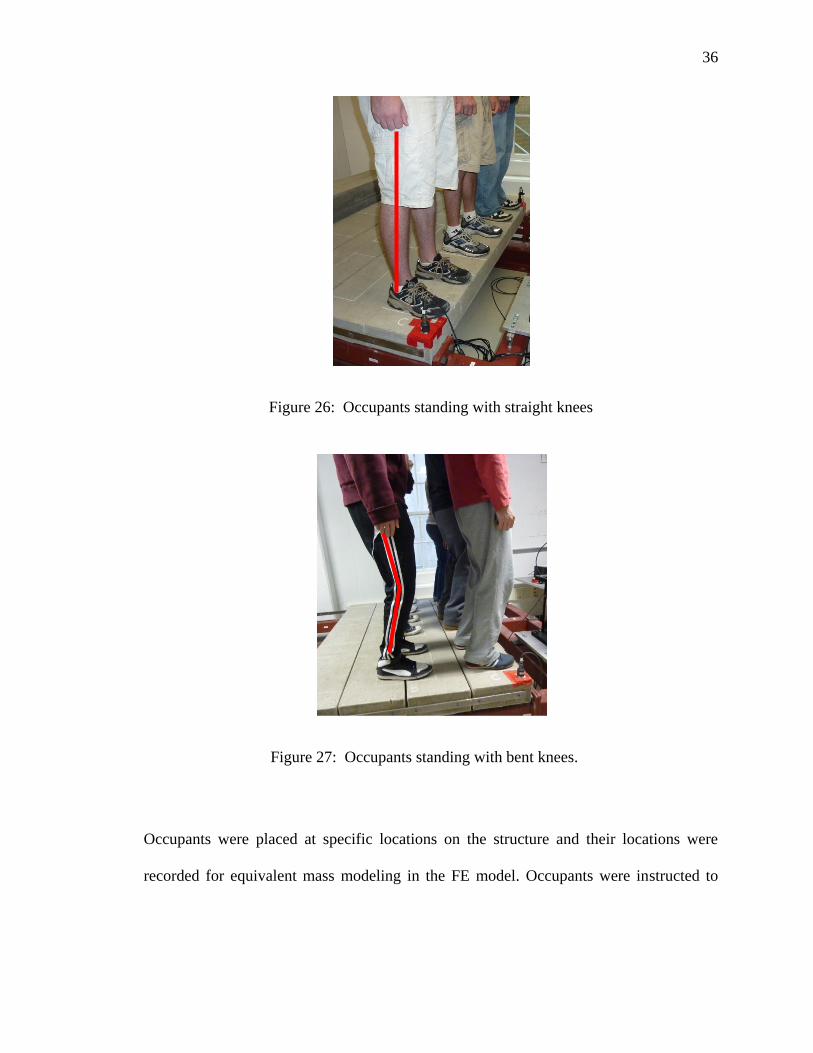
Previous research has indicated that posture plays a key role in the effect of human-
structure interaction. Two postures were investigated: standing with straight knees and
standing with bent knees. These two types of postures have been shown to have very
different effects on the dynamic properties of occupied structures in previous laboratory
studies. The standing with straight knees posture consisted of occupants standing erect
with arms down, and palms facing inward looking straight ahead, as shown in Figure 26.
Participants were instructed to not lock their knees, but rather stand in an erect posture
that could be maintained for at least 40 seconds, the time needed to collect one data set.
The standing posture with bent knees was similar to standing with straight knees, but
participants were asked to bend their knees as depicted in Figure 27.
36
Figure 26: Occupants standing with straight knees
Occupants were placed at specific locations on the structure and their locations were
recorded for equivalent mass modeling in the FE model. Occupants were instructed to
Figure 27: Occupants standing with bent knees.

37
stand within a grid work of nine boxes which was marked on the decking surface. This
resulted in occupants to standing in a natural, comfortable stance with their feet 16” apart.
3.3.2 Frequency and mass ratio
Frequency and mass ratio are two factors that are essential in this study because of their
influence on the level of human-structure interaction. With the adjustable nature of the
structural design, there were a total of six different natural frequencies, or configurations,
of the test structure that were investigated, ranging between 4.21 and 8.05 Hz as listed in
Table 4 and as previously described in Chapter 2.
Table 4: Experimental frequency and damping values for the first mode of vibration
Mass ratio for this study is defined as the ratio of combined mass of the occupants to the
active mass of the structure participating in the mode of vibration. The mass of the
structure is the combined mass of the HSS superstructure and concrete decking surface.
Previous research studies have indicated that mass ratios of assembly-types structures
typically fall in the range of 0.25 to 0.75 for stadiums at full capacity (Dougill 2005).
Dynamic Properties of the Empty Structure
Frequency (Hz) Damping (%) Sample
Size (n) Average Std Dev. Average Std Dev.
4.21 0.01 0.310 0.097 10
4.80 0.005 0.231 0.003 2
5.41 0.022 0.403 0.076 8
6.27 0.007 0.511 0.057 10
7.30 0.081 0.613 0.007 4
8.05 0.000 1.180 0.000 2
38
Further research was conducted for this study and it was found that the maximum
achievable mass ratios for several stadiums ranged from 0.27 to 0.68 when considering a
stadium at full capacity with an average occupant weight and including the mass of the
entire structure. The majority of previous experimental studies on human-structure
interaction used massive test structures with one or two occupants, resulting in very low
mass ratios, less than 0.20. The highest mass ratio obtained in an experimental study was
Firman, with a mass ratio of 0.42 (Firman 2010).
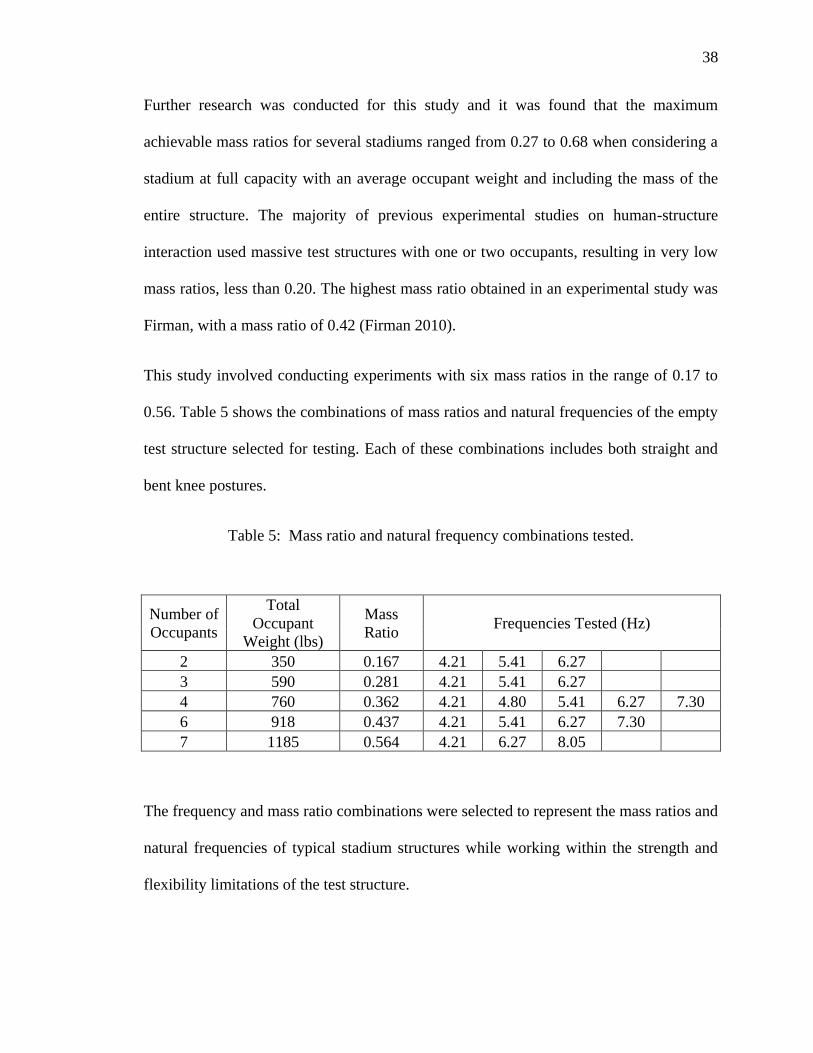
This study involved conducting experiments with six mass ratios in the range of 0.17 to
0.56. Table 5 shows the combinations of mass ratios and natural frequencies of the empty
test structure selected for testing. Each of these combinations includes both straight and
bent knee postures.
Table 5: Mass ratio and natural frequency combinations tested.
Number of
Occupants
Total
Occupant
Weight (lbs)
Mass
Ratio Frequencies Tested (Hz)
2 350 0.167 4.21 5.41 6.27
3 590 0.281 4.21 5.41 6.27
4 760 0.362 4.21 4.80 5.41 6.27 7.30
6 918 0.437 4.21 5.41 6.27 7.30
7 1185 0.564 4.21 6.27 8.05
The frequency and mass ratio combinations were selected to represent the mass ratios and
natural frequencies of typical stadium structures while working within the strength and
flexibility limitations of the test structure.

39
3.4 Experimental testing procedure
The experimental testing was completed in six testing sessions, one for each mass ratio.
The mass ratios were predetermined in the experimental testing plan; therefore,
volunteers were grouped based on their weight to achieve the desired mass ratio. A
consent form describing the testing procedure was developed and approved by IRB to
ensure the safety of the participants and to inform them about the nature of the study and
their rights as volunteers. Each volunteer signed the consent form and provided
information regarding height, weight, and age. The occupants were assigned to a
particular location in order to balance the occupant loading on the structure based on the
center of gravity of the group of occupants. Participants were instructed how to replicate
the two postures for this study, standing with straight knees and standing with bent knees.
The importance of each volunteer remaining as still as possible during testing was
emphasized to limit uncertainty between data sets caused by random movement.
Techniques for collecting data with occupants were similar to the methods used in
determining the dynamic properties of the empty structure. The same data acquisition
settings for excitation and response, described in Chapter 2, were used in experimental
modal analysis of the occupied structure. For each structural configuration, EMA was
performed on the empty condition conditions of the test structure before and after the
structure was occupied, allowing for a comparison between the dynamic properties of the
structure. If the dynamic properties did not match before and after, the data collected
when the structure was occupied could yield results that are not due solely to human-
structure interaction. Response control of the structure based on peak root-mean squared

40
(rms) acceleration values at the end of the decking surface was used for two reasons.
First, according to ISO standards and our approved IRB testing protocol, participants
could not be exposed to vibrations in excess of 0.1g or 10% of the acceleration due to
gravity. The force input of the shaker was controlled to produce response that was
approximately 0.08g peak rms at the end of the cantilevered decking surface for all
testing scenarios when the structure was occupied. The second reason for monitoring the
acceleration response is to keep it within the linear range of the dynamic behavior to
provide consistent and comparable results for both the empty and occupied conditions.
This testing procedure was repeated for each posture and each configuration of the
structure. A total of five testing sessions resulted in the data sets for the occupied test
structure considered in this study. The FRFs were curve-fit to determine the dynamic
properties of both the empty and the occupied test structure using ME‟scope methods as
outlined in Chapter 2.

41
CHAPTER 4: EXPERIMENTAL RESULTS
The experimental results from this study are derived from the frequency response
functions of the occupied and unoccupied conditions of the test structure. The FRFs were
curve-fit to determine the natural frequency and damping of the combined human-
structure system. This chapter will discuss the properties of the occupied structure.
4.1 Dynamic behavior of the structure and general data trends
The dynamic properties of the occupied test structure were determined within ME‟scope
by curve-fitting the experimental FRF data. The mode shapes of the occupied test
structure have similar curvature when visually compared to the mode shapes of the empty
test structure. The greatest difference in natural frequency between the empty and
occupied structural systems occurred for Mode 1, the first bending mode. This is not to
say that the changes in the dynamic properties for other modes are insignificant, just the
changes are most prominent for Mode 1 for all test results. The analysis discussed herein
focuses only on the effects of human-structure interaction for the first mode of vibration
of the test structure.
The results obtained from this study exhibit similar trends to those in previous studies on
human-structure interaction. The following serves as an overview of the experimental
results; more details are presented later in combination with the analytical results. An
increase in damping of the occupied system, regardless of posture type, was observed.
This increase in damping was expected as it was consistently observed in all previous
studies. The experimental results indicate that the level of damping in the occupied

42
system is dependent on posture type, as witnessed in Brownjohn‟s study (Brownjohn
1999). The human-structure system also exhibited an additional mode of vibration at
certain natural frequencies of the structure, similar to the intriguing observations in the
monitoring study of Twickenham Stadium by Ellis and Ji (Ellis and Ji 1997). This
additional mode of vibration was observed in the experimental results for the 4.21 Hz
structural configuration with occupants standing with bent knees and the 6.27 Hz
configuration for occupants standing with straight knees. This additional mode is a first
bending mode and occurred for all mass ratios of the occupied the test structure. Figure
28 and Figure 29 are examples that illustrate the additional mode of vibration for the 4.21
Hz and 6.27 Hz structural configurations. It can be noted that FRFs representing the
occupied conditions have more variability than the smooth FRFs representing the empty
conditions of the test structure. The variation is most likely due to the fact that occupants
were not remaining perfectly still during the 40 seconds of data collection. To determine
if the results are valid, the coherence values were examined for each FRF. Coherence
values of 0.8 or greater near the peak of the FRF is an indication that the data is of good
quality. The data collected for the structural configuration of 4.21 Hz with occupants
standing with bent knees is questionable of whether the coherence values are high enough
near the first bending mode to be considered of good quality. However, all other testing
scenarios had coherence values at 0.9 or greater for the first mode of vibration.

43
Figure 28: 4.21 Hz structural configuration showing the additional mode of vibration
when occupants stand with knees bent.
0
0.1
0.2
0.3
0.4
0.5
0.6
0.7
0.8
0.9
1
0.0001
0.001
0.01
0.1
2 4 6 8
Co
her
ence
Mag
nit
ud
e (g
's/l
b)
Frequency (Hz)
Empty Structure
Bent Knees
Occupied Coherence
44
Figure 29: 6.27 Hz structural configuration showing the additional mode of vibration
when occupants stand with knees straight.
For the higher natural frequency configurations of the test structure, 7.30 Hz and 8.05 Hz,
the experimental data indicated an increase in the natural frequency of the occupied
system when occupants stood with straight knees. These results are similar to the
unexpected results of the laboratory experiment by Ellis and Ji where a stiff concrete
beam with a natural frequency of 18.68 Hz exhibited an increase in frequency to 21.0 Hz
when occupied by a single person (Ellis and Ji 1994).
0
0.1
0.2
0.3
0.4
0.5
0.6
0.7
0.8
0.9
1
0.0001
0.001
0.01
0.1
2 4 6 8 10
Co
her
ence
Mag
nit
ud
e (g
's/l
b)
Frequency (Hz)
Empty Structure
Straight Knees
Occupied Coherence

45
4.2 Analytical results from the finite element model
In addition to the experimental results, the SAP2000 finite element was used to confirm
the theory that humans do not act simply as an equivalent mass. Using the weight and
location of each occupant, each occupant was represented as a point mass in the FE
model. Based on previous research, it was expected that modeling occupants as added
mass to the structure would not accurately represent the dynamic interaction between the
occupants and the test structure. The equivalent mass results are presented in sections
4.3.1 through 4.3.4 with the experimental results. The equivalent mass results provide an
additional reference for comparison and evaluation of the experimental results.
A crowd model with dynamic properties recommended by the Joint Working Group was
also used to represent the effects of human-structure interaction (IStructE 2008). A single
crowd model was created for each group of occupants using the combined mass of the
group, and the stiffness and damping properties corresponding to a crowd model with a
natural frequency of 5 Hz with 40% critical damping. This model is recommended for
less energetic events where the concern of panic due to crowd motion can be discounted,
which is representative of a passive crowd. The analysis was limited to structural
configurations of 4.21 Hz, 5.41 Hz, and 6.27 Hz because the Joint Working Group
specifies that stadiums with a natural frequency above 6 Hz typically are not likely to
experience serviceability issues due to crowd-induce loading.
46
4.3 Experimental results for natural frequency
4.3.1 Results for 4.21 Hz structural configuration
The following is a presentation of the experimental and analytical data of the occupied
test structure. Graphs are presented for each configuration of the empty test structure. The
abscissa represents the range of mass ratios tested for that structural configuration. The
ordinate represents the fundamental natural frequency of the structural system, either
empty or occupied. Figure 30 shows the mass ratio and frequency results for the 4.21 Hz
empty configuration. The damping values estimated in curve-fitting of the experimental
data for this same configuration are listed in Table 6.
Figure 30: 4.21 Hz structural configuration mass ratio and frequency results.
3.00
3.50
4.00
4.50
5.00
5.50
6.00
6.50
7.00
7.50
0.1 0.2 0.3 0.4 0.5 0.6 0.7
Fre
qu
ency
(H
z)
Mass Ratio
Empty
Straight Knees
Bent Knees a
Bent Knees b
Equiv. Mass
JWG a
JWG b

47
Table 6: 4.21 Hz structural configuration damping values.
Mass
Ratio
Experimental Damping (% Critical) FE Damping (% Critical)
Empty Straight Knees Bent Knees a Bent Knees b JWG a JWG b
0.167 0.38 3.1 8.5 7.5 6.4 1.6
0.281 0.37 2.8 11.7 6.7 N/A N/A
0.362 0.22 3.4 6.5 10.8 6.5 13.8
0.437 0.18 2.9 7.0 11.0 N/A N/A
0.564 0.39 4.5 3.0 11.4 6.0 11.7
Standing with bent knees on the 4.21 Hz structure resulted in two first bending modes,
which is one of the unusual cases mentioned earlier. The natural frequency of these
modes bounded the natural frequency of the empty structure in the same manner as the
Twickenham study. Occupants standing with straight knees caused a decrease in the
natural frequency of the system, and appear to be closely represented as modeling
occupants as added mass to the structure for this particular natural frequency of the empty
test structure. The analytical results from crowd model, discussed in Section 4.2,
produced two first bending modes as well, labeled JWG a and JWG b. The data contained
in JWG a is the only reasonable estimate to the experimental results of standing with
straight knees since it estimates a decrease in the natural frequency of the occupied test
structure. It can be noted, based on the results in Table 6 that standing with bent knees
adds a significant amount of damping to the system when compared to standing with
straight knees. The analytical crowd model proposed by the Joint Working Group
overestimates the amount of damping in the system when compared to the experimental
results.

48
4.3.2 Results for 5.41 Hz structural configuration
The results are similar for testing with the 5.41 Hz configuration of the test structure
except that only a single first bending mode exists for occupants standing with knees
bent. The frequency of the system increases when occupants stand with bent knees as
shown graphically in Figure 31.
Figure 31: 5.41 Hz structural configuration mass ratio and frequency results.
Occupants standing with straight knees can no longer be closely approximated by the
equivalent mass results. Table 7 indicates that damping of the occupied structure is
similar between standing with straight knees or with bent knees and damping is
overestimated by the crowd model.
3.00
3.50
4.00
4.50
5.00
5.50
6.00
6.50
7.00
7.50
0.1 0.15 0.2 0.25 0.3 0.35 0.4 0.45 0.5 0.55
Fre
qu
ency
(H
z)
Mass Ratio
Empty
Straight Knees
Bent Knees
Equiv. Mass
JWG a
JWG b

49
Table 7: 5.41 Hz structural configuration damping values.
Mass
ratio
Experimental Damping (% Critical) FE Damping (% Critical)
Empty Straight Knees Bent Knees JWG a JWG b
0.167 0.43 5.4 5.2 N/A N/A
0.281 0.43 5.5 5.6 16.3 14.5
0.362 0.46 7.4 4.7 17.2 16.6
0.437 0.29 7.7 6.5 16.7 13.7
4.3.3 Results for 6.27 Hz structural configuration
Occupants standing with straight knees on the 6.27 Hz empty structural configuration
added an additional mode of vibration as shown by the two curves in
Figure 32. This was an unexpected occurrence just as the additional mode for occupants
standing with bent knees on the 4.21 Hz structural configuration.
3.00
3.50
4.00
4.50
5.00
5.50
6.00
6.50
7.00
7.50
8.00
0.1 0.2 0.3 0.4 0.5 0.6 0.7
Fre
qu
ency
(H
z)
Mass Ratio
Empty
Straight Knees a
Straight Knees b
Bent Knees
Equiv. Mass
JWG a
JWG b

50
Figure 32: 6.27 Hz structural configuration mass ratio and frequency results.
The natural frequency of these two modes bound the natural frequency of the empty test
structure with the exception of testing with a mass ratio of 0.167. The natural frequency
of occupants standing with knees straight continues to deviate from the equivalent mass
results and occupants standing with knees bent cause the frequency of the system to
increase. The crowd model fails to represent the change in dynamic properties in both
natural frequency and damping. Standing with straight knees adds more damping to the
system than standing with bent knees as indicated in Table 8.
3.00
3.50
4.00
4.50
5.00
5.50
6.00
6.50
7.00
7.50
8.00
0.1 0.2 0.3 0.4 0.5 0.6 0.7
Fre
qu
ency
(H
z)
Mass Ratio
Empty
Straight Knees a
Straight Knees b
Bent Knees
Equiv. Mass
JWG a
JWG b

51
Table 8: 6.27 Hz structural configuration damping values.
Mass
ratio
Experimental Damping (% Critical) FE Damping (% Critical)
Empty Straight Knees a Straight Knees b
Bent
Knees JWG a JWG b
0.167 0.53 10.1 7.3 3.5 0.3 16.7
0.281 0.45 11.4 6.5 5.5 N/A N/A
0.362 0.46 12.4 12.8 1.6 0.3 17.7
0.437 0.53 11.5 10.3 4.9 N/A N/A
0.564 0.59 7.5 7.1 4.3 0.3 17.4
4.3.4 Results for 7.30 Hz and 8.05 Hz structural configurations
At higher natural frequencies of the empty test structure an increase or little to no change
was observed in the natural frequency of the occupied system, regardless of the posture
of the occupants. Only two mass ratios were tested for the 7.30 Hz configuration and one
mass ratio for the 8.05 Hz structural configuration. Figure 33 and Figure 34 show the
changes in frequency.

52
Figure 33: 7.30 Hz structural configuration mass ratio and frequency results.
5.00
5.50
6.00
6.50
7.00
7.50
8.00
8.50
9.00
0.3 0.35 0.4 0.45 0.5 0.55
Fre
qu
ency
(H
z)
Mass Ratio
Empty
Straight Knees
Bent Knees
Equiv. Mass

53
Figure 34: 8.05 Hz structural configuration mass ratio and frequency results.
With an increase in natural frequency of the occupied system, modeling occupants as
equivalent mass underestimates the natural frequency. Standing with straight knees
continues to dominate the level of damping in the system as the empty natural frequency
of the test structure increases as indicated in Table 9 and Table 10.
Table 9: 7.30 Hz structural configuration damping values.
Mass
ratio
Experimental Damping (% Critical)
Empty Straight Knees Bent Knees
0.362 0.618 16.5 1.44
0.437 0.608 18.3 4.01
5.00
5.50
6.00
6.50
7.00
7.50
8.00
8.50
0.45 0.5 0.55 0.6 0.65
Fre
qu
ency
(H
z)
Mass Ratio
Empty
Straight Knees
Bent Knees
Equiv. Mass

54
Table 10: 8.05 Hz structural configuration damping values.
Mass
ratio
Experimental Damping (% Critical)
Empty Straight Knees Bent Knees
0.564 1.18 12.7 3.08
The results from this study indicate that frequency and damping properties of the
occupied structure are dependent on the posture of the occupants. The additional mode of
vibration for occupants standing with bent knees on the 4.21 Hz configuration and
standing with straight knees on the 6.27 Hz structural configuration is further proof of the
existence of human-structure interaction. It proved to be difficult to accurately estimate
the dynamic changes analytically using a crowd model such as the one proposed by the
Joint Working Group.

55
CHAPTER 5: DISCUSSION AND CONCLUSIONS
5.1 Discussion of results
The data collected in this study provides further evidence that the human-structure
interaction phenomenon exists. The experimental results indicate that occupants on a
structure do not simply add mass to the structural system. This study expanded on the
current body of knowledge of human-structure interaction which is based on several
disconnected observations and laboratory tests, through the investigation of varying
crowd characteristics on a single structural system with variable stiffness. This allowed
for the comparison of many crowd-structure dynamic systems that are a function of
different mass ratios, postures of the occupants, and natural frequencies of the test
structure. The result is a significant data set incorporating numerous variables that
requires interpretation.
The data set consists of:
1. Dynamic properties determined experimentally for a variety of occupied
structural systems including varying postures and crowd sizes
2. Dynamic properties determined analytically assuming the occupants can be
appropriately represented as an equivalent mass
3. Dynamic properties determined analytically from a crowd model proposed by the
Joint Working Group

56
The challenge is determining how to utilize this data to assess the current crowd model
recommended by the Joint Working Group and to propose improvements, if any.
5.1.1 Damping of the occupied structure
In all of the occupied configurations investigated in this study, the experimental results
presented in Chapter 4 indicated that occupants add significant damping to the human-
structure system. However, it is difficult to predict the exact level of damping of an
occupied structure since it appears to depend on the posture of each occupant. The results
are inconclusive in determining if the amount of damping is proportional to the number
of occupants. However, general trends in damping are presented based on posture of the
occupants and frequency of the empty structure.
The level of damping of the system appears to be dependent on the natural frequency of
the structure and the posture of the occupants. Occupants standing with knees bent adds
more damping to the system over standing with knees straight when the natural frequency
of the empty structure is between 4.21 Hz and 5.41 Hz. Likewise occupants standing with
knees straight adds more damping to the system than standing with knees bent when the
natural frequency of the empty structure is between 5.41 Hz and 8.05 Hz. One possible
explanation is that higher levels of damping in the occupied structure occur when the
natural frequency of the empty structure is near the natural frequency of the crowd. It is
known that occupants have a high level of damping, perhaps the damping from the crowd
is transferred to the structure when the natural frequency of the human system closely
matches the natural frequency of the structural system.

57
The crowd model recommended by the Joint Working Group was created for each group
of occupants as described in Chapter 4. The guidance suggests that stadium structures
with a natural frequency 6 Hz or above are typically not subject to vibration serviceability
issues. The analytical crowd model was applied to the finite element model for three
configurations of the test structure with empty natural frequencies of 4.21 Hz, 5.41 Hz,
and 6.27 Hz for select mass ratios. The model overestimates the level of damping of the
crowd-structure system as much as 68% with respect to the experimental data collected in
with the 4.21 Hz and 5.41 Hz configurations. On the other hand, the model
underestimates the level of damping in the system for the 6.27 Hz configuration. The
results of this study indicate that the recommended crowd model does not accurately
predict the level of damping that is present in the occupied structure.
5.1.2 Frequency
Ideally, a crowd model could be used to estimate frequency of the combined occupant-
structure system. However, the recommended crowd model did not accurately represent
either the shift in frequency due to passive occupants standing with knees bent or with
knees straight. It can be assumed that occupants standing with straight knees would be
the typical posture of passive occupants on a stadium structure since standing with knees
bent is an uncomfortable posture to hold for long durations. Even so, the crowd model
using the exact masses of the occupants incorrectly estimated the frequency of the
human-structure system with occupants standing with knees straight by 0.3 Hz to 3.1 Hz.
The model also failed to simulate the two closely spaced modes evident in the

58
experimental data for the standing with knees bent on the 4.21 Hz test structural
configuration and standing with knees straight on the 6.27 Hz structural configuration.
An equivalent mass model of the crowd provided results at lower natural frequencies of
the empty test structure (4.21 Hz and 4.80 Hz) that were very similar to the experimental
results for the occupants in the straight knees posture. However, the equivalent mass
results did not accurately represent the frequency shift for other configurations of the test
structure. The equivalent mass model does not incorporate damping from the occupants,
so it is not of much use other than for estimating natural frequency. Perhaps in some
cases the crowd model and equivalent mass results provide a better estimation of the
dynamic response of the occupied structure rather than simply using the dynamic
properties of the empty structure during design, but they do not provide an exact
representation of actual data.
5.2 Proposed model
A quest began to define parameters of a new crowd model that would better represent the
effects of human-structure interaction for occupants standing with straight knees on a
structure with an empty natural frequency in the range of 4.21 Hz to 6.27 Hz. A crowd
model was developed to accurately predict the change in natural frequency due to human-
structure interaction when compared to the experimental results in this study; it was
discovered that damping of the system is more difficult to simulate.
The proposed crowd model is a single degree of freedom model and uses the same
method to calculate the parameters as crowd model recommended by the Joint Working
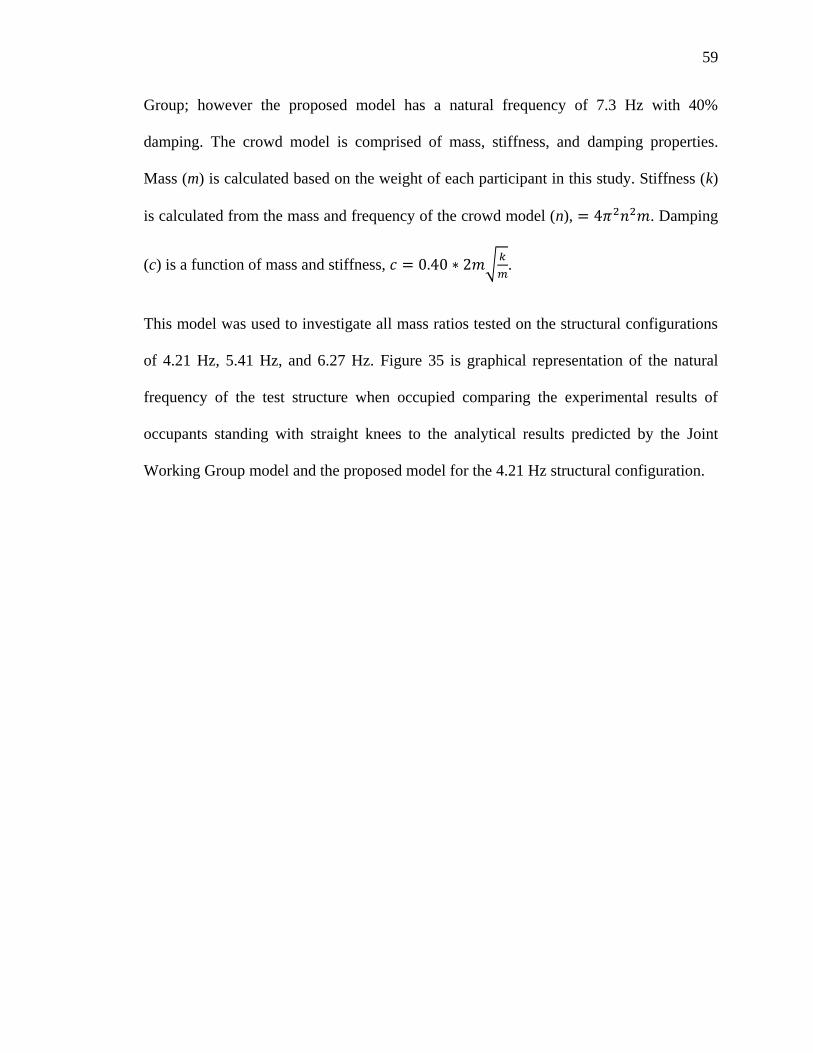
59
Group; however the proposed model has a natural frequency of 7.3 Hz with 40%
damping. The crowd model is comprised of mass, stiffness, and damping properties.
Mass (m) is calculated based on the weight of each participant in this study. Stiffness (k)
is calculated from the mass and frequency of the crowd model (n), . Damping
(c) is a function of mass and stiffness,
.
This model was used to investigate all mass ratios tested on the structural configurations
of 4.21 Hz, 5.41 Hz, and 6.27 Hz. Figure 35 is graphical representation of the natural
frequency of the test structure when occupied comparing the experimental results of
occupants standing with straight knees to the analytical results predicted by the Joint
Working Group model and the proposed model for the 4.21 Hz structural configuration.

60
Figure 35: 4.21 Hz structural configuration experimental and modeling frequency
results.
The proposed model is within 2.5% of the experimental results compared to IStructE
model that is within 10.5%. The proposed model does not provide a great representation
of the level of damping in the combined system, but it does not overestimate the level of
damping as the Joint Working Group model does, as shown in Figure 36. Overestimating
the level of damping during design can be dangerous if it is considered in the prediction
of the vibration response for serviceability assessment. Therefore, the proposed model
conservatively estimates the level of damping of the combined human-structure system.
2.50
2.70
2.90
3.10
3.30
3.50
3.70
3.90
4.10
4.30
4.50
0.1 0.2 0.3 0.4 0.5 0.6 0.7
Fre
qu
ency
(H
z)
Mass Ratio
Empty
Straight Knees
JWG
Proposed Model

61
Figure 36: 4.21 Hz structural configuration experimental and modeling damping results.
Similarly the predicted dynamic behavior for occupants on a structure with empty natural
frequencies of 5.41 Hz and 6.27 Hz were estimated within 2.7% of the experimental
natural frequency as shown in Figure 37 and Figure 38.
0.00
1.00
2.00
3.00
4.00
5.00
6.00
7.00
0.1 0.2 0.3 0.4 0.5 0.6 0.7
Dam
pin
g
(% C
riti
cal)
Mass Ratio
Empty
Straight Knees
JWG
Proposed Model

62
Figure 37: 5.41 Hz structural configuration experimental and modeling frequency results.
Figure 38: 6.27 Hz structural configuration experimental and modeling frequency
results.
3.50
4.00
4.50
5.00
5.50
6.00
0.1 0.15 0.2 0.25 0.3 0.35 0.4 0.45 0.5 0.55
Fre
qu
ency
(H
z)
Mass Ratio
Empty
Straight Knees
JWG
Proposed Model
4.00
4.50
5.00
5.50
6.00
6.50
7.00
0.1 0.2 0.3 0.4 0.5 0.6 0.7
Fre
qu
ency
(H
z)
Mass Ratio
Empty
Straight Knees
JWG
Proposed Model

63
The damping estimates predicted by the proposed model are conservative for results for
the 5.41 Hz structural configuration as shown in Figure 39.
Figure 39: 5.41 Hz structural configuration experimental and modeling damping results.
The proposed crowd model underestimates the level of damping for occupants standing
with straight on the 6.27 Hz structural configuration. The proposed model provides a
better estimate of the damping in the system than the Joint Working Group model as
shown in Figure 40.
0.00
2.00
4.00
6.00
8.00
10.00
12.00
14.00
16.00
18.00
20.00
0.1 0.15 0.2 0.25 0.3 0.35 0.4 0.45 0.5 0.55
Dam
pin
g
(% C
riti
cal)
Mass Ratio
Empty
Straight Knees
JWG
Proposed Model

64
Figure 40: 6.27 Hz structural configuration experimental and modeling damping results.
5.3 Conclusions
Human-structure interaction is a phenomenon that is dependent on several factors
including the natural frequency of the empty structural system and the posture and mass
of the occupants. For this study, it was concluded that the recommended dynamic crowd
model developed by the Joint Working Group did not accurately represent the dynamic
properties determined experimentally. It was found that occupants standing with bent
knees add significant damping to the test structure with an empty frequency in the range
of 4.21 Hz to 5.41 Hz, and significant damping with a straight knees posture when the
structure has an empty frequency in the range of 5.41 Hz to 8.05 Hz.
0.00
2.00
4.00
6.00
8.00
10.00
12.00
14.00
0.1 0.2 0.3 0.4 0.5 0.6 0.7
Dam
pin
g
(% C
riti
cal)
Mass Ratio
Empty
Straight Knees
JWG
Proposed Model

65
Based on the results from this study, the designer should be aware that occupants
standing with straight knees can greatly reduce the natural frequency of an empty
structure with a natural frequency in the range of 4.21 Hz to 6.27 Hz, and in some cases
reduce the frequency below what can be estimated by modeling occupants as applied
mass to the structure. For structures with a frequency of 7.3 Hz to 8.0 Hz, and possibly
higher, occupants do not decrease the natural frequency of the occupied system. This
potentially eliminates the need to consider the effects of human-structure interaction for
vibration serviceability assessment within this range.
A single degree of freedom crowd model is proposed with a frequency of 7.3 Hz and
damping of 40% critical. This model is used in conjunction with the FE model of the test
structure to the estimate the shift in the natural frequency due to human-structure
interaction when occupants are standing with straight knees. The damping of the human-
structure system estimated with the proposed model does not replicate the experimental
results exactly; however, it provides a conservative estimate of the level of damping in
the system.
There are several limitations associated with the results presented. First, the test structure
was designed and constructed with simple connections that can easily be modeled in a
finite element program. Because of the simple components and dynamic testing methods
used, it was possible to validate the finite element model so that it is representative of the
dynamic properties of the empty structure. In addition, analysis of the experimental data
was limited to the first mode of vibration. Actual stadiums are more complex in design

66
and construction, possibly making it more difficult to determine dynamic properties of
the structure during the design phase. Also, the proposed crowd model is a single degree
of freedom dynamic model that represents the dynamic properties of the entire crowd.
Perhaps a range of dynamic properties for crowd model are more appropriate for
modeling the effects of human-structure interaction. Lastly, it is unknown if the proposed
crowd model can be used to provide an accurate representation of the dynamic properties
of another structure when occupied with people standing with straight knees.
5.4 Future work
Further investigation of experimental data collected from this study and the collection of
additional data will aid in improving the proposed crowd model to accurately represent
both the frequency and damping effects of human-structure interaction. Damping
estimates need to be improved for the proposed crowd model. The refined model can then
be applied to other structural configurations, such as those with higher empty natural
frequencies. The additional mode of vibration for the 4.21 Hz and 6.27 Hz configuration
requires additional consideration since the reason for their existence is still not fully
understood. Data with other groups of occupants can be collected for these configurations
of the test structure and for structural configurations with similar natural frequencies.
To further investigate posture of the occupants, crowd models need to be developed to
represent the effects of human-structure interaction for occupants standing with bent
knees and seated occupants. Sufficient data exists to create a crowd model with bent

67
knees. The structure needs to be retrofitted to accommodate seating that is fixed to the
structure in order collect the experimental data needed to investigate the seated posture.
The final check is to verify that the crowd models work in predicting the dynamic effects
due to human-structure interaction for other occupied structures. Finite element models of
these structures are needed along with experimental data for the empty and occupied
conditions. These models could be developed from in-service monitoring studies or other
laboratory studies that investigate human-structure interaction.

68
APPENDICES
Appendix A: Participant informed consent form

69
Participation in Research Study involving Human-Structure Interaction
Informed Consent Form
1. Project name: Investigating the Effects of Various Crowd and Structural Characteristics on the
Dynamic Properties of an Occupied Structure
2. Purpose of the research: The aim of the current study is to investigate the effects of various crowd
characteristics on the dynamic properties of the structure which they occupy. It is expected that the
crowd characteristics, including size, density, distribution, and posture, will affect the dynamic
properties of the empty structure, including natural frequency, damping ratio, and possibly mode
shapes.
3. Overall research plan: Information including gender, age, height, weight, and shoe type will be
collected for each occupant. Experimental measurements will then be taken and data analysis will be
performed on an empty test structure and on a variety of configurations of the structure when occupied
by the study participants.
4. Research plan duration: It is expected that experimental measurements involving study participants
will be taken in 1 session, lasting approximately 3 hours.
5. Participation in this study is 100% voluntary. Participants will not be compensated in any way
including, but not limited to, monetarily, academically, etc. Participants may withdraw from the study
at any point and for any reason without any consequences. Participants are encouraged to ask
questions at any time about the study and his/her participation in the study.
6. The data gathered in this study will be maintained confidentially through secure file storage. Data will
only be used by the PI or research assistant involved with this study, unless written permission is given
to do otherwise.
7. There is a small but unlikely risk of discomfort or loss of balance due to dynamic motion of structure
being occupied. If you feel a loss of balance or are uncomfortable with the motion, you are to stop the
activity and immediately inform the PI or research assistant so that the testing can be halted.
8. It is regarded as extremely unlikely that any physical harm would come to any research participant.
The activities performed during the experimental measurement sessions are not believed to increase
your risk more than what you would experience in everyday activities. In the event of physical injury
resulting from the subject‟s participation in the research, emergency medical treatment will be
immediately called for the subject. The subject should immediately notify the investigator if s/he is
injured. If the subject requires additional medical treatment, s/he will be responsible for the cost. No
other compensation will be provided if s/he sustains an injury resulting from the research.
I have read the above description of the research and any uncertainties were satisfactorily explained to me
by Kelly Salyards or Nicholas Noss. I agree to participate in this research, and I acknowledge that I have
received a personal copy of this signed consent form.
By signing below, I affirm that I am at least 18 years of age or older.
Signature of Subjects: _______________________________________ Date: _________

70
Appendix B: Experimental frequency and damping values of the occupied test
structure obtained from curve-fitting

71
4.21 Hz configuration, 0.167 Mass ratio, Standing with straight knees
Mode 1 Mode 2
File Name Freq. (Hz) % Damp Freq. (Hz) % Damp
HSI_117_2_ppl_C_s1 3.81 3.01 13.1 10.5
HSI_117_2_ppl_C_s2 3.78 2.74 13.2 10.3
HSI_117_2_ppl_C_s3 3.78 3.50 13.5 10.2
Average 3.79 3.08 13.3 10.3
Standard Deviation 0.014 0.315 0.170 0.125
4.21 Hz configuration, 0.167 Mass ratio, Standing with bent knees
Mode 1 Mode 2
File Name Freq. (Hz) % Damp Freq. (Hz) % Damp
HSI_117_2_ppl_C_b1 3.59 11.5 4.71 6.23
HSI_117_2_ppl_C_b2 3.62 8.07 5.01 7.06
HSI_117_2_ppl_C_b3 3.58 6.00 4.78 9.14
Average 3.60 8.52 4.83 7.48
Standard Deviation 0.017 2.27 0.128 1.22
4.21 Hz configuration, 0.281 Mass ratio, Standing with straight knees
Mode 1 Mode 2
File Name Freq. (Hz) % Damp Freq. (Hz) % Damp
HSI_10-26-11_117C1 3.57 2.33 12.8 9.97
HSI_10-26-11_117C2 3.56 2.78 13.1 10.3
HSI_10-26-11_117C3 3.58 3.31 13.1 9.54
Average 3.57 2.81 13.0 9.94
Standard Deviation 0.008 0.401 0.141 0.311
4.21 Hz configuration, 0.281 Mass ratio, Standing with bent knees
Mode 1 Mode 2
File Name Freq. (Hz) % Damp Freq. (Hz) % Damp
HSI_117_3_ppl_C_b1 3.62 17.0 5.17 6.22
HSI_117_3_ppl_C_b2 3.75 8.68 4.91 7.37
HSI_117_3_ppl_C_b3 3.97 9.54 5.07 6.52
Average 3.78 11.7 5.05 6.70
Standard Deviation 0.144 3.74 0.107 0.487

72
4.21 Hz configuration, 0.362 Mass ratio, Standing with straight knees
Mode 1 Mode 2
File Name Freq. (Hz) % Damp Freq. (Hz) % Damp
HSI_117_BC_s1 3.51 3.49 13.6 10.9
HSI_117_BC_s2 3.50 2.94 13.7 10.6
HSI_117_BC_s3 3.49 3.86 13.9 11.0
Average 3.50 3.43 13.7 10.8
Standard Deviation 0.008 0.378 0.125 0.170
4.21 Hz configuration, 0.362 Mass ratio, Standing with bent knees
Mode 1 Mode 2
File Name Freq. (Hz) % Damp Freq. (Hz) % Damp
HSI_117_BC_b1 3.68 10.9 4.84 10.2
HSI_117_BC_b2 3.38 5.05 4.82 11.2
HSI_117_BC_b3 3.54 3.57 5.20 11.0
Average 3.53 6.51 4.95 10.8
Standard Deviation 0.123 3.16 0.175 0.432
4.21 Hz configuration, 0.437 Mass ratio, Standing with straight knees
Mode 1 Mode 2
File Name Freq. (Hz) % Damp Freq. (Hz) % Damp
HSI_117_BC_s1 3.49 2.65 13.4 11.2
HSI_117_BC_s2 3.51 3.14 13.2 11.3
HSI_117_BC_s3 3.51 2.79 13.2 13.3
Average 3.50 2.86 13.3 11.9
Standard Deviation 0.009 0.206 0.094 0.967
4.21 Hz configuration, 0.437 Mass ratio, Standing with bent knees
Mode 1 Mode 2
File Name Freq. (Hz) % Damp Freq. (Hz) % Damp
HSI_117_BC_b1 3.64 3.66 4.89 12.7
HSI_117_BC_b2 3.39 6.45 4.90 11.3
HSI_117_BC_b3 3.57 11.0 5.22 8.85
Average 3.53 7.04 5.00 11.0
Standard Deviation 0.105 3.03 0.153 1.59

73
4.21 Hz configuration, 0.564 Mass ratio, Standing with straight knees
Mode 1 Mode 2
File Name Freq. (Hz) % Damp Freq. (Hz) % Damp
HSI_117_s1 3.42 3.60 14.4 16.0
HSI_117_s2 3.47 4.94 13.5 16.5
HSI_117_s3 3.42 4.87 13.8 16.5
Average 3.44 4.47 13.9 16.3
Standard Deviation 0.024 0.616 0.374 0.236
4.21 Hz configuration, 0.564 Mass ratio, Standing with bent knees
Mode 1 Mode 2
File Name Freq. (Hz) % Damp Freq. (Hz) % Damp
HSI_117_b1 3.33 11.3 5.25 14.3
HSI_117_b2 3.34 6.35 5.19 9.87
HSI_117_b3 3.31 4.26 5.13 10.1
Average 3.33 7.30 5.19 11.4
Standard Deviation 0.012 2.95 0.049 2.04
4.80 Hz configuration, 0.362 Mass ratio, Standing with straight knees
Mode 1 Mode 2
File Name Freq. (Hz) % Damp Freq. (Hz) % Damp
HSI_110_117_BC_s1 3.97 4.23 14.9 11.9
HSI_110_117_BC_s2 3.97 4.65 15.1 11.1
HSI_110_117_BC_s3 3.97 4.45 15.1 11.3
Average 3.97 4.44 15.0 11.4
Standard Deviation 0.000 0.172 0.094 0.340
4.80 Hz configuration, 0.362 Mass ratio, Standing with bent knees
Mode 1 Mode 2
File Name Freq. (Hz) % Damp Freq. (Hz) % Damp
HSI_110_117_BC_b1 5.37 5.10 14.2 7.42
HSI_110_117_BC_b2 5.42 5.56 14.1 6.57
HSI_110_117_BC_b3 5.36 6.85 14.1 6.86
Average 5.38 5.84 14.1 6.95
Standard Deviation 0.026 0.741 0.047 0.353

74
5.41 Hz configuration, 0.167 Mass ratio, Standing with straight knees
Mode 1 Mode 2
File Name Freq. (Hz) % Damp Freq. (Hz) % Damp
HSI_121_2_ppl_C_s1 4.70 4.85 16.8 7.95
HSI_121_2_ppl_C_s2 4.72 5.10 16.7 8.04
HSI_121_2_ppl_C_s3 4.79 6.34 16.7 8.56
Average 4.74 5.43 16.7 8.18
Standard Deviation 0.039 0.652 0.047 0.269
5.41 Hz configuration, 0.167 Mass ratio, Standing with bent knees
Mode 1 Mode 2
File Name Freq. (Hz) % Damp Freq. (Hz) % Damp
HSI_121_2_ppl_C_b1 5.66 4.70 16.2 6.10
HSI_121_2_ppl_C_b2 5.76 6.94 16.2 6.38
HSI_121_2_ppl_C_b3 5.66 3.81 16.2 5.76
Average 5.69 5.15 16.2 6.08
Standard Deviation 0.047 1.32 0.000 0.254
5.41 Hz configuration, 0.281 Mass ratio, Standing with straight knees
Mode 1 Mode 2
File Name Freq. (Hz) % Damp Freq. (Hz) % Damp
HSI_10-26-11_121C1 4.51 5.54 17.7 9.71
HSI_10-26-11_121C2 4.48 5.87 17.5 10.5
HSI_10-26-11_121C3 4.46 5.13 17.4 11.0
Average 4.48 5.51 17.5 10.4
Standard Deviation 0.021 0.303 0.125 0.531
5.41 Hz configuration, 0.281 Mass ratio, Standing with bent knees
Mode 1 Mode 2
File Name Freq. (Hz) % Damp Freq. (Hz) % Damp
HSI_121_3_ppl_C_b1 5.87 6.03 16.5 7.37
HSI_121_3_ppl_C_b2 5.81 5.48 16.5 6.93
HSI_121_3_ppl_C_b3 5.89 5.15 16.3 5.79
Average 5.86 5.55 16.4 6.70
Standard Deviation 0.034 0.363 0.094 0.666
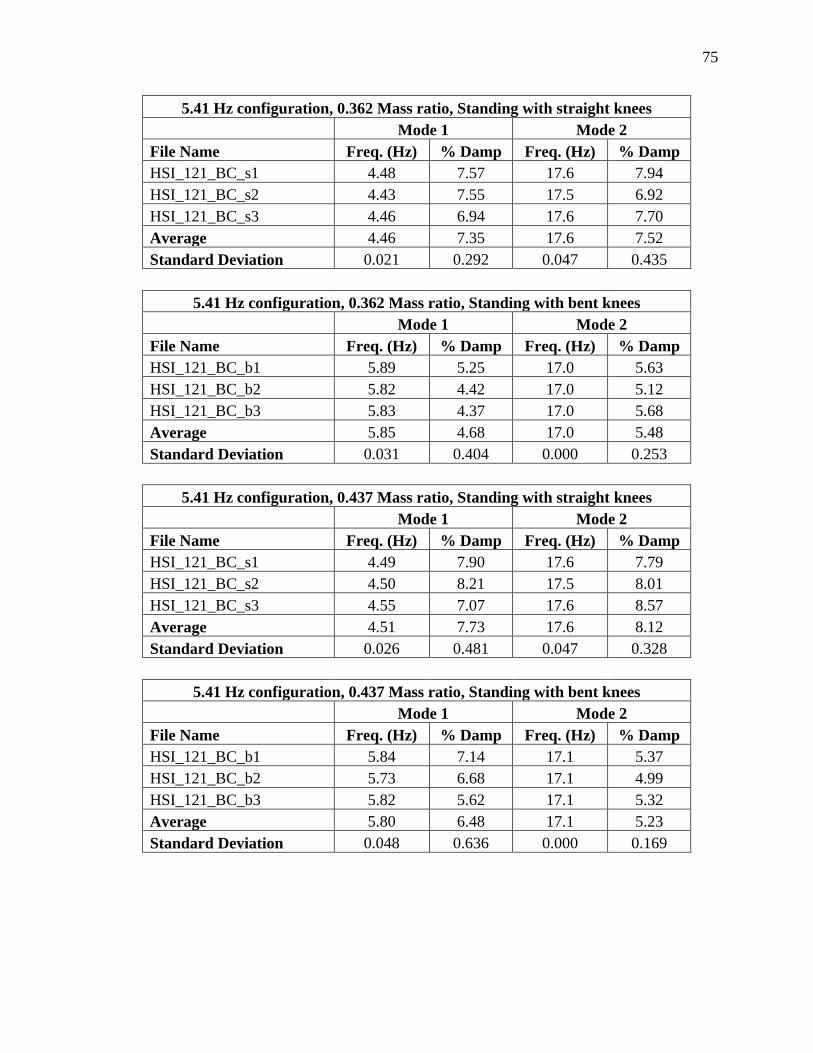
75
5.41 Hz configuration, 0.362 Mass ratio, Standing with straight knees
Mode 1 Mode 2
File Name Freq. (Hz) % Damp Freq. (Hz) % Damp
HSI_121_BC_s1 4.48 7.57 17.6 7.94
HSI_121_BC_s2 4.43 7.55 17.5 6.92
HSI_121_BC_s3 4.46 6.94 17.6 7.70
Average 4.46 7.35 17.6 7.52
Standard Deviation 0.021 0.292 0.047 0.435
5.41 Hz configuration, 0.362 Mass ratio, Standing with bent knees
Mode 1 Mode 2
File Name Freq. (Hz) % Damp Freq. (Hz) % Damp
HSI_121_BC_b1 5.89 5.25 17.0 5.63
HSI_121_BC_b2 5.82 4.42 17.0 5.12
HSI_121_BC_b3 5.83 4.37 17.0 5.68
Average 5.85 4.68 17.0 5.48
Standard Deviation 0.031 0.404 0.000 0.253
5.41 Hz configuration, 0.437 Mass ratio, Standing with straight knees
Mode 1 Mode 2
File Name Freq. (Hz) % Damp Freq. (Hz) % Damp
HSI_121_BC_s1 4.49 7.90 17.6 7.79
HSI_121_BC_s2 4.50 8.21 17.5 8.01
HSI_121_BC_s3 4.55 7.07 17.6 8.57
Average 4.51 7.73 17.6 8.12
Standard Deviation 0.026 0.481 0.047 0.328
5.41 Hz configuration, 0.437 Mass ratio, Standing with bent knees
Mode 1 Mode 2
File Name Freq. (Hz) % Damp Freq. (Hz) % Damp
HSI_121_BC_b1 5.84 7.14 17.1 5.37
HSI_121_BC_b2 5.73 6.68 17.1 4.99
HSI_121_BC_b3 5.82 5.62 17.1 5.32
Average 5.80 6.48 17.1 5.23
Standard Deviation 0.048 0.636 0.000 0.169

76
6.27 Hz configuration, 0.167 Mass ratio, Standing with straight knees
Mode 1 Mode 2
File Name Freq. (Hz) % Damp Freq. (Hz) % Damp
HSI_123_2_ppl_C_s1 5.66 12.8 6.20 5.53
HSI_123_2_ppl_C_s2 5.59 7.63 6.03 9.86
HSI_123_2_ppl_C_s3 5.41 9.87 6.46 6.61
Average 5.55 10.1 6.23 7.33
Standard Deviation 0.105 2.12 0.177 1.84
6.27 Hz configuration, 0.167 Mass ratio, Standing with bent knees
Mode 1 Mode 2
File Name Freq. (Hz) % Damp Freq. (Hz) % Damp
HSI_123_2_ppl_C_b1 6.46 3.76 19.5 4.33
HSI_123_2_ppl_C_b2 6.45 3.62 19.6 3.80
HSI_123_2_ppl_C_b3 6.45 3.26 19.5 3.94
Average 6.45 3.55 19.5 4.02
Standard Deviation 0.005 0.211 0.047 0.224
6.27 Hz configuration, 0.281 Mass ratio, Standing with straight knees
Mode 1 Mode 2
File Name Freq. (Hz) % Damp Freq. (Hz) % Damp
HSI_10-26-11_123C1 5.01 12.1 7.49 4.92
HSI_10-26-11_123C2 5.10 10.8 7.36 6.86
HSI_10-26-11_123C3 5.09 11.2 7.29 7.70
Average 5.07 11.4 7.38 6.49
Standard Deviation 0.040 0.544 0.083 1.16
6.27 Hz configuration, 0.281 Mass ratio, Standing with bent knees
Mode 1 Mode 2
File Name Freq. (Hz) % Damp Freq. (Hz) % Damp
HSI_123_3_ppl_C_b1 6.75 6.80 19.7 5.33
HSI_123_3_ppl_C_b2 6.59 5.60 19.4 5.52
HSI_123_3_ppl_C_b3 6.53 4.07 19.3 5.45
Average 6.62 5.49 19.5 5.43
Standard Deviation 0.093 1.12 0.170 0.078

77
6.27 Hz configuration, 0.362 Mass ratio, Standing with straight knees
Mode 1 Mode 2
File Name Freq. (Hz) % Damp Freq. (Hz) % Damp
HSI_123_BC_s1 4.89 12.3 7.86 12.2
HSI_123_BC_s2 4.97 10.8 7.63 14.7
HSI_123_BC_s3 5.01 14.0 7.56 11.5
Average 4.96 12.4 7.68 12.8
Standard Deviation 0.050 1.31 0.128 1.37
6.27 Hz configuration, 0.362 Mass ratio, Standing with bent knees
Mode 1 Mode 2
File Name Freq. (Hz) % Damp Freq. (Hz) % Damp
HSI_123_BC_b1 6.48 2.34 19.3 4.17
HSI_123_BC_b2 6.48 2.00 19.2 4.72
HSI_123_BC_b3 6.40 0.362 19.2 4.28
Average 6.45 1.57 19.2 4.39
Standard Deviation 0.038 0.864 0.047 0.238
6.27 Hz configuration, 0.437 Mass ratio, Standing with straight knees
Mode 1 Mode 2
File Name Freq. (Hz) % Damp Freq. (Hz) % Damp
HSI_123_BC_s1 4.96 10.1 7.29 11.2
HSI_123_BC_s2 5.10 13.8 7.50 6.94
HSI_123_BC_s3 4.98 10.7 7.47 12.6
Average 5.01 11.5 7.42 10.2
Standard Deviation 0.062 1.62 0.093 2.41
6.27 Hz configuration, 0.437 Mass ratio, Standing with bent knees
Mode 1 Mode 2
File Name Freq. (Hz) % Damp Freq. (Hz) % Damp
HSI_123_BC_b1 6.57 5.14 19.6 5.08
HSI_123_BC_b2 6.53 4.02 19.5 4.47
HSI_123_BC_b3 6.55 5.52 19.5 4.46
Average 6.55 4.89 19.5 4.67
Standard Deviation 0.016 0.637 0.047 0.290

78
6.27 Hz configuration, 0.564 Mass ratio, Standing with straight knees
Mode 1 Mode 2
File Name Freq. (Hz) % Damp Freq. (Hz) % Damp
HSI_123_s1 4.92 11.1 7.03 4.19
HSI_123_s2 4.92 9.93 7.20 7.99
HSI_123_s3 4.91 1.35 7.35 9.00
Average 4.92 7.46 7.19 7.06
Standard Deviation 0.005 4.35 0.131 2.07
6.27 Hz configuration, 0.564 Mass ratio, Standing with bent knees
Mode 1 Mode 2
File Name Freq. (Hz) % Damp Freq. (Hz) % Damp
HSI_123_b1 6.63 4.25 20.0 5.26
HSI_123_b2 6.64 4.24 19.9 5.53
HSI_123_b3 6.64 4.52 19.9 5.39
Average 6.64 4.34 19.9 5.39
Standard Deviation 0.005 0.130 0.047 0.110
7.30 Hz configuration, 0.362 Mass ratio, Standing with straight knees
Mode 1 Mode 2
File Name Freq. (Hz) % Damp Freq. (Hz) % Damp
HSI_110_123_BC_s1 7.94 17.2 21.2 5.07
HSI_110_123_BC_s2 7.86 14.1 21.2 5.49
HSI_110_123_BC_s3 8.13 18.2 21.2 5.64
Average 7.98 16.5 21.2 5.40
Standard Deviation 0.113 1.75 0.000 0.241
7.30 Hz configuration, 0.362 Mass ratio, Standing with bent knees
Mode 1 Mode 2
File Name Freq. (Hz) % Damp Freq. (Hz) % Damp
HSI_110_123_BC_b1 7.42 1.54 20.6 4.18
HSI_110_123_BC_b2 7.44 1.43 20.7 3.67
HSI_110_123_BC_b3 7.41 1.35 20.6 3.99
Average 7.42 1.44 20.6 3.95
Standard Deviation 0.012 0.078 0.047 0.210

79
7.30 Hz configuration, 0.437 Mass ratio, Standing with straight knees
Mode 1 Mode 2
File Name Freq. (Hz) % Damp Freq. (Hz) % Damp
HSI_110_123_BC_s1 7.67 17.8 21.5 5.13
HSI_110_123_BC_s2 7.78 19.1 21.5 4.62
HSI_110_123_BC_s3 7.82 18.0 21.5 4.90
Average 7.76 18.3 21.5 4.88
Standard Deviation 0.063 0.572 0.000 0.21
7.30 Hz configuration, 0.437 Mass ratio, Standing with bent knees
Mode 1 Mode 2
File Name Freq. (Hz) % Damp Freq. (Hz) % Damp
HSI_110_123_BC_b1 7.53 5.14 21.3 4.82
HSI_110_123_BC_b2 7.55 3.78 21.2 3.97
HSI_110_123_BC_b3 7.53 3.10 21.2 4.34
Average 7.54 4.01 21.2 4.38
Standard Deviation 0.009 0.848 0.047 0.348
8.05 Hz configuration, 0.564 Mass ratio, Standing with straight knees
Mode 1 Mode 2
File Name Freq. (Hz) % Damp Freq. (Hz) % Damp
HSI_116_123_s1 8.24 12.2 22.6 5.34
HSI_116_123_s2 8.33 12.7 22.5 4.89
HSI_116_123_s3 8.26 13.2 22.6 4.56
Average 8.28 12.7 22.6 4.93
Standard Deviation 0.039 0.408 0.047 0.320
8.05 Hz configuration, 0.564 Mass ratio, Standing with bent knees
Mode 1 Mode 2
File Name Freq. (Hz) % Damp Freq. (Hz) % Damp
HSI_116_123_b1 7.99 2.59 22.3 3.69
HSI_116_123_b2 8.09 3.83 22.3 3.75
HSI_116_123_b3 8.03 2.82 22.1 3.62
Average 8.04 3.08 22.2 3.69
Standard Deviation 0.041 0.539 0.094 0.053

80
REFERENCES
American Institute of Steel Construction, “Steel Construction Manual,” 13th
edition, April
2007
American Society of Civil Engineers, “Minimum Design Loads for Buildings and Other
Structures,” ASCE/SEI 7-10, 2010.
APS Dynamics - Systems for Generating Controlled Vibration (APS). Web. 30 Apr. 2012.
<http://www.apsdynamics.com/>.
Avitabile, Peter. “Basics of Modal Analysis for the New/young Engineer.” Presented at
IMAC-XXVIII, Jacksonville, FL, 2010.
Brownjohn, J.M.W. “Energy Dissipation in One-way Slabs with Human Participation”.
Proc. of Asia-Pacific Vibration Conference 1999, Nanyang Technological
University, Singapore. Vol. 1. 1999. Print.
Comer A., Blakeborough A., Williams M.S. (2010) “Grandstand Simulator for Dynamic
Human-Structure Interaction Experiments.” Experimental Mechanics, 50(6),
pp825-834.
Computers and Structures, Inc. (2005), SAP2000 Manual: Linear and Nonlinear Static
and Dynamic Analysis and Design of Three-dimensional Structures.
Dougill, J.W. “Recommendations for Design of Grandstands Subject to Dynamic Crowd
Excitation.” Proc. of 6th European Conf. on Structural Dynamics (EURODYN
2005). Munich, Germany: European Association for Structural Dynamics
(EASD), 2005. 491-96. Print.
Dougill, JW., Wright, J.R., Parkhouse, J.G. and Harrison, R.E. “Human Structure
Interaction During Rhythmic Bobbing”, The Structural Engineer, 84(22), 21 Nov
2006, pp32-39.
Ellis, B.R. and Ji, T., “Floor Vibration Induced by Dance-Type Loads: Verification,” The
Structural Engineer, 72(3), 1994, pp45-50.
Ellis, B.R.; Ji, T., “Human-structure interaction in vertical vibrations,” Proceedings of the
Institution of Civil Engineers, Structures and Buildings, v 122, n 1, Feb, 1997,
pp1-9.
Falati, S. "The Contribution of Non-structural Components to the Overall Dynamic
Behavior of Concrete Floor Slabs." Thesis. University of Oxford, 1999. Print.

81
Firman, Robert J. III "Investigating the Effects of Various Crowd Characteristics on the
Dynamic Properties of an Occupied Structure" Thesis. Bucknell University, 2010.
Print.
Griffin, M.J,”Handbook of human vibration. London”, UK: Academic Press. 1990.
Institution of Structural Engineers, “Dynamic Performance Requirements for Permanent
Grandstands Subject to Crowd Action,” IStructE/DTLR/DCMS Working Group
on Dynamic Performance and Design of Stadia Structures and Seating Decks,
December 2008.
IOtech eZ-Series - Analysis Software for IOtech Devices - National Instruments. Web. 13
Sept. 2011. < http://sine.ni.com/nips/cds/view/p/lang/en/nid/208342>.
Lenzen, K.H. "Vibration of Steel Joist-concrete Slab Floors." American Institute of Steel
Construction (AISC) Engineering Journal 6th ser. 3.133, 1966. Print.
Murray, T.M., D.E. Allen, and E.E. Ungar. „Floor Vibrations Due to Human Activity.”
American Institute of Steel Construction (AISC), 1997. Print. Steel Design Guide
Series, No.11.
PCB Piezotronics, Inc.- Sensors That Measure Up! (PCB) Web. 30 Apr. 2012.
<http://www.pcb.com/>.
Sachse, R., Pavic, A. and Reynolds, P. (2003), “Human-Structure Dynamic Interaction in
Civil Engineering Dynamics : A Literature Review,” The Shock and Vibration
Digest, 35 January 2003, pp3-18.
The Institution of Structural Engineers (IStructE). “Dynamic Performance Requirements
for Permanent Grandstands Subject to Crowd Action: Interim Guidance on
Assessment and Design.” Institution of Structural Engineers, 2001. Print.
Vibrant Technology, Inc. - Modal Analysis, ODS, Acoustic, and Finite Element Analysis
Software (ME’scope). Web. 13 Sept. 2011.
<http://www.vibetech.com/go.cfm/enus/content/index >