investigation of groundwater geochemistry and …2012/04/12 · u.s. department of the interior...
TRANSCRIPT

U.S. Department of the InteriorU.S. Geological Survey
Investigation ofGroundwater Geochemistryand Water Quality in theFayetteville Shale Play
Timothy M. Kresse USGS Arkansas Water Science Center

Acknowledgements
Van Buren County Study
Arkansas Water Resources Center
U.S. Geological Survey
Shirley Community Development Center
Faulkner County Study
Faulkner County
Duke University – All Laboratory Analyses

Outline of Discussion
Background
Project activities
Discussion of water-quality data
Comparison of source and historical QW data
Geochemical evolution of groundwater
Reduction/oxidation processes
Summary of results

Likely Avenues for GW Contamination
1. Surface Sources:
Leaking ponds
Pipe leaks
Spills
2. Subsurface Sources:
Casing failure
Migration along abandoned wells
Migration during FRACKING along faults/fractures

Problems in Identifying Impacts
Lack of pre-development QW data
Local domestic wells completed in shaleformations
Shale naturally contain elevated salts,iron, sulfides, and methane
Anecdotal evidence can be unreliable
Results of mixing similar water
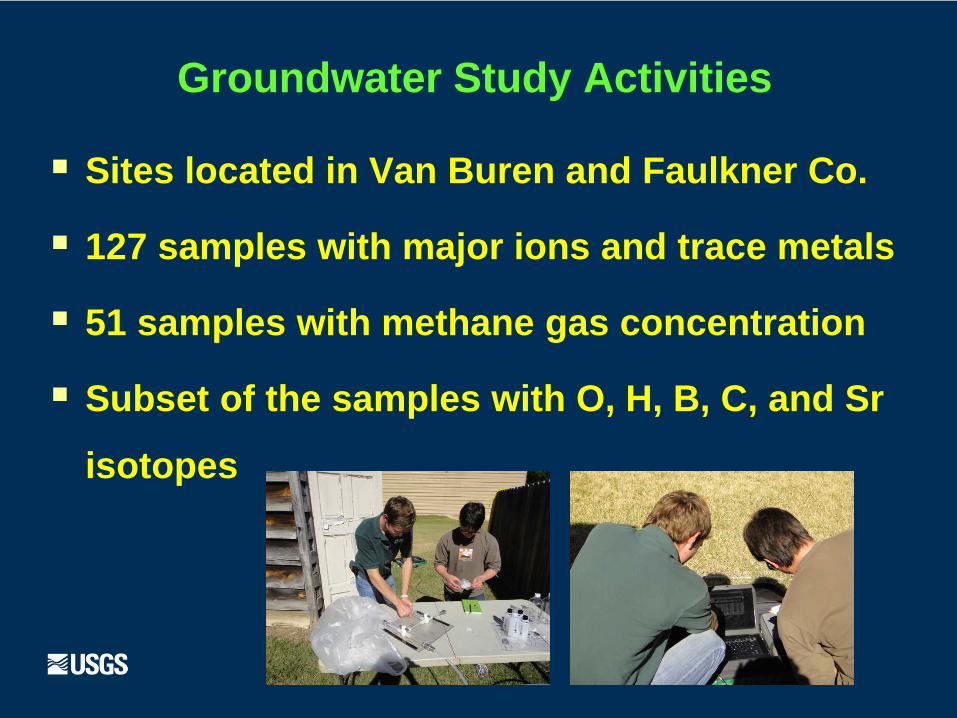
Groundwater Study Activities
Sites located in Van Buren and Faulkner Co.
127 samples with major ions and trace metals
51 samples with methane gas concentration
Subset of the samples with O, H, B, C, and Sr
isotopes

Location of Study Area

Groundwater Sampling Locations
WHITECONWAY
VAN BUREN
FAULKNER
CLEBURNE
POPE
STONE
PERRY
INDEPENDENCE
PRAIRIE
SEARCY
LONOKE
PULASKI
PULASKI
JACKSON
NEWTON
YELL
WOODRUFF
!(
!(!(!(
!(
!(
!(
!(!(!(
!(!(!(!(
!(!(
!(
!(
!(
!(
!(!(!(
!(
!(!(!(
!(!(!( !(
!(!(
!(
!(
!(!(
!(
!(!(
!( !(
WHITECONWAY
VAN BUREN
FAULKNER
CLEBURNE
POPE
STONE
PERRY
INDEPENDENCE
PRAIRIE
SEARCY
LONOKE
PULASKI
PULASKI
JACKSON
NEWTON
YELL
WOODRUFF
!(
!(!(!(
!(
!(
!(
!(!(!(
!(!(!(!(
!(!(
!(
!(
!(
!(
!(!(!(
!(
!(!(!(
!(!(!( !(
!(!(
!(
!(
!(!(
!(
!(!(
!( !(
!(
!(
!(
!(!( !(!(!(!(
!(!(!(!(!(
!(
!(!(
!(!(
!(!(!(!(!(
!(
!(
!(
!(
!(!(!(
!(
!(
!(
!(!(
!(!(
!(
!(
!(
!(
!(!(
!(
!(
!(
!(
!(
!(!(
!(!(
!(
!(!(!(!( !( !(
!(
!(
!(!( !( !(
!( !(!(
!(
!(
WHITECONWAY
VAN BUREN
FAULKNER
CLEBURNE
POPE
STONE
PERRY
INDEPENDENCE
PRAIRIE
SEARCY
LONOKE
PULASKI
PULASKI
JACKSON
NEWTON
YELL
WOODRUFF
!(
!(!(!(
!(
!(
!(
!(!(!(
!(!(!(!(
!(!(
!(
!(
!(
!(
!(!(!(
!(
!(!(!(
!(!(!( !(
!(!(
!(
!(
!(!(
!(
!(!(
!( !(
!(
!(
!(
!(!( !(!(!(!(
!(!( !(!(!(
!(
!(!(
!(!(
!(!(!(!(!(
!(
!(
!(
!(
!(!(!(
!(
!(
!(
!(!(
!(!(
!(
!(
!(
!(
!(!(
!(
!(
!(
!(
!(
!(!(
!(!(
!(
!(!(!(!( !(!(
!(
!(
!(!( !( !(
!( !(!(
!(
!(
!(
!(
!(
!(
!(
!(
!( !(
!(
!(
!(
!(
!(
!(
!(
!(
!(
!(
!(
!(
!(
!(
!(
!(
!(!(!(
!(
!(
!(
!(
!(!(
!(!(
!(
!(
!(!(!(
!(!(
!(!(
!(
!(
!(
!(
!(
!(
!(
!(
!(
!(
!(
!(!( !(
!(
!(
!(
WHITECONWAY
VAN BUREN
FAULKNER
CLEBURNE
POPE
STONE
PERRY
INDEPENDENCE
PRAIRIE
SEARCY
LONOKE
PULASKI
PULASKI
JACKSON
NEWTON
YELL
WOODRUFF
Legend
!( Van Buren well sites
!( Faulkner County well sites
!( historic_wells
gas_well_sites_2

Process Pond (flowback) Analysis
Analyte Concentration
pH
Temperature (deg Celsius)
Specific Conductance (μS/cm)
Total Dissolved Solids
Calcium (mg/L) 13
Magnesium (mg/L) 9
Sodium (mg/L) 1840
Potassium (mg/L) <10
Bicarbonate (mg/L) 6
Sulfate (mg/L) 42
Chloride (mg/L) 2180
Iron, dissolved (μg/L)

Historical QW Statistics (44 wells)
Analyte Min Max Median
pH 5.9 8.2 6.8
Temperature (deg Celsius) 11 22 18
Specific Conductance (μS/cm) 32 1840 378
Total Dissolved Solids 29 1210 170
Calcium (mg/L) 7.9 107 23
Magnesium (mg/L) 0.3 211 9.1
Sodium (mg/L) 2.0 145 24
Potassium (mg/L) 0.4 11 1.6
Bicarbonate (mg/L) 6 980 125
Sulfate (mg/L) 0.8 255 10
Chloride (mg/L) 1.6 378 20
Iron, dissolved (μg/L) 0 6,300 5

Groundwater Data Statistics (127 wells)
Analyte Min Max Median
pH 3.7 8.6 6.5
Temperature (deg Celsius) 14.8 26.2 17.0
Specific Conductance (μS/cm) 7.1 909 244
Total Dissolved Solids 6.7 687 211
Calcium (mg/L) 0.1 87.8 16.6
Magnesium (mg/L) 0.2 45.7 4.2
Sodium (mg/L) 0.6 159 9.1
Potassium (mg/L) NA NA NA
Bicarbonate (mg/L) 1.0 430 125
Sulfate (mg/L) 0.1 151 4.3
Chloride (mg/L) 0.9 70.1 3.7
Iron, dissolved (μg/L) <50 5,680 190

Geochemical Evolution of Groundwater
Infiltration of low TDS precipitation
Chemical reactions along flow path
dissolution
cation exchange
Reduction/oxidation reactions

Geochemical Evolution of Groundwater
Infiltration of low TDS precipitation
Chemical reactions along flow path
dissolution
cation exchange
Reduction/oxidation reactions

Geochemical Evolution Along Flow Path
Oxygenated Reduced

Total Dissolved Solids and pH
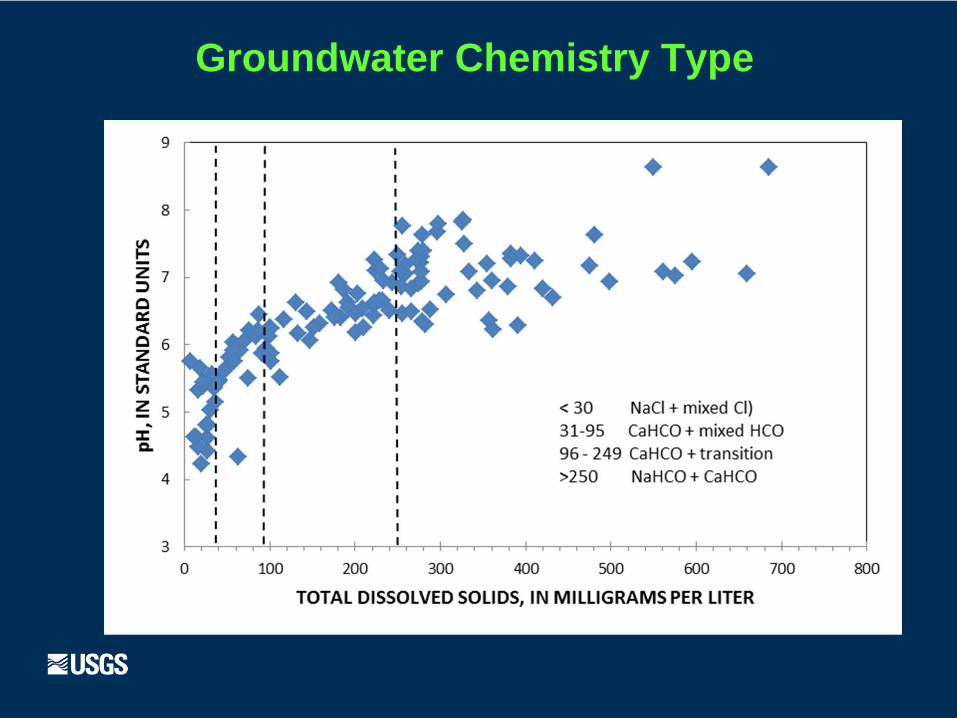
Groundwater Chemistry Type
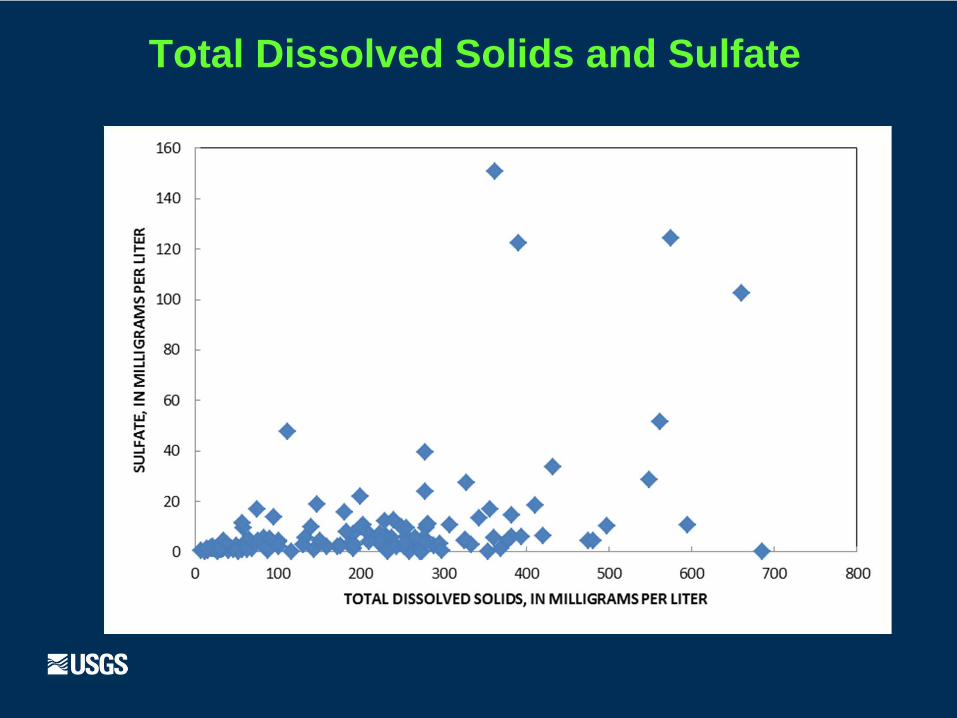
Total Dissolved Solids and Sulfate

Total Dissolved Solids and Chloride

Total Dissolved Solids and Bicarbonate

Total Dissolved Solids and Sodium

Total Dissolved Solids and Calcium

Total Dissolved Solids and Magnesium

Sodium/Chloride and Ca+Mg/Bicarbonate
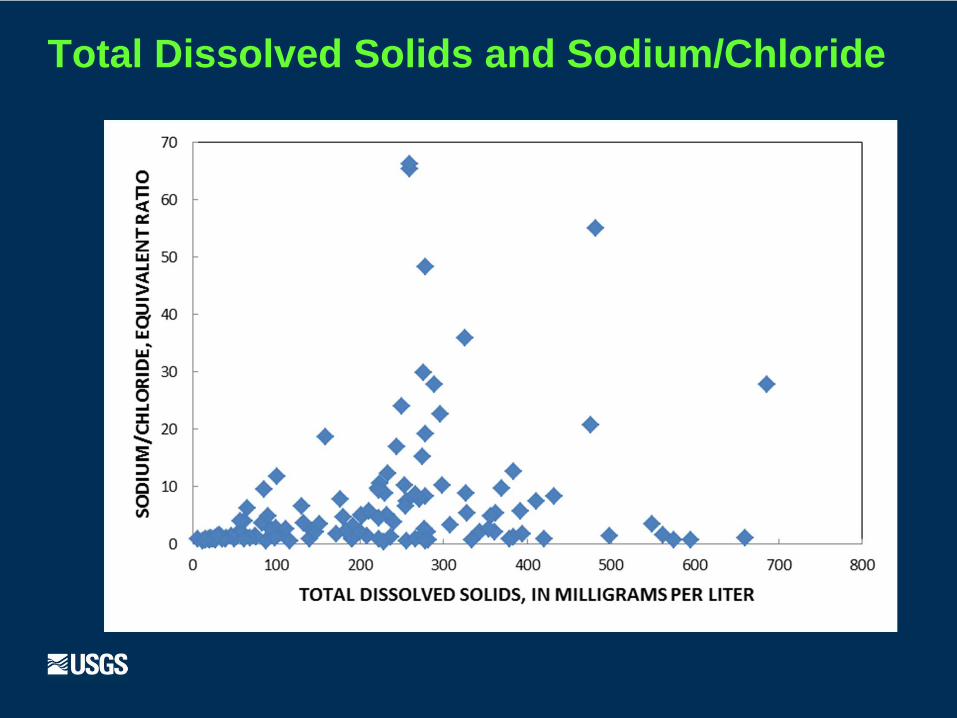
Total Dissolved Solids and Sodium/Chloride

Geochemical Evolution of Groundwater
Cradle – precipitation followed by dissolutionof minerals through rock/water interaction
Chemical reactions along flow path – cationexchange, precipitation with supersaturation,further dissolution of rock/minerals, effects ofchanges in pH
Microbially driven reactions – redox zonationwith availability of organic matter andelectron acceptors

Nitrate and Manganese

Nitrate and Iron

Total Dissolved Solids and Iron

Total Dissolved Solids and Iron
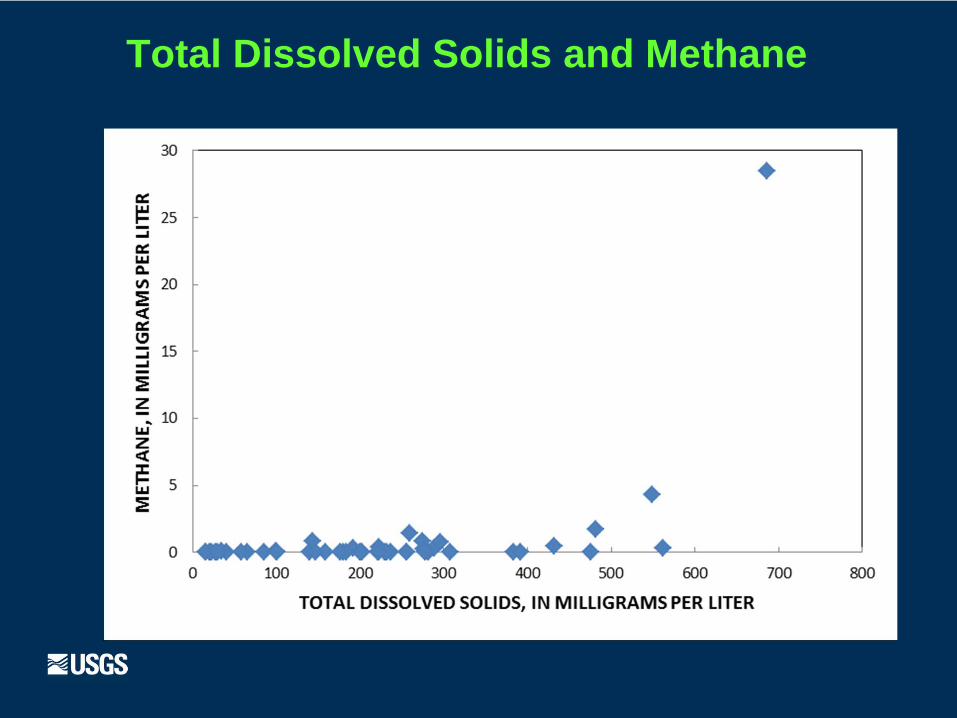
Total Dissolved Solids and Methane
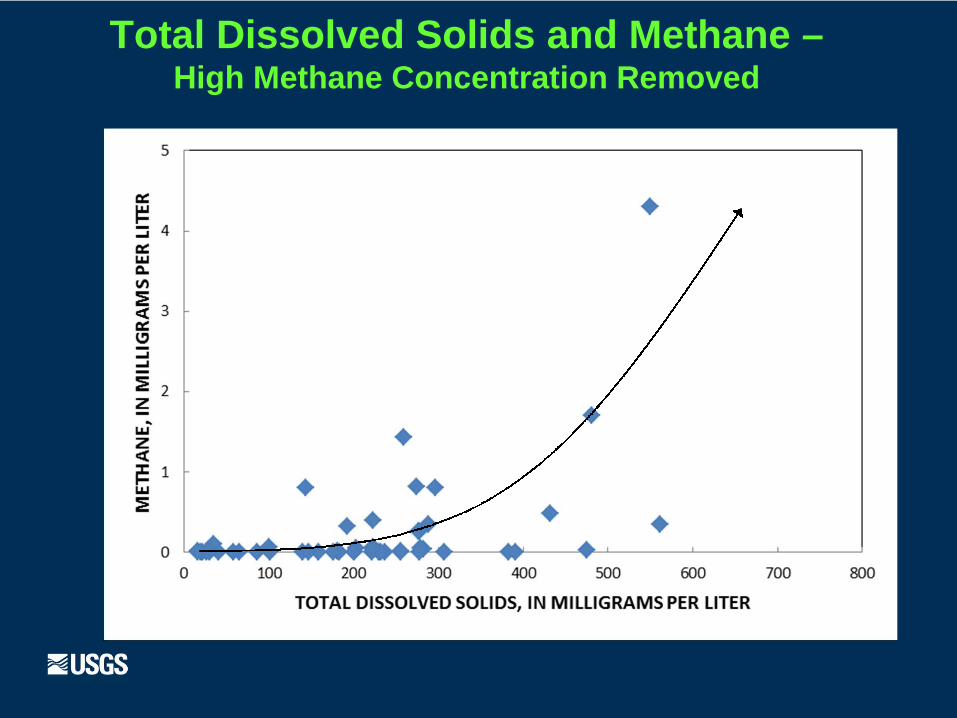
Total Dissolved Solids and Methane –High Methane Concentration Removed
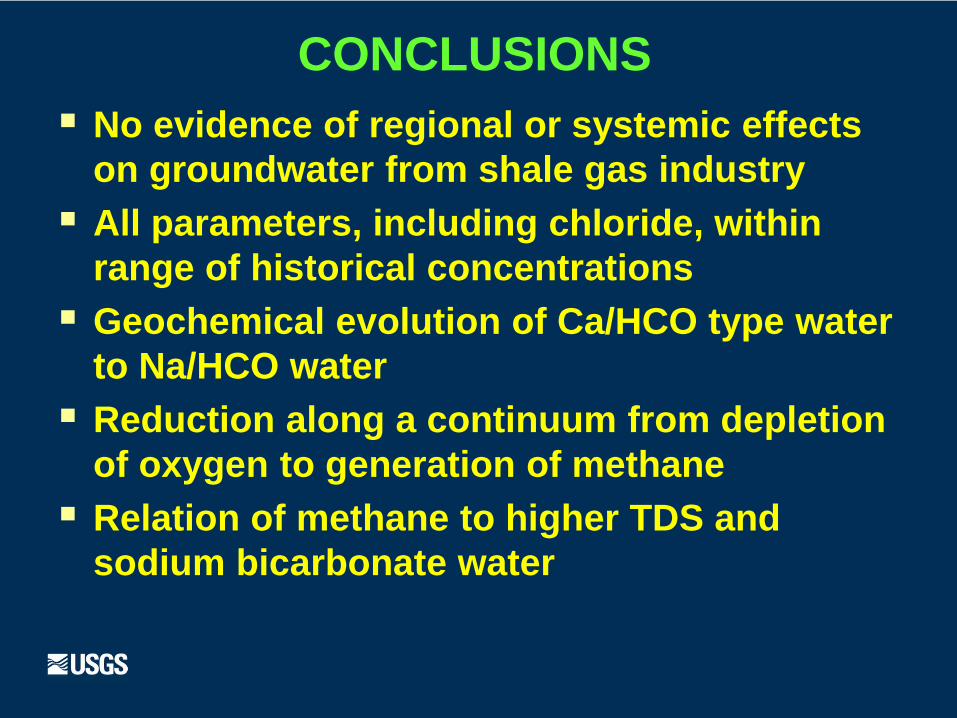
CONCLUSIONS
No evidence of regional or systemic effectson groundwater from shale gas industry
All parameters, including chloride, withinrange of historical concentrations
Geochemical evolution of Ca/HCO type waterto Na/HCO water
Reduction along a continuum from depletionof oxygen to generation of methane
Relation of methane to higher TDS andsodium bicarbonate water