investigation of fatigue life characteristics of
TRANSCRIPT

1
Investigation of fatigue life characteristics of micropatterned
freestanding NiTi thin films
Dissertation
zur Erlangung des akademischen Grades
Doktor der Ingenieurwissenschaften
(Dr.-Ing.)
der Technischen Fakultät
der Christian-Albrechts-Universität zu Kiel
Ahmed Adel Taha Zayed
Kiel
July 2013

2
1. Gutachter Prof. Dr. Eckhard Quandt
2. Gutachter Prof. Dr. Franz Faupel
3. Gutachter Prof. Dr. Selhuber-Unkel
Datum der mündlichen Prüfung 23.08.2013

3
Abstract
NiTi shape memory alloys present themselves as high potential candidate in several
applications. This fact arises from their superior attributes such as large stress output,
recoverable strain and outstanding biocompatibility. Fatigue life prediction of bulk shape
memory alloys have been extensively investigated in the literature. Yet so far,
information about the fatigue life prediction on NiTi thin films is rarely discussed or
missing which might limit the window of future applications. In this thesis, NiTi
freestanding films with nearly equiatomic composition were fabricated by means of
magnetron sputtering, UV lithography, and wet etching. The films were subsequently
annealed in vacuum. The fatigue properties of the films were characterized by a self-
developed fatigue testing device under tension-tension loading mode. Fatigue life
diagrams were conducted and investigated at various testing variables such as different
cyclic frequencies and different mean strains. In addition, the influences of the chemical
composition, the film thickness, and the annealing conditions on the fatigue
characteristics were investigated. The fatigue endurance limit (FEL) in this work was
taken at 10 million cycles. A significantly improved FEL of more than 350 % was
attained by using different surface finishing. The FEL in this work is the highest among
all published literature data on NiTi films. Moreover, the biocompatibilities of NiTi films
were examined by investigating the cell growth on films’ surface after different surface
finishing. The result showed insignificant dependence of cell growth and adhesion on the
film surface. The freestanding films showed a great biocompatibility levels. In addition,
the measurements of the Ni ion release on NiTi films modified with the different surface
finishing were performed in a balanced salt solution used to mimic human body fluids.
The results show that the Ni concentration in the tested solution is below the maximum
limit of the international biocombatibitly standards and that the Ni ion release can be
modified through different surface finishings. Finally, the factors governing the fatigue
characteristics and the biocompatibility aspects of NiTi films were identified and
optimized to enhance the overall performance of the NiTi films and increase the design
and the integration possibilities in different applications.

4
Contents
Contents .............................................................................................................................. 4
Chapter 1 ............................................................................................................................. 6
Introduction ..................................................................................................................... 6
Chapter 2 ............................................................................................................................. 8
Fundamentals .................................................................................................................. 8
2.1 General characteristics of shape memory alloys ................................................... 8
2.1.2 Stress induced martensitic transformation and superelaticity ...................... 10
2.1.3 NiTi SMAs ................................................................................................... 11
2.2 Fracture mechanisms in metals ........................................................................... 16
2.3 Fatigue................................................................................................................. 17
2.3.1 Microstructural aspects of fatigue ................................................................ 20
2.3.2 Factors affecting fatigue resistance .............................................................. 23
2.3.3 Fatigue in thin metal films ........................................................................... 27
2.3.4 Fatigue of SMAs vs. conventional metals ................................................... 28
2.3.5 State-of-art on NiTi fatigue .......................................................................... 31
2.4 Biocompatibility of NiTi..................................................................................... 34
2.5 Fabrication of NiTi thin films ............................................................................. 35
2.5.1 Magnetron sputtering ................................................................................... 35
2.5.2 UV lithography ............................................................................................ 37
2.5.3 Wet etching .................................................................................................. 39
2.5.4 Fabrication of freestanding films ................................................................. 40
Chapter 3 ........................................................................................................................... 41
Experimental techniques ............................................................................................... 41
3.1 Standard characterization techniques .................................................................. 41
3.1.1 Differential Scanning Calorimetry - DSC.................................................... 41
3.1.2 Scanning Electron Microscopy (SEM) and Energy Dispersive X-ray
Spectroscopy (EDX) ............................................................................................. 42
3.1.3 X-ray Diffraction (XRD) ............................................................................. 42
3.1.4 Transmission Electron Microscopy (TEM) ................................................. 43
3.1.5 Atomic Force Microscopy (AFM) ............................................................... 43
3.1.6 Tensile test ................................................................................................... 44
3.1.7 Fatigue test ................................................................................................... 44
3.1.8 Electropolishing ........................................................................................... 46
3.1.9 Biocompatibility test .................................................................................... 48
3.1.10 Ni ion release test ....................................................................................... 48
3.1.11 Polarization microscope ............................................................................. 49
3.2 Thin film fabrication techniques ......................................................................... 49
3.2.1 Magnetron sputtering ................................................................................... 49
3.2.2 UV lithography ............................................................................................ 50
3.3.2 Rapid Thermal Annealing (RTA) ................................................................ 50
Chapter 4 ........................................................................................................................... 51

5
Results and discussion .................................................................................................. 51
4.1 Film characterization .......................................................................................... 51
4.1.1 Ex-situ crystallization .................................................................................. 52
4.1.2 Ni4Ti3 precipitations..................................................................................... 57
4.2 Fatigue investigations ......................................................................................... 61
4.2.1 Fatigue characterization of freestanding films ............................................. 66
4.2.2 Fatigue characteristics vs. surface finishing ................................................ 71
4.3 Biocompatibility ................................................................................................. 83
4.3.1 Cell growth and proliferation ....................................................................... 83
4.3.2 Ni ion release ............................................................................................... 86
Chapter 5 ........................................................................................................................... 88
Summary ....................................................................................................................... 88
Chapter 6 ........................................................................................................................... 90
Literature ....................................................................................................................... 90
Chapter 7 ......................................................................................................................... 101
Publications ................................................................................................................. 101
Poster........................................................................................................................... 101
Chapter 8 ......................................................................................................................... 102
List of symbols ............................................................................................................ 102
Acknowledgment ............................................................................................................ 104
Eidesstattliche Erklärung ................................................................................................ 106
Appendix ......................................................................................................................... 107

6
Chapter 1
Introduction Shape memory alloys (SMAs) are an attractive class of inorganic functional materials
that have a huge possibility to be integrated in different fields. They are considered as
smart materials given that they are used in both sensor and actuator applications
[Otsu98]. The earliest trails to discover shape memory alloys took place by Ölander who
discovered superelasticity in Au-Cd alloys, as reported by Hornbogen et al. [Horn56].
Shortly after, Greninger and Mooradian noticed the alternating appearance of a
martensitic phase in a Cu-Zn alloy by changing the applied temperature, as reported in
[Borj08]. In 1962, Buehler and Wang discovered the shape memory effect in an
equiatomic NiTi alloy, as indicated in [Otsu98]. NiTi SMAs are unique compared to
other metallic alloys due to two main phenomenas known as the shape memory effect
(SME) and the superelasticity (SE) [Otsu98, Otsu05]. The basis for these phenomena is
the switching between two different crystallographic phases, namely the high temperature
phase known as austenite, and the low temperature phase known as martensite [Otsu05].
An alloy with a shape memory effect is able to retain its original shape after being
deformed at low temperatures. This occurs by heating the alloy to a distinct temperature
at which the reverse transformation occurs [Otsu98, Miya09]. A superelastic behaviour of
a shape memory alloy is caused by the transformation of an austenitic phase to a
martensitic phase by inducing stress on the alloy, above a certain temperature known as
the austenitic finish temperature. The martensite returns again to the undeformed
austenitic phase once the applied stress is removed. As a result, shape memory alloys are
considered as stimuli-responsive materials that can be triggered by applying an external
stimulus, such as temperature or stress.
Conventionally NiTi SMAs have become increasingly important due to their superior
properties such as large stress output, recoverable strain and high biocompatibility
[Otsu98]. Even though several commercial applications have been innovated from the
shape memory effect, e.g. actuators and springs, superelastic NiTi devices are functional
in particular in the field of medical engineering due to their great biocompatibility and
corrosion resistance [Esen06, Colu00]. One of the predominant medical applications of
superelastic NiTi alloys are endovascular implants, e.g. stents [Duer99]. According to
recent health organization statistics, 16.7 million people around the world die from
arterial diseases every year which corresponds to 1/3 of all deaths worldwide [Ahas04]. A
stent is usually used to treat a stenosis disease, where a blockage in the arteries near the
heart prevents normal blood flow to the heart. The importance of superelastic NiTi in
medical applications and the restriction concerning the miniaturization of these medical
devices have inspired the innovation of NiTi thin films devices which have several
advantages over their bulk counterparts. In Figure 1 a thin film stent produced by
magnetron sputtering is shown. Stents manufactured by thin film technologies have a
high structural resolution which overcomes the typical commercial stent limitations such
as reduced mechanical properties and miniaturization.

Chapter 1
7
Figure 1: NiTi thin film stent produced by magnetron sputtering after [Mira09].
Unlike conventional NiTi bulk materials, NiTi films produced in this thesis were
deposited by means of magnetron sputtering and annealed under vacuum conditions. The
SEM and TEM investigations show no carbide inclusions or impurities in the samples
which leads to a significant improvement on the mechanical properties. For example, the
tensile strength observed in NiTi film with titanium carbide inclusions is lower when
compared to NiTi component free from carbide inclusions. The high stress levels
observed near the carbide inclusions increase the possibility of components failure. In
addition, the life time prediction of NiTi component subjected to cyclic mechanical
loading is significant for the development and the design of NiTi thin film based devices.
Fatigue failure will result after a certain number of working cycles. Therefore, a more
detailed study is needed to understand the fatigue characteristics in superelastic NiTi thin
films. As well, the fatigue endurance limit (FEL), safety limit used to predict the fatigue
failure in components, will be addressed in detail. In agreement with the current
developments and keeping-up with market demands for products based on thin film
technology, this thesis had two major aims. The first part aims to present a study that
comprehends and investigate the fatigue characteristics of NiTi thin films. This work
includes the design of a fatigue test machine, the production of micropatterned
freestanding NiTi thin films by magnetron sputtering, and the attainment of a fatigue life
diagram for the sputtered films in dependence on different test variables. Finally the
optimization of the fatigue endurance limits was investigated by means of different
surface finishings. In the second part of this thesis, the surface characteristics and the
biocompatibility of NiTi thin films, i.e. cell growth/adhesion investigations, are
performed. This includes the measurements of the number of growing cells and the Ni
ion release on different films modified with various surface treatments/finishes.
600 µm

8
Chapter 2
Fundamentals
2.1 General characteristics of shape memory alloys Shape memory alloys show an unexpected response when subjected to mechanical
load and/or temperature variation. Such behaviour occurs due to shape changes being
generated by the martensitic phase transformations (MT) instead of the typical elastic or
plastic deformation. The MT is a diffusionless first order phase transformation in the
solid state [Otsu98] from a cubic high temperature phase known as the austenitic phase to
a less symmetric low temperature phase known as the martensitic phase. During the MT,
the metal atoms move cooperatively in the matrix under shear stresses. As a result a new
phase is formed by the nucleation and growth from the older phase [Agre06]. The
different orientations of grains caused by shear stresses are known as the correspondence
variants of the martensite [Wech53]. The MT occurs by introducing a lattice invariant
shear by means of slip or twins. Figure 2 (a) shows a schematic drawing of the MT
showing a martensitic phase formed by twining and another martensitic phase formed by
means of slip mechanisms. The switching between the phases depends on the applied
temperature and the induced load. For example, at a higher temperature the austenitic
phase is stable but upon cooling it transforms back to the original martensitic phase
without external load. The thermally induced martensitic transformation encloses four
temperatures linked to the diffusionless transformation from austenitic phase to the
martensitic phase. Figure 2 (b) shows a schematic drawing of the thermally induced
martensitic transformation hysteresis, the area within the hysteresis loop is the energy per
unit volume dissipated during the cycle.
Austenitic phase
Twinned
SlipMartensite
AfMs
AsMf0
100
Au
ste
nit
e v
olu
me
(%
)
Temperature (°C)
(a) (b)
Figure 2: (a) Schematic diagram of martensitic transformations by means of twining and slip after [Otsu98,
Miya09]. (b) A schematic drawing showing a thermally induced martensitic transformation hysteresis loop
with the crossponding transformation temperature.
The transformation temperatures in the Figure 2 (b) are as follows:
The martensite start temperature (Ms): the temperature where the austenitic phase
starts to transform into the martensitic phase upon cooling.

Chapter 2
9
The martensite finish temperature (Mf), the temperature where the austenitic phase
has completely transformed into the martensitic phase.
The austenite start temperature (As), which is the temperature where the
martensitic phase begins to transform into the austenitic phase upon heating.
The austenite finish temperature (Af), which is the temperature where the
martensitic phase has completely transformed into the austenitic phase.
The thermodynamic aspects of the phase martensitic transformations can be surveyed by
plotting the Gibbs free energy of both austenitic and martensitic phase as a function of
applied temperature [Kato85]. Such plots are possible because this transformation does
not include any compositional changes. Figure 3 illustrates a schematic drawing of Gibbs
free energy of both phases versus the applied temperature.
Austenitic phase
Martensitic phase
GD
GD
Te AfMsAsMf
Gib
bs f
ree e
ne
rgy
Temperature (°C)
Figure 3: The variation of Gibbs free energy curves for austenitic and martensitic phases versus the applied
temperature after [Miya09].
Generally, the two different phases have a different dependency of the Gibbs free energy
on the applied temperature, therefore, an intersection in their curves is observed. At the
intersection point the phases have the same free energy and are in an equilibrium state
located at the equilibrium temperature (Te) [Miya09]. The presence of a phase depends
mainly on the amount of free energy and the driving force needed to induce a phase
transformation. Below Te, the martensitic phase has a lower free energy, thus it is favored
thermodynamically and the phase change is driven by cooling the material to the Ms
temperature. Likewise, above Te, a driving force is needed to reverse the transformation.
At this point the material is heated to As where the austenitic phase has a lower free
energy and it is thermodynamically more stable. Due to the difference in the
transformation elastic energy, a transformed phase will remain stable until a sufficient
driving force (GD) is reached to start the nucleation of a new phase. In general,
martensitic transformations are seen as a thermoelastic transformation since the
boundaries between the martensitic and the austenitic phases are crystallographically
reversible leading to a hysteresis formation [Miya09, Kurd49]. The shape of the
hysteresis loops is controlled by two main energies which generate the hysteresis loops.
These two energies were as follows: the elastic energy which modifies the equilibrium

2.1 General characteristics of shape memory alloys
temperature between the two phases and the dissipative energy which determines the
width of the hysteresis loop during martensitic phase transformations [Pasl78].
2.1.1 Stress induced martensitic transformation and superelasticity
When a martensitic transformation (MT) is induced by applying a mechanical stress,
the MT is called stress induced martensite transformation (SIMT). The SIMT is the main
reason causing superelasticity (SE) [Miya09.2]. It is important to mention that the SIMT
should not exceed a certain threshold temperature value known as the SIMT critical
temperature (Md), see Figure 4 [Otsu98]. Above this threshold temperature, an applied
stress does not generate SIMT, rather, dislocation formation is observed in the
microstructure. When an applied stress is induced on a SMA the martensitic phase will
nucleate and grow. Also if the applied temperature on SMA increases during the SIMT;
the energy required for the martensitic phase to nucleate and grow is increased. As a
result, a linear relation between the induced stress and applied temperature is recorded.
This relation can be described by the Clausius-Clapeyron equation [Woll79]:
d S H
dT T
(2.1)
Where σ is the uniaxial stress, ε is the transformation strain, S is the entropy of
transformation per unit volume, H is the enthalpy of the transformation per unit volume
and T is the temperature. There are certain temperature and stress limits within which
superelastic deformation can occur. Figure 4 presents schematically the window limits of
both shape memory effect and superelasticity.
Crit
ical
stres
s to
indu
ce m
arte
nsite
Str
ess
(M
Pa)
Temperature (°C)
AfMs AsMf
Shape memory effect
Critical stress for slip
SE
Md
Figure 4: Schematic diagram of the region of shape memory and superelasticity effects [Otsu86].
As seen in Figure 4, there is a narrow range of temperatures upon which superelasticity
can occur [Otsu86]. Superelasticity does not depend simply on the thermodynamic
stability of the two phases but also it is highly dependent on the plastic deformation that
might occur, e.g. dislocation or slips. For example, if a high stress is applied on the
material, slip deformation will happen and the SME will not be seen. The applied stress
has to increase to a critical value to induce the martensitic phase transformation.

Chapter 2
11
According to the Clausius-Clapeyron equation, the required stress in order to induce the
martensitic phase transformation increases with temperature, which also aid the slip
formation. The temperature at which the slip and the martensite formation have the same
applied stress level is considered as the upper boundary for both superelastic and the
shape memory effect, since slip will occur favorably above this temperature, as illustrated
in Figure 4 [Miya09, Otsu86]. A schematic stress-strain hysteresis plateau of a
superelastic alloy is demonstrated in Figure 5.
σMs
σMf
σAs
σAf
σelastic
Strain (%)
Str
ess
(M
pa
)
σMs : Martensite starting stress
σMf : Martensite finishing stress
σAs : Austenite starting stress
σAf : Austenite finishing stress
σplastic: Start of plastic deformation stress
σplastic
Figure 5: Superelastic effect observed in shape memory alloys.
The scheme shows the SMA during the stress induced martensitic transformation. When
the material is loaded till a certain stress (σMs) the MT starts by reorientation of the
martensitic variants to transform the austenitic phase to martensitic phase. In region
between (σMs) and near the (σMf) the transformation loading is superelastic and some
residual untransformable austenite can be found. When the martensitic transformation is
completed, an elastic straining of the martensitic phase starts after (σMf). If the stress is
furthered increased to a critical stress (σplastic) the martensitic plastic deformation will
start. At his point the martensitic transformation cannot be completely reversed due to the
permanent plastic deformation in the SMA microstructure.
2.1.2 NiTi SMAs
NiTi alloys are considered as a unique class of shape memory alloys due to two
specific properties, superelasticity and shape memory effect, which lead to high potential
usages in different applications. In these applications, it is essential to use smart
components which have a small feature size and a high work output at the same
time [Otsu05]. NiTi shows several material properties that are analogous to other shape
memory alloys, for instance superelasticity and the one and two way shape memory
effect. NiTi alloys show additional unique features such as good biocompatibility,
excellent magnetic resonance imaging that can be detected by MRI and other X-ray based
scanners, elastic constant decreases upon increasing temperature, good ductility due to a
low elastic anisotropy, high corrosion resistance, elastic constant diminishes conversely
with temperature, ability to adjust transformation temperatures, and finally it has the

2.1 General characteristics of shape memory alloys
12
highest work output per unit volume of all microactuation materials [Otsu98, Otsu05,
Duer99, Kuja04].
Crystallization in general is an important feature which structures the overall
mechanical performance of a metal. Crystallization of NiTi alloys is sensitive to many
factors such as annealing temperature, alloy chemical composition, film thickness,
oxygen impurities in the used targets [Zamp04], and the substrate material [Miya09].
NiTi films exhibit an amorphous microstructure when deposited at room temperature.
Therefore an additional heat treatment is required to crystallize the films. It was noted in
the literature that NiTi crystallization temperature is approximately at 500 °C [Buch90].
At this temperature the microstructure nucleation and grain growth mechanisms start.
During crystallization, a spheroidal grain growth is observed in the NiTi microstructure
which indicates a polymorphic crystallization mode [Chan97]. The crystallization of NiTi
shows an increase in the average grain size as the crystallization temperature increases
[Lee05]. In additions, the film composition plays a significant role in the crystallization
process. In literature, it was shown that NiTi crystallization occurs faster in Ni rich films
than in Ti rich films [Grum01,Chan97]. The effect of the film thickness on crystallization
is one of the factors that are not yet fully understood. For instance, it was shown that two
types of crystallization occur within NiTi thin films (0.5 to 4 µm thickness) [Han06].
These crystallizations are (a) crystallization of nano-crystalline grains in thin regions of
the film and (b) polymorphic crystallization in the thicker region. Contradictory results
were reported in the literature, showing different crystallization behaviour for NiTi films
in a film thickness region between 0.5 to 7 µm [Ishi03]. In the previous work, two
different mechanical behaviors were noted below and above 5 µm film thickness, as seen
in Figure 6.
Ti-rich oxide Ti depleted zone Resistance to
deformation
Strong
Constant
From neighboring
grains
Constant From surface
Oxide later
Strong
7 µm
5 µm
2 µm
1 µm
0.5 µm
Figure 6: Cross-sections of crystallized Ti-50.0 at% Ni thin films with different thicknesses and
strengthening mechanisms of thin films [Ishi03].
The later effect was associated with the film oxide layer and the neighboring grains,
whereby two zones of titanium oxide regions were present. On the film surface a Ti rich
oxide layer was observed and below the film surface near the grains a titanium depleted
zone was observed in the NiTi microstructure [Ishi03]. One last factor that affects
crystallization of NiTi thin films is the substrate roughness. In literature, the studies on
crystallization dependence on surface roughness have as well some contradictions. One
study indicated that a rougher surface might enhance crystallization by generating more

Chapter 2
13
nucleation sites [Mart06] while another study observed the opposite [Vest03].
Nevertheless, NiTi thin films are deposited on substrate with lower surface roughness to
minimize the residual stresses on the film and to lower the overall deposited film surface
roughness. To sum up, the crystallization of NiTi thin films includes many different
mechanisms and additional research is still needed to fully understand it.
To identify the crystallization temperature of the NiTi films, the activation energy of
crystallization is measured. The activation energy represents a good indicator for the
thermal stability of the films [Chan97, Liu07, Miya09.5, Lee05]. One of the most
common methods used to measure the activation energy is the differential scanning
calorimetry (DSC). DSC is based on the difference in heat flow (absorbed or released)
between a reference sample and the investigated sample. Results are plotted as heat flow
versus the applied temperature, where crystallization temperature is seen as exothermic
peaks, see Figure 7.
Temperature (°C)
β1
β2
β3
β4
β4> β3> β2> β1 Tp
Tx
He
at
flo
w (
mw
)
Figure 7: A schematic of the Kissinger method showing DSC curves at different heat rates β. The onset
and the peak temperatures are noted in the figure and can be used to solve the activation energy using
equation 2.2.
Kissinger method is used to analyze the NiTi DSC data [Miya09.5]. In this method, the
investigated sample (amorphous) is heated at different heat rates and the exothermic
peaks are recorded as illustrated in Figure 7. The activation energy is calculated using the
mathematical expression as follows [Miya09.5]:
2
ln activ
P p
C E
T RT
(2.3)
Where β is the applied heating rate, Tp is the peak temperature for crystallization, R is the
gas constant, C is a constant and Eactiv is the activation energy. A plot of log (Tp)2/β
versus 1/Tp will result in a straight line. The slop of this straight line is the activation
energy (E). The thermo-mechanical behaviour during the martensitic transformation can
be investigated using the Clausius-Clapeyron relationship [Miya09.5, Liu07, Port81]. In
this relation the dependence of the yield stress on the test temperature is obtained and
used later to acquire the enthalpy of transformation. The relation requires the testing of
the NiTi specimen under uniaxial stress at different test temperatures. The enthalpy of
transformation is acquired by plotting the yield stress versus the test temperature, which
will result in a straight line. The slope of the straight line yields the enthalpy of

2.1 General characteristics of shape memory alloys
14
transformation value. In general the activation energy range of equiatomic NiTi alloy is
between 350 and 490 KJ/mol [Miya09.5].
Before integrating the NiTi alloys in any application, the alloy has to go through
thermomechanical treatments to control the martensitic transformations temperatures.
Since both Ni and Ti solubility window in the NiTi phase diagram is extremely small, see
Figure 8 (a), such processing steps lead to the formation of different precipitations.
Atomic Percent Titanium (%)
Tem
pera
ture
(K
)
NiTi
Ni4Ti3
Mart
en
sit
e s
tart
tem
pe
ratu
re
(°C
)
0.92 0.96 1.0 1.04 1.08
-150
-
100
-5
0
0
5
0
10
0
150
47 48 49 50 51 52 53
Nickel content (atomic %)
a) b)
52 50 48 46 44 42
1600
1400
1200
1000
800
600
400
200
0
Harrison et al.
Hanlon et al.
NiTi2+
NiTi
Figure 8: (a) Partial structural phase diagram of NiTi showing the composition of the metastable Ni4Ti3
with a vertical red line marker [Komp02, Nisha86]. (b) Martensite transformation temperature plotted
against Ni content in nearly equiatomic NiTi alloys, after [Duer11].
NiTi alloy having a Ni rich content, exceeding 50 at%, will decompose on cooling from
higher temperatures giving Ni4Ti3 as illustrated in Figure 8 (a) and (b). This thesis will
focus mainly on the Ni4Ti3 precipitates, which have a significant effect on the
characteristics of martensitic transformation, e.g. altering the chemical composition, the
MT temperatures, and the mechanical properties of the alloy [Nish86, Zhou05]. In Figure
8 (a), a partial structural phase diagram of NiTi alloy showing the composition of the
metastable Ni4Ti3 with a vertical red line marker is presented. Figure 8 (b) illustrates the
dependence of martensitic phase start temperature on the Ni content. After annealing a Ni
rich NiTi film, Ni4Ti3 precipitates will form in the film matrix. These precipitates
consume the Ni and increase the titanium content in the matrix. As a result, the
transformation temperature will increase [Otsu05, Duer11, Miya09.3]. The dependence
of the transformation temperature on the Ni content has a limit below 49.7 at% Ni, above
this limit the transformation temperatures changes with increasing the Ni content, as seen
in Figure 8 (b). This occurs because the Ti2Ni precipitates appear below 49.7 at% Ni
[Miya09.3]. In addition, research investigation performed on 51.5 at% Ni sputtered film
showed that the ductility is inversely proportional to the Ni content [Sato00, Sato96]. The
literature results showed that NiTi films containing 51 at% Ni were brittle and their
elongation at fracture was below 10 %. While films with 50 at% Ni were ductile and had
an elongation at fracture of more than 50 %. This occurs because the heat treatments used
deplete the NiTi matrix of nickel as a result of Ni4Ti3 precipitates formation [Sato00,
Sato96]. The different transformation maps of NiTi matrix decomposition are
summarized in the time-temperature-transformation curve (TTT) as seen in Figure 9. The

Chapter 2
15
previous figure shows the possible precipitates formation as a result of different heat
treatment times and temperatures used. The TTT curve measures the rate
of transformation at a constant temperature, i.e. a specimen is brought to austenitic phase
by heating to a high temperature and then cooled down rapidly to a lower temperature to
prevent/suppress any precipitates formation. The TTT diagram is used in determining
when a transformation begins and when it ends and it is a useful mean to understand the
precipitates formed in NiTi alloy.
TiNi
TiNi+Ti11Ni14Ti2Ni3TiNi+Ti2Ni3TiNi3
TiNi+Ti11Ni14
TiNi+Ti2Ni3TiNi+TiNi3
Ag
ing
Te
mp
era
ture
(°C
)
500
600
7
00
8
00
9
00
0.1 1 10 100 1000 10000
Aging time (hrs)
Figure 9: Time-temperature-transformation curve of a Ti-52 at% Ni alloy, after Nishida et al. [Nish86].
The Ni4Ti3 metastable precipitates exhibit a rhombohedral crystal structure with a
lenticular shape. The precipitates’ crystal structure belongs to the R-3 space group with a
habit plane of (111)M [Miya09.3]. In one unit cell of Ni4Ti3 precipitates, six Ti atoms and
eight Ni atoms join together to form the rhombohedral crystal structure with a lattice
parameters as follows: a = 0.6704 nm and α = 113.85 nm [Miya09.3, Nish86, Wang09].
In general, Ni4Ti3 precipitates form coherently during the heat treatment and show up to
eight variants on the {111}- planes [Tada86]. Figure 10 shows (a) TEM bright field
image, (b) selected electron diffraction pattern of Ni4Ti3 precipitates in a Ti-51.3% Ni
thin film [Miya99], and (c) schematic illustration of the lattice distortion of the matrix
surrounding Ni4Ti3 precipitate [Tada86]. After formation, Ni4Ti3 precipitates generate
coherent stress fields around them, as presented by the change in the lattice parameters in
Figure 10 (c). Internal stress formed around the precipitates and/or near to the matrix
dislocations influences the mechanical properties of the NiTi film. The strain caused by
the coherent stress fields around the precipitates reinforces the B2 phase and increases the
shape memory training capacity, as well as enhancing the mechanical properties
tremendously [Tada86, Nish86].

2.2 Fracture mechanisms in metals
16
(a)
(b)
(c)
Figure 10: (a) TEM bright field image and (b) selected electron diffraction pattern of Ni4Ti3 precipitates in
a Ti-51.3% Ni thin film [Miya99], (c) schematic illustration of the lattice distortion of the matrix around
Ni4Ti3 precipitate after [Tada86].
2.2 Fracture mechanisms in metals Metals experience two different fracture classes under uniaxial loading, e.g. brittle
fracture and ductile fracture. Microstructure features such as electron bond and crystal
structure play a vital role in determining the final fracture mechanism [Fuch80]. Both
fracture classes show either a transgranular fracture path, i.e. fracture propagate
throughout the grain, or an intergranular fracture path, i.e. the fracture propagates along
the grains as illustrated in Figure 11 [Lamp96].
Material microstructureMaterial Surface
Crack initiation site
Material microstructure
Crack initiation site
Material Surface
a) b)
Figure 11: Schematic showing (a) intergranular fracture path and (b) transgranular fracture path.
The general manifestation of ductile and brittle fracture surfaces is illustrated in Figure
12. Figure 12 (a) shows a highly ductile fracture in metal leading to significant reduction
in the fracture surface, (b) typical ductile fracture with a common reduction in fracture
surface, and (c) a classic brittle fracture showing no plastic deformation prior to fracture.
Metals undergoing a ductile fracture demonstrate a substantial plastic deformation
resulting in a significant elongation prior to fracture. Figure 12 (a) shows an ideal case of
ductile fracture where the plastic deformation leads to severe reduction in the material
cross-section. In a typical ductile fracture, the fracture surface has dimple ruptures and
the material cross-section has a slight reduction, as seen in Figure 12 (b). Moreover, the
fracture proceeds after formation by coalescence of cavities to form a crack and finally
shear fracture at an angle relative to the tensile direction. The striation and microviods
coalescence are the dominate features of ductile fracture surfaces. From a macroscopic

Chapter 2
17
point of view metals undergoing brittle fracture have no plastic deformation prior to
fracture. Yet under microscopic level, brittle fractures might show some plastic
deformations of low significance. Furthermore, metals experiencing a brittle fracture
have micorcleavages and microviods features in the fracture surface and the fracture
surface is perpendicular to the applied tensile stress [Wulp66]. Brittle fractures are
dominated in metals having high hardness and high strength with low overall ductility.
The fracture mechanism in brittle metals takes place by means of rapid crack
propagation, since no significant plastic defamation takes place prior to cracking, and
micorcleavage is the dominant feature of the fracture surface. Additionally, the brittle
fracture has a flat fracture surface as presented in Figure 12 (c).
a) b) c) Loading direction
Figure 12: Schematic drawing showing different fractures in metals, (a) highly ductile fracture, (b) typical
ductile fracture, and (c) brittle fracture after [Calli06].
However both ductile and brittle metals will fail under the same mechanism if subjected
to a repeated cycling loading for extended periods of time. This fracture is known as
fatigue fracture and it is similar to the brittle fracture as seen in Figure 12 (c). Like all
metals, fatigue failure occurs in NiTi SMAs applications which involves extensive
cycling straining.
2.3 Fatigue Material failures caused by repeated mechanical loading have caused numerous of
accidents which resulted in both human life and financial losses. This unexpected
mechanical failure is known as fatigue [Calli06]. Fatigue is the phenomenon of material
failure after several cycles of fluctuating mechanical loadings to a stress level below the
ultimate tensile stress [Fuch80]. Such repeated loading finally leads to a fatigue fracture,
even if the material under the dynamic load is ductile. Despite the importance of reliable
fatigue predictions, up to this date the majority of studies associated with fatigue
investigations still have not yet yield a full understanding of this complex phenomenon.
The earliest fatigue study was done by Wöhler who investigated the mechanical failure in
railway axle [Wöhl67]. He studied the relationship between the applied stress (σ) and the
number of cycles till failure (Nf). It is also commen in shape memory alloys to use the
strain amplitude in the Y axis instead of stress, due to the Superelasticity effect.
However, this will be further explained in chapter 2.3.4. Wöhler was the first to introduce
the fatigue endurance limit (FEL), below this stress limit material does not suffer from
fatigue failure for an infinite number of cycles. Figure 13 shows a typical representation

2.3 Fatigue
18
of a fatigue life diagram for metallic alloys. A logarithmic scale on the x-axis is mostly
used because of the high number of cycles.
σ(M
pa)
Number of cycles to failure (Nf)
LCF HCF
105
Safe zone
Fatigue endurance limit
Figure 13: Typical representation of a fatigue life diagram of metallic alloys illustrating the relationship
between the stress amplitude (σ) and the number of cycles to failure (Nf). LCF corresponds to the low cycle
region where Nf < 105 and HCF corresponds to the high cycle region where Nf > 10
5.
The fatigue diagram can be separated into a low and a high cycle fatigue regions. In the
low cycle fatigue region (LCF) the number of cycles to failure (Nf) are between 103 and
105 cycles. In this region the material is subjected to high stresses and the majority of
plastic deformation occurs. In the high cycle fatigue region (HCF) the numbers of cycles
to failure are ≥105 cycles and the applied stress amplitude is lower compared to LCF. The
fatigue endurance limit (FEL) can be seen in Figure 13 as the straight line caused by the
sudden change in the stress amplitude. At the FEL, the stress amplitude is below the
material yield strength [Fuch80]. It can also be seen that the magnitude of the applied
stress decreases the number of cycles that the material can take before fatigue failure
takes place. For fatigue failure to occur, the material's tensile stress should reach a high
value or a large number of loading cycles should be applied. Furthermore, the applied
stress in a single cycle during the repeated mechanical loading is not sufficient to induce
fatigue failure. However fatigue damage is an accumulative process that builds up
incrementally during each loading cycle. In addition, for fatigue failure to occur, the
material must be subjected to alternating stress or strain for a certain period of time.
During this time several internal and external effects contribute in the fatigue process
which will be described in more detail in the next chapters.
Different types of loading are used in fatigue testing. According to the application
operation mode, the most suitable fatigue loading mode is selected. The main types of
fatigue loading are axial, torsional, and bending as illustrated in Figure 14. A mixture of
two different loading schemes can be used as well to asset the investigation of material
fatigue properties. In real life applications, the alloy can suffer from combined loading
schemes. Thus, it is more realistic to use a combination of several loading types when it
is needed.

Chapter 2
19
a) b) c)
Figure 14: Schematic drawing of the (a) axial stresses, (b) torsional stresses, and (c) bending stresses
utilized in fatigue testing. Blue dotted lines present the original structure before deformation, the red line
represent structure after deformation, and black arrows represent the direction of load applied,
after [Calli06].
The cycling of the applied stress can have different types. Figure 15 shows
schematically a sinusoidal time dependent curve in which the stress amplitude is
symmetrical about the mean zero stress level. In this mode both tensile as well as
compressive stresses are applied [Camp08]. If the amount of the maximum (σmax) and
minimum applied stresses (σmin) is equal, the applied cycling loading in this case is
defined as fully reversed cycling, as presented in Figure 15 (a).
σmax
σmin
σaσ∆
a)
σm
+
0
-
+
0
-
max min
max min
max min
max
min
2
2
a
m
R
Stress range:
Stress amplitude:
Mean stress:
Stress ratio:
b)
Figure 15: Different loading cycles of applied stress, (a) fully reversed loading cycles and (b) tension-
tension loading, where the zero line represents the zero mean stresses point, i.e. before applying any
stresses, after [Camp08].
Another type of cycling known as tension-tension cyclic stress is seen in Figure 15 (b), in
this mode the specimen is preloaded first to a certain stress value then tension-tension
stress is applied. Whereby, the applied stress and the cyclic stress are of one type, either
tensile or compressive stresses. In tension-tension cyclic mode the mean applied stress is
higher than the stress amplitude, i.e. the sample will not go under compressive stresses
during the cyclic fatigue test. The tension-tension cyclic loading fatigue scheme is mainly
used in fatigue investigation of ductile metals since samples are generally preloaded
before a test starts or due to better material performance using this testing scheme.

2.3 Fatigue
20
2.3.1 Microstructural aspects of fatigue
Fatigue failure in metallic materials occurs by movement of dislocation, crack
nucleation-propagation, and finally by sudden mechanical failure. Cracks form due to
several kinds of internal and external effects. Internal effects causing fatigue cracks are
localized stress concentration points or metallurgical defects inherited in the metal, i.e.
inclusions, voids or internal residual stresses. External effects causing fatigue cracks are
more related to the loadings condition and the surrounding environment, e.g. temperature
and pressure [Fuch80]. When inspecting a typical fatigue fracture surface under the
microscope two characteristic features of a fatigue fracture are seen such as beachmarks
and striations [Calli06]. Figure 16 illustrates (a) fracture surface of a rotating steel shaft
that experienced fatigue failure, the figure shows the origin of the fatigue crack, the
beachmark ridges, and the point where the fracture took place, (b) a transmission electron
microscope image showing the fatigue striations in aluminum [Calli06].
Beachmarks
Start of fatigue crack
Fracture
A striation line
a) b)
Figure 16: (a) Fracture surface of a rotating steel shaft that experienced fatigue failure, the figure shows
the origin of the fatigue crack and the beachmark ridges. (b) Transmission electron microscope image
showing the fatigue striations in aluminum, scale not indicated in reference after [Calli06].
Beachmarks are seen as macroscopic wavy bands with different contrast, while fatigue
striations are seen as microscopic wavy lines along the fracture surface. A striation
represents a fraction of a beachmarks, i.e. agglomeration of striation produce a
beachmark. The distance between one striation and another is dependent on the
stress\strain amplitude applied in the fatigue test, i.e. higher amplitudes yield a higher
striation width. Every single striation represents the development of the fatigue crack in
one cycle. Fatigue crack growth can also occur though different mechanisms such as
microviod coalescence and micorcleavage [Calli06]. Fatigue failure occurs when the
crack propagation reaches a limit at which the associated stresses and strains are high
enough to cause a sudden mechanical fracture. However that does not mean that the crack
propagates through the whole microstructure. When a fatigue crack is inspected under the
electronic microscope the fractured surface demonstrates three main regions: a crack
initiation site, a crack growth site, and finally a fracture region, see Figure 16 (a). A part
of the fracture surface can still show the original microstructure before fatigue failure
occurs. This happens when the fatigue crack did not propagate through the whole
component, which depends mainly on the material microstructure and previously
discussed effects.
The performance of metallic materials under frequent cyclic loading is different
compared to typical monotonic loadings [Calli06, Lamp96]. This depends mainly on the

Chapter 2
21
material microstructure and the pre-treatment conditions used. Under cyclic loading,
fatigue crack progress at stress levels lower than that of a typical monotonic tensile
strength of the metal [Pati11]. Metals show signs of fatigue damage if subjected to
continued cyclic loadings. On the contrary the same fatigue damage can not be seen
under static monotonic loading. Fatigue failure starts by the formation of crack initiation
sites that involve local plastic deformation at stress concentration sites or at the grains
boundaries after several straining cycles. In the early stage of fatigue failure, cyclic
plastic straining generates intrusions and extrusion in the form of slip bands. These slip
bands are also known as persistent slip bands (PSBs) [Lamp96]. Fatigue crack start
preferably at the PSBs sites [Fors69]. Figure 17 shows a schematic drawing of the slip
bands under (a) monotonic load and (b) cyclic load in metals.
Metal surface
Crack initiation sitesExtrusion
Material microstructure
Intrusion
Metal surface
Material microstructure
a) b)
Loading direction Loading direction
Figure 17: Schematic of slip band under (a) monotonic load and (b) cyclic load after [Pati11]
Figure 17 (a) shows how in a monotonic loading the slip bands formation is consistent on
the metal surface, while in cyclic loading the slip band formation is inconsistent on the
surface. During cyclic loading the fine movements of slip bands against each other and
against the metal matrix will result in a number of fatigue initiations sites which allows
fatigue crack to start. Fatigue cracks propagate mainly through the grains and tend to
avoid the grain boundaries due to the high thermodynamic energy required to overcome
them. During the mechanical loading, the first stage of fatigue crack growth is the
initiation of a fatigue crack. This take place at a slip band located at a point of high stress
concentration, usually near the surface. The slip band has to be confined in a grain with
certain orientation that allows crack growth in the direction of maximum shear stress. In
this stage the fatigue crack growth is very slow and can hardly be detected. With further
cyclic loading, fatigue cracks are formed by joining of local slip bands collectively
forming a crack with a certain crack tip, also known as nose. As the number of cycles
increases, the stress fields at the crack tip force the crack to move perpendicularly in
planes of maximum tensile stresses [Pati11]. The latter stage is known as the second
stage of fatigue crack growth. In the second stage, the total life of the crack depends on
the applied stress or strain amplitude, material resistance to fatigue, and the crack length.
A crack can extend in three different modes in metals. Figure 18 demonstrates a
schematic drawing showing the crack growth modes as follows: (a) Opening mode, (b)
shearing mode, and (c) tearing mode crack growth. These modes depend on the
microstructure and the material loading direction.

2.3 Fatigue
22
a) b) c)
Figure 18: Schematics drawings showing the crack extension modes of (a) opening mode, (b) shearing
mode, and (c) tearing mode after [Fors69, Fuch80]
In general, a mixture of two modes can occur, thus the crack growth in tearing mode is
the most common. Eventually, after a sufficient number of cycling loading and adequate
crack propagation length, the cross-section area of the material is reduced and the
material fails under fatigue as exemplified in Figure 19. The latter stage in fatigue crack
growth is known as stage 3. In brittle or high strength metals the same fatigue failure
mechanism is not always seen. This occurs because the slip formation might not take
place. Rather the fatigue crack is initiated from microstructure imperfections and
continues perpendicularly in the direction of maximum tensile stresses similar to stage
two fatigue crack growth [Fors69, Fuch80].
Nucleation Crack growth and propagation in microstructure Fatigue failure
Figure 19: Fatigue failure mechanism starting from left to right after [Higg93, Camp08].
Depending on the crack size, the fatigue cracks can be distinct into a small fatigue
crack and a short fatigue crack. Figure 20 illustrates schematic drawing of (a) small and
(b) short cracks in the material's microstructure showing the difference in crack size and
shape. Small cracks have dimensions up to the microstructural scale, e.g. grain size. In
addition, small cracks have larger crack growth rate (da/dN) when compared to short
cracks, thus they grow faster in the microstructure [Lamp96]. On the other hand, a short
fatigue crack has one dimension that is large when judged with respect to the
microstructure [Calli06, Lamp96] and have a smaller crack propagation rate (da/dN)
when compared to small cracks. The crack growth rate for short cracks is proportional to
the crack threshold (∆Kth), the value at which crack growth rate approaches zero. Figure
20 (c) shows a schematic illustration of each stage of the fatigue crack propagation
discussed earlier [Calli06, Lamp96, Ykim11]. A comparison between the 3 stages of
fatigue crack growth is illustrated in Table 1

Chapter 2
23
Log (ΔK)
da/d
N(m
m/c
ycle
)
10-2
0-4
10-6
Stage 1 Stage 2 Stage 3 Kc
final
fracture
da/dN=C(∆K)n
∆Kth
1
n
a)
b)
Small
Short
c)
Figure 20: Schematic drawing of (a) ''small'' (b) and ''short'' cracks in the material microstructure showing
the difference in crack size and shape. (c) Schematic plot of fatigue crack propagation rate, da/dN, versus
the stress intensity range ∆K, on a log scale, a is the length in mm and N is the number of cycles [Calli06,
Lamp96, Ykim11].
Table 1: A comparison between the 3 stages of fatigue crack growth [Calli06, Ykim11]
Stage Influencing parameters da/dN versus Log (ΔK)
Stage 1
large influence of microstructure,
applied mean stress or mean
strain, and the environment
crack propagation rate (da/dN)
decreases with decreasing the
stress intensity range (ΔK) to a
threshold value known as (ΔKth)
Stage 2
striation growth mechanism
combined with small influence of
microstructure, applied mean
stress/strain, component
thickness ,and the environment
da/dN = C(ΔK)n, where C and n
are constant
Stage 3
cleavage and intergranular
growth mechanism combined
with large influence of
microstructure, applied mean
stress/strain, and the environment
high rate region where K
approaches he critical stress
intensity for failure Kc
2.3.2 Factors affecting fatigue resistance
Different factors can affect the fatigue resistance of metals. Some of these factors are
the manufacturing processes, the surface finishes, and the metallurgical history of the
material. The previous parameters should be taken into consideration when investigating
the fatigue behaviour of metals, which means, investigated samples should have the same
metallurgical history and the same surface finish to acquire reliable data.
Since fatigue crack initiate most of the time from the metal surface, the surface
properties are of high significance. For example, the grains located near the metal surface
might suffer from low surface quality due to machining reasons, e.g. sharp structure
edges and scratches, which lead to rougher surfaces that assist the formation of fatigue
initiation sites. Also, the metal surface has a high probability to be damaged as it is in
direct contact with the environment and other external effects. In addition, surface grains

2.3 Fatigue
24
can undergo plastic deformation easily because they are not supported by other grains in
the matrix [Sure98, Lamp96, Fuch80]. Even if the material surface is free of defects,
remaining persistence slip bands (PSBs) from material machining/or preprocessing will
come near the surface during cycling and lead eventually to several crack initiation sites.
Different techniques were developed to enhance the metal surface quality. One of the
most effective methods is electropolishing (EP). When a metal is electropolished the
PSBs, microviods, scratches, and the sharp edges are removed to a great extent. As a
result, the fatigue life is significantly improved [Lamp96, Wulp66, Pati11, Calli06].
Other methods to increase the fatigue resistance of a metal involve the modification of
the compressive stress at the outmost layer of the metal surface, e.g. shot peening, surface
hardening, and cold rolling [Calli06]. Figure 21 illustrates a schematic drawing revealing
how a surface finish such as electropolishing can improve the fatigue endurance limit and
the overall fatigue resistance.
Number of cycles to failure (Nf)
Metal with surface treatment
Metal without surface treatment
Alt
ern
ati
ng
str
ain
(%
)
Fatigue endurance limit at 2 % strain amplitude
Fatigue endurance limit at 0.5 % strain amplitude
Figure 21: Enhancement of fatigue endurance limit as a result of metal surface treatment
The mechanical behaviour of materials, e.g. the stress-strain characteristics, can be
influenced significantly by the previously applied cyclic loading. This happen if the
earlier cyclic loading included plastic deformation. When a metal is subjected to
fluctuating tensile/compressive stresses the stress-strain hysteresis curve might suffer
from either cyclic hardening or cycling softening depending on the investigated material,
as shown in Figure 22. In general, annealed metal exhibit cyclic hardening and cold
worked metal exhibit cyclic softening [Morr65, Polak54]. Figure 22 illustrates a
schematic drawing showing the stress-strain hysteresis loop for strain controlled fatigue
of metal exhibiting (a) cyclic hardening and (b) cyclic softening. As seen in Figure 22,
both effects augment as the number of cycles increases. In cyclic hardening, the tensile
strength is increasing with increasing the number of applied cycles. This takes place if the
metal has initially low dislocation density. Therefore, fatigue test will induce more
dislocations and as a result the stress required to induce plastic deformation will
increase, i.e. work hardening. On the other hand, in cyclic softening the tensile strength is
decreased as the number of applied cycles increases. When the metal is pre-treated to
have a high dislocation density, e.g. work softening, the stress required for inducing
plastic deformation is decreased during the fatigue test. This happen because the
microstructure dislocations were already rearranged by the previous treatment. Whether
the material hardens or softens depends mainly on the metal's microstructure.

Chapter 2
25
a) b)
Figure 22: Schematic drawing showing the stress-strain hysteresis loop for strain controlled fatigue tests at
(a) cyclic hardening, and (b) cyclic softening, where the numbers on the dashed lines indicate the number
of applied cycles, after [Camp08]
Fatigue fracture can occur under different loading conditions. If a combination of two
loadings are utilized, the material experience low fatigue resistance due to the multi axial
loading leading to multiple slip bands formation and increasing in the number of crack
initiation sites in more than one localized area on the sample. Moreover a direct
relationship between the stress amplitude, alternating strain, and the number of cycles to
failure is seen in Figure 23 (a) and (b), respectively.
A
ltern
ating s
train
(%
)
Number of cycles to failure (Nf)
ε 3
ε 2
ε 1
ε1 < ε2 < ε3
σ(M
Pa)
Number of cycles to failure (Nf)
σm3
σm2
σm1
σm1 < σm2 < σm3a) b)
0.5
1
1.5
40
80
120
Figure 23: Schematic drawing showing (a) the influence of the mean stress on the fatigue endurance limit
of metals and (b) the influence of the alternating strain on the fatigue endurance limit of metals,
after [Calli06]
The figures clearly show that increasing the mean stress (σm) or the alternating strain
leads to a reduction in the overall fatigue characteristics of the metals, i.e. the fatigue
endurance limit. It could also be found that the fatigue life of metals decreases as the
stress amplitude and the alternating strain increases. Moreover, the use of an appropriate
design for the component can also increases the fatigue resistance considerably. This
means a design with sharp edges, holes, notches and structural discontinuity should be
avoided, as these discontinuities are the main crack initiation sites where high stress
concentrations are observed. The proper use of fillets (round edge) design at the
components structure rather than pointed edges will minimize the stress concentration
sites, as a result the fatigue life of component will increases.
In addition the microstructure and the associated mechanical properties play a
significant role in fatigue behaviour. It is well known that metals with smaller grains have
higher yield strength. For example, a metal with grain size less than 100 nm have a yield
2.3 Fatigue
26
strength 4 times higher than coarse grained material of similar composition [Fuch80].
Smaller grains also lead to more grain boundaries, which act as a natural barrier to crack
propogation, i.e. hinder cracks. Moreover, smaller grains have higher proportion of
surface area to volume, which result in a greater ratio of grain boundary to dislocations.
Therefore, when additional grain boundaries are present, material strength increases.
Accordingly, fatigue life is improved to some extent. Metal features such as the grain size
and yield strength affect the fatigue resistance and the fatigue crack propagation (da/dN)
considerably [Diet88, Calli06]. Metals with higher yield strength have higher fatigue
resistance and the same applies for metals with smaller grain size. Also the fatigue
characteristic is directly related to the material microstructure. Brittle materials have a
low fatigue resistance while ductile materials have a higher fatigue resistance. This
occurs because ductile materials exhibit plastic deformation before fracture, while a
brittle material does not.
One way to modify the material’s properties and their microstructure at the same time
is by performing hardening or annealing processes. The annealing process involves
heating the metal to elevated temperatures for a certain period of time and then cooling
down gradually. Annealing of some metals, e.g. NiTi SMAs, will relieve stresses by
minimizing internal residual stresses, increase ductility, increase toughness and produce
precipitates in the microstructure [Lamp96]. Precipitates will hinder crack propagation
and as a consequence fatigue life will increase significantly. Other factors that influence
the fatigue resistance of a material can originate from the surrounding environment, e.g.
temperature, pressure, and corrosive atmosphere. For example if the applied cycling
loading were induced at a high temperature, the material will fail under a type of fatigue
known as thermal fatigue. This happen because at a very high temperature thermal
stresses in the material starts. As a result, the component's geometry might be modified
and crack imitation sites might appear due to the change in the material thermal
expansion. The latter depends on the surrounding temperature, and the material modules
of elasticity [Calli06]. Moreover, if a large difference between the material thermal
expansion and surrounding temperature is reached, the metal might creep. If metal creep
occurs, the crack growth will be accelerated and fatigue failure occurs earlier [Fuch80,
Calli06, Lamp96]. The temperature and the applied stress amplitude can affect the creep
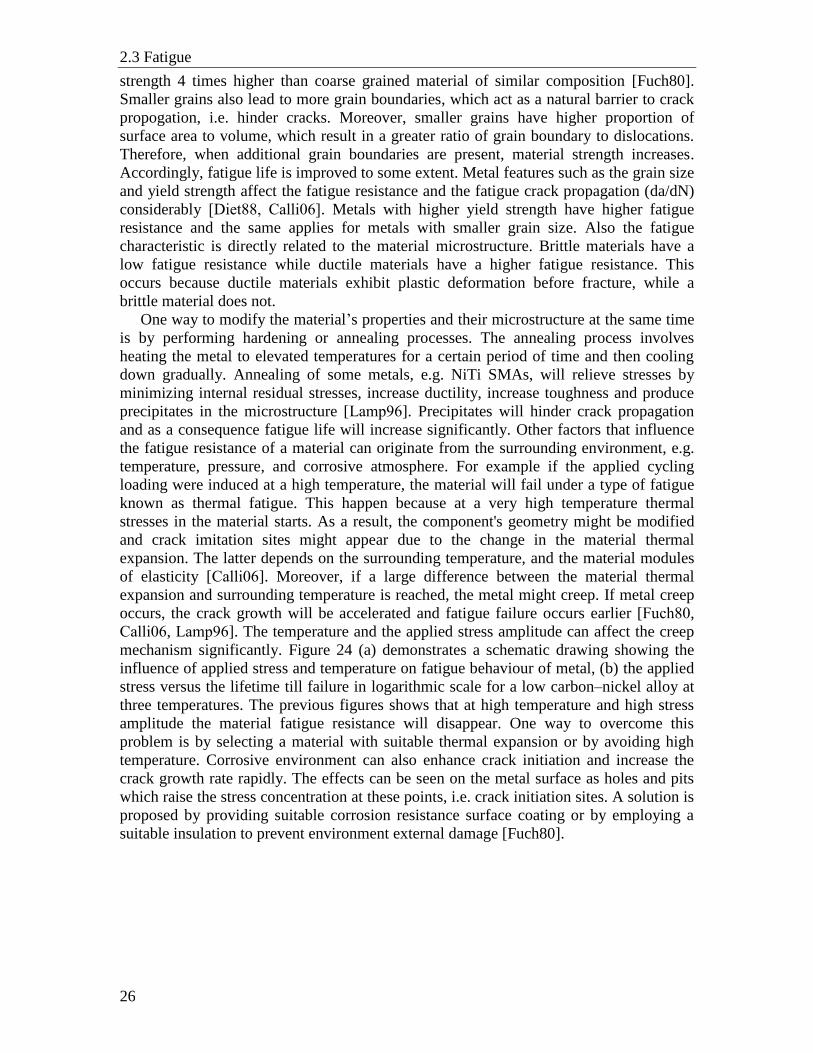
mechanism significantly. Figure 24 (a) demonstrates a schematic drawing showing the
influence of applied stress and temperature on fatigue behaviour of metal, (b) the applied
stress versus the lifetime till failure in logarithmic scale for a low carbon–nickel alloy at
three temperatures. The previous figures shows that at high temperature and high stress
amplitude the material fatigue resistance will disappear. One way to overcome this
problem is by selecting a material with suitable thermal expansion or by avoiding high
temperature. Corrosive environment can also enhance crack initiation and increase the
crack growth rate rapidly. The effects can be seen on the metal surface as holes and pits
which raise the stress concentration at these points, i.e. crack initiation sites. A solution is
proposed by providing suitable corrosion resistance surface coating or by employing a
suitable insulation to prevent environment external damage [Fuch80].

Chapter 2
27
σ(1
03
ps
i)
Rupture lifetime (hours)
σ(M
Pa)
Cre
ep
str
ain
Time
a) b)
Figure 24: Schematic drawing showing (a) the influence of applied stress and temperature on fatigue
behaviour of metal [Calli06], (b) stress versus lifetime till failure in logarithmic scale for a low carbon–
nickel alloy at three temperatures after [Calli06, Benj80].
From the previous discussed points, the fatigue resistance of metals is considered as a
complex process. Different factors can affect the fatigue performance of metal at the
same time. Most of these effects interact with the metal surface and result in limited
fatigue life. Yet, different methods can be used to increase the fatigue resistance. Most of
these methods are related to the metal surface quality. A significant improvement in
fatigue life can result if metal surface is treated properly.
2.3.3 Fatigue in thin metal films
In the last decades, the importance of fatigue characteristics on metallic thin films
increased rapidly under the expanding thin film based applications, e.g. micro electro-
mechanical system (MEMS) and new miniaturized medical devices. These applications
employ thin films with thickness ranging from micrometer/sub-micrometer scale. The
reliability of these thin films based devices during the device service life depends
strongly on their overall mechanical and fatigue performance. In recent years several
papers on the fatigue characteristics of metallic thin films were published in the literature
[Kraf01, Eber06, Zhan06, Kraf02, Hadr01, Hong96]. The results of these investigations
showed that the fatigue life of metallic thin films increased with decreasing the film
thickness, unlike the fatigue behaviour of the bulk counter parts. These differences are
highlighted in the unique microstructure features of the thin film such as the restriction in
film dimension, difference in dislocation formation, and the size effect [Arzt98],
i.e. length scale effects [Nix89,Wang07]. In thin films, size effects changes the
mechanical characteristics significantly because the volume of the thin film is inhibited in
the direction of the film thickness [Cour10]. A study on metal thin films showed that as
the applied stress increases, a dislocation is activated at a certain stress threshold [Nix89].
This threshold stress is inversely proportional to the film thickness and can lead to
dislocation confinement. Therefore it was seen that a reduction in the film thickness
increases the fatigue life [Kraf02]. Moreover, the studies show that the yield strength
increases as the film thickness decreases [Nix89, Kraf02]. Similar results were observed
in thin films when the grain size decreased, i.e. yield strength increased [Kraf02, Eber06,
Venk92]. These different mechanical characteristics in thin films are due to the
dislocation motion constraints caused by the grain boundaries [Möni05]. Besides Nix

2.3 Fatigue
28
model, the Hall-Petch effect explicates the increases in the yield strength to the pile up of
dislocation at the grain boundary [Conr00]. The typical fatigue dislocation mechanisms
found in bulk metals are not found in thin films, instead single dislocations were noticed
[Zhan03, Zhan06]. Moreover, as the film thickness decreases smaller PSBs are found on
film surface. Accordingly less crack intonation sites are present on the film surface. In
thin metallic films, it was reported that fatigue failure occurs by the formation of cracks
along the grain boundaries [Zhan03]. This occurs due to the limited number of
dislocations found in the thin film microstructure [Zhan03].
Studies investigating the fatigue behaviour of thin films are rarely found in the
literature. The dispute comes from the challenges in characterizing the fatigue behaviour
of thin films under traditional fatigue testing protocols. There is for example the need for
different setups and special equipments. Additionally, there are misleading assumptions
that fatigue behaviour of thins films might follow its counterparts of bulk materials. The
latter argument is not completely investigated and it can not be taken as a rule to follow,
as the mechanical properties of thin films are indeed dissimilar to bulk materials. For
example, the crack initiation mechanism in ductile bulk metals involves slip planes with a
size in the micrometer range which can exceed the total thickness of the thin film
[Kraf01]. A number of studies in the literature investigated the fatigue behaviour of
metallic thin films exhibiting a film thickness of several micrometers of thickness
[Homm99, Hadr01, Hong96, Kell98]. The results indicated that the material fatigue
characteristics were improving as the film thickness decreases. Yet it was not clear, if the
fatigue behaviour will change above or below a certain micrometer or sub-micrometer
thickness limit. In the literature a specific thickness were a transition from bulk to thin
film characteristics is not clear, however some studies showed that at roughly 1 µm or
less a distinct dislocation mechanism are always present [Kell98, Schw03, Eber05].
During fatigue of such thin films no surface extrusions can be observed, nevertheless
cracks were formed at the grain boundary [Zhan03, Schw03, Eber05]. The results relate
the fatigue improvement to the small grain size which is analogous to the fatigue
enhancement techniques used in bulk metallic alloys. Other studies on the thermal fatigue
on metallic thin films show that thin metallic films have different behaviour than their
bulk counterparts at different temperatures [Kell99, Schw03, Thou93]. Yet results were
not conclusive and further investigation is needed. Additionally, the mechanical
properties of thin film are dissimilar to their bulk counter parts because the young's
modules values. Metallic thin films young's modules are known to be smaller compared
to bulk metals [Yu04, Haua00]. Other factors affecting the fatigue characteristics of thin
films such as test frequency, alloying elements, mean strain, and surface treatment effects
were not studied in details. Moreover, contradicting information is also found in the
literature. As a summary, cyclic loading of metal thin films can cause fatigue failure
similar to bulk dislocation mechanism. This occurs up to a certain film thickness limit,
below this limit the fatigue in metallic thin films is highly controlled by the film
thickness and by the grain size.
2.3.4 Fatigue of SMAs vs. conventional metals
The fatigue characteristics of SMAs are different to conventional metals based on
different aspects. In literature, the NiTi fatigue characteristics are investigated under
alternating strain fatigue tests (alternating strain-Nf). During the martensitic
transformation, the stress remains almost constant while strain increases. Thus, fatigue
test is conducted by applying an alternating strain [Pred03, Pelto03, Pelt08]. In strain

Chapter 2
29
controlled fatigue tests, the mean strain is held constant while the strain amplitude value
is kept as a variable. In contrast, the fatigue studies of conventional metals are generally
based on stress controlled fatigue tests [Lamp96, Fors69, Schu96].
SMAs fatigue characteristics are different from conventional metals due to several
reasons. For example, the superelasticity occurring during the martensitic transformation
increases the material ductility. Accordingly the fatigue properties of SMAs are increased
significantly when compared to conventional metallic alloys. When comparing the
fatigue curves of both conventional metals and SMAs, a clear difference is seen between
both. Metals undergo a decrease in the fatigue resistance with increasing the number of
cycles and/or the mean strain. Yet, for SMAs the fatigue resistance is increasing as the
mean strain increases, see Figure 25. The increase in the fatigue resistance occurs up to a
critical mean strain value. Above that value the fatigue life decreases upon increasing the
mean strain, same as conventional metals. Figure 25 exemplifies (a) alternating strain vs.
the number of cycles to failure for NiTi specimens, (b) strain amplitude vs. applied mean
strain for NiTi diamond shape specimens. In Figure 25 (b) specimens that survived the
107 cycle testing are shown as open squares and fractured specimens are represented with
closed squares. Figure 25 (b) shows three regions with different fatigue behaviour. (1)
The low fatigue region where the material is strained within the elastic region of the
superelastic plateaus below 2 % mean strain. (2) The constant fatigue region from 3 % to
7 % mean strain at which material is strained in the superelastic region of the plateau.
(3) A region with a lower fatigue resistance. In the last region, the material is
strained, above the superelastic region, to the martensitic plastic region of the plateau
(larger than 7 %). As seen in Figure 25 (b) as mean strain increases the fatigue life shift
to 0.6 % in the region between 3 - 7 % mean strains. A red line was sketched representing
the fatigue endurance limit of 107 cycles. The red dotted line at 0.6 % strain amplitude
stands for insufficient fatigue results. Over 7 % mean strain, the fatigue life endurance
limit plunges.
■ mean strain: 0 %
● mean strain: 2 %
▲ mean strain: 4 %
■ ● ▲
1.E02 1.E03 1.E04 1.E05 1.E+06 1.E+07 1.E+08
Number of cycles
Alt
ern
ati
ng
str
ain
(%
)
0 2 4 6 8 10
Mean strain (%)
Str
ain
am
plitu
de
(%
)
1.0
0.8
0.6
0.4
0.2
0.0
b)4
3.5
3
2.5
2
1.5
1
a)
Figure 25: (a) Alternating strain versus the number of cycles to failure data of NiTi specimens [Harri00].
(b) Strain amplitude versus applied mean strain for the NiTi diamond specimens [Pelt11], specimens that
survived the 107 cycle testing are shown as open squares, whereas cyclic conditions that led to fracture <
107 cycles are represented with closed squares.
A plot between the alternating strain versus the mean strain is used to present the
general fatigue resistance of a material. This plot is known as 'The Goodman plot'. In
conventional metals a proportional relationship between fatigue life and the applied mean
strain is always found [Calli06, Lamp96, Pati11, Schu96] where the Goodman line is

2.3 Fatigue
30
almost linear, see Figure 26. In contrast, SMAs have a non-linear Goodman line [Pelt99]
owing to the martensitic transformation causing the superelasticity. Figure 26 shows a
schematic drawing of a modified Goodman diagram illustrating the difference between
the fatigue behaviour of conversional metals and SMAs. Since SMAs have two different
phases, the fatigue behaviour of both austenitic and martensitic phases is expected to be
different. Several studies investigated the fatigue life of both phases in NiTi SMAs
[Mcni81, Holz99, Pelt03, Naya09, Melt79]. The results showed that martensitic NiTi has
a better fatigue resistance, higher fatigue-crack thresholds, and a slower crack-growth
rate than austenitic NiTi. A schematic representation showing the difference in fatigue
life behaviour of martensitic and austenitic NiTi is presented in Figure 27.
Classical Goodman theory for metals
Alt
ern
ati
ng
str
ain
(%
)
Mean strain (%)
Classical Goodman theory for SMAs
Figure 26: Modified Goodman diagram showing the difference between fatigue behaviour of conventional
metals and SMAs.
<Mf<Af
Cycles to failure (N)
Alt
ern
ati
ng
str
ain
(∆ε)
Figure 27: Schematic drawing showing the austenitic and martensitic SMA fatigue behaviour.
NiTi stress-strain plateau show a great dependence on the applied test temperature
[Pelt00]. The latter dependence is seen as a shifting in plateau stresses to higher values as
temperature increases, while at lower test temperatures the plateau stress decreases. This
dependence of plateau stresses on the test temperature will affect the fatigue
characteristics of the material. At lower stress values, lower dislocations density during
cycling loading is expected. Consequently the fatigue resistance is increased at low
temperature and is decreased at high temperature. On the other hand, NiTi crack-growth
rates were found to be faster with lower fatigue threshold values when compared to
conventional metallic alloys such as 304 stainless steel and Ti-6Al-4V [Mcke01, Morr90,
Miya97]. Both conventional metals and SMAs have the same fatigue failure mechanism.

Chapter 2
31
However, the sputtering technology used to produce SMAs, such as NiTi, presents many
advantages in the material microstructure. A couple of studies on NiTi deposited by
means of magnetron sputtering showed that the films had no heat affected zones, small
burrs, little micro cracks and no carbide contaminations [Mira09, Mira12]. Such
properties of sputtered films distinguish their fatigue behaviour from common metals,
which contain inclusions leading to early fatigue fracture. As a consequence, SMAs
deposited by mean of sputtering are expected to have higher fatigue resistance compared
to conventional metals produced by traditional fabrication techniques. As mentioned
earlier, annealing of the material in vacuum create precipitates in the microstructure. This
method is used efficiently in metals to modify the mechanical properties. In addition,
annealing is used in SMAs to control the overall transformation temperatures of the
martensitic transformation by introducing precipitates which will change the matrix
composition. The difference between the austenite finish temperature (Af) and the test
temperature (Ttest) is anticipated to have an effect on the fatigue resistance. This
difference in temperatures is known as the working temperature (Tw). The mechanical
properties of SMAs depend significantly on the Af [Heck03, Zamp09, Mira09]. It might
be expected that at higher working temperature the fatigue life of SMAs, e.g. NiTi alloys,
might decrease due to the large energy needed to induce the martensitic transformation.
This is not investigated in details the literature. Nevertheless, the dependence of the
fatigue properties on the working temperature Tw will be investigated in this thesis in
details.
2.3.5 State-of-art on NiTi fatigue
Several industrial accidents caused by mechanical failure of component are
consequent of fatigue failure. It is reported that 90 % of mechanical failure of numerous
application involving frequent mechanical loading are caused by fatigue. Likewise, NiTi
shape memory alloys are not immune to fatigue failure. Fatigue failure is one of the vital
aspects affecting future applications of NiTi SMAs. New state of the art devices based on
thin films technology, e.g. stents, are considered as a breakthrough in the designing of
miniaturized medical devices [Mira09]. Most of the current studies investigate the fatigue
properties of laser machined or cold rolled samples manufactured from bulk NiTi
[Tobu09, Pike12]. A short summary to the published literature data on NiTi state of the
art fatigue life characterization results are presented in Table 2.
Table 2: Published literature data on NiTi fatigue
Author Fatigue endurance limit Test temperature and Af
Kim and Miyazaki (1997) 0.8% Af= 40°C, test at 80,50 and 20°C
Tobushi [Tobu09] 0.5% Af= 50°C, test at room temperature
A. R. Pelton. [Pelto03] 0.4% Af= 26-32°C, test at 37°C, 50 Hz
A.R Pelron [Pelt08] 0.4-0.6% Af= 30°C, test at 37°C
Z. Lin [Lin11] 0.25% at (εm) of 4% and
0.5% at (εm) of 1% Af= 22±2°C, test at 37°C, 20 Hz
Z. Lin [Lin12] Wires: 0.25% at εm: 3%
Strut: 0.38% at εm: 2.5%
Wires: Af= <37°C, test at 37°C, 20 Hz
Diamond: Af= 1°C, test at 37°C, 30 Hz

2.3 Fatigue
32
In these entire investigations different fatigue test variables were present, for example:
Mode of loading, i.e. tension, bending or torsional.
Testing state, i.e. test frequency, temperature and test mode, i.e. vivo or air.
Material condition, i.e., composition, inclusions, surface quality, and the
preprocessing steps during the manufacturing.
Transformation temperature.
The fatigue endurance limit is mixed between a safety limit of ± alternating strain
values and a ± strain amplitude values of full loading cycles.
These different factors cannot give a clear understanding about NiTi fatigue performance,
since result cannot be compared. Melton and Mercier were the pioneers in introducing the
main concepts to investigate the bulk NiTi fatigue characteristics in a mechanical fatigue
test [Melt79]. In their findings various important tendencies were concluded: (1) Cyclic
hardening can result from repeated cycles at constant strain amplitude in the strain-
fatigue test; this occurs due to the increase in dislocation density with increases the
number of cycles. (2) The difference between the martensitic and the austenitic plateau
strength has a large effect on the fatigue endurance limit.
Pelton intended to calculate the design safety factors for NiTi medical stents tested
under bending cyclic deformation [Pelto03]. The specimens were laser fabricated from
NiTi tubes to produce diamond shape specimens, same as in Figure 29 (a). The samples
were electropolished and heat treated to have an austenitic finish temperature between 26
and 32 °C. The results showed that fatigue life increased compared with the zero-mean
conditions. It was considered that such effect occurs due to the strain accommodation
caused by the stress induced martensitic transformation. A fatigue safety limit of ± 0.4 %
strain amplitude was recorded in this work, as seen in Figure 28 (b).
a) b)
Figure 28: (a) Image of the diamond fatigue set up on the EnduranceTec ELF system, (b) Strain-cycle data
of diamond shaped samples that were cycled to failure at zero-mean strain as a function of half-amplitude
strain. The samples at 107 cycles did not fracture and the fatigue endurance limit from these data is 0.4 %
[Pelto03].
The finding of Pelton matches the several studies in the literature [Rober12, Miya97].
Recent investigation on NiTi fatigue behaviour is seen in Figure 29 [Pelt08, Pelt11]. The
results of this work indicate a dependence of fatigue life on the applied mean strain. The
fatigue test at strain amplitude versus the number of cycles to failure for fractured
samples at zero mean strain are marked as open symbols and non-zero mean are marked

Chapter 2
33
as closed symbols, see Figure 29. The fatigue endurance limit is located at 0.4% strain
amplitude.
Figure 29: (a) Strain amplitude vs. cycles to failure data of diamond shape specimens. [Pelt08, Pelt11].
The most recent work discussing NiTi fatigue was by Z. Lin et al. The latter described a
method of testing NiTi SMAs in tension-tension fatigue testing mode as presented in
Figure 30 (a) [Lin11].
a)
b) c)
Figure 30: (a) Fatigue setup, (b) dog-bone specimen presenting the gauge section, and (c) zoom in view of
the electropolished surface [Lin12].
2.4 Biocompatibility of NiTi
The test results were opposite to the previous discussed results of NiTi
mean strain vs. fatigue resistance. According to Z. Lin et al. the difference in fatigue
behaviour was perhaps due to the difference in strain distribution caused by the dissimilar
sample geometry used (dog bone and diamond shaped). Z. Lin et al. published a new
study recently investigating NiTi fatigue life at different strain amplitude [Lin12]. The
new study incorporated two different sample geometries: Z-shaped wire and diamond
shape tested in using the fatigue set up in Figure 30. The results signify that large variable
strain amplitudes deteriorate fatigue life drastically for both samples. Fatigue endurance
limits for the Z-shaped wires and diamond shape specimens were 0.25 % and 0.38 %,
respectively. Z. Lin et al. give a reasonable discussion relating the latent heat to the
amount of energy consumed during the stress induced martensitic transformation during
the fatigue test. He claims that high strain amplitude consumes more energy during
transformation (increase in sample temperature which shift transformation stresses), thus
specimen fatigue resistance is decreased drastically and fatigue failure occurs eventually.
Nevertheless, despite the differences in the test protocols, material preparation, and
transformation temperature; all tension-tension NiTi fatigue investigation studies up till
now showed a fatigue endurance limit below 0.5 % strain amplitude.
2.4 Biocompatibility of NiTi Biocompatibility is one of the essential requirements for a metallic implant. In
general, biocompatibility is identified according to the interaction between the implant
surface and the immune system [Thom91]. The biocompatibility of a metallic implant is
the ability to carry out its function inside the host, e.g. human body, without resulting in
any unwanted toxic effects in the host system [Blac05, Dwill03]. According to Anderson
et al. the implant surface can be modified as a result to protein absorption processes
surrounding the implant [Ande96]. Also the implant decomposition behaviour within the
human body, i.e. corrosion mechanisms, is considered as a vital aspect when choosing an
implant [Blac05]. If the metallic implant is made of an alloy, the corrosion rate and the
toxicity level of each alloying element must be taken into account separately. Typical
corrosion types in biocompatible implants are pitting, fretting, and galvanic corrosion
[Brow87]. Such corrosion process starts usually due to an electro-chemical reaction
between the implant surface and the different biological events in the human body, e.g.
cell growth and proliferation. A good way to minimize the implant corrosion is to reduce
its surface roughness since rougher surface in metallic alloys can lead to higher corrosion
rates [Brow87]. In general NiTi SMAs are an attractive option for medical implants
because a passive layer is formed on top of the implant. This passive layer reduces or
prevents the release of metal ions into the human body [Poso02, Esen06], thus the passive
layer thickness is very important to an implant. The high biocompatibility of NiTi is
attributed to the stable self-generating TiOx layer that forms continuously on the implant
surface [Hana91]. Over the last years, NiTi wires have been used as orthopedic and
orthodontic implants due to its great biocompatibility and pseudoelastic behaviour
[Oshi92].
The biocompatibility of NiTi SMAs has much contradiction in the literature [Castl81,
Putt92]. Titanium is categorized as a high biocompatible material, while nickel in high
concentration is classified as a toxic material, nevertheless that depend on the nickel dose
that a human body can tolerate. For example the Ni ion release during the implant service

Chapter 2
35
life has a significant consequence on the biocompatibility, i.e. side effects are seen as
high allergy [Shab96, Brun88, Lowe87].
Different studies showed that the concentration of the released Ni ions may drastically
vary, depending on the surface treatment conducted on the NiTi alloys [Poso02, Esen06,
Castl81, Brune88]. The toxicity of nickel in NiTi SMAs is known and has been
investigated using nickel salts in in-vitro and in-vivo tests over many years [Zhi07].
Several studies indicate that elevated nickel content released from the implants may lead
to significant biocompatibility problems [Manc03, Zaho01]. For examples, high Ni
concentration can lead to toxic side effects combined with cellular damage [Castl81,
Elia02]. Also Ni can cause significant effects to bones surrounded by human tissues at
high concentration [Castl81]. According to Rezuke et al. the typical nickel concentrations
in human tissues are presented in Table 3 [Rezu87].
Table 3: Reference values for the nickel concentration in human tissues after [Ohri92]
Human organ lung kidney liver spleen heart brain
Unit: μg/kg/day 173 62 50 37 54 44
Nevertheless, the highest Ni release concentration, caused by corrosion, allowed in
patients with NiTi implants is anticipated to be 20,000 µg/l/day [Blac81], or 300 to
500 µg/day [Arnd05]. If the Ni concentration exceeds this limit, extensive tissue
irritation, tumors formation, carcinogenic and toxic reactions may take place, leading to
relentless infections. In conclusion, NiTi is considered as one of the best metallic alloys
candidates for its stable mechanical and chemical performance. Yet, the Ni ion release
might limit the medical application of NiTi SMAs. Therefore, the aim of this study is to
investigate the Ni ion release of the freestanding NiTi thin films in which are considered
as a great potential candidate for medical applications. The results should be supportive
for future development of medical applications based on NiTi thin film technology from
a biocompatibility point of view.
2.5 Fabrication NiTi thin films In this chapter, the fundamental of thin films manufacturing via magnetron sputtering,
UV lithography and wet etching will be explained.
2.5.1 Magnetron sputtering
Magnetron sputtering is a type of physical vapor deposition (PVD) techniques
[Ohri92]. The chamber of the PVD apparatus is filled with an inert gas, e.g. argon. By
applying a high voltage between two electrodes a glow discharge is created and energetic
positive ions are accelerated towards the target material. When ions bombard the
negatively charged cathode the target material is ejected, i.e. sputtered, along with
secondary electrons. Different sputtering techniques are used to develop coatings and
freestanding films such as direct current (DC), radio frequency (RF), and reactive
sputtering. Reactive sputtering involves the addition of a reactive gas in the sputtering
chamber, thus a final coating or material film is produced by the mutual reaction of the
gas and the cathode material [Smit95]. RF sputtering has a lower deposition rate
compared to DC sputtering and can sputter non-conducting target materials, because it
employs an alternating voltage during sputtering [Ohri92]. DC sputtering has been
acknowledged for several years, yet its deployment is limited due to process constraints

2.5 Fabrication NiTi thin films
36
such as non-uniform plasma, relatively low deposition rates, and target poising [Ohri92,
Smit95, Kell00]. To overcome these limitations, magnetron sputtering was developed.
The latter uses magnetrons to create a magnetic field, as seen in Figure 31. This magnetic
field is trap the secondary electrons in the vicinity of the target, thus, ionization collisions
as well as ion flux increase and a denser plasma is created. A region of denser plasma is
usually formed up to 60 mm from the cathode surface [Smit95]. Thus film stoichiometry
and growth at this area will be coherent because of the synchronized ion bombardment.
Substrates located away from this region will have smaller plasma density and incoherent
ion bombardment compared to the former region [Ohri92, Smit95]. The efficiency of a
sputtering process is measured by the sputtering yield, i.e. the number of ejected
molecules from the target surface per incident ion [Sigm78]. Since the angular
distribution of sputtering for Ni is higher than Ti, a characteristic loss of titanium is
somehow always present in the sputtered film [Otsu98, Mira09, Miya09.2]. These
compositional variations are dependent on many variables, e.g. sputtering rate and
angular flux of atoms ejected from the target and several attempts were done to
compensate for the titanium loss. It was shown that Ti-rich target [Quan96] or a variation
of the angle of sputtering can be used to [Ohri92, Smit95, Ichi84] to overcome this
problem.
Deposition of NiTi films using magnetron sputtering can be summarized in six
accumulative steps [Mira09, Ohri92, Smit95, Kell00, Sigm78] as follows 1) the ejected
molecules reach the substrate surface, lose their kinetic energy, and adsorbed on the
surface. 2) Adsorbed molecules diffuse into the substrate surface, and later integrate in
the film structure by finding the most active sites, or epitaxial sites. 3) Adsorbed species
react with each other and with the surface to form the bonds of the film. 4) After film
bonds are created, aggregation of film material starts which is known as nucleation and
growth. 5) After coalescence of the surface nuclei to form the film, nucleation phase is
completed and the development of bulk film structure, or morphology, takes place. As a
final point, 6) film and substrate diffusion interactions take place.
DC or RF
Ar
Ar
Ar
Ar
+
+
+
Anode
NiTi target (cathode)
Vacuum pump
Inert gas: N2 or Ar Ejected
atoms
Particle
collision
Substrate
Vacuum chamber
Magnet
Ar
ion
ion
lost
ions
Ejected
Ni ion
Ejected
Ti ion
Figure 31: Schematic of magnetron sputtering device after [Ohri92].

Chapter 2
37
The last step of deposition process depends significantly on the substrate temperature (T)
to the melting point of the sputtered material (Tm). Different models in the literature
describe the film's microstructure produced by magnetron sputtering based on the ratio of
substrate temperature to melting temperature of the deposited material (T/Tm) [Thor77,
Sig78, Mess84]. Thornton investigated the influence of the inert sputtering gas pressure
on the thin film's microstructure and created a 'structure zone model' (SZM) presented in
Figure 32 (a) and (b) [Thor86]. Table 4 presents a summary to the four zones and the
according mechanical and microstructural properties.
Z 1 Z T Z 2 Z 3
Ts/Tm
a)
Pressure (pa)s
m
T
T0.10.1
1
2
3
0.2
0.4
0.6
0.8
1Zone T
Zone 1
Zone 2Zone 3
b)
Figure 32: (a) Schematic representation of structure zone model. (b) Microstructural zone diagram for
metal films deposited by magnetron sputtering, after Thornton [Thor77, Thor86].
Table 4: Zone structures in sputter deposited films after [Thor77, Thor86, Smit95, Ohri92].
Zone T/Tm Microstructural characteristics Mechanical properties
Z1
< 0.1 at 0.15
Pa to < 0.5 at
4 Pa
Voided boundaries, densely
packed, and zone is highly affected
by substrate roughness
High hardness and
dislocation density
ZT
0.1 to 0.4 at
0.15 Pa, ~ 0.4
to 0.5 at 4 Pa
Fibrous grains, dense grain
boundary arrays
High dislocation density,
high strength, hard, and
brittle films.
Z2 0.4 to 0.7 Columnar grains, dense grain
boundaries, less defects than before Hard and low ductility
Z3 0.6 to 1.0 Large globular grains Low dislocation density
and recrystallized grains
2.5.2 UV lithography
The concept of UV lithography uses an external light source, e.g. ultraviolet light, to
transfer a geometric pattern from a mask, a glass plate with an absorber preferred Cr
pattern, to a photosensitive layer on a substrate surface. The process of UV lithography
includes several steps, illustrated in Figure 33. In the first step the photoresist is applied
either by dip, spin or spray coating methods, depending on the specimen layout and

2.5 Fabrication NiTi thin films
38
geometry. Since thin films produced in this work are sputtered on 4 inch wafers, spin
coating was utilized. During spin coating, the substrate holder spins rapidly spreading the
photoresist homogeneously on the surface, as seen in Figure 33 (b). After the spin coating
process, the photoresist still holds up to 15 % of the solvent which could hold built in
stresses. Therefore a pre-baking step is essential to evaporate the excess solvent in order
to eliminate stresses, harden the photoresist, and to promote adhesion of the resist layer to
the substrate [Mado11]. Prior to the exposure, the mask must be aligned relative to the
substrate. Afterwards, the photoresist film is subjected to UV light and the patterns are
chemically developed, see Figure 33 (e).
SubstrateFilm
Photoresist
UV source
a)
b)
c)
d)
Negative photoresist Positive photoresist
Pre-baking
Post-backing
e)
f)
Figure 33: Schematic drawing for the UV photolithography process illustrating (a) film deposition, (b)
photoresist coating on substrate, (c) soft back, (d) UV exposure, (e) photoresist development, (f) hard
backing, and finally photoresist removal.
Photoresists are categorized into positive and negative photoresists. The main difference
arises from the photochemical reaction that takes place during the UV exposure. For
negative photoresists, only the polymer chains which are subjected to the UV rays are
cross-linked and the rest of the polymer chains remain unchanged. In positive photoresist,
the exposed polymer chains decompose under UV rays and the rest remains unchanged.
During development, the non-cross-linked polymer chains of the negative resist are
dissolved and only the cross-linked resist remains, while for positive photoresist, only the
section that was not exposed to UV light remains and the rest decomposes during
development as seen in Figure 33 (e). In a following step the substrate is cleaned
(remaining photoresist) and finally a post-baking step is utilized to harden the photoresist,
as seen in Figure 33 (f).

Chapter 2
39
2.5.3 Wet etching
Etching is the process of removing a material layer by means of chemical or
mechanical processes. Etching processes are catalogued into dry etching and wet
chemical etching. In dry etching, the material is removed by means of a vapour phase
etchant, while in wet etching the material is dissolved when it is immersed into a
chemical solution [Mado11]. A simple wet etching process could be summarized by the
following steps: (a) transfer of the etchant to the surface to be etched, (b) selective and
controlled reaction between the etchant and the material to be removed, and (c) transfer
of the reaction by-products away from the reacted surface [Mado11]. Wet etching
processes have high etching rates which can be controlled by changing the temperature or
the concentration of the etchant species. In the etching process the lateral etch ratio is
defined as the horizontal etch ratio (Eh) divided by vertical etch ratio (Ev). The latter
determines the undercut dimension and defines the etch profile type as seen in Figure 34.
Table 5 shows a general comparison between wet and dry etching methods advantages
and disadvantages. In this work wet etching of sputter deposited NiTi structured with UV
lithography was utilized to attain freestanding thin films (see chapter 3.3).
Film layer
Mask
Perfectly isotropic etching
EL = 1
Perfectly anisotropic etching
EL = 0
Figure 34: The difference in lateral dimensions between isotropic and anisotropic etching.
Table 5: Comparison between wet etching and dry etching [Mado11, Jaeg01].
Wet Dry
Method Chemical Solutions Ion Bombardment
or Chemical Reactive
Environment
and equipment Atmosphere, Bath Vacuum Chamber
Etch profile Isotropic
(non-crystalline materials) Anisotropic
Advantages - Easy to employ
- High etching rate
- Isotropic or anisotropic
- Superior resolution, e.g.
feature size < 100 nm.
Disadvantage
- Particle contamination
- Poor process control
- Limited resolution
- High cost
- Hard to implement
- Potential radiation damage

2.5 Fabrication NiTi thin films
40
2.5.4 Fabrication of micropatterned freestanding films
By combining magnetron sputtering and UV lithography NiTi freestanding film were
fabricated using the process seen in Figure 35: (a) sputtering of a 5 µm Cu sacrificial
layer followed by a 2 µm NiTi thin film. (b) AZ1518 photoresist with a 2.3 µm thickness
was spin coated on the substrate followed by a soft backing step at 105 °C for 1 min.
Then the photoresist was patterned using UV lithography using soft contact mode with a
2 s exposure time. The resist was developed using AZ716 MIF solution for 60 sec. A
hard backing step was performed at 120 °C for 1 min. (c) Wet etching of the NiTi thin
film layer from step (a) using a HF based solution. (d) Selective wet etching of the Cu
sacrificial layer using BASF Selectipur Chromium Etch solution took place, forming
mushroom like structures which prevent growing film from being in contact, followed by
removal of the photoresist by acetone. (e) Deposition of NiTi film with desired thickness
using the same deposition parameters as in (a). (f) Wet etching of the remaining Cu
sacrificial layer using BASF Selectipur Chromium Etch solution to obtain freestanding
NiTi films with the desired thickness. (g) Color scheme for the elements in the figure
from (a) to (f). The process was developed by Dr. Rodrigo Lima de Miranda [Mira12].
NiTi
Cu
Photoresist
Substrate
a)
b)
c)
d)
e)
f)
g)
Figure 35: Schematic flow chart showing the NiTi thin film fabrication route employed in this work: (a)
sputtering of a Cu sacrificial layer followed by a NiTi thin film. (b) AZ1518 photoresist was spin coated on
the substrate followed by a soft backing step. Then the photoresist was patterned using UV lithography.
The resist was developed using AZ716 MIF solution. A hard backing step was performed. (c) Wet etching
of the NiTi thin film layer from step (a) using a HF based solution. (d) Selective wet etching of the Cu
sacrificial layer, forming mushroom like structures, followed by removal of the photoresist by acetone. (e)
Deposition of NiTi film with desired thickness using the same deposition parameters as in (a). (f) Wet
etching of the remaining Cu sacrificial layer. (g) Colour scheme for the elements in the figure from (a) to
(f).

Chapter 3
Experimental techniques
3.1 Standard characterization techniques
3.1.1 Differential Scanning Calorimetry - DSC
Differential scanning calorimetry (DSC) is a thermal analysis technique that examines
the material's heat capacity (Cp) as a function of the applied temperature. Figure 36 shows
a schematic drawing of the used DSC device.
Temperature controller
SampleHolder
Reference sample
Plotter
heater heater
Figure 36: Schematic drawing of differential scanning calorimetry device setup.
During the measurement a sample of a defined mass is subjected to a temperature cycle
and the changes in its heat capacity are recorded as changes in the heat flow taking place.
The technique requires a reference sample and a sample to be investigated. Both samples
are encapsulated in an aluminum pan. The reference sample and the investigated sample
are situated on different holders connected with temperature sensor. The latter set-up is
surrounded by a heating/cooling furnace. As the furnace temperature increases, the heat
flow difference between both samples is measured using thermocouples with respect to
the furnace temperature [Ande03]. Accordingly, a phase transition can be detected. DSC
measurements offer qualitative and quantitative information on endothermic and
exothermic heat transformations of materials. The latent heat can be acquired from the
area enclosed within the peak or valley in the DSC curve, see Figure 37. At a certain
temperature during transformation, the amount of heat is proportional to the volume
fraction of the transformed material [Ande03]. Figure 37 illustrates a schematic DSC
curve of a NiTi SMA film. During heating the exothermic phase transformation from the
austenitic to the martensitic phase generates additional heat due to the change in the
transformation enthalpy. On the other hand, the reverse transformation from martensitic
to austenitic phase is an endothermic phase transformation manifested by the absorption
of thermal energy. In this work a DSC device pryis 1 with cooling control accessory
CCA7 from the company Perkin Elmer was employed. DSC measurements were carried
out between -60 °C and 60 °C with a rate of 10 K/min and a specimen weight of 7 mg.

Chapter 3
42
Heat
flo
w (
mW
)
Temperature (°C)
Heating
Reverse transformation
Cooling
MT transformation
1
2
43
Transformation temperatures:
1. As : Austenite start
2. Af : Austenite finish
3. Ms : Martensite start
4. Mf : Martensite finish
Figure 37: Schematic drawing showing the heat flow curve of NiTi SMA film with martensitic
transformation temperatures indicated.
3.1.2 Scanning Electron Microscopy (SEM) and Energy Dispersive X-
ray Spectroscopy (EDX)
In this work, ULTRA Series Field Emission Scanning Electron Microscopes from
Carl Zeiss Microscopy combined with built in energy dispersive X-ray spectroscopy
(EDX: Oxford instruments INCA 3.04) were used for surface property investigation,
microstructure evaluation and fatigue failure analysis. To assure the reliability of the
measurements, a known sample of Ni50Ti50 at % was used as a reference material for
EDX measurements since a possible error can appear in the measurements due to the
TiOx passive layer on top on the NiTi freestanding thin films.
3.1.3 X-ray Diffraction (XRD)
X-ray diffraction (XRD) is a technique used to investigate the crystallographic
structure of materials. In materials, the atoms are separated by a lattice spacing (d). A
monochromatic X-ray beam with a wavelength of λ = Cu Kα is projected onto the
investigated material at an angle (θ). Material must be positioned in a certain way to
allow diffraction between the incident beams and reflecting planes of the material at an
angle (θ). Diffraction occurs only when Bragg's law is satisfied.
λ = 2dhkl · sin (θ) (3.1)
Where λ is the wavelength of the incident X-rays, dhkl is the interplanar spacing of the
plane described by the miller indices h, k and l, and θ is the angle of incident X-ray
radiation on the sample. After that, the diffracted beam is recorded by a detector. In this
work a Seifert XRD 3000 Pts with 4-Kreis-Gooniometer XRD system was used to
characterize the sputtered NiTi thin films. All measurements were done with Cu-Kα
radiation at a voltage of 40 kV and a current of 40 mA. A Ni filter and a monochromator
were used to guarantee that only monochromatic X-ray radiations were used during the
measurements. The XRD measurements were performed in an angular range between
25 ° - 80 ° and results were analyzed based on the data base presented in Table 6.

3.1 Standard characterization techniques
43
Table 6: Database on XRD measurements of NiTi thin films
20062.2401.496
21178.2601.222
11042.31002.111
hkl2θ (CuKα)ldhkl
NiTi- Austenite 18-899*
20062.2401.496
21178.2601.222
11042.31002.111
hkl2θ (CuKα)ldhkl
NiTi- Austenite 18-899*
21142.351.222
11042.822.11
hkl2θ (CuKα)Ldhkl
TiNi- R-phase(+)
21142.351.222
11042.822.11
hkl2θ (CuKα)Ldhkl
TiNi- R-phase(+)
02260.327261.533
02145.186262.005
00243.915542.06
02039.222542.295
11144.926942.016
1-1142.3641002.181
hkl2θ (CuKα)ldhkl
NiTi- Martensite 35-1281*
02260.327261.533
02145.186262.005
00243.915542.06
02039.222542.295
11144.926942.016
1-1142.3641002.181
hkl2θ (CuKα)ldhkl
NiTi- Martensite 35-1281*
hkl2θ (CuKα)ldhkl
23254.757151.675
20240.133152.245
53278.304201.22
42262.304201.489
31249.353201.845
13137.636302.388
12243.211002.092
Ni4Ti3-39-1113*
hkl2θ (CuKα)ldhkl
23254.757151.675
20240.133152.245
53278.304201.22
42262.304201.489
31249.353201.845
13137.636302.388
12243.211002.092
Ni4Ti3-39-1113*
* From power diffraction file database (1994)
+ Hwang et al., Stressed in situ X-ray diffraction studies of NiTi
shape memory alloy, Mat.Res. Soc. Symp. Proc., Vol. (276)
3.1.4 Transmission Electron Microscopy (TEM)
In TEM, electrons are emitted from an electron gun to illuminate very thin specimens.
The transmitted electrons create an image which is subsequently magnified by a number
of electron optical lenses. TEM have different imaging modes, for example, bright field
(BF) mode and dark field (DF) mode. In bright field mode the directly transmitted
electron beam is used to form the image. In dark field imaging mode the scattered
electrons are used to produce the image. NiTi thin film samples with 15 - 20 nm
thickness were analyzed using Technai G²-F30 ST from FEI. It has high resolution ability
at nanometer level with information limit of 0.014 nm and scanning transmission electron
microscopy (STEM) resolution of 0.019 nm. The TEM samples were produced using a
Focuses Ion Beam (FIB) technology equipped in a FEI scanning electron microscope -
Helius. In this work TEM was used to investigate the film crystalline by selected area
electron diffraction (SAED), chemical composition, precipitates size, precipitates
distribution, and the current phases of NiTi freestanding thin films. The TEM
examinations were carried on by Dr. Ulrich Schürmann and M.Sc. Burak Erkartal. FIB
cut were produce by Dr. Christiane Zamponi.
3.1.5 Atomic Force Microscopy (AFM)
Atomic Force Microscopy (AFM) is a tool used to investigate the material topography
by means of a small sharp tip mounted at the free end of a cantilever. During
measurements the tip is dragged with constant force along the specimen and different
forces (repulsive or attractive) are generated leading to cantilever deflection. The beam
deflections are recorded by laser beam reflection from the backside of the cantilever free
end [Lang04]. In this work, atomic force microscope from the company Autoprobe-CP-
Research thermomicrscopes was used to investigate surface and edge roughness of the
freestanding NiTi thin films. Films were tested at room temperature with a scan
frequency of 1 Hz and a scan area of 10 microns.

Chapter 3
44
3.1.6 Tensile test
Tensile testing is a material testing method in which a specimen, e.g. dog bone shape,
undergoes uniaxial tensile force till fracture occurs. Different material properties can be
identified such as: material ductility, ultimate tensile strengths, young's modulus, yield,
and the critical stress. Tensile testing of NiTi freestanding thin films was carried out in a
universal tensile test device (Messphysik UTM Beta EDC 100N) equipped with
temperature controlled chamber (Shimadzu TCL-N382). Material superelasticity was
measured at 37 °C. A pre-load of 0.4 N was applied and a constant strain speed of 0.4 %
per minute was employed in the test. Thus the tensile tests were conducted at 37 °C to
stimulate the human body temperature.
3.1.7 Fatigue test
In order to investigate the fatigue characteristics in NiTi freestanding thin films a
fatigue test machine was specially designed for that purpose. The fatigue test device was
equipped with a temperature controlled chamber, a piezoelectric actuator, a double row
ball bearing linear stage, a heating unit, an oscilloscope, and a load cell. The overall
fatigue setup and a close up zoom on the dog bone specimen are illustrated in Figure 38
and Figure 39 respectively. A fatigue rated ALF-Z3956 load cell with extended fatigue
life was manufactured by the company ALTHEN Mess-und Sensortechnik based on the
design requirements requested. The load cell had an aluminum casing structure with a
standard load ranges from 0 to ± 200 N calibrated in tension-compression loading modes.
The load cell had a sensitivity detection range normalized to ± 0.1 mV/V, equal to
0.01 N, and a load cell power supply of ± 10 V. The working frequency limit of the load
cell is 1000 Hz and the working temperature limit is from -10 °C to + 60 °C. Due to the
low signal acquired from the load cell in the mV range, a strain gauge amplifier SG-KS-
12E/24E was used. Both load cell and amplifier were calibrated by the manufacture and
once again after integration in the fatigue setup. The calibration done in temperature
between 15 to 50 °C showed a signal error of almost 11 % in the load cell reading. This
high signal error was related to the overheating of the aluminum load cell housing in
contact with the metallic frame. To overcome this problem, a special polymeric housing
was designed to minimize the over-heating effects. After a second calibration, the fatigue
setup signal, from actuator, load cell, and amplifier showed a signal error of 1 % ± 0.5 %
which yields a measurements accuracy of 98.2 % when fully loaded. A modified P-601
piezoelectric actuator from the company Piezo Nano Positioning was used in this work to
execute tension-tension loading of the NiTi dog bone sample. The piezoelectric actuator
had the following features: a vertical travel range of ± 400 µm, step resolution in the
nanometer range, resonant frequency of 300 Hz, and a lateral force of 30 N. In addition, it
has a repeatability range up to 8 nm, a sine wave cycle testing speed at 2 m/s, and an
operating temperature range of -20 to 80 °C. The actuator control unit consisted of an E-
802 servo-controller submodule, E-801 sensor submodule, and an E-509 position control
unit. Furthermore,the control units were purchased from the company Piezo Nano
Positioning. Due to the nature of the piezoelectric elements, high numbers of working
cycles (N≥107) at different test frequencies are possible with nanometer stroke precision.
A ceramic heating unit, of 14 x14 cm from the company Krieger was used to heat the
chamber. In addition a motorized fan, 7 cm in diameter, was used to provide laminar flow
of hot air in the test chamber. The direct actuator signal after amplification was
monitored using a TFS 1002 oscilloscope from the company Tektronix. All mentioned

3.1 Standard characterization techniques
45
components in the fatigue device were controlled using a Labview program. When
analyzing fatigue curves of different metals a scatter in fatigue data is always found. This
scatter is seen along the σ-Nf curve as a deviation in the number of cycles to failure at
different applied stress amplitude for the same sample. Fatigue test requires a sufficient
number of measurements to construct the fatigue life diagram of a material, e.g. a
minimum of 3 samples should be tested at each point in the σ-Nf curve [Sure98, Calli06,
Lamp96, Wulp66].
Actuator control
unit
and sensor
DAQ card, signal processing
Load cell amplifier
Oscilloscope*
Load cell in polymer housing
Piezo actuator
Heating
unit
Power supply for heating unit and motorized fan
Figure 38: The fatigue test setup system developed in this work for the fatigue investigation of
freestanding NiTi thin films. The setup components are: piezo actuator, micrometer table, load cell in
polymer housing, actuator control unit and sensor, load cell power supply, heating unit, oscilloscope
(*image from Tek.com), motorized fan, load cell amplifier, and DAQ card for signal processing.
dog bone sample
motorized fan
holding
grips7 mm
R 1.5 mm
a) b)load cell
piezo
actuator
Figure 39: (a) 3D schematic drawing of the fatigue set up showing the actuator and the load cell layout, (b)
a close-up zoom on the grips and the dog bone specimen configuration.
Figure 40 (a) demonstrates the main regions of the stress-strain plateau at which the
fatigue investigation was carried out. The main steps of the fatigue test are as follows:
NiTi dog bone film is loaded in the fatigue setup at a chamber temperature of
37 °C. Then the dog bone thin film is preloaded with 0.2 N.

Chapter 3
46
The film is strained at (a) elastic region, or (b) superelastic region, or
(d) martensitic elastic region, or at (d) the plateau region upon unloading.
At the desired regions, fatigue test start by applying a periodic strain amplitude
between 0.25 % to 3.0 %.
Finally test was stopped when the sample fracture or a run out time of 10 million cycles
(fatigue endurance limit) is reached. Figure 40 (b) illustrates a schematic example for an
actual fatigue testing at the superelastic regions using the setup developed in this work.
Strain (%)8%
1: Elastic region
2: Superelastic region
3: Martensitic elastic region
4: Unloading of plateau
3
Onset of the stress-induced martensite transformation
4%0
Mean strain (%)
1
2
4Str
ess (
MP
a)
a) b)
1: Elastic region
2: Superelastic region
Onset of the stress-induced martensite transformation
4%
Strain amplitude
0
1
2
Str
ess (
MP
a)
Figure 40: Stress- Mean strain plateau showing the main regions of NiTi superelastic plateau: (1) elastic
region, (2) superelastic region, (3) martensitic elastic region, and (4) plateau upon unloading. Fatigue test
starts by preloading the sample with 0.2 N, then a desired mean strain is applied to reach a certain region of
stress-strain plateau, and finally tests starts by applying a strain amplitude between 0.25 % to 3.0 % till
sample fracture or run out time is reached, as illustrated in (b). The test temperature was 37 °C to simulate
the average human body temperature.
3.1.8 Electropolishing
Several methods are being utilized to remove surface irregularities and to clean or
optimize the NiTi surface after production or when it is required, i.e. regular maintenance
of components. These polishing methods are mechanical, chemical, and electropolishing
(EP). Even though a mechanical polishing produces a flat surface topography, it requires
high work input and is considered as time consuming process. Chemical polishing
involves the use of dangerous chemicals at high temperatures, e.g. hydrofluoric acid, and
it has a low etching rate depending on the etched material. Also the etching rate can be
reduced progressively as etching time increases since saturation of the etching solution
might occur. A good solution to both mechanical and chemical etching problems is the
electropolishing technique. The latter technique can polish and passivate the substrate
surface at the same time even at room temperature. During electropolishing, the NiTi
sample (anode) is connected to a positive DC power supply connecting node, while the
negative node of the power supply is connected to another electrode (cathode). Both
anode and cathode are electrically connected and mounted in a glass container filled with
a certain electrolyte solution. As soon as a voltage is applied, metal of the positive
electrode (NiTi film) is separated and suspended in the electrolyte. Accordingly the metal
ions are transferred into electrolyte solution and then deposited on the cathode. The
following equation summarizes general scheme for EP of NiTi when a voltage is applied
between the electrodes:

3.1 Standard characterization techniques
47
1) TiOx → Ti + Ox (2.4)
2) NiTi → xNi + xTi + by-products (x depends on the alloy's chemical composition)
electropolishing by-products are found in the electrolyte such as: cations (Ti+, Ni
+) and
anions ( e.g. SO4-) if H2SO4 acid is used or NO3
- if nitric acid is used.
The EP process is summarized in the anode polarization curve as illustrated in Figure
41 (b). The latter plots current density versus the applied system voltage as represented in
Figure 41 (b). At low voltages, illustrated by the A-B segment, no current flows between
electrodes and EP does not start. At higher voltages, illustrated by the B-C segment, EP
takes place. Yet this is not the optimum etching rate of the component since a low etching
rate is applied which can take several working hours if not days. An optimum EP process
takes place in the region where current density stays constant, regardless of applied
voltage, in the region between D-E. Any voltage applied above point E will lead to the
formation of pitting holes at the anode surface due to rapid current density amplification.
The electropolishing of NiTi films yield a uniform passive layer of TiOx which has a
large positive effect on the NiTi biocompatibility as described in previous chapters. After
electropolishing the corrosion resistance and the surface reflectivity are significantly
enhanced. In general, electropolishing of NiTi films is a significant surface finish step
that has to be considered in NiTi production and process optimization of different
applications [Maga93, Sojt10].
Voltage (V)
Cu
rre
nt
de
ns
ity
(A
/dm
2)
a) b)
A B
C
D E
NiTi
film
Platinum net
0.1mm x 2cm x 2cm
Mulitimeter
device
Mulitimeter
device
Electrolyte: acid + alcohol
Stirring rod
+ -Anode Cathode
0
Figure 41: (a) Electropolishing setup used to mimic commercial electropolishing systems, (b)
electropolishing anode polarization curve which plots current density against applied voltage and
corresponding chemical reactions that take place during (EP) after [Jone96].
In this work, the electropolishing setup seen in Figure 41 (a) was developed and used
to electropolish NiTi freestanding thin films in the optimum EP region (D-E) as descried
earlier. The cathode used is a platinum mesh of 0.1 mm in thickness and a 2 x 2 cm in
dimension. The cathode and anode were suspended with copper wire plated with an
isolating layer to prevent galvanic corrosion between electrodes and connecting wires.
The chemical etching of the NiTi thin film was carried out using two different
electrolytes. Solutions (A) composed of a sulphuric acid 96 % and a methanol 99.5 %
with 1:4 in volume ratio bought from Roth GmbH and (B) composed of nitric acid 96 %,
from Fluka GmbH Germany, Perchloric acid, from MicroChemicals GmbH, and distilled
water in the following volume ratio 1:4:2, respectively. A DC power supply supplying a
voltage of 0-12 V was used depending on the anode to cathode distance. The current

Chapter 3
48
density values were in a range of 50 to 100 mA/cm2. The electropolishing process was
conducted at room temperature under a fume extraction hood and a magnetic stirring rod
was utilized within the electrolyte for the purpose of uniform electropolishing. The aim of
this work is to identify the basic process parameters to electropolish NiTi freestanding
thin films. Other electropolishing parameters such as anode to cathode area, stirring
speed, and electropolishing at different temperatures were not investigated in this work.
3.1.9 Biocompatibility test
The biocompatibility investigations were conducted on the dog bone freestanding
films, see Figure 39 (b). The latter had a surface area of 39 mm3. REF52 cells (rat
embryonic fibroblast) were utilized in the tests. Cells were cultured in medium
(DMEM+10%FBS+1% antibiotics) (DMEM: Dulbecco’s modified eagle medium, FBS:
fetal bovine serum, antibiotics: penicillin & streptomycin) at 37 °C in atmosphere of 5 %
CO2 and 90 % humidity. Cells were passaged every 2-3 days before they reached
confluency. The biocompatibility experiment on the NiTi film surface was conducted as
follows: NiTi films were put into 6-well plates, sterilized in 70 % ethanol, and washed
with 1×PBS. For a 4 hours test, 20000 cells per well were seeded. For 1, 3 and 7 days
tests, an amount of 2000 cells per well were seeded. On the 3rd day, a fresh medium was
used to replace the medium used for the 7 days incubation test. Due to the fact that the
NiTi film is not transparent, calcein was used to stain the cytoplasm of livig cells,
propidium iodide (PI) was used to stain the nucleus of dead cells. The staining technique
can produce excellent imaging of the cells. The cell staining was conducted as follows:
Calcein (1μg/ml) in DMEM stain for 10 min at 37 °C. After PBS washing twice with
PBS, PI (4μg/ml) in DMEM stain for 10min at 37 °C. Then 3 times washing was
performed and cell images were taken and the cell number was counted. Figure 42 (a)
illustrates the cells before staining and (b) after staining. All the biocompatibility tests
were performed by 'Biocompatible Nanomaterials' group in the University of Kiel by Dr.
Saskia Viebig, and M.Sc. Qian Li under the supervision of Prof. Christine Selhuber-
Unkel.
a) b)
200 μm200 μm
Figure 42: (a) Cell growth observations without cell staining using phase contrast microscopy. The cells
had bad contrast due to the reflective NiTi film surface and cell counting was not possible. (b) The cells
after staining with fluorescent dye; the cell area is identified clearly and cell counting is possible.
3.1.10 Ni ion release test
To further support the biocompatibility tests, samples with different surface
treatments were immersed in PBS solution (salt solution similar to human body fluids)
acquired from 'Roth GmbH' company in Germany. The Ni ion release from the different
films was measured using inductively coupled plasma mass spectrometry (ICP-MS)

3.1 Standard characterization techniques
49
which measures metallic and non-metallic ions concentration in solutions. The ICP-MS
utilized a CRM (certified reference material) NIST 1643e and has 0.2 µg/l lower limit of
quantification. All the Ni ion release tests were conducted in the Marine climate research
center at the incertitude of Geosciences by Dr. Dieter Garbe-Schönberg and Dipl.-
Ing.Ulrike Western-ströer.
3.1.11 Polarization microscope
Surface investigations of the freestanding films were performed by with an optical
polarization microscope Zeiss AXIOMAT with a 16x Zeiss objective and a Hg white
light source. A Hamamatsu Digital CCD camera ORCA C4742-95-12G04 was used to
register images. The measurements were performed by Dr. Mikhail Kustov from the
'Nanoscale Magnetic Materials - Magnetic Domains' chair in the University of Kiel.
3.2 Thin film fabrication techniques The following section illustrates the main steps of NiTi thin film production process.
All films produced in this work were fabricated and processed at 'Kieler Nanolabor' clean
room facility.
3.2.1 Magnetron sputtering
In this work freestanding NiTi films were sputter deposited at room temperature by an
Alcatel 450 magnetron sputtering unit with the deposition parameters listed in Table 7.
The sputtering unit is composed of a main sputtering chamber with three 4 inch targets of
Cr, Cu, and NiTi. The NiTi used in this work was cast melted at the Mechanical
Engineering Department at the University Bochum [Fren04]. The distance between target
and substrate can be modified between 4.3 cm and 10 cm accordingly. The base pressure
of the vacuum chamber during sputtering was kept approximately at 1x10⁻⁷
mbar.
Previous work shows that the deposition homogeneity, film stoichiometry and the sputter
rate are dependent mainly on the sputtering power, target composition, and the target to
substrate distance [Mira09]. Therefore, the sputtering parameters were adjusted
accordingly to acquire NiTi films with nearly equiatomic composition sputtered on a 4
inch silicon wafer. The NiTi films were sputtered on a silicon substrate with surface
roughness below 1 nm.
Table 7: Sputtering parameters used in this study
Sputtering parameters P (1) P(2)
Target composition Ni45.6Ti54.4 Ni45.6Ti54.4
Sputtering power (W) 500 W 300 W
Target to substrate distance (cm) 5.3 cm 4.7 cm
Sputtering pressure (mbar) 2.3 x 10⁻³
mbar 2.3 x 10⁻³
mbar
Argon flow (sccm) 20 sccm 20 sccm
Sputtering rate (nm/sec) 4.4 nm/sec 3.8 nm/sec
Film thickness (µm) 37 ± 3 µm 37 ± 3 µm
Final film composition at the substrate center 50.9 ± 0.5 at% Ni 50.3 ± 0.5 at% Ni

Chapter 3
50
3.2.2 UV lithography
UV lithography exposure and transfer of the dog bone desired pattern was carried out
by a Karl Suss mask aligner (MJB4). The mask aligner equipment includes a UV Hg
lamp (200W) which generates a homogeneous intensity of 33 mW/cm2 over a circular
area of 100 mm (in diameter). The intensity of the lamp was measured using an intensity
meter Model 1000 from Suss-Micro-Tec Company.
3.3.2 Rapid Thermal Annealing (RTA)
Ex situ heat treatments of freestanding NiTi films were performed in a rapid thermal
annealing (RTA) system at 10-8
mbar, developed by Createc Company. The RTA system
enclosed a halogen lamp that provided a 50 K/s heating rate. After sputtering, ex situ
crystallization of films was utilized by means of RTA. The freestanding NiTi films were
heat treated using two main annealing steps. The first annealing step aimed to crystaline
the amorphous films, while the second annealing step (aging) intended to adjust and
control the martensitic transformation temperatures by forming Ni4Ti3 precipitates.

Chapter 4
Results and discussion
4.1 Film characterization As mentioned in section 2.1.3, the Ni content has a major influence on the SMAs
mechanical properties and hence it might affect their fatigue characteristics. In addition, a
variation in the film stoichiometry might occur during sputtering of NiTi films because
both Ni and Ti have a different sputtering yield and angular distribution during
sputtering, see chapter 2.5.1. Therefore, this chapter aims to examine stoichiometry of the
sputtered films and investigate the influence of Ni content on the freestanding NiTi films
fatigue characteristics.
The constant stoichiometry of the sputtered films is an essential aspect to guarantee
the reproducibility and the reliability of the test results. The sputtering parameters were
adjusted accordingly to acquire films with different composition, see in chapter 3.2.1.
The sputtered films as well as the targets were characterized using EDX.
Figure 43: (a) EDX characterization of the target material used. Figure (b) EDX characterization example
of the film stoichiometry variation in atomic percentage at the center of the substrate for figure (d), the
figure demonstrates a uniform film stoichiometry within 40 mm diameter. Figure (d) and (c) EDX
characterization showing the Ni composition variation in at% on the substrate after 10 min free sputtering
for P(2) and P(1) respectively.

Chapter 4
52
Figure 43 (a) illustrates the result of the EDX measurement of the used target material
showing the amount of Ni and Ti, respectively, in atomic percentage across the target.
Figure 43 (b) represents an example on the film stoichiometry variation along the 4 inch
substrate for figure (d).
Figure 43 (c) and (d) show the variation of the film stoichiometry for P(2) and P(1)
parameters from Table 7 from chapter 3.2.1, respectively. The EDX investigation along
the X and the Y axes of the films at P(1) and P(2) sputtering parameters shows a constant
film stoichiometry inside a diameter of 40 mm and an increase in the Ti content as the
radius increases. This variation in film stoichiometry occurs due to the difference in the
sputtering yield and the differential angular distribution of Ti and Ni during sputtering, as
mentioned earlier. Therefore all samples used in this work were taken from the 40 mm
region with constant stoichiometry to ensure the reproducibility and the reliability of the
test results.
To further investigate the dependence of the film stoichiometry on the target life,
17 silicon wafers were sputtered in a row using the P(2) parameters. A micropatterned
dog bone film was taken from the center of each wafer, then EDX scan were performed
on each film from the 17 wafers and the average was plotted. The maximum error bar of
the EDX measurements was 0.5 % at Ni. Figure 44 (a) shows the Ni atomic percent
versus the target life of the sputtered films. Figure 44 (b) shows the dog bone sample
location on the wafer used in the EDX measurements, the sample was taken from the
40 mm diameter with constant stoichiometry. The EDX results showed a stable film
composition with insignificant change in the film stoichiometry. Thus, it can be
concluded that the sputtering process is reproducible, throughout the target life, using the
same sputtering parameters. Since the film stoichiometry showed an insignificant change,
the expected Af after annealing the films should have similar values.
Figure 44: (a) Ni atomic fraction versus target life of films sputtered using P(2), (b) EDX characterization
showing the location of the micro dog bone specimen on the substrate utilized in this test.
4.1.1 Ex-situ crystallization
Heat treatment of the NiTi films is an important parameter that controls the overall
material features, e.g. martensitic transformation temperatures, the formation of
precipitates, and the general mechanical properties. In order to explore and comprehend
the influence of the heat treatment on the film microstructure and the corresponding
mechanical properties, three different heat treatments were tested. In this experiment the
NiTi films were annealed using two annealing steps as illustrated in Table 8. As

4.1 Film characterization
53
mentioned in chapter 2.1.3, NiTi SMAs crystallization occur around 500 °C [Buch90].
To ensure a complete crystallization of the sputtered films, the films were annealed at
650 °C degree. Subsequent to the first annealing step, the films were further annealed at 3
different aging times. The austenitic finish temperature (Af) was determined for each heat
treatment using the DSC, see Table 8. Figure 45 shows an example of the DSC analysis
result of NiTi film sputtered using P(2) parameters from Table 7 and annealed using
HT(3) from Table 8. When the film is cooled down from room temperature, the austenitic
to martensitic phase transformation starts at - 43 °C until a full martensitic phase is
reached at -52 °C. When the film is heated the martensitic phase starts to transform back
to the austenitic phase at 13 °C until it reaches a full austenitic phase at 18 °C.
Table 8: Heat treatments (HT) time, temperature, and austenitic finish temperatures of annealed films.
Annealing Aging Af
Temperature
(°C)
Time
(s)
Temperature
(°C)
Time
(s)
Temperature
(± 2 °C)
HT(1) 650 300 450 300 10
HT(2) 650 300 450 600 14
HT(3) 650 300 450 900 18
Figure 45: (a) Typical DSC analysis of NiTi film transformation temperature peaks
To assist the microstructural and crystallization investigations of the annealed films,
TEM samples were prepared by means of focused ion beam (FIB). The films were
sputtered using P(2) parameters and the FIB cuts were prepared from the freestanding
films. Figure 46 displays a cross section of (a) as deposited film, (b) crystalline film
annealed using HT(2) with their TEM SAED. Figure 46 (a) SAED patterns shows
diffused rings without any sharply defined spots. This suggests that the structure of the
thin film is amorphous at room temperature. Figure 46 (b) corresponding diffraction
pattern underlines that the investigated film sample had a polycrystalline structure
identified by the diffused rings with sharply defined spots. Moreover, the film had a

Chapter 4
54
complete heterogeneous nucleation in the matrix where a full film crystallization took
place.
Figure 46: Film cross section realized by Focus Ion Beam for films sputtered using P(2) from Table 7.
(a) Amorphous film and (b) crystalline film annealed using HT(2) from Table 8. The black dots in figure
(a) are due to sample processing (FIB).
The activation energy of crystallization was determined through the use of Kissinger
equation discussed in chapter 2.1. The films were crystallized at different heat rates in the
DSC system and the exothermic peaks of the DSC curves were recorded to obtain the
crystallization temperatures needed to calculate the activation energy, see chapter 3.1.1.
Figure 47 illustrates the activation energy dependence on the applied heating rate and the
corresponding crystallization temperature change for the amorphous films. Each heating
rate was applied within a temperature interval of 300 °C to 700 °C in the DSC system.
The results show that the NiTi films had activation energies between 315 to 410 KJ/mol,
which is comparable to previous work done on near equiatomic NiTi films [Zhang06].
The results also show that the activation energy is inversely proportional to the applied
heating rate. This means that the crystallization of amorphous films require less energy at
higher heating rate. In addition, it is well known that the average grain size decreases
with increasing the heat rate [Lee05], thus better mechanical properties can be achieved
at higher heating rates. In the RTA system, the heating rate used to crystallize the films
was 50 K/s. Moreover, Figure 47 shows that the crystallization temperature of the films
increases with increasing the heat rate. This occurs because at higher heating rates the
energy needed for crystallization is delivered at higher temperatures in the DSC system
(high heat ramps lead to a shorter heating time). While at lower heating rates, lower
heating ramps at longer times are applied and the energy needed for crystallization is
delivered at lower temperatures. The results in Figure 47 show that the crystallization
temperatures start to stabilizes, at high heating rates, around 500 °C. This supports the
TEM investigation that a full crystallization is reached above 500°C, see Figure 46 (b).

4.1 Film characterization
55
Figure 47: Activation energy dependence on the different heating rates, and the corresponding
crystallization temperature change of amorphous NiTi thin films. The films were sputter using P(2)
parameters.
To understand the influence of the heating rates on the final grain size, amorphous
NiTi films were heated from 300 °C to 700 °C in the DSC system at 10 and 90 K/min
heating rates. The films were sputtered using the P(2) from Table 7. Cross-section
micrographs were prepared by means of graining and wet etching. In the first step, the
NiTi film was joined to an aluminum holder using adhesive glue, then the films was
grained down to 0.05 µm roughness. Afterward, the film grain boundaries were etched
using a HNO3/HF solution for 60 sec. The micrographs were examined using an optical
microscope and the average grain size was determined using the intercepted-segment
method [ASTM96]. Figure 48 (a), shows an example of an AFM scan for the NiTi grains.
a)
10 μm 10 K/min
90 K/min5 μm
10 μm
b)
c)
Figure 48: (a) A typical AFM scan micrograph of NiTi film sputtered at P(2) and crystallized by heating
the amorphous films in the DSC system from 300 °C to 700 °C at 10K/min. Figure (b) and (c) illustrates
the grain size dependence on the applied heat rate in the DSC system at 90K/min and 10 K/min,
respectively.

Chapter 4
56
The figure shows that the crystallization of the NiTi film leads to a spheroidal grain
growth which refers to a polymorphic crystallization. Figure 48 (b) and (c) illustrate the
resulting grain size after crystallizing the films at 90 and 10 K/min heat rates,
respectively. The results show that the NiTi film exhibits an average grain size of 5.2 µm
at 90 K/min heating rate and an average grain size of 7.3 µm at 10 K/min heating rate. A
cross-section micrographs of NiTi film annealed in the RTA system using HT(2) showed
an average grain size of 3.8 ± 0.2 µm. It is well known that the reduction of grain size is
extremely effective for improving the pseudoelasticty in NiTi shape memory alloys
[Otsu98]. Therefore, the reduction in the grain size by means of sputtering and
subsequent annealing using the RTA system present a great advantage in this thesis. The
improvement arises from the small grain size compared to commercial NiTi wires which
has an average grain size of 15.6 µm [Mira12].
In order to investigate the thermo-mechanical behaviour of the NiTi films, a number
of films were sputtered using the P(2) sputtering parameters and annealed at HT(2) from
Table 7 and Table 8, respectively. A tensile test was carried out at different test
temperatures, from 28 °C up to 70 °C. The test took place for a maximum number of nine
cycles below 6.5 % strain in a closed loop hysteresis. Between each cycle a 10 min stop
time was introduced to prevent the self-heating of the film. The stress required to induce
the martensitic transformation and the phase transformation strain were obtained from the
stress-strain curves. Figure 49 (a) shows the superelastic plateau of the film during the
nine cycles and (b) shows the yield stress of the superelastic plateau plotted against the
test temperature.
Figure 49: (a) Temperature influence on the superelastic plateau of the freestanding NiTi thin films, films
were sputtered using P(2) parameters and annealed at HT(2) conditions. (b) The enthalpy of the martensitic
transformation start stresses versus the test temperature.
In the latter plot, a linear fit was generated for the straight line. The enthalpy of the
martensitic transformation was calculated from the slope of this fit. The increase in the
plateau stresses is linear with the applied test temperature and is following the Clausius-
Clapeyron relation. The linear increase in the plateau stresses as the test temperature
increases can be explained as follows: as test temperature increase above the Af the
thermodynamic stability of the austenitic phase increase. Consequently more stress is
required to induce the martensitic transformation. Another explanation to the shift in the
plateau stresses might be due to film suffering from cyclic hardening. Also, when the

4.1 Film characterization
57
loading stress is increasing, the martensitic volume fraction increases. As the number of
cycle's increases, dislocations will appear. As a result the martensitic transformation
occurs at higher stresses and more energy is needed to rearrange martensitic variants.
4.1.2 Ni4Ti3 precipitations
Ni4Ti3 precipitates have a significant effect on the characteristics of martensitic
transformation, see chapter 2.1.3. It was reported that the size and the amount of the
precipitates can alter the chemical compositions of the matrix, change the martensitic
transformation temperatures, hinder dislocation motion, and influence increase the shape
memory effect [Nish86, Zhou05, Jkim05]. This chapter is aimed to investigate the
formation of Ni4Ti3 precipitates in the Ni rich NiTi films as a result of different heat
treatment used in Table 8. In addition, TEM investigations were conducted to investigate
the precipitates' size and related aging time effect on precipitates formation. All films
were sputtered using the P(2) parameters from Table 7 and annealed using the three heat
treatments in Table 8.
To identify the type of precipitates present in the films, XRD scans were performed on
the freestanding films subjected to the different heat treatments. The XRD patterns in
Figure 50 show that the films are crystalline and the Ni4Ti3 precipitates peak is present at
43.2°. Furthermore, as the annealing time increases an increase in the Ni4Ti3 precipitates
peak was noticed.
Figure 50: Influence of the annealing time on the crystallization process of freestanding NiTi thin films.
XRD patterns showing an increase in the peak corresponding to the Ni4Ti3 precipitates as aging time
increases, in support of the TEM investigations.
In addition, EDX elemental mappings were performed on the samples, see Figure 51. The
mapping shows the elements Ni, Ti, O and Pt in the film, whereby the latter two
introduced in the film during the FIB processing. The EDX data showed no metallic
inclusions or other elements present in the film matrix other than the ones mentioned
earlier. Due to the limitations in spatial resolution no distinct TiOx layer could be
identified by EDX. XPS investigations were performed to identify the chemical
composition of the TiOx layer (see chapter 4.4).

Chapter 4
58
50 nm
50 nm
50 nm
50 nm
Ti
O
Ni
Pt
500 nm
Figure 51: EDX mapping of NiTi thin film sputtered using P(2) and annealed at HT(2). The mapping
shows the elements Ni and Ti in the film, additional O and Pt mapping were performed.
TEM bright field images were taken for the film microstructure. Figure 52 (a) shows a
TEM bright field image example of a film containing Ni4Ti3 precipitates. The figure
indicates that the Ni4Ti3 precipitates are uniformly distributed in the film matrix. In
addition, the figure shows that the film matrix is saturated with Ni4Ti3 precipitates and
the precipitates formation continues at the grain boundary. An ellipsoidal shape of the
precipitates was assumed and their diameter and thickness were determined by the TEM
investigation software.
100 nm
t
d
500 nm
a)b)
Figure 52: (a) TEM bright field image of the Ni4Ti3 precipitates in NiTi thin film, (b) the different titling
orientation in the TEM showing the difference between precipitates thickness (t) and the precipitates
diameter (d) used to measure the particle size distribution. The film was sputtered using P(2) parameters
and annealed using HT(3).

4.1 Film characterization
59
Figure 52 (b) show the different tilting orientation in the TEM showing the difference
between precipitates’ thickness (t) and the precipitates’ diameter (d). TEM bright field
images and selected area electron diffraction (SAED) patterns are displayed in Figure 53.
The corresponding precipitates size in the NiTi films annealed at HT(1), HT(2), and
HT(3) are displayed in Figure 54. The latter figure shows that the size of the precipitates
increases with increasing the aging time. The average grain sizes of the Ni4Ti3
precipitates during the three annealing conditions are 16 nm, 21 nm, and 28 nm,
respectively. The particle size distribution data had a standard deviation of ~ 2 nm. In
addition, the TEM investigation showed that the number of precipitates increase as the
aging time increases. This is in accordance with the literature, where it was found that as
the annealing time increases, the Ni4Ti3 precipitates number and size increases [Alla02].
a) b) c)
16 nm 21 nm 28 nm
Figure 53: TEM bright field image and selected area electron diffraction (SAED) patterns of 50.3 at% Ni
films. The films were annealed at (a) HT(1), (b) HT(2), and (d) HT(3). A magnified image is displayed in
the appendix.
Figure 54: A plot showing the precipitates size versus the aging time used in heat treatments in Table 8.
Further investigations were conducted to analyze the dependence of the austenitic
finish temperature and the maximum strain at fracture on the aging step is presented in
Figure 55. The films in this experiment were annealed using two different annealing
steps. The first annealing step (crystallization step) was kept constant once at 650 °C for

Chapter 4
60
05 min and once at 600 °C for 05 min. The second annealing step was at 450 °C and the
aging time was varied, as illustrated in Figure 55.
Figure 55: (a) and (b) NiTi films sputtered using P(1) parameters from Table 7. Figure (a) films were
annealed at 600 °C for 05 min and 450 °C from 0 to 120 min. The films in figure (b) were annealed at
650 °C for 05min and 450 from 0 to 120 min. The NiTi films in figures (c) and (d) were sputtered using
P(2) parameters from Table 7. The films in figure (c) were annealed at 600 °C for 05 min and 450 °C from
0 to 120 min. The films in figure (d) were annealed at 650 °C for 05min and 450 for X min.
Figure 55 (a) and (b) NiTi films were sputtered using P(1) parameters from Table 7,
while Figure 55 (c) and (d) shows NiTi films sputtered using P(2) parameters from Table
7. It is very important to note that NiTi films employed in medical applications should
have an austenitic finish temperature below the body temperature, i.e. NiTi films should
be superelastic at the body temperature. Thus it is significant to have annealing
conditions which yields Af < 37 °C. In addition, the tensile tests were conducted at 37 °C
to stimulate the human body temperature. The test results of the previous experiment
showed that NiTi films with 50.9 at% Ni have a low elongation at fracture (20 %) for
HT(3). While NiTi films with 50.3 at% Ni have a large elongation at fracture, e.g. up to
50 % using the same heat treatment. The results show that as the aging time increases the
Af and the magnitude of the elongation at fracture increases till a certain threshold limit.
The threshold limit was observed at HT(3), above this limit both the Af and the
elongation at fracture decreases and saturate at an annealing time of 60 min regardless of
the applied crystallization temperature (600 or 650 °C). The observed result matches the
published literature values for NiTi films [Sato96, Miya97, Miya99, Miya09]. The

4.1 Film characterization
61
difference in the mechanical properties as well as the transformation temperatures arise
from the formation of the Ni4Ti3 precipitates as a result of the different aging times. The
enhancement in the mechanical properties is due to the suppression of coarse grain
boundary precipitates to dislocations and cracks propagation. The NiTi films with low Ni
concentration show significant plastic deformation before fracture which results in a very
high ductility. This high ductility is seen in the significant improvement in the elongation
at fracture. On the other hand, films with higher Ni content show less plastic deformation
before fracture. This yields brittle fracture which results in premature fracture, i.e. less
elongation at fracture. As discussed in chapter 2.1, the shape memory effect and the
superelastic plateau of the NiTi thin films are largely influenced by the transformation
temperatures and the amount of Ni4Ti3 precipitates in the B2 matrix. As the second
annealing step time increases, more Ni4Ti3 precipitates form in the film. Throughout
these precipitates formation, the film matrix is depleted of Ni and the overall B2 matrix
composition is changed to lower Ni content. As a result, the Af increases till a saturation
point is reached. Above the saturation point the Af and the mechanical characteristics of
the films will remain constant regardless of the aging time. It can be concluded that the
chemical compositions of the sputtered film, the heat treatment used, and the amount of
precipitates in the matrix are the main parameter controlling the NiTi films general
characteristics. It is hard to distinguish one effect over the other since all of these
parameters are highly dependent on each other.
Based on the previous chapter results, the optimized conditions to acquire NiTi films
with appropriate mechanical performance for medical application is as follows. The films
should be sputtered using P(2) parameters to have NiTi film with near equiatomic
composition, see Table 7. Then the freestanding films should be annealed using HT(2)
as shown in Table 8. The heat treatment will adjust the microstructure chemical
composition and the amount of precipitates. This will result in an optimum elongation at
fracture, good superelastictiy, reasonable tensile strength, and result in Af below 37 °C.
All the previous properties fit into the market demands of NiTi thin film devices for
medical applications.
4.2 Fatigue investigations The aim of this chapter is to investigate the fatigue characteristics of the
micropatterned freestanding NiTi films. The films will be tested at different testing
variables and the results will be analyzed. Finally a method to produce NiTi thin films
with significantly improved fatigue characteristics, e.g. with high fatigue endurance
limits, will be presented.
In order to determine in which region of the superelastic stress-strain plateau the NiTi
films have the highest fatigue endurance limit and to understand the influence of the
applied mean strain on the fatigue behaviour of films; the fatigue characteristics of all the
plateau regions were tested. Fatigue tests were performed at 0 to 8 % mean strain with
different strain amplitudes, see 3.1.7. Figure 56 (a) shows the influence of the applied
strain amplitude on the fatigue resistance at the four main regions of the superelastic
plateau seen in Figure 40. In Figure 56 (b) the strain amplitude is plotted against the
applied mean strain, the red dashed line demonstrates the fatigue endurance limit (safety
limit = 107 cycles).

Chapter 4
62
Figure 56: (a) Fatigue characteristics of NiTi films at the four main regions of the superelastic plateau seen
in Figure 40. Films were tested at different mean strains with the previously stated parameters at 37 °C.
Figure (b) Fatigue characteristics of NiTi films tested at 37 °C. The figure maps fractured and non-fractured
(run out at 107 cycles) films at different strain amplitudes and mean strain.
In Figure 56 (a), the fatigue resistance of NiTi films is decreasing as the strain amplitude
increases in all tested regions at the same mean strain. This is similar to the conventional
fatigue behaviour of metals. When plotting the strain amplitude versus the different mean
strain, see Figure 56 (b). The fatigue endurance limit of the films is shifted to 0.5 % strain
amplitude and remains constant between 2 and 6.5 % mean strain. The previous result
contradicts conventional metals fatigue behaviour. The results of Figure 56 (b) expose
four distinctive regions of different fatigue endurance limits as follows:
in the first region at mean strains between 0 to 1.5 %, corresponding to the
austenite elastic region in Figure 56 (a). The fatigue resistance is steady and the
fatigue endurance limit is at 0.4 % strain amplitude, i.e. all samples survived 10
million cycles at this strain amplitude and at values below.
in the second region at mean strains between 2 to 6.5 %, which corresponds to the
super elastic region upon loading in Figure 56 (a). The fatigue resistance increases
in comparison to the austenite elastic region with a fatigue endurance limit of
0.5 % strain amplitude.
in the third region at mean strains larger than 6.5 % and thus at the start of the
martensitic elastic region in Figure 56 (a). The fatigue resistance decreases as the
mean strain increases and the fatigue endurance limit is dropped to 0.4 % at
7.5 %.
in the last region, the region of plastic deformation in the martensite. The fatigue
endurance limit decreases rapidly as the mean strain increases with further
loading above 8 % mean strain, not shown in the figure.
When NiTi film is strained, the martensitic transformation starts approximately at 1.5 %
mean strain, whereby, the austenitic phase starts to transform to the martensitic phase.
This is seen on the stress-strain plateau, see Figure 40 (a), as the transition from the
elastic to the superelastic region. The superelastictiy combined by the martensitic
transformation has a significant effect on the films crack propagation and fatigue
resistances. It is mentioned earlier in chapter 2.3.4 that martensite phase has indeed a
better fatigue resistance than the austenitic phase. Additionally further studies indicate
that the stress induced martensitic transformation and the mix contribution of the

4.2 Fatigue investigations
63
austenitic and the martensitic phase transformations are the main reasons for improved
fatigue properties [Pelt08, Pelt11, Rober07]. It is seen in Figure 56 (b) that through
further straining the fatigue resistance starts to drop when the film reaches the martensitic
elastic region. Later at the martensitic plastic region, permanent plastic deformation result
in high dislocation density and eventually leading to earlier fatigue failure. This result
indicates that the superelastic region fatigue resistance is the highest among all other
region in the superelastic plateau. Accordingly, all subsequent fatigue tests were
conducted at 4 % mean strain unless other parameters are mentioned.
Due to the high number of cycles that NiTi SMAs have to perform during their operation,
their fatigue behavior is in most cases not investigated under real conditions. The test cycling
frequency must be increased in order to reach a have high number of tested cycles while
limiting the testing time to a reasonable experiment duration. However, the influence of the
cycling frequency on the fatigue behavior on NiTi films must be considered. Accordingly,
different testing frequencies of 10, 20, and 40 Hz were utilized in this thesis. Figure 57
shows the influence of the different cycling frequencies applied on the fatigue endurance
limits of films sputtered using P(2) parameters and annealed using HT(2) conditions. The
fatigue test was conducted at 37 °C. For all test frequencies a fatigue endurance limit of
10 million cycles without failure was reached for strain amplitudes below 0.5 %. For
strain amplitudes higher than 0.5 %, the fatigue life of the crystalline films was the
maximum during the measurements at 10 Hz. In comparison, it decreased significantly
for higher frequencies, 20 Hz and 40 Hz, on an average of -30 % and -45 %, respectively.
Since the fatigue characteristics depend significantly on the surface quality, AFM and
SEM measurements were performed to investigate the change in the surface quality and
the edge profile. The freestanding films were investigated under SEM after a number of
loading-unloading cycles at 10, 20, and 40 Hz test frequency. NiTi films were cycled at a
mean strain of 4 % and a strain amplitude of 2.5 % for 2000 cycles at 37 °C. The
investigated films did not rapture during the test.
Figure 57: Influence of the different cycling frequency on the fatigue resistance of NiTi films. Films were
sputtered using P(2) parameters and annealed using HT(2) conditions. Films were tested at the super elastic
region with the previously stated parameters
Figure 58 (a), (b), and (c) illustrates SEM images of the films edge after cycling at
different test frequencies of 10, 20, 40 Hz, respectively. The SEM images in Figure 58

Chapter 4
64
clearly indicates a deterioration of the film edge quality as the corresponding test
frequencies increases.
10 μm
10 μm
2 μm
2 μm
40 μm 10 μm40 Hz
20 Hz
10 Hz
a)
b)
c)
Figure 58: SEM images of micropatterned films edge qualities at different cycling test frequencies. The
films were tested at strain amplitude of 2.5 % at a mean strain of 4 % for 2000 cycles at 37 °C. Figure (a),
(b), and (c) illustrates the 10, 20, 40 Hz cycling test frequencies, respectively. The SEM images indicate a
coarsening of the film edge as test frequency increases. A magnified image is displayed in the appendix.
To support the SEM results, the film edge roughness was investigated by atomic force
microscopy (AFM). The root mean square average surface roughness (Rrms)
measurements were carried on a 10 x 10 µm scan area with an average of 4 scans for
each measurement. The AFM scan results are illustrated in Table 9 and Figure 59,
respectively.

4.2 Fatigue investigations
65
Table 9: AFM edge investigation
Investigated film Average (Rrms) (nm)
non-cycled amorphous film 3 ± 2 nm
non-cycled and annealed using HT(2) 6 ± 2 nm
annealed using HT(2)+ 2000 cycles at 10 Hz 15 ± 2 nm
annealed using HT(2)+ 2000 cycles at 20 Hz 24 ± 2 nm
annealed using HT(2)+ 2000 cycles at 40 Hz 30 ± 2 nm
The results in Table 9 show an increase in the film edge roughness by 250 %, 400 %,
and 500 %, respectively, compared to the non-cycled annealed film. Thus, further
increase in the number of cyclic loading at higher frequencies will create favorable crack
initiation sites. Therefore an earlier fatigue failure during operation is expected. At higher
frequencies, the slip sites formation at the film edge will be accelerated and a rapid
fatigue failure will occur. Moreover, at higher strain amplitudes the latent heat that is
released or absorbed during transformation plays an important role, since it can change
the sample temperature even at low frequencies (≥0.1 Hz) [Augu10, Carr11]. The
transformation latent heat of the films is exchanged with the surrounding mainly via the
physical contact with the clamping jaws. Higher cycling frequencies consequently result
10 Hz1 µm 20 Hz1 µm 40 Hz1 µm
a) b) c)
Figure 59: (a), (b), (c) illustrates AFM images of NiTi thin film edge profile tested at 10, 20 and 40 Hz
respectively. The samples were tested at strain amplitude of 2.5 % at a mean strain of 4 % for 2000 cycles.
in higher temperature changes during cycling since the heat transfer is limited [Yjhe10].
The increase in sample temperature during forward transformation and the decrease in
sample temperature during reverse transformation lead to an increase of the superelastic
plateau slope [Ente00, Li02]. Thus, higher transformation stresses are required for higher
cycling frequencies which are detrimental for fatigue resistance. Furthermore, higher
strain amplitudes are expected to amplify this detrimental effect. Since a higher fraction
of the material transforms by the martensite transformation and the temperature change
during transformation is expected to increase, i.e. increase of film temperature due to
internal friction.
It must be stated that testing at higher cycling frequencies compared to those used in a
specific application is more demanding in terms of fatigue life and is therefore a more
stringent criterion. Critical cycle numbers will evidently also be reached when lower
cycling frequencies are used. In the following, a frequency of 20 Hz is used as the fatigue
test frequency, which results in a measurement time of approximately 6 days until FEL at
107 cycles is reached. A lower fatigue test frequency will yield lengthy test duration. On
the other hand, fatigue testing at higher test frequencies, more than 20 Hz, is not

Chapter 4
66
necessary since commercial medical applications of NiTi have a frequency range below
3 Hz, which is equivalent to human heart frequency range. A good compromise between
the experiment time and the effect of test frequency on the fatigue characteristics is found
at the 20 Hz cyclic frequency. Therefore, according to the previous fatigue tests result,
the fatigue characteristics of NiTi freestanding films will take place using the following
parameters in Table 10.
Table 10: Fatigue test parameters.
Test parameter Value
Temperature 37 °C
Frequency 20 Hz
Mean strain (εm) 4 % at the super elastic region of the stress-strain plateau upon
loading
Strain amplitude (εa) From ± 0.25 % to ± 3 %
4.2.1 Fatigue characterization of freestanding films
Superelastic properties of SMAs at a given temperature, e.g. the critical stress required
for the onset of the martensitic transformation, vary strongly with the alloys
transformation temperature and the test temperature [Pelt08.a]. This difference between
the test temperature (Ttest) and the austenitic finish temperatures (Af) is addressed by the
working temperature (Tw). The studies on bulk materials have shown that an increase in
the working temperature deteriorates (decrease) fatigue resistance [Yqfu03, Mats99].
This occurs because higher stresses are required to induce the forward and reverse
martensitic transformation, which fosters the generation of dislocations and thus plastic
deformation in the film. As mentioned in chapter 2.1.3, the transformation temperature of
binary NiTi SMAs can be easily tuned by adjusting the Ni content of the matrix phase,
i.e. more than -100 K per at% Ni for Ni contents above 50 at%. Hence, both superelastic
properties and fatigue behavior can be influenced by changing the chemical composition.
In order to investigate the influence of film composition on the fatigue characteristics,
two different films of Ni50.9Ti49.1 and Ni50.3Ti49.7 were fabricated using P(1) and P(2)
parameters, see Table 7 in chapter 3.2.1. Both films were annealed using HT(2) from
Table 8 and the experiment was performed at 37 °C. The Af of Ni50.3Ti49.7 and Ni50.9Ti49
films were 14 °C and 6 °C, respectively. The films were tested in the fatigue setup using
the test parameters in Table 10. Figure 60 illustrates the influence of the chemical
composition on the fatigue characteristics of the films. Due to the increase in the Ni
content and the high working temperature of Ni50.9Ti49.1 films (31°C) compared to
Ni50.3Ti49.7 films, Ni50.9Ti49.1 have lower fatigue resistance . The former films require a
higher stress to induce the martensite transformation compared to the Ni50.3Ti49.7 films.
Thus, the Ni50.9Ti49.1 films are more likely to undergo additional dislocation formation and
plastic deformation to thermodynamically stabilize the film's microstructure during cyclic
loadings. This will result in a lower fatigue resistance. The combined effect of annealing
and chemical composition of the sputtered film is reflected on the microstructure. The
formation of precipitates that takes place during the aging step is dependent on the
difference between the composition of the matrix and the intermetallic equilibrium phase
at the given second annealing step temperature and aging time. The earlier results in
chapter 4.1.2 shows that more Ni4Ti3 precipitates form when the film composition is Ni-
rich and the amount and size of precipitates increases as the aging temperature increases.

4.2 Fatigue investigations
67
However, crystallization at HT(2) does not result in a completed decomposition of the
crystalline phase into an equiatomic NiTi matrix phase plus precipitates, but a Ni-rich
matrix phase is obtained.
Figure 60: Influence of the film composition on the fatigue resistance of NiTi films sputtered using P(1)
and P(2) parameters. Films were annealed using HT(2) and the working temperature of Ni50.3Ti49.7 and
Ni50.9Ti49.1 films were determined to be 23 °C (Af 14 °C) and 31 °C (Af 6 °C), respectively.
This is true for both the Ni50.3Ti49.7 and the Ni50.9 Ti49.1 films. Hence, in this case, the
formation of precipitates is rather similar for both film compositions but the amount of
precipitates differ. The Ni rich films will have more precipitates formation compared to
film fabricated by P(2) (Ni50.3Ti49.7), according to preliminarily TEM investigation. It is
therefore assumed that the matrix composition, and consequently the aging time are the
major factor influencing the fatigue behavior of the NiTi films. In addition, the results in
chapter 4.1.2 shows that NiTi films with near equiatomic compositions have higher
ductility compared to Ni rich films, which is reflected on the fatigue characteristics of the
films. It is well known in the literature that ductile metals have a better fatigue resistance.
The results in Figure 60 confirm that the NiTi films with lower Ni content of 50.3 at%
have indeed a better fatigue resistance compared to the films with higher Ni content of
50.9 at%. This increase in the fatigue resistance is seen above the fatigue endurance limit
in the number of cycles to failure (Nf). The fatigue endurance limit for both films was
below 0.5 % strain amplitudes, as illustrated in Figure 60.
The formation of precipitates in Ni rich films is similar to those reported in bulk alloys
[Otsu98]. Thus, the influence of precipitates on the fatigue behavior of sputtered films
can be investigated by changing the aging time of the studied films, see Figure 53 and
Figure 54. In addition, the different aging time resulted in different Af. The aim of this
experiment was to investigate the influence of the heat treatment vs. working temperature
on the films fatigue resistance. For that reason, NiTi films fabricated using P(2)
parameters and annealed using the annealing conditions in Table 8, were investigated.
The fatigue tests were carried out using the parameters in Table 10 at 37 °C. Figure 61
display the fatigue test results. The working temperature (Tw) of each heat treatment used
is indicated on the figure as well. The results show that as the annealing time increases,

Chapter 4
68
the working temperatures decreases and the fatigue resistance of the film increases.
Moreover, at high working temperature, at HT(1), more energy is needed to induce the
martensitic transformation during cycling loading. This results in high dislocation density
and earlier fatigue failure. In addition, the size and the amount of the Ni4Ti3 precipitates
increase as the aging time increases, see Figure 53 and Figure 54. The formation of
Ni4Ti3 precipitates will improve the fatigue life because precipitates can act as barriers
which hinder dislocations and microcracks propagation. Accordingly, it can be concluded
from the TEM investigation and Figure 61 results that the fatigue life of NiTi films
increases as aging time increases and the working temperature decreases. Longer aging
times results in less working temperatures and more Ni4Ti3 precipitates. The precipitates
will reduce the Ni content in the film matrix and increase the Af. Therefore, the working
temperatures decreases as well as the amount of energy needed to induce the martensitic
transformation. As a result, better fatigue characteristics are observed as illustrated in
Figure 61.
Figure 61: Influence of the aging time on the fatigue resistance of NiTi films sputtered using P(2)
parameters and annealed at HT(1), HT(2), and HT(3) summarized in Table 8. The fatigue test was carried
out according to Table 10 parameters. In the figure Tw= Ttest-Af .
The same result was observed when each of the heat treatment on its own, e.g. HT(1),
was tested at three different test temperatures, 25, 35, and 45 °C. As the working
temperature decreases, the fatigue life increases regardless of the heat treatment used.
However further investigation should be carried out for all heat treatments at constant
working temperature.
The fabrication method used in this work to produce micropatterned NiTi films
yielded a film thickness up to 50 µm with high aspect ratio. The films can be used for a
variety of applications, e.g. stents and heart valves with different thicknesses. Thus
understanding the influence of the film thickness on the fatigue life is also of a great
importance. For that investigation, NiTi films prepared using P(2) and annealed using
HT(2) were prepared. The sputtering time was varied to have films with thickness of 15,
30, 45 ± 3 µm, respectively as seen in Figure 62. The film thickness was measured along
the dog-bone gauge length (7mm). The gradient of the film thickness (± 3 µm at the

4.2 Fatigue investigations
69
gauge length) arises from the difference in the deposition rate within the 40 mm constant
stoichiometry region, see chapter 4.1.1. Figure 62 shows the influence of the film
thickness on the fatigue life of the NiTi films. The results show an increase in the fatigue
resistance as the film thickness increases. In addition, Figure 62 shows that the film
thickness has no influence on the fatigue endurance limit, at the high cycle region.
Figure 62: Influence of the film thickness on the fatigue resistance of NiTi films sputtered using P(2)
parameters and annealed HT(2) conditions. Film thickness was 15, 35, 45 µm ± 3 µm and fatigue test was
carried out according to Table 10 parameters.
The FEL was recorded at below 0.5 % strain amplitude for all thicknesses. Unlike
conventional bulk NiTi materials, the freestanding films produced in this work were
deposited by means of sputtering and annealed under vacuum conditions. No carbide
inclusions or cold working induced plastic deformations were detected by SEM and TEM
investigations. This indicates an improved microstructure features. As a result, as the film
thickness increases the fatigue resistance of the film is expected to increase, because
more time and energy are needed for a crack tip to propagate into the film microstructure.
Laser machining of NiTi components is a widely used method in the production of
conventional NiTi devices, e.g. stent. To illustrate the effect of laser machining on the
fatigue characteristics of NiTi films, a circular freestanding NiTi film with the
dimensions of 40 × 40 mm was deposited onto a silicon wafer using P(2) parameters and
annealed using HT(2) conditions. Later, the film was laser machined to acquire the
desired micro dog bone structures as previously illustrated in Figure 39 (b). Figure 63 (a)
shows the fatigue resistance of those micro dog bone samples structured by laser
machining in comparison to films structured by UV lithography. The fatigue test of films
was carried out according to Table 10 parameters at 37 °C. Figure 63 (b) shows the
superelastic plateau of the micro dog bone films cycled till failure. The result of Figure
63 (a) indicates that laser machining did not affect the fatigue endurance limit of the
sputtered films (below 0.5 % strain amplitude). Rather a slight decrease in the number of
cycles till failure was noticed at the LCF region in comparison to UV lithography
structured films. The result in Figure 63 (b) shows that the films had remaining strain of
2.3 % before fracture. In addition, the superelastic effect of the films suffered more than
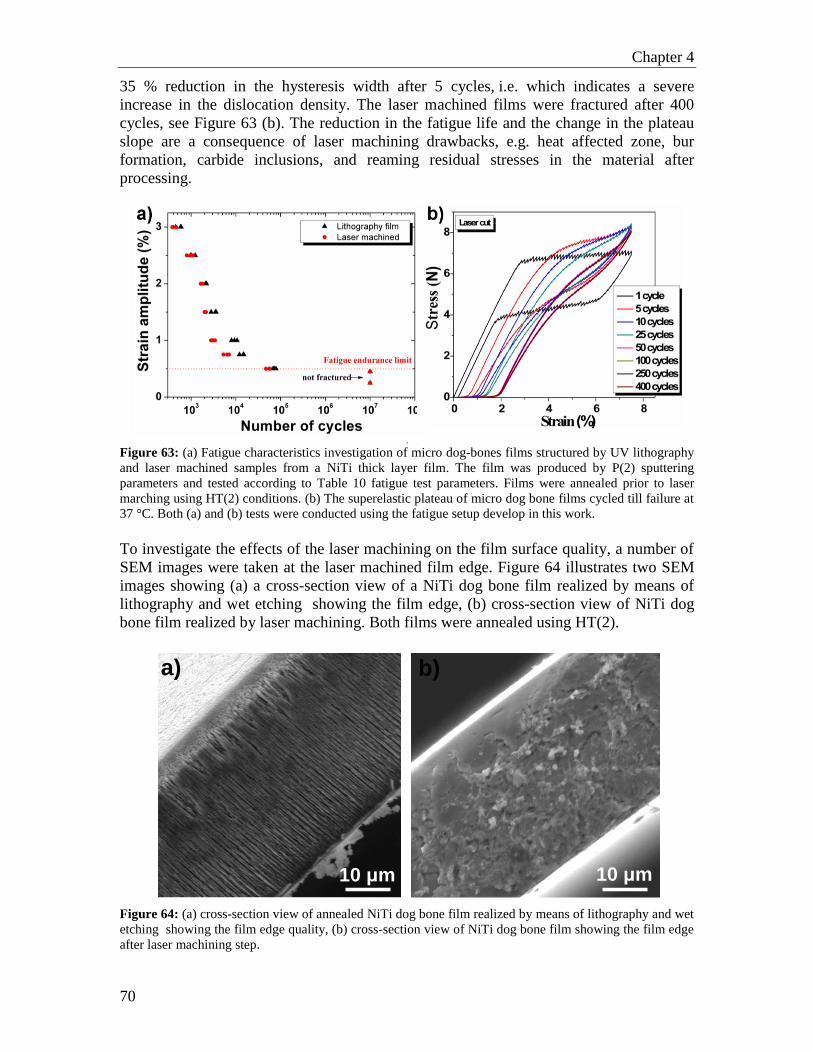
Chapter 4
70
35 % reduction in the hysteresis width after 5 cycles, i.e. which indicates a severe
increase in the dislocation density. The laser machined films were fractured after 400
cycles, see Figure 63 (b). The reduction in the fatigue life and the change in the plateau
slope are a consequence of laser machining drawbacks, e.g. heat affected zone, bur
formation, carbide inclusions, and reaming residual stresses in the material after
processing.
,
Figure 63: (a) Fatigue characteristics investigation of micro dog-bones films structured by UV lithography
and laser machined samples from a NiTi thick layer film. The film was produced by P(2) sputtering
parameters and tested according to Table 10 fatigue test parameters. Films were annealed prior to laser
marching using HT(2) conditions. (b) The superelastic plateau of micro dog bone films cycled till failure at
37 °C. Both (a) and (b) tests were conducted using the fatigue setup develop in this work.
To investigate the effects of the laser machining on the film surface quality, a number of
SEM images were taken at the laser machined film edge. Figure 64 illustrates two SEM
images showing (a) a cross-section view of a NiTi dog bone film realized by means of
lithography and wet etching showing the film edge, (b) cross-section view of NiTi dog
bone film realized by laser machining. Both films were annealed using HT(2).
a)
10 μm
b)
10 μm
Figure 64: (a) cross-section view of annealed NiTi dog bone film realized by means of lithography and wet
etching showing the film edge quality, (b) cross-section view of NiTi dog bone film showing the film edge
after laser machining step.

4.2 Fatigue investigations
71
The previous SEM figure shows the deterioration of the edge quality after laser
machining, seen as deep grooves in Figure 64 (b). Both of Figure 64 (a) and (b) indicates
that both films require a post treatment to enhance the edge quality and to reduce the
numerous crack initiation sites that might result of such irregularity at the film cross-
section.
4.2.2 Fatigue characteristics vs. surface finishing
In light of the previous results, a surface finishing based on a chemical treatment using
nitric acid diluted in distilled water (2:1 respectively) was utilized to chemically etch the
film edge and to enhance the surface and the edge characteristics. The etch rate of the
solution was 1.2 µm/day. Figure 65 shows the SEM image of the micro-dog bone film
edge after immersion in the solution for 1 day. The surface treatment undoubtedly
enhanced the edge quality significantly and increased the film surface reflection. Most of
the surface irregularities, columnar growth, and the persistent slip bands (PSBs) were
etched away from the film edge. Yet the edge was not completely defect free. The
influence of the chemical treatment on the fatigue resistance of the annealed films was
investigated using Table 10 test parameters. Figure 66 (a) shows the influence of the
HNO3 surface finishing on the fatigue life of NiTi films annealed using the HT(2). Figure
66 (b) shows the surface finishing influence on the superelastic plateau of the films when
cycled till failure. The result of the previous figures shows that the chemical treatment
increased the fatigue endurance limit by 200 % and set a new fatigue endurance limit
below 1 % strain amplitude.
a)
10 μm
Figure 65: SEM image annealed film edge quality after surface finishing by nitric acid solution 1day.
In addition the chemical treatment increased the general fatigue resistance of the films
significantly at strain amplitudes higher than the 1 %, i.e. at the low cycle fatigue region
(LCF). The number of the superelastic cycles that that the film can perform before
complete fracture was also increased roughly by 200 %. When comparing Figure 66 (b)
to Figure 63 (b) results, one can see that the surface finish enhanced the mechanical
characteristics of the films. Figure 63 (b) results show that the films had a remaining
strain of 1.7 % before fracture. In addition, the plateau slope and the film hysteresis
remained nearly constant for the first 5 working cycles, which indicates a low dislocation
density in the early cycles. After 250 plateau cycles, a 40 % reduction in the hysteresis

Chapter 4
72
width for the chemical treated film was seen. While the laser machined films had almost
88 % reduction in hysteresis width at the same number of cycles. This confirms that the
surface finish using nitric acid solution enhanced the superelastic effect stability,
enhanced the film surface quality, and indeed increased the fatigue resistance. The
increase in fatigue life and the mechanical properties is mainly due to the removal of
edge irregularities and the top surface persistent slip bands (PBs). Therefore, most active
crack initiation cites and residual stresses are removed from the film surface and from the
edge. In addition less energy and less dislocation density are presented during the cycling
loading.
Figure 66: (a) Fatigue characteristics of lithography structured films (red) and chemically treated films
(black), fatigue test were conducted using Table 10 test parameters. Chemical treated films had a thickness
reduction of 1.2 ± 0.4 µm per day after treatment. (b) The chemical treatment influence on the superelastic
effect of the films cycled till failure.
Since fatigue characteristics rely significantly on the surface quality, the fatigue life was
increased tremendously. Yet at the LCF region, the high strain amplitude, the PSBs will
appear again on the surface along with a new crack initiation sites. In addition the
repeated cyclic loading will increased the dislocation density and film will suffer cyclic
hardening. The previous factors will cause a fatigue crack which will extend in the
microstructure till fatigue failure occurs. In order to enhance the overall fatigue
characteristics of the film further surface finishing techniques should be investigated.
As mentioned earlier, NiTi SMAs are widely used in medical applications due to their
great biocompatibility, corrosion resistance, and superelasticity. The most important
factor controlling the biocompatibility and the corrosion resistance of NiTi SMAs is the
native TiOx layer forming on the alloy surface. Different studies in the literature claimed
that the thickness of the native oxide layer can be increased by oxidizing the alloy in
hydrogen peroxide solution at low temperatures [Tako04, Chu06, Shabo12]. A recent
study claims that NiTi treated with hydrogen peroxide have an enhanced corrosion
resistance, higher mechanical performance, and have a uniform chemical homogeneity on
the NiTi surface [Shabo12]. Yet, in the literature, the question of hydrogen peroxide
treatment effect on the fatigue characteristics was not discussed. For that reason an
experiment was conducted to investigate the effect of hydrogen peroxide on the fatigue
characteristics of NiTi thin films. In this experiment, NiTi films were prepared using P(2)
parameters and annealed using HT(2) conditions, see Table 7 and Table 8. Later, the
films were oxidized in hydrogen peroxide solution diluted in distilled water (2:1

4.2 Fatigue investigations
73
respectively) for one day at room temperature. Figure 67 demonstrates the effect of the
H2O2 treatment on the fatigue endurance limit of NiTi films tested using Table 10
parameters. The results show that the hydrogen peroxide treatment increased the fatigue
endurance limit to 1% strain amplitude and during the LCF region the fatigue
characteristics were increased significantly. In order to investigate the surface properties
of the film, a series of images were taken by means of SEM and polarized microscope. In
Figure 68 (a) and (b) illustrates the SEM images of the film edge after the hydrogen
peroxide finishing and figures (c) and (d) illustrates the top view images of the film
surface using the polarized microscope.
Figure 67: Effect of the H2O2 treatment, after 1 day oxidation treatment, on the fatigue endurance limit of
NiTi thin films sputtered using P(2) parameters and annealed using HT(2) conditions. Chemical treated
films had a thickness reduction of 2 ± 0.7 µm per day after treatment. The fatigue test was conducted using
Table 10 test parameters.
Figure 68: NiTi film treated with H2O2 (1day) at room temperature. (a), (b) SEM images of NiTi film
edge. (c), (d), (e) and (f) Top views of film surface realized by polarized microscope at (c), (d) zero applied
straining cycles, (e) 50 straining cycles, and (f) 150 straining cycles.
The previous figures show that the top layer of the film surface had several micro cracks
and the film edge is suffering from a large amount of surface irregularities. To identify

Chapter 4
74
the elemental composition of the film surface, the film was inspected under XPS. The
result shows that 98.9 % of the film surface is composed of TiO2. Yet, the finding of the
SEM results does not give an explanation for the increase in the fatigue characteristics.
To support the investigation, the film was cycled using the fatigue set up for 50 and
150 working cycles. Figure 68 (e) and (f) show the film surface after the 50 and 150
cycles, respectively. The previous figures show that the film oxide layer is detached
during the cycling straining and a new layer with minimum surface irregularities was
revealed, see Figure 68 (f). The new layer had a smooth surface with minimum surface
irregularities same as the nitric acid treated film surface. Therefore, a significant increase
in the fatigue life was noticed during the high cycle fatigue region at low strain
amplitude. Cyclic loading at high strain amplitudes (≥1 %) will yield a rapid surface
deterioration and the magnitude of the microcracks is large enough to propagate into the
film microstructure and result in fatigue failure.
All discussed results so far confirm a significant dependence of the fatigue
characteristics on the film edge attributes. As mentioned earlier in
chapter 3.1.8, electropolishing finishing (EP) overcomes most of the mechanical and
chemical etching problems. In addition, EP is commonly used to enhance the NiTi
surface quality and remove/minimize the processing drawbacks, e.g. sharp edges or
persistent slip bands (PBs) on the component surface. Thus an electropolishing set up was
developed in this work to investigate the effect of electropolishing finishes on the fatigue
characteristics of NiTi films. Figure 69 (a) shows the SEM images of electropolished dog
bone specimen utilizing electrolyte solution (B), see chapter 3.1.8. The electropolished
films had a thickness reduction of 4 ± 1.5 µm per day after treatment. The result shows a
rapid non-uniform electropolishing on the film surface even at low current density.
In addition, galvanic corrosion between the film and the electrode connecting wire was
observed. Such results might occur due to the high concentration of acid in the electrolyte
solution, which lead to progressive etching even before electropolishing starts.
In contrast, electrolyte solution (A) gave better electropolishing results. This can be seen
as a round rim structure at the sample corner whereby the film sharp edge is removed,
see Figure 69 (b). A zoom in on the film edge displayed no columnar structures or micro-
cracks, thereby, showing a successful electropolishing, as illustrated in Figure 69 (c).
10 μm20 μm20 μm
a) b) c)
Figure 69: SEM images of electropolished dog bone specimens. (a) Electropolishing process utilizing
electrolyte solution (B), the figure illustrates a selective etching at the film surface. Figures (b) and (c)
illustrates the electropolishing process utilizing solution (A), the figure illustrates a round rim structure
showing a successful electropolishing. (c) Zoom in on the sample edge showing no striation or micro-
cracks.

4.2 Fatigue investigations
75
The electropolishing setup developed in this work can electropolish one dog bone film at
a time. If two films were employed in the electrolyte, the distance between the cathodes
to the anode will change which requires a new calibration every time for each sample. In
addition an average of 28 samples is needed to construct a fatigue life diagram for one
investigation. For these reasons the NiTi freestanding films fabricated using P(2) and
HT(2) parameters where electropolished by ADMEDES GmbH in Pforzheim. The
electropolished films were investigated using Table 10 parameters. The results of the
fatigue test are presented in Figure 70. Figure 70 (a) shows the fatigue life diagram of the
films after the electropolishing finishing.
Figure 70: (a) Fatigue characteristics of annealed films after electropolishing treatment, fatigue test were
conducted using Table 10 test parameters. (b) Electropolishing influence on the superelastic effect of films
cycled till failure at 37 °C.
The results show that the films fatigue endurance limit is increased to 1.8 % strain
amplitude, i.e. shows a 360 % increase in the fatigue endurance limit, due to the edge and
surface quality enhancement after the electropolished films. When the electropolished
films were inspected used SEM, the film edge showed a round contour, i.e. no sharp
edge. Moreover, the SEM investigation showed a minimum surface irregularity on the
film cross-section as seen in Figure 71 (e). Furthermore, the electropolishing finishing
removed most of the surface irregularities and the PBs. In addition, the result shows that
at the LCF region the number of cycles to fracture (Nf) was increased significantly.
Figure 70 (b) illustrates the electropolishing influence on the superelastic effect on films
cycled till failure at 37 °C. The result in Figure 70 (b) shows that the films had a
remaining strain of 1.8 % after 2000 cycles. Even though the film lost 80 % of the
hysteresis width and the slop of the plateau changed significantly after 2000 cycles, the
films did not fracture. This indicates a lower dislocation density compared to the other
films investigated in this thesis, e.g. laser machines, H2O2, and film without any surface
finishing. The onset of the stress induced martensitic transformation stresses had
maximum increase of 0.2 N at 2000 cycles. The results show that the electropolished
films had the lowest cyclic hardening compared to 0.4 N (after 400 cycles) and 0.6 N
(after 850 cycles) for laser machined and nitric acid finishing treatment, respectively. The
result of Figure 70 (a) and (b) show that electropolishing finishing increases the fatigue
resistance, enhanced the film surface quality, and reduced the dislocation density as the
number of loading cycles increases. In other words, the FEL was increased by more

Chapter 4
76
350%, the number of superelastic plateau cycles was increased by 550% (films did not
fracture) and the films had a reduction in the remaining strain by 40 % at 2000 cycles.
Figure 71 show a summary for film edge quality discussed in this chapter.
c)
e)
10 μm
10 μm
a)
10 μm
b)
10 μm
10 μm
d)
Figure 71: SEM images of NiTi films edge quality investigated in this work. (a) As deposited
(amorphous), (b) laser machined, (c) treated with H2O2 for one day, (d) treated with nitric acid for one day,
and (e) electropolished film. All film were sputtered using the P(2) parameters and annealed using the
HT82) condition from Table 7 and Table 8, respectively.
All the fatigue result so far showed a great dependence of the Nf and the fatigue
endurance limit on the film edge quality. Therefore, the surface properties of the film as
well are of the same important. To investigate the influence of cycle straining on the
surface properties of the NiTi films; film topography investigations were carried out
using a polarized light microscopy at room temperature. The surface roughness of both
austenitic and martensitic phases for the sputtered films annealed using HT(2) were 6 nm
and 10 nm, respectively. Figure 72 shows a series of optical images of a NiTi film with
an applied strain magnitude increasing from figure (a) to (f) for one cycle. The test took
place in the unloaded state at room temperature. The black circle seen in all images
relates to an artifact in the camera. Careful surface observation revealed that the stress
induced martensitic transformation starts by the propagation of existing martensitic
transformation persistent slip bands (PSBs) and the nucleation of new transformation
bands. The martensite fraction on the material surface increases with further straining
regardless of the frequency used, which indicates a drastic change in the material's
surface roughness. When the film is unloaded, strain recovery takes place through the
reverse martensitic transformation (MT). The reverse transformation takes place at both
sides of the film edge and continues further till the austenitic bands are merged in time
with the further unloading (reverse transformation occur from (f) → (a)). Both reverse

4.2 Fatigue investigations
77
and forward martensitic transformation, seen as inclined lines, had an angle at about 56°
to the loading axis, which is the preferred slip orientation in the film microstructure.
Figure 73 shows the changes on the film surface with further cyclic loading.
100 μm 100 μm 100 μm
b)a) b) c)
100 μm 100 μm 100 μm
d) e) f)
Loading axis
direction
Figure 72: Series of optical images obtained by a microscope using polarized light of the film surface at
different strain values. The strain magnitude is increasing in the figures incrementally from figure (a) →
(f). The test took place in the unloaded state at room temperature. The black circle seen in all images relates
to an artifact in the camera.
In Figure 73 (a) a straight boundary line between the partially martensitic phase with
rougher surface at the left upper corner and the partially austenitic part at the lower right
corner is seen. The term '' partially '' is used since the NiTi film is not 100 % austenitic or
100 % martensitic after the phase transformations.
a) b)
100 μm100 μm100 μm
c)1
2
3
Figure 73: Series of optical images obtained by polarized microscope for the film surface at different strain
values similar to Figure 72. The strain magnitude is increasing from figure (a) → (c). The yellow circle is
used at a marker to track the transformation on film.
When the applied mean strain magnitude increases, the border of the martensitic
transformation band propagated to the right as the martensitic volume increases.
Simultaneously with further loading, another martensitic band propagated to the left,
same as before, seen in image (b). When the film was unloaded the martensitic
transformation bands revert back to austenite. The previous cycle was repeated for almost
50 cycles. After 50 loading-unloading cycles, a significant change in the surface quality
in the areas which were subjected to the phase transformations can be noticed, surface
roughness increases by 8 nm. In Figure 73 (c), 3 different regions are seen: (1) a strained

Chapter 4
78
film showing partially formed martensitic phase and a part of untransformed austenitic
phase, (2) austenitic phase which was not strained, (3) an austenitic phase which suffered
50 loading cycles. The difference in surface quality seen between region (2) and (3) can
be explained by the potential residual martensitic spots that reside in the austenitic phase
after the martensitic transformation and/or the redistribution of the dislocations in the
film’s microstructure during the martensitic transformation [Pelt11, Brin04]. Therefore,
after a couple of loading cycles the material does not revert completely to the austenitic
phase, rather a fraction of martensitic phase remains visible on the film surface.
The surface finishings discussed so far shows a large improvement in the NiTi film
fatigue resistance. The aim of this experiment was to investigate the film resistance to
surface changes after applying the surface finishing e.g. nitric acid and electropolishing
finishing. A polarized light microscope images were taken before and after the cyclic
straining. In this experiment, films fabricated using P(2) and HT(2) parameters were
prepared and the fatigue test was done according to Table 10 parameters. Figure 74
demonstrates (a) a film without surface treatment in an unstrained state, (b) and (c) the
same film after a couple of straining cycles at 4 % mean strain.
Figure 74: Polarized light microscope images illustrating (a) a film without surface treatment. (b) and (c)
the same film after 4 working cycles at 4 % mean strain, the yellow circle indicates a tracker marker.
Figure (d) shows the same film treated with HNO3 for 1 day, (e) the same film after being strained to 4 %
mean strain and undergoes 100 working cycles. (f) An electropolished film strained to 4 %, (g) the same
film after undergoing 100 working cycles

4.2 Fatigue investigations
79
A change in the surface quality was observed directly after the first cycle, i.e. surface
roughness increases. The same film treated with HNO3 for 1 day was strained to 4 %
mean strain for 50 cycles. Figure 74 (d) before straining and (e) after cyclic straining.
Only when the straining cycles reached a number of 50 cycles a noticeable surface
modification was seen. Moreover, Figure 74 (f) shows an electropolished film which was
strained to 4 % mean strain and (g) the same film after 100 cyclic straining. The change
in film topography was seen only after a minimum of 100 cycles, which indicates a high
resistance to surface modifications and reduced amount of PBs. This surface changes in
all the previous films are presumably due to the retained residual martensitic spots in the
austenitic phase, the rearrangement of dislocations after the austenite to martensite
transformation, and the appearing of old and new PSBs. The microscope images of the
HNO3 treated film and the electropolished film show the highest resistance to topography
changes when compared to the non-treated films. This occurs due to the removal of the
crack initiation sites and the active slip bands, and the passivation process taking place at
the film surface. Thus, a high surface quality is observed on the film. With further cycling
straining, PBs which are not removed by the surface treatment are brought near the
surface. The surface finishing used will increase the number of the working cycles before
PSBs agglomerate and form a crack initiation cites and finally resulting in a fatigue
failure.
Given that the electropolishing treatment increased the fatigue endurance limit of the
NiTi freestanding films, all the previous fatigue tests in chapter 4.2 were repeated once
more. The aim of the experiment is to evaluate the performance of the electropolished
films under the previous investigated factors. Figure 75 display the fatigue life
characteristics of the freestanding films after the electropolishing surface treatment
showing (a) the influence of the test frequency on the fatigue life, (b) the influence of the
film composition on the fatigue life, (c), the influence of the heat treatment/working
temperature on the fatigue life, and (d) the influence of the film thickness on the fatigue
life characteristics. In Figure 75 (a), the electropolishing film tested at 10 and 20 Hz,
illustrated a significant increase in the fatigue life at LCF region and showed a fatigue
endurance limit of 1.8 % mean strain at which samples did not fracture. For film tested at
40 Hz, a small increase in the number of cycles to failure at the LCF region was noticed,
and the films showed a fatigue endurance limit at 0.5 % strain amplitude. The film edges
were investigated using AFM, see Table 11. The results in Table 11 indicates a
significant increase in film edge roughness of >250 %, >500 %, and >750 % at 10, 20
and 40 Hz respectively compared to the non-cycled samples. SEM images of the films
indicated as well a coarsening of the film edge as the test frequency increases.
Accordingly, further cyclic loading will create favorable crack initiation sites, therefore
earlier fatigue failure during operation is expected. For this reason higher frequencies
accelerate slip sites formation at the film edge and consequently leads to rapid fatigue
failure. In addition, it is expected that at higher test frequency, the heat exchange with the
film surrounding and the increase in the internal friction modified the austenitic finish
temperatures and increased the working temperatures of the film. The former can change
the sample temperature immensely during cyclic loading, thus the stress needed for the
martensitic transformation is increased. Consequently, higher transformation stresses are
found at higher cycling frequencies which are unfavorable for fatigue resistance. Also,
higher strain amplitudes are expected to intensify detrimental effect on material surface

Chapter 4
80
roughness, since a higher fraction of the material transforms, thus increasing the
temperature change during transformation at higher frequencies as mentioned earlier.
Figure 75: Fatigue life characteristics of the freestanding NiTi films after the electropolishing surface
treatment showing (a) the influence of the test frequency on the fatigue life, (b) the influence of the film
composition on the fatigue life, (c), the influence of the heat treatment (working temperature) on the fatigue
life, and (d) the influence of the film thickness on the fatigue life of films.
Table 11: Average surface roughness of film edge.
Investigated film Average roughness
non-cycled and annealed using HT(2) 8.5 ± 2 nm
annealed using HT(2) + 10,000 cycles at 10 Hz 22 ± 2 nm
annealed using HT(2) + 10,000 cycles at 20 Hz 44 ± 2 nm
annealed using HT(2) + 10,000 cycles at 40 Hz 65 ± 2 nm
It is believed that the high edge quality of the electropolished film reduced the
temperature exchange with the surrounding environment. As a result, this increases the
internal temperature of the film during cycling loading at high frequency. This occurs due
to the increase in the film internal friction and the limited latent heat exchange with the
surroundings. When comparing the films edge in Figure 71, one can see that the as
deposited film has a columnar structure with deep grooves which increase the
temperature release to the surroundings. These observations are qualitative and were not
confirmed. Given that a sophisticated high frequency IR camera is needed to measure the
freestanding film internal friction dependency on the applied test frequency. In Figure

4.2 Fatigue investigations
81
75 (b) the electropolished films with 50.3 at % Ni showed a higher fatigue resistance at
the LCF region compared to 50.9 at % Ni films. Both films yielded a fatigue endurance
limit of 1.8 % strain amplitude. In Figure 75 (c), a slight increase in number of cycles to
failure at LCF region was noticed and the fatigue endurance limit was increased to 1.8 %
strain amplitude. In Figure 75 (d), the same fatigue behaviour was noticed like before. In
general, the previous results demonstrate that the dependence of the fatigue
characteristics on test frequency, film compositions, annealing treatment, and finally the
film thickness did not change. However a tremendous increase in the number of cycles to
failure and the fatigue endurance limit was observed. This increase in the NiTi
freestanding films fatigue resistance are due to the surface finishing effects as discussed
in chapter 4.2.2. The fatigue endurance limit of all the films, except film tested at 40 Hz,
had an increase of 360 % when compared to previous chapter's results.
Previous SEM results in Figure 71 (e) showed that the NiTi freestanding films had
minimum surface irregularity on the film cross-section. In order to improve the
electropolishing finishing quality further, the films were treated with the nitric acid
solution as introduced in chapter 4.2.2. SEM investigation was carried out to evaluate the
film edge quality. Figure 76 shows the SEM images of (a) electropolished crystalline film
and (b) electropolished crystalline film treated with HNO3 for one day. The result
indicates that the combination of the electropolishing finishing and the chemical finishing
produced a film with excellent surface and edge quality. The combined treatment
eliminated any remaining visible surface notches. A further test was conducted on the
electropolished/HNO3 treated films. In these tests, the films were further treated with
hydrogen peroxide to explore the edge resistance to the H2O2 micro-cracks formation.
Figure 76 (c) shows the SEM results of a NiTi film treated with electropolished/HNO3 at
first and then treated with hydrogen peroxide for one day. The results showed that there
were minimal micro-cracks formation compared to the ones seen in Figure 68, yet the
edge had lower surface quality compared to Figure 76 (b).
EP2 μm 2 μm
a) b)
2 μm
c)
EP+HNO3 EP+H2O2
Figure 76: SEM images showing the influence of different applied treatments on electropolished films
edge quality. Figures (a) electropolished crystalline film, (b) electropolished crystalline film treated with
HNO3 for one day, (c) electropolished crystalline film treated with H2O2 for one day. The result in figure
(b) indicates that EP/HNO3 finishings eliminate any remaining irregular surface notches and produce film
with excellent edge quality.
Therefore the best surface finishing for the freestanding NiTi films in this thesis is
composed of two steps. In the first step, films are electropolished to remove most of the
pointed surface irregularities, notches, sharp edges, and columnar structure features on
the film cross-section. In the second step a fine surface finish utilizing a low
concentration nitric acid etching solution to polish off any remaining notches or grooves
on the film. The fatigue characteristic of the film in Figure 76 (a) was examined using

Chapter 4
82
Table 10 parameters. The aim of this experiment was to compare the fatigue life of
crystalline films in Figure 56 (b) to crystalline-electropolished films. The result of the
tests is illustrated in Figure 77, a new fatigue endurance limits were observed.
Figure 77: Fatigue characteristics of NiTi films tested at 37 °C. The figure maps fractured and run out
samples at different strain amplitudes and mean strain after the electropolishing finishing.
● at mean strain between 0 to 1.5 %, the new fatigue endurance limit was observed
at 0.6 % strain amplitude, i.e. the fatigue endurance limit was increased by 150 %.
● 1.5 < at mean strain < 2.5 %, the new fatigue endurance limit was observed at 1.8 %
strain amplitude, i.e. the fatigue endurance limit was increased by 350 %.
● at mean strain larger than 6.5 % the fatigue endurance limit was noticed at 1 %
strain amplitude at 7.5 %, i.e. the fatigue endurance limit was increased by 250 % at
this point.
Therefore, according to the previous results, the electropolished freestanding films have
the highest fatigue endurance limit among all the published results on NiTi fatigue
resistance. The results of this work are exceeding all the literature fatigue endurance
limits in all regions by 350 %. In addition, it is expected that the surface finishing by
means of combined electropolishing and nitric acid treatment presented in Figure 76 (b)
might show a further increase in the fatigue endurance limit due to the high edge quality
achieved. This experiment was not investigated since an additional 3 months
experimental time is needed and that was not possible due to the working contract limit.

4.3 Biocompatibility
83
4.3 Biocompatibility
4.3.1 Cell growth and proliferation
As discussed in chapter 2.4, NiTi SMAs are used in several medical applications,
e.g. stent and heart valves, due to their great biocompatibility and stable mechanical
performance. Throughout this thesis, it was concluded that the sputtering parameter P(2)
from Table 7 and the heat treatment HT(2) in Table 8 resulted in an appropriate Af and
mechanical properties meant for NiTi thin film medical applications. In addition, the
films showed an outstanding fatigue resistance compared to other data published in
literature. The aim of this chapter is to investigate the biocompatibility of the NiTi films
produced by means of sputtering. In addition, the experiments aimed to investigate the
dependence of cell growth/adhesion on NiTi films modified with different surface
finishing, the same finishing treatment used in chapter 4.2.2. The biocompatibility of the
NiTi alloys is mainly due to the TiOx passive layer forming on the film, as explained in
chapter 2.4. The elemental composition of the passive layer covering the NiTi film was
identified by X-ray-photoelectron spectroscopy (XPS). The average of five scans result
indicate that the outer layer covering the NiTi films is composed of almost a 99 % of
TiO2 and 1 % of Ni. An example for one of the scans is illustrated in Figure 78. Before
cell culture investigations, SEM images were taken for the films surfaces after each
surface treatment applied. The purpose behind the SEM images was to give a general
overview on the film morphology after the surface treatments. In order to acquire films
with extreme surface roughness, films were sputtered on a silicon substrate with a surface
roughness of 100 nm, see Figure 79 (g) and (h). The results of the SEM measurements
are illustrated in Figure 79 as follows (a) as deposited film, (b) crystalline film, (c)
electropolished film treated with HNO3 solution for one day, (d) crystalline-
electropolished- H2O2 treated film for one day, (e) crystalline film treated with H2O2
solution for one day, (f) crystalline-electropolished film, (g) and (h) crystalline films
sputtered on silicon substrate with 100 nm surface roughness.
Figure 78: An example for the X-ray-photoelectron spectroscopy scan illustrating the elemental
composition on the NiTi film surface. Film were prepared using P(2) parameters and HT(2) conditions.

Chapter 4
84
In addition, AFM measurements were conducted to measure the surface roughness (Rrms)
of the NiTi films. The result of the AFM measurements shows that the amorphous films
had 6 nm Rrms, crystalline films had 65 nm Rrms, films treated with hydrogen peroxide
solution for one day had 140 nm Rrms, films treated with nitric acid solution for one day
had 30 nm Rrms, electropolished films had 10 nm Rrms and finally films sputtered on a
rough substrate had 240 nm Rrms. It was seen that the measured surface roughness of
amorphous films increased after crystallization. This occurs because the films were
crystallized at a very high heating rate. This change in surface roughness could be
clarified in terms of the nucleation and grain growth process. As grain growth increases
during the annealing process the film surface tension increases and as a consequence the
film surface becomes roughner [Agre06, Seng11, Zhang07, Xin10, Kara11]. The increase
of the surface roughness can be also accredited to the development of columnar structures
throughout the film crystallization during the annealing process [Zhang07].
Figure 79: SEM images showing the influence of the different applied surface treatments on the film
surface. (a) As deposited, (b) crystalline, (c) electropolished then treated with HNO3 solution for one day,
(d) crystalline, electropolished and then H2O2 treated for a day, (e) crystalline and treated H2O2 solution for
one day, (f) crystalline then electropolished, (g) and (h) crystalline films sputtered on silicon substrate with
100 nm surface roughness. A magnified image is displayed in the appendix.

4.3 Biocompatibility
85
The biocompatibility tests were conducted for 1, 3, and 7 days. A group of 10 images
using light microscope were taken at each day and used for cell counting. Later, the
average number of the living cells was calculated. The early results of the as deposited
films showed a great biocompatibility. Therefore the amorphous NiTi film was taken as a
control sample. Figure 80 shows the growth of living cells on the control specimen after
1, 3, and 7 days. For the as deposited film, the film was completely covered with live
cells after 7 days, as seen in Figure 80 (c). Due to the use of cell fluorescence staining,
the living cells on the film had a green fluorescence color while the dead cells had a red
fluorescence color, see Figure 80 (d).
a) b) c)
10 μm 50 μm 50 μm
d)
200 μm
Figure 80: Cell culture example at incubation time of 1, 3, and 7 days in figures (a), (b), and (c)
respectively. Figure (d) illustrates an example of the dead cells having the red fluorescence color after 7
days incubation time.
The biocombatibitly test results for all samples are illustrated in Figure 81. The figure
shows the cell growth after 1, 3, and 7 days. At the 7th
day, confluency was reached for
all samples
1 day 3 day
Incubation time (days)
35
30
25
20
15
10
5
0Nu
mb
er
of
co
un
ted
cell
s
1: As deposited
2: Crystalline
3: Crystalline, treated with HNO3
4: Crystalline, treated with H2O2
5: Electropolished films
6: 240nm surface roughness
7 day
Maximum cell count
possible at 7th day for
all samples
Figure 81: The biocompatibility test results showing the number of counted cells versus the incubation
times for 1, 3, and 7 days. The total surface area of the dog bone films was 39 mm2. The result shows
insignificant dependence of cell growth on film surface roughness.
At the 7th day the cells proliferation and growth reached more than 90 % confluency and
the cell counting was not possible anymore. The cells covered the dog bone films
completely and a clear contrast between the cells, shiny green fluorescent, and the film

Chapter 4
86
surface was not identified. However, the living cells on all films looked healthy, were
adhering strongly, and spreading uniformly on the dog bone film surface. Thus, the
results indicate that the freestanding NiTi films have a good biocompatibility. A very few
dead cells were observed as well, yet it was of insignificant amount compared to the
living cells, example illustrated in Figure 80 (d). In addition, the result in Figure 81
shows that the number of growing cells have only little dependence on the film surface
roughness at the 1, 3, and the 7th day.
The change in the film surface topography is expected to affect the living cells
considerably by hindering the transmission channels of nutrients or the cell waste
products and by initiating several strains, e.g. mechanical tension, in the cell cytoskeleton
[Poso02]. When the cell cytoskeleton is strained or deformed the cell growth and
proliferation will be influenced significantly. Figure 79 shows the films with rougher
surface, e.g. films treated with H2O2, haves grooves, hills, and valleys on the film surface.
The changes on the film topography can modify the orientation/growth of the cells
[Erbr95, Anse00, Ohar79]. In addition, it was reported that the cells can prefer a certain
growth alignment according to the surface topography, [Poso02]. This means that the
cells will grow in the groove direction and the cell adhesion to the film surface will
increase significantly. Nevertheless, at a certain groove depth, the cell growth might
cause a division in the cell cytoskeleton which will cause a severe cell deformation
[Poso02, Clar90]. In addition, these grooves can open an interface window for cell/Ni
interactions which will indubitably reduce the number of growing cells due to the toxic
effects of Ni ions. The magnitude of the topography depth could not be measured in the
previous experiments, e.g. Figure 79 (d), due to the SEM limit of detection. In general, a
significant dependence of cell growth/adhesion was not seen in the previous experiment.
The results suggest that cell growth was uniformly distributed on all the films surfaces
and the films were covered completely with living cells. The previous facts indicate that
all investigated films have a good biocompatibility and that the critical limit for surface
roughness vs. cell growth was not reached. Additionally, it is really hard to generalize the
effect of biocompatibility dependence on surface morphology, since different cells types
were used in the literature. However, only one cell type was used in this experiment and
each cell type might show a different behaviour.
4.3.2 Ni ion release
During the service life of a NiTi alloy, the biocombatibitly can be reduced drastically
when high concentration of Ni ions is released from the alloy into the host body. It was
planned in this work to investigate the Ni ion release under cyclic loading at Oral medical
technology laboratory in Bonn University - Germany. However, the experiment was not
conducted due to technical errors at our partners fatigue test unit. The Ni ions limit the
cell growth and the cell proliferation on the alloy surface [Castl81, Shab96]. Therefore,
the aim of this experiment was to evaluate the Ni ion release under in vitro condition for
the freestanding NiTi films fabricated using P(2) and HT(2) parameters, see Table 7 and
Table 8. Films treated with different surface treatments were investigated. The results are
demonstrated in Figure 82. The results show that all films have a Ni ion release rates
significantly below the expected average nutritional intake, see chapter 2.4. Only films
treated with hydrogen peroxide had elevated level of Ni ion releases when compared to
the rest of the films. This might occur due to the high surface roughness and the cracks
appearing on the TiOx passive layer covering the film, see Figure 68 and Figure 79 (e).

4.3 Biocompatibility
87
The mentioned micro-cracks will expose the film surface to the solution and thereby
releasing more Ni ions. It was concluded from chapter 4.2.2 results that electropolished
films have outstanding fatigue endurance limits. As well the films have a very low Ni
ions release rates below 1.5 µg/l after 45 days, i.e. 0.03 µg/l/day. The Ni ion
concentration for the electropolished/HNO3 treated films was investigated after surviving
10 million straining cycles using Table 10 parameters. The film displayed a maximum Ni
ion release rate about 4.1 µg/l after 45 days, i.e. 0.09 µg/l/day, see Figure 82. The results
verify the high stability of the Ni ion release under static condition and therefore the high
compatibility of the films. It was planned to perform the Ni ion release test under
dynamic fatigue tests, but due to technical problems with partners and time limitation this
was not possible. Moreover, it is expected that the majority of the Ni ions will be released
during the first week of the test. The maximum amount of the Ni ion released in Figure
82 is 0.12 µg/l/day after 45 days, except films treated with hydrogen peroxide which has
1.06 µg/l/day. The latter rate is roughly four orders of magnitude below the daily dietary
intake of 20,000 µg/l/day [Blac81], two orders of magnitude below the daily dietary
intake 300 to 500 µg/l/day [Arnd05], and below the nickel ion safety limit of 600 to 2500
µg/1/day essential to stimulate a nickel allergy [Schr62].
Figure 82: In vitro Ni ion release test results of freestanding NiTi films in PBS solution. The films were
produced using P(2) and H(2) parameters from Table 7 and Table 8, respectively. The data have a standard
deviation of 0.2 µg/l.
Furthermore, the films treated with hydrogen peroxide are below all the previous
mentioned limits for biocompatibility aspects, regardless of the fact they have higher Ni
ion release rates compared to the rest of the films in this experiment. The
biocompatibility investigation tests in chapter 4.4.1 are in good agreement with the Ni ion
release results. The finding suggest that a uniform and dense TiO2 layer is formed on the
NiTi films with insignificant level of point defects resulting in a high biocompatibility
features. Therefore, the excellent fatigue characteristics and the great biocompatibility of
the freestanding NiTi films present them as high potential candidates for medical
implants, e.g. stents, and several other NiTi film based devices.
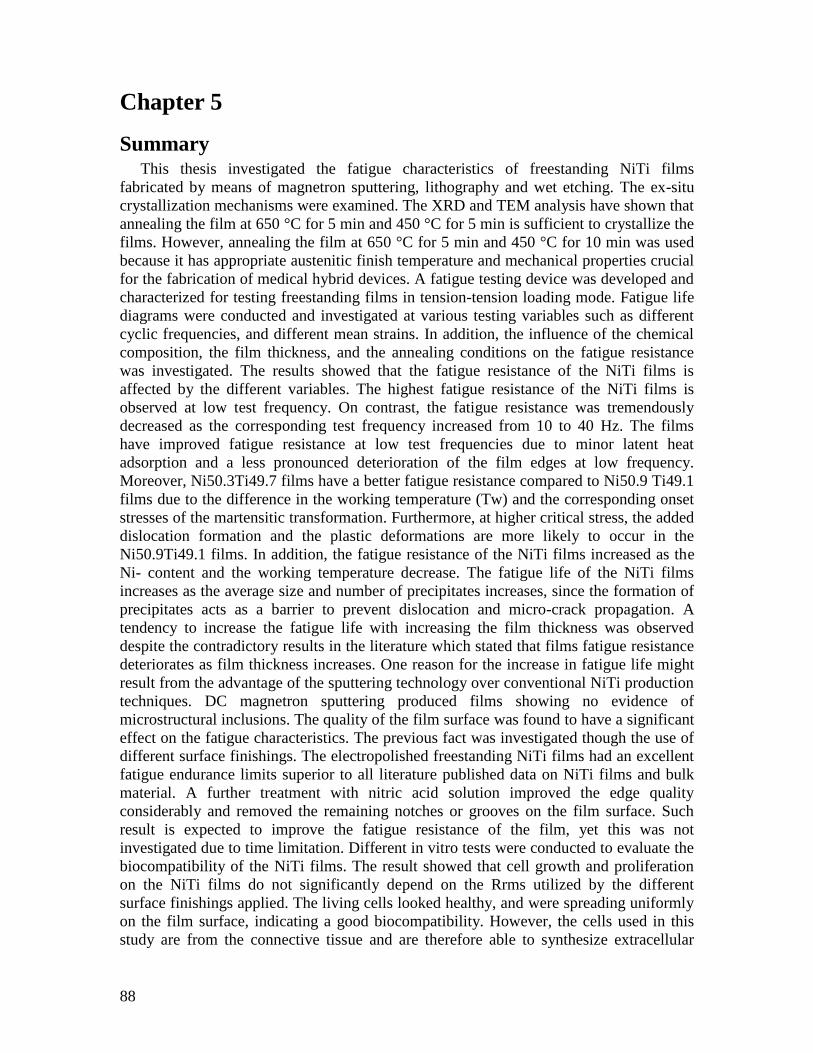
88
Chapter 5
Summary This thesis investigated the fatigue characteristics of freestanding NiTi films
fabricated by means of magnetron sputtering, lithography and wet etching. The ex-situ
crystallization mechanisms were examined. The XRD and TEM analysis have shown that
annealing the film at 650 °C for 5 min and 450 °C for 5 min is sufficient to crystallize the
films. However, annealing the film at 650 °C for 5 min and 450 °C for 10 min was used
because it has appropriate austenitic finish temperature and mechanical properties crucial
for the fabrication of medical hybrid devices. A fatigue testing device was developed and
characterized for testing freestanding films in tension-tension loading mode. Fatigue life
diagrams were conducted and investigated at various testing variables such as different
cyclic frequencies, and different mean strains. In addition, the influence of the chemical
composition, the film thickness, and the annealing conditions on the fatigue resistance
was investigated. The results showed that the fatigue resistance of the NiTi films is
affected by the different variables. The highest fatigue resistance of the NiTi films is
observed at low test frequency. On contrast, the fatigue resistance was tremendously
decreased as the corresponding test frequency increased from 10 to 40 Hz. The films
have improved fatigue resistance at low test frequencies due to minor latent heat
adsorption and a less pronounced deterioration of the film edges at low frequency.
Moreover, Ni50.3Ti49.7 films have a better fatigue resistance compared to Ni50.9 Ti49.1
films due to the difference in the working temperature (Tw) and the corresponding onset
stresses of the martensitic transformation. Furthermore, at higher critical stress, the added
dislocation formation and the plastic deformations are more likely to occur in the
Ni50.9Ti49.1 films. In addition, the fatigue resistance of the NiTi films increased as the
Ni- content and the working temperature decrease. The fatigue life of the NiTi films
increases as the average size and number of precipitates increases, since the formation of
precipitates acts as a barrier to prevent dislocation and micro-crack propagation. A
tendency to increase the fatigue life with increasing the film thickness was observed
despite the contradictory results in the literature which stated that films fatigue resistance
deteriorates as film thickness increases. One reason for the increase in fatigue life might
result from the advantage of the sputtering technology over conventional NiTi production
techniques. DC magnetron sputtering produced films showing no evidence of
microstructural inclusions. The quality of the film surface was found to have a significant
effect on the fatigue characteristics. The previous fact was investigated though the use of
different surface finishings. The electropolished freestanding NiTi films had an excellent
fatigue endurance limits superior to all literature published data on NiTi films and bulk
material. A further treatment with nitric acid solution improved the edge quality
considerably and removed the remaining notches or grooves on the film surface. Such
result is expected to improve the fatigue resistance of the film, yet this was not
investigated due to time limitation. Different in vitro tests were conducted to evaluate the
biocompatibility of the NiTi films. The result showed that cell growth and proliferation
on the NiTi films do not significantly depend on the Rrms utilized by the different
surface finishings applied. The living cells looked healthy, and were spreading uniformly
on the film surface, indicating a good biocompatibility. However, the cells used in this
study are from the connective tissue and are therefore able to synthesize extracellular

89
matrix proteins such as fibronectin (Fn), which might have helped the cell adhesion and
proliferation to some extent. This might have influenced the cell/environment interaction,
i.e. that the cells are not passively responding to the environment change. The experiment
should in the future be extended to further cell types (e.g. endothelial cells) to receive a
comprehensive picture of the dependence of cell behavior of NiTi surface roughness. On
the other hand, the nickel ion release tests showed that the Ni release can be optimized
according to the surface treatment used. However, all the films produced in this study
have a Ni ion release rates which is significantly below the daily dietary intake and toxic
levels. Furthermore, the results of this thesis show that the micropatterned freestanding
NiTi films fabricated by means of sputtering technology have an excellent fatigue
endurance limits which surpass all published literature values. In addition, the films have
great biocompatibility characteristics based on the cell growth, proliferation, and Ni ion
release tests. Accordingly, the NiTi film fabricated in this work opens an enormous
opportunities for future application in the medical fields as well as other new applications
based on NiTi thin film devices

90
Chapter 6
Literature
[Agre06] J. Agren, Y. Brechet, C. Hutchinson, J. Philibert,G. Purdy,
Thermodynamic and phase transformations. EDP press, page 53-58,
France, 2006.
[Ahas04] American heart association, International cardiovascular disease
statistics, statistical fact sheet, 2004.
[Alla02] J. K. Allafi, A. Dlouhy, G. Eggeler, Ni4Ti3-precipitation during aging
of NiTi shape memory alloys and its influence on martensitic phase
transformations. Acta Materialia, Vol. 50(17), page 4255-4274, 2002.
[Ande03] J. C. Anderson, K. D. Leaver, P. Leevers, R. D. Rawlings, Materials
Science for Engineers. Nelson Thornes Ltd, 2003.
[Ande96] J. M. Anderson, Inflammation wound healing and the foreign body
response. In: Davies., JE(ed.) The bone-biomaterial interface,
University of Toronto press, Toronto, page 165-173, 1996.
[Anse00] K. Anselme, M. Bigerelle, B. Noel, E. Dufresne, D. Judas, A. Iost, P.
Hardouin, Qualitative and quantitaive study of human osteoblast
adhesion on material with various surface roughnesses, J. Biomed.
Mater. Res., Vol. 49, page 155-166, 2000.
[Arnd05] M. Arndt, A. Brück, T. Scully, A. Jäger, C. Bourauel, Nickel ion
release from orthodontic NiTi wires under simulation of realistic in-
situ conditions, Journal of material science, Vol. 40, page 3659-3667,
2005.
[Arzt98] E. Arzt, Size effects in materials due to microstructural and
dimensional constraints: A comparative review, Acta Materialia, Vol.
46, no. 16, page 5611-5626, 1998.
[ASTM96] ASTM. Standard test methods for determining average grain size,
E112-E196.
[Augu10] C. Auguet, G. Carreras, A. Isalgue, V. Torra, R. Barros & A.
Premount (ed), Self-heating effects on the hysteresis width of SMA,
Proceedings of School and Symposium Smart Structural Systems and
Technologies, S(3)T, page 483-495, Portugal, 2010
[Benj80] D. Benjamin, Metals Handbook: Properties and Selection: Stainless
Steels, Tool Materials and Special-Purpose Metals, Vol. 3, 9th
edition, American Society for Metals, page 130, 1980.
[Blac05] J. Black, Biological Performance of Materials: Fundamentals of
Biocompatibility, 4edition, New York, 2005.
[Blac81] J. Black, Systemic distribution and excretion, In: Plonsey R & Katz
JL (eds) Biomedical engineering and instrumentation, Marcel Dekker
Inc., New York, page 180, 1981.
[Borj08] M. Brojanl, D. Bombac, F. Kosel1, T. Videnic, Shape memory alloys
in medicine, Materials and Geoenvironment, Vol. 55, No. 2, page
173-189, 2008.

91
[Brin04] L.C. Brinson et al., Stress-induced transformation behavior of a
polycrystalline NiTi shape memory alloy: micro and
macromechanical investigations via in situ optical microscopy, J.
Mech. Phys. Solids., Vol 52, page 1549-1571, 2004.
[Brow87] S. A. Brown, Biomaterials corrosion and wear. In: Webster JG (ed.)
Encyclopedia of medical devices and instrumentation, Vol. 2.Wiley,
New York, page 351-361, 1987.
[Brun88] D. M. Brunette, The effects of surface topography on the behaviour
of cells on implants, Int. J. of Oral Maxilliofacial Implantology, Vol.
3, page 231-246, 1988.
[Buch90] J. D. Busch, A. D. Johnson, C. H. Lee, D. A. Stevenson, Shape
memory properties in Ni‐Ti sputter‐deposited film. J. Appl. Phys.,
68(12), page 6224-6228, 1990.
[Calli06] W. D. Callister, Materials Science and Engineering: An Introduction,
page 215-250, John Wiley and sons, Inc, 2006.
[Camp08] F. Campbell, Elements of metallurgy and engineering alloys, ASM
international, chapter 14, 2008.
[Carr11] G. Carreras, F. Casciati, S. Casciat, A. Isalgue, A. Marzi, V. Torra,
Fatigue laboratory tests toward the design of SMA portico-braces,
Smart Structures and Systems, Vol. 7(1), page 41-57, 2011.
[Carr11] G. Carreras, F. Casciati, S. Casciat, A. Isalgue, A. Marzi, V. Torra,
Fatigue laboratory tests toward the design of SMA portico-braces,
Smart Structures and Systems, Vol. 7(1), page 41-57, 2011.
[Castl81] L.S. Castleman, S.M. Motzkin, The biocompatibility of NiTi, in:
D.F.Williams (Ed.), Biocompatibility of Clinical Implants Materials,
CRC Press, Boca Raton, FL, page 129, 1981.
[Chan97] L. W. Chang, D. S. Grummon, Structure evolution in sputtered thin
films of Ti-x (Ni,Cu)(1-x ) 1, Diffusive transformation phil. Mag, A
76(1), 1997.
[Chen01] J. Z. Chen, S. K. Wu, Crystallization temperature and activation
energy of rf-sputtered near equiatomic TiNi and Ti50Ni50Cu10 thin
films, J. Non-crystaline solids 288(1-3), page 159-165, 2001
[Chu06] C. L. Chu, C. Y. Chung, P. K. Chu, Surface oxidation of NiTi shape
memory alloy in a boiling aqueous solution containing hydrogen
peroxide, Materials Science and Engineering, Vol. A 417, page 104–
109, 2006.
[Clar90] P. Clark, P. Connolly, A. S. G. Curtis, J. A. T. Dow, C. D. W.
Wilkinson, Topographical control of cell behaviour: multiple grooved
substrata, Development, Vol. 108, page 635-644, 1990.
[Colu00] A. Columbo, Techniques in Coronary Artery Stenting, the American
Heart Association, Dallas, USA, chapter 1-2, 2000.
[Conr00] H. Conrad, J. Narayan, On the grain size softening in nanocrystalline
materials, Scripta Mater; 42(11), page 1025–30, 2000.
[Cour10] D. Courty, Ultra high cycle fatigue of thin Al based films, Karlsruher
Institute For Technology, PhD thesis, 2010.
[Diet88] G.E. Dieter, Mechanical Metallurgy, McGraw-Hill Book Co.,
Columbus, OH, page 402–19, 1988.

92
[Duer11] T. Duerig, A. Pelton, C. Trepanie, Nitinol Alloying and Composition,
chapter 9, ASM international, 2011.
[Duer99] T. Duerig, A. Pelton, D. Stoeckel, An overview of nitinol medical
applications, Mater. Sci. Eng. A, A273–A275, page 149– 160, 1999.
[Dwill03] D. Williams, Revisting the definition of biocompatibility, Med
Device Technol, Vol. 14(8), page 3-10, 2003.
[Eber05] C. Eberl, Fatigue of Al thin films at ultra high frequencies, University
of Stuttgart, PhD thesis, 2005.
[Eber06] C. Eberl, R. Spolenak, E. Arzt, F. Kubat, A. Leidl, W. Ruile, O.
Kraft. Ultra high cycles Fatigue in pure AL thin films and line
structures, Mater Sci Eng A, 421(1-2), page 68-76, 2006.
[Elia02] T. Eliades, A. E. Athanasiou, In vivo aging of orthodontic alloys:
Implications for corrosion potential, nickel release, and
biocompatibility. Angle Orthod., Vol. 72, page 222-237, 2002.
[Ente00] D. Entemeyer, E. Patoor, A. Eberhardt, M. Berveiller, Strain rate
sensitivity in superelasticity, Int. J. Plasticity, Vol.16, page 1269–
1288, 2000.
[Erbr95] E. T. Braber, J. E. Ruijter, H. T. Smits, L. A. Ginsel, A .F. Recum, J.
A. Jansen, Effect of parallel surface microgrooves and surface energy
on cell growth, J. Biomed. Mater, Vol. 29(4), page 511-518, 1995.
[Esen06] S. A. Esenwein, D. Bogdanski, M. Köller, L. Krone, M. Epple, G.
Muhr, Clinical Applications of Shape Memory Alloys Based on NiTi
as Implant Materials - Possibilities in Trauma and Orthopaedic
Surgery. SMST Proceedings page 837- 844, 2006.
[Fnbi01] Food and Nutrition Board, Institute of Medicine, Dietary reference
intakes for vitamin, K, arsenic, boron, chromium, copper, iodine,
iron, manganese, nickel, silicon, vanadium, and zinc. National
Academy Press, 2001.
[Fors69] P. J. E. Forsyth, the physical Basis of Metal Fatigue, American
Elsevier Publishing Co., New York, 1969.
[Fren04] J. Frenzel, Z. Zhang, K. Neuking, G. Eggeler, High quality vacuum
induction melting of small quantities of niti shape memory alloys in
graphite crucibles. Journal of Alloys and Compounds,Vol. 385: page
214–223, 2004.
[Fuch80] H.O. Fuchs, R.I. Stephens, Metal fatigue in engineering: New York,
Wiley Inc print, 1980.
[Grum01] D.S. Grummon, J. Yhang, Stress in sputtered films near equiatomic
TiNiX on (100) Si: intrinsic and extrinsic stresses and their
modification by thermally activated mechanisms. Physica Status
Solidi A 186(1), page 17-39, 2001.
[Hadr01] A. Hadrboletz, B. Weiss, G. Khatibi, Fatigue and fracture properties
of thin metallic foils, Int.j.fract, Vol. 107, page 307, 2001.
[Han06]
X. D. Han, S.C. Mao, Q. Wei, Y.F. Zhang and Z.hang. In-situ TEM
study of the thickness impact on the crystallization features of a near
equal atomic TiNi thin film prepared by planar magnetron sputtering.
Materials Transaction 47 (3), page 536-539, 2006.
[Hana91] T. Hanawa, Titanium and its oxide film: a substrate for formation of

93
apatite, in: J.E. Davies (Ed.), The Bone Biomaterial Interface,
University of Toronto Press, Toronto, page 49, 1991.
[Harri00] W. J. Harrison, Z.C. Lin, The study of nitinol bending fatigue,
Proceedings of the International Conference on SMST, page 391-396,
2000.
[Haua00] H. B. Hauang, F. Spaepen, Tensile testing of free standing Cu, Ag, Al
thin films, and AG/Cu multilayers. Acta Mater, 48(12): page 3261-
3269, 2000.
[Heck03] A. Heckmann, E. Hornbogen, Effects of thermomechanical pre-
treatments on pseudo-elastic fatigue of a NiTi alloy. Materials
Science Forum, 394-395: page 325-328, Switzerland, 2003.
[Higg93] R. A. Higgins, Engineering Metallurgy, Applied Physics Metallurgy,
6th ed., Arnold, 1993.
[Holz99] R. L. Holz, K. Sadananda, M.A. Imam, Fatigue thresholds of Ni-Ti
alloy near the shape memory transition temperature, Inter. J. of
Fatigue, Vol. 21, page 137-145, 1999.
[Homm99] M. Hommel, O. Kraft, A new method to study cyclic deformation of
thin films in tension and compression, J. mater. res, 14(6), page
2373, 1999.
[Hong96] S. Hong, R. Weil, Low cycle fatigue of thin copper foils. Thin solid
films, Vol. 283, page 175-181, 1996.
[Horn56]
E. Hornbogen, G. Wassermann, Phasenumwandlungen in β-CuZn,
Zeitschrift für Metallkunde, Vol.47, page 427, 1956.
[Ichi84] S. Ichimura, H. Shimizu, H. Murakami, I. Yoichi, Effect of surface
segregation on angular distributions of atoms sputtered from binary
alloys. Journal of Nuclear Materials, 128-129: page 601–604, 1984.
[Ishi03] A. Ishida and M.Sato, Thickness effect on shape memory behaviour
of Ti-50.0at.%Ni thin film, Acta Materialia, 51(18), page 5571-5578,
2003.
[Jaeg01] R. C. Jaeger, Introduction To Microelectronic Fabrication, 2 ed.
Auburn, Upper Saddle River, 2001.
[Jkim05] J. Kim, S. Miyazaki. Comparison of shape memory characteristics of
aTi-50.9 at. pct Ni alloy aged at 473 and 673 K, Metallurgical and
Materials Transactions A, Vol. (36)A, page 3301-3310, 2005.
[Jone96] D. A. Jones, Principles and Prevention of Corrosion, Second Edition,
Prentice Hall, New York, 1996.
[Kara11] J. Karamdel, C. F. Dee, B. Y. Majkis. Effects of Annealing
Conditions on the Surface Morphology and Crystallinity of Sputtered
ZnO Nano Films, Sains Malaysiana, Vol. 40(3), page 209–213, 2011.
[Kato85] M. Kato, H.-R. Pak, Some remarks on thermodynamics of stress-
induced martensitic transformations. Phys. Status Solidi B, 130: page
421–430, Yokohana, 1985.
[Kell00] P. J. Kelly, R.D. Arnell, Magnetron sputtering: a review of recent
developments and applications, Vacuum 56, page 159-172, 2000.
[Kell98] R. M. Keller, S.P. Baker, E. Arzt, Quantitative analysis of
strengthening mechanisms in thin Cu films: effects of film thickness,
grain size and passivation, J. Mater Res 13, page 1307, 1998.

94
[Kell99] R. M Keller, S. P. Baker, E. Arzt, Stress-temperature behavior of
unpassivated thin copper films, Acta mater., 47(2), page 415, 1999.
[Komp02]
M. Kompatscher, B. Deme, G. Kostorz, C. Somsen , E. F.
Wassermann, Small-angle neutron scattering of precipitates in Ni-Ti
shape memory alloys. Acta Materialia. 50: page 1581-1586, 2002.
[Kraf01] O. Kraft, R. Schwaiger, P. Wellner. Fatigue in thin film: lifetime and
damage formation, Mater Sci Eng A, 319: page 919-923, 2001.
[Kraf02] O. Kraft, P. Wellner, M. Hommel, R. Schwaiger, E. Arzt, Fatiuge
behaviour of polycrystalline thin copper film, Z Metall, 93(5), page
392-400, 2002.
[Kuja04] S. Kujala, A. Pajala, M. Kallioinen, A. Pramila, J. Tuukkanen, J.
Ryhanen, Biocompatibility and strength properties of nitinol shape
memory alloy suture in rabbit tendon, Biomaterials,1, 25(2): page
353-358, 2004.
[Kurd49] G. V. Kurdjumov, L. G. Khandros, First reports of the thermoelastic
behaviour of the martensitic phase of Au-Cd alloys, Doklady
Akademii
Nauk SSSR, Vol. 66, page 211–213, 1949.
[Lamp96] S. R. Lampman, Fatigue and fracture, ASM handbook, volume 19,
USA, 1996.
[Lang04] K. M. Lang, D. A. Hite, R. W. Simmonds, R. McDermott, D. P.
Pappas, J. M. Martinis, Conducting atomic force microscopy for
nanoscale tunnel barrier characterization, Review of Scientific
Instruments, Vol.75, page 2726–2731, 2004.
[Lee05] H. J. Lee, H. Ni, D.T. Wu, A.G. Ramirey, Grain size estimations
from the direct measurement of nucleation and growth. Appl. Phys.
Lett., page 19-87, 2005.
[Liu07] K. T. Liu, J. G. Duh, Kinetics of the crystallization in amorphous
NiTi thin films. J Non-Cryst Solid, Vol. 353, page 1060-1064, 2007.
[Lope03] T. L. Lopes, X. Y. Gong, C. Trepanier. Fatigue performance of
nitinol tubing with Af of 25°C, SMST-2003, USA, page 311-320,
2003.
[Lowe87] B. F. Lowenberg, R.M. Pilliar, J.E. Aubin, G.R. Fernie, A.H.
Melcher, Migration, Attachment, and Orientation of Human Gingival
Fibroblasts to Root Slices, Naked and Porous-surfaced Titanium
Alloy Discs, and Zircalloy 2 Discs in vitro, J. Dent. Res. 66, 1000,
1987.
[Mado11] M. Madou, Fundamentals of Microfabrication, CRC Press, Irvine,
2011.
[Maga93] S. Magaino, M. Matlosz, D. Landolt, An impedance study of stainless
steel electropolishing, J Electrochem Soc., Vol. 140, page 1365,
1993.
[Manc03] A. Manceur, F. Chellat, Y. Merhi, Y. Chumlyakov, L. H. Yahia, In
vitro cytotoxicity evaluation of a 50.8% NiTi single crystal. Journal
of Biomedical Materials Research Part A.67A: page 641-646, 2003.
[Mart06] R. M. SMartins, F. M. B. Fernandes, R. J. C. Silva, et al. The
influence of poly-Si intermediate layer on the crystallization

95
behaviour of Ni-Ti SMA magnetron sputtered thin films, Appl. Phys,
A83 (1), page 139-145, 2006.
[Mats99] T. Matsunaga, S. Kajiwara, K. Ogawa, T. Kikuchi, S. Miyazaki, High
strength Ti Ni- based shape memory alloy thin films, Mater. Sci.
Engng., Vol. A, page 745-748, 1999.
[Mcke01] A. L. McKelvey, R. O. Ritchie, Metallurgical and Materials
Transactions, Vol. 32A, page 731-743, 2001.
[Mcni81] J. L. McNichols, P. C. Brookes, J. S. Cory, J. Appl. Phys. 52, Vol.12,
page 7742–7444, 1981.
[Melt79] K. N. Melton, O. Mercier, Fatigue of NiTi thermoelastic martensites,
Acta Metall, Vol. 27, page 137-144, 1979.
[Mess84] R. Messier, A. P. Giri, R. A. Roy, Revised structure zone model for
thin film physical structure, J.Vac.Sci.Technol. A2, Vol.2, 500-503,
1984.
[Mira09] R. Lima de Miranda, Fabrication of TiNi thin film stents, PhD thesis,
University of Kiel, 2009.
[Mira12] R. Lima de Miranda, C. Zamponi, E. Quandt, Micropatterned
Freestanding Superelastic TiNi Films, Adv.Eng.Mater, 15: 66–69,
2012.
[Miya09.2] S. Miyazaki, Y. Fu, W. Huang, Thin Film Shape Memory Alloys,
chapter 2, Cambridge University Press, Cambridge, 2009.
[Miya09.3] S. Miyazaki, Y. Fu, W. Huang., Thin Film Shape Memory
Alloys, chapter 3, Cambridge University Press, Cambridge, 2009.
[Miya09.5] S. Miyazaki, Y. Fu, W. Huang., Thin Film Shape Memory Alloys,
chapter 5, Cambridge University Press, page 133, 2009.
[Miya09]
S. Miyazaki, Y. Fu, W. Huang., Thin Film Shape Memory
Alloys, chapter 1, Cambridge University Press, 2009.
[Miya97] Y. S. Kim, S. Miyazaki, Fatigue life of Ti–50 at.% Ni and Ti40Ni10Cu
(at.%) shape memory wires, Proceedings: SMST-97, page 473-477,
1997.
[Miya99] S. Miyazaki, A. Ishida, Martensitic transformation and shape memory
behavior in sputter-deposited TiNi-base thin films. Materials Science
and Engineering a-Structural Materials Properties Microstructure and
Processing, 273, page 106-133, 1999.
[Möni05] R. Mönig, Thermal fatigue of Cu thin films, PhD thesis, University of
Stuttgart, 2005.
[Morg03] N. B. Morgan, J. Painter, A. J. Moffat, Mean strain effects and
microstructural observation during in-vitro fatigue testing of NiTi.
SMST-03, page 303-310, 2003.
[Morr65] J. Morrow, cyclic plastic strain energy and fatigue of metals, Internal
friction, damping, and cyclic plasticity, ASTM STP 378, page 45,
1965.
[Morr90] Z. Mei, J. W. Morris, Influence of deformation-induced martensite on
fatigue crack propagation in 304-type steels, Metallurgical
transactions A, Vol. 21, page.3137-3152, 1990.
[Naya09] N. Nayan, V. Buravalla, U. Ramamurty, Effect of mechanical cycling
on the stress–strain response of a martensitic Nitinol shape memory

96
alloy, Material science and engineering, Vol. 525, page 60-67, 2009.
[Nish86]
M. Nishida, C. M. Wayman, T. Honma. Precipitation processes in
nearequiatomic tini shape memory alloys. Metall. Trans. A, Vol.
17A, page 1505, 1986.
[Nix89] W. D. Nix, Mechanical properties of thin films. Metal Trans A,
20(11), page 2217-2245, 1989.
[Ohar79] P. T. Ohara, R .C. Buck, Contact guidance in vitro: a light
transmission and scanning electron microscopic study, Exp. Cell
Res., Vol. 121(2), page 235-249, 1979.
[Ohri92] M. Ohring, The Materials Science of The Thin Films, Academic
press, New Jersey, 1992.
[Oshi92] Y. Oshida, R. C. Sachdeva, S. Miyazaki, Micro-analytical
characterization and surface modification of TiNi orthodontic
archwires, Biomed.Mater.Eng., Vol. 2, page 51-69, 1992.
[Otsu05] K. Otsuka, X. Ren, Physical metallurgy of Ti-Ni-based shape
memory alloys. Progress in Materials Science, Vol. 50, page 511-
678, 2005.
[Otsu86] K. Otsuka, K. Shimizu, Pseudoelasticity and Shape Memory Effects
in Alloys, Int. Metals. Rev., Vol. 31, page 3-93, 1986.
[Otsu98]
K. Otsuka, C. M. Wayman, Shape Memory Materials. Cambridge
University Press, Cambridge, 1998.
[Pasl78] Y. I. Paskal, L. A. Monasevieh, Phenomenological characteristics of
martensitic hysteresis, Russian Physics Journal, Vol. 21, page 1466–
1471, 1978.
[Pati11] S. Bhat, R. Patibandla, E. V. Morales (ed), Alloy Steel - Properties
and Use, chapter 9, In Tech, 2011.
[Pelt00] A. R. Pelton, J. Dicello, S. Miyazaki, Optimization of Processing and
Properties of Medical Grade Nitinol Wire, Min. Invas. Ther. &
Allied. Technol., 9 (2), page 107, 2000.
[Pelt03] A. R. Pelton, X. Y. Gong, T. Duerig, Fatigue Testing of
Diamond‐Shaped Specimens, Proceedings of SMST, Monterey,
2003.
[Pelt08.a] A. R. Pelton, V. Schroedera, M. R. Mitchellb, X. Y. Gongc, M.
Barneya, S.W. Rebertson, Fatigue and durability of Nitinolstents,
Journal of the mechanical behaviour of biomedical materials , Vol 1,
page 153-164, 2008.
[Pelt08] A. R. Pelton, V. Schroeder, M.R. Mitchell, X.Y. Gong, M. Barney,
and S.W. Robertson, Fatigue testing of diamond shaped specimens,
J.Mech. Behav. Biomed.Mater, Vol. 1, page 153-164, 2008.
[Pelt11] A. R. Pelton, Nitinol Fatigue: A Review of Microstructures and
Mechanisms. J Mater Eng Perform., Vol. 20, page 613-617, 2011.
[Pelt99] T. Duerig, A. R, Pelton, D. Stocke, An overview of nitinol medical
applications. Materials Science and Engineering a-Structural
Materials Properties Microstructure and Processing, Vol. 273, page
149-160, 1999.
[Pelto03] A. R. Pelton, X.Y. Gong, T. Duerig, Fatigue testing of diamond
shaped specimens, Proceeding of the international conference on

97
shape memory alloys and superelastic technologies. International
organization on SMST, CA, page 293-302, 2003.
[Polak54] N. H. Polakowski, A. Palchoudhuri, softening of certain cold-worked
metals under the action of fatigue loads, Proc.ASTM, Vol. 54, page
701, 1954.
[Port81] D. A. Porter, K. E. Easterling, Phase Transformations in Metals and
Alloys. Van Nostrand Reinhold, New York, 1981.
[Poso02] L. Ponsonnet, V. Comte, A. Othmane, et al. Effect of surface
topography and chemistry on adhesion, orientation and growth of
fibroblasts on nickel-titanium substrates. Materials Science &
Engineering C-Biomimetic and Supramolecular Systems, Vol. 21,
page 157-165, 2002.
[Pred03] W. Predki, M. Klonne, A. Knopik, Fatigue behaviour of superelastic
niti alloys subjected to torsional loading, Proceeding of SMST,
International organization on SMST, CA, page 285-292, 2003.
[Putt92] J.L. Putters, S.D. Kaulesar, Comparative cell culture effects of shape
memory metal (Nitinol), nickel and titanium, Eur. Surg. Res., Vol.
24, page 378, 1992.
[Quan96] E. Quandt, C. Halene, H. Holleck, K. Feit, M. Kohl, P.
Schloßmacher, A. Skokan,K.D. Skrobanek, Sputter deposition of
TiNi, TiNiPd and TiPd films displaying the two-way shape memory
effect, Sensors and Actuators A, Vol. 53, page 434-439, 1996.
[Rezu87] W. N. Rezuke, J. A. Knight, F. W. J. Sunderman, Reference values
for nickel concentrations in human tissues and bile, Am.J.Ind.Med.,
Vol. 11, page 419-426, 1987.
[Rober07] S. W. Robertsona, A. Mehtab, A. R. Peltonc, R. O. Ritchiea,
Evolution of crack-tip transformation zones in superelastic Nitinol
subjected to in situ fatigue: A fracture mechanics and synchrotron X-
ray microdiffraction analysis, Acta. Materialia., Volume 55, Issue 18,
page 6198–6207, 2007.
[Rober12] S. W. Robertson, A. R. Pelton, R. O. Ritchie, Mechanical fatigue and
fracture of Nitinol, International Materials Reviews, Vol. 57, page 1-
36, 2012.
[Sabu82] T. Saburi, T. Tastsumi and S. Nenno, Effects of heat treatment on the
mechanical behaviour of Ti-Ni alloys, J. de Phys., 43, C4-261, 1982.
[Sanj05]
S. Sanjabi, S. K. Sadmezhaad, K. A. Yates, Z. H. Barber, Growth and
characterization of TixNi1-x shape memory thin films using
simultaneous sputter deposition from separate elemental targets, Thin
Solid Films, Vol. 491, page 190-196, 2005.
[Sato00] A. Ishida, M. Sato, T. Kimura, S. Miyazaki, Stress-strain curves of
sputter-deposited Ti-Ni thin films, Philos Mag A-Phys Condens
Matter Struct Defect Mech Prop, Vol. 80, page 967-980, 2000.
[Sato96] A. Ishida, A. Takei, M. Sato, S. Miyazaki, Stress-strain curves of
sputtered thin films of Ti-Ni, Thin Solid Films, Vol. 282, page 337-
339, 1996.
[Schr62] H. A. Schröder, J. J. Balassa, I. H. Tipton, Abnormal trace metals in man , J. Chronic Dis., Vol. 15(51), page 941-964,1962.

98
[Schu96] W. Schutz, A history of fatigue. Engineering Fracture Mechanics,
Vol. 54, page 263-300, 1996.
[Schw03] R. Schwaiger, G. Dehm, O.Kraft, Cyclic deformation of
polycrystalline Cu films, Philos. mag. A., Vol. 83(6), page 693, 2003.
[Sehi99]
K. Gall K, H. Sehitoglu, Y. L. Chumlyakov, I. V. Kireeva, H. J.
Maier, J. Eng. Mater. Technol, Vol. 121, page 19-27, 1999.
[Seng11] J. Sengupta, R. K. Sahoo, K. K. Bardhan, C. D. Mukherjee, Influence
of annealing temperature on the structural, topographical and
opticalproperties of sol–gel derived ZnO thin flms, Materials Letters,
Vol.65, page 2572-2574, 2011.
[Shab96] S. A. Shabalovskaya, On the nature of the biocompatibility and on
medical applications of NiTi shape memory and superelastic alloys,
Bio-Med. Mater. Eng., Vol. 6, page 267-289, 1996.
[Shabo12] S. A. Shabalovskaya, J. W. Anderegg, A. Undisz, M. Rettenmayr, G.
C. Rondelli, Corrosion resistance, chemistry, and mechanical aspects
of Nitinol surfaces formed in hydrogen peroxide solutions. J Biomed
Mater Res Part B., Vol. 100B, page 1490-1499, 2012.
[Sigm78] P. Sigmund: Theory of sputtering. I. Sputter yield of Amorphous and
Polycrystaline Targets. Phys.Rev., Vol. 184, page 383, 1978.
[Smit95] D. L. Smith, Thin-film deposition: principles and practice, McGraw-
Hill Inc.,Boston, 1995.
[Sojt10] P. Sojitra, C. Engineer, D. Kothwala, A. Raval,H. Kotadia, G.
Mehta., Electropolishing of 316LVM Stainless Steel Cardiovascular
Stents:An Investigation of Material Removal, Surface Roughness and
Corrosion Behavior, Treds Biomater. Artif. Organs, Vol. 23(3), page
115-121, 2010.
[Sure98] S. Suresh, Fatigue of Materials, 2nd ed, Cambridge University Press,
Cambridge, page 137–139, 1998.
[Tada86] T. Tadaki, Y. Nakata, K. Shimizu, K. Otsuka, Crystal structure,
composition and morphology of a precipitate in an aged Ti–51 at%Ni
shape memory alloy, Trans. Japan Inst. Metals, Vol. 27, page 731-
740, 1986.
[Tako04] S. Takemoto, T. Yamamoto, K. Tsuru, S. Hayakawa, A. Osaka, S.
Takashima, Platelet adhesion on titanium oxide gels: effect of surface
oxidation, Biomaterials, Vol. 25, page 3485, 2004.
[Thom91] P. Thomsen, L. E. Ericson, Inflammatory cell response to bone
implants surfaces, In: Davies JE (ed.) The bone biomaterial interface,
University of Toronto Press, Toronto, page 153-164, 1991.
[Thor77] J. A. Thornton, High rate thick film growth, Ann. Rev. Mater. Sci.,
Vol. 7, page 239–260, 1977.
[Thor86] J. A. Thornton, The microstructure of sputter-deposited coatings,
J.Vac.Sci.Technol. A, Vol. 4(6), page 3059-3065, 1986.
[Thou93] M. D. Thouless, J. Gupta, J. M. E. Harper, Stress development and
relaxation in copper films during thermal cycling, J. mater. res., Vol.
8(8), page 1845. 1993.
[Tirry06] W. Tirry, D. Schryvers, K. Jorissen, D. Lamoen, Quantitative
determination of the crystal structure of Ni4Ti3 precipitates, Materials

99
Science and Engineering A-Structural Materials Properties
Microstructure and Processing, Vol. 438, page 517-520, 2006.
[Tobu09] H. Tobushi, Y. Furuichi, T. Sakuragi, Y. Sugimoto, Bending fatigue
properties of a superelastic thin tube and a high-elastic thin wire of
TiNi alloy, Mater Trans., Vol. 50, page 2043-2049, 2009.
[Venk92] R. Venkartraman, J. C. Bravman, Separation of film thickness and
grain boundary strengthening effects in Al thin films on Si. J Matter
Res, Vol. 7(8), page 2040-2048, 1992.
[Vest03] M. J. Vestel, D. S. Grummon, R. Gronsky, A. P. Pisano, Effect of
temperature on the diversification kinetics on NiTi films, Acta
Materialia, Vol. 51(18), page 5309-5318, 2003.
[Wang07] D. Wang, Fatigue behaviour of thin Cu films: film thickness and
interfaces effects, PhD thesis, Forschungszentrum Kalsruhe, 2007.
[Wang09] M. F. X. Wagner, W. Windl, Elastic anisotropy of Ni4Ti3 from first
principles, Scripta Materialia, Vol. 60, page 207-210, 2009.
[Wech53] M. S. Wechsler, D. S. Lieberman, T. A. Read, On the theory of the
formation of martensite, AIME Transactions Journal of Metals, Vol.
197, pages 1503–1508, 1953.
[Wöhl67] A. Wöhler, Wöhler's Experiments on the strength of Metals,
Engineering, Vol 2, page 160, 1867.
[Woll79] P. Wollants, M. D. Bonte, J. R. Roos, A thermodynamic analysis of
the stress-induced martensitic transformation in a single crystal , Z.
Metallkd, Vol. 70(2), page 113-117, 1979.
[Wulp66] D. J. Wulpi, understanding how components fail, 2nd edition, ASM
International, 1966.
[Yjhe10] Y. J. He, Q. P. Sun, Rate-dependent domain spacing in a stretched
NiTi strip, International Journal of Solids and Structures, Vol. 47,
page 2775–2783, 2010.
[Ykim11] Y. Kim, J. Kwon, H. Lee, W. Jang, J. Choi, S. Kim, Effect of
Microstructure on Fatigue Crack Propagation and S-N Fatigue
Behaviors of TMCP Steels with Yield Strengths of Approximately
450 MPa, Metall Mater Trans A-Phys Metall Mater Sci., Vol 42,
page 986-999, 2011 .
[Yqfu03] Y. Q. Fu, H. J. Du, S. GAO, S. Yi, mechanical properties of sputtered
TiNicu shape memory alloys thin films, Mater. Sci., Vol. 437, page
37-40, 2003.
[Yu04] D. Y. W. Yu, F. Spaepen, The yield strength of thin copper films on
Kapton, J Appl Phys, Vol. 95(6), page 2991-2997, 2004.
[Zaho01] T. Zhao, R. Yang, C. Zhong, Y. Li, Y. Xiang, Effective inhibition of
nickel release by tantalum-implanted TiNi alloy and its cyto-
compatibility evaluation in vitro. Journal of Materials Science., Vol.
46, page 2529-2535, 2001.
[Zamp04] C. Zamponi, H. Rumpf, B. Wehner, J. Frenzel, and E. Quandt,
Superelasticity of free-standing niti films depending on the oxygen
impurity of the used targets, Materialwissenschaft und
Werkstofftechnik, Vol. 35, page 359–364, 2004.
[Zamp09] C. Zamponi, R. L. Miranda, M. Carey (ed.), Thin Film Shape

100
Memory Alloys, Chapter 15, Cambridge University Press, 2009.
[Zhan03] G. P. Zhang, R. Schwaiger, C. A. Volkert, and O. Kraft. Effect of
film thickness and grain size on fatigue induced dislocation structures
in Cu thin films. Phil Mag Lett, 83(8):477-483, 2003.
[Zhan06] G. P. Zhang, C. A. Volkert, R. Schwaiger, P. Wellner, E. Arzt, O.
Kraft, Length scale controlled fatigue mechanisms in thin copper
films, Acta Matr, Vol. 54(11), page 3127-3139, 2006.
[Zhang06] L. Zhang, C. Y. Xie, J. S. Wu, In situ X-ray diffraction analysis on
the crystallization of amorphous TiNi thin films, Scripta Materialia,
Vol. 55(7), page 609-612, 2006.
[Zhang07] L. Zhang, C. Xie, J. Wu, Effect of annealing temperature on surface
morphology and mechanical, properties of sputter-deposited Ti–Ni
thin films, Journal of Alloys and Compounds, Vol. 427,page 238–
243, 2007.
[Zhi07] Y. H. Zhi, X. M. Wang, M. Frotscher, G. Eggeler, Z.F. Yue, The
FEM simulation of mechanical properties characterization of the stent
under the quasi-static loading/unloading, Mat.-wiss. u. Werkstofftech,
Vol. 38, page 862-867, 2007.
[Zhou05] Y. Zhou, J. Zhang, G. Fan, X. Ding, J. Sun, X. Ren, K. Otsuka,
Origin of 2-stage R-phase transformation in low-temperature aged
Ni-rich Ti-Ni alloys, Acta Materialia, Vol. 53, page 5365-5377, 2005.
[Lin11] Z. Lin, K. Pike, A. Zipse, M. Schlun , Nitinol Fatigue Investigation
on Stent-Finish Specimens Using Tension-Tension Method. J Mater
Eng Perform., Vol. 20, page 591-596, 2011.
[Lin12] Z. Lin, K. Pike, M. Schlun , A. Zipse , J. Draper , Nitinol Fatigue Life
for Variable Strain Amplitude Fatigue. J Mater Eng Perform., Vol.
21, page 2628-2632, 2012.
[Li02] Z. Q. Li, Q. P. Sun, The initiation and growth of macroscopic
martensite band in nano-grained NiTi microtube under tension,
International Journal of Plasticity, Vol.18, page1481–1498, 2002.
[Xin10] Z. Xin, S. X. Hui, Z. D. Lin, HThickness dependence of grain size
and surface roughness for dc magnetron sputtered Au films,
Chin. Phys. B, Vol. 19(8), page 086802, 2010.

101
Chapter 7
Publications
A. Zayed, C. Bechtold, R. Lima de Miranda, B. Erkartal, L. Kienle, E. Quandt, High
cycle fatigue in freestanding-micropatterned NiTi films, Advanced Engineering
Materials, 2013 – to be submitted.
Poster
A. Zayed, R. Lima de Miranda, E. Quandt, investigating fatigue life for equiatomic TiNi
thin films, 21, A(160), 11th Junior Euromat, Lausanne, 2012.

102
Chapter 8
List of symbols
E Young's modulus MPa
∆K Crack threshold -
Af Austenite phase finish temperature ° C
AFM Atomic force microscopy -
As Austenite start temperature ° C
As Austenite phase start temperature ° C
b The fatigue strength coefficient. -
c The fatigue ductility coefficient -
Cp Heat capacity J/K
da/dN Crack growth rate -
DC Direct current sputtering V
DSC Differential Scanning Calorimetry -
EP Electropolishing -
GD Difference in the chemical free energy between parent and
martensite phase J
H Enthalpy of the transformation per unit volume J
Mf The martensite finish temperature °
Mf Martensite phase finish stress Mpa
Ms The martensite start temperature °
Ms Martensitic phase start stress Mpa
MT Martensitic phase transformations -
Nf Number of cycles to failure -
NiTi Nickel Titanium -
Nitinol Nickel Titanium Naval ordnance Laboratory -
PVD Physical vapour deposition -
R Gas constant -
R Resolution in lithography process -
RF Radio frequency sputtering -
S Entropy of transformation per unit volume J/K
S or σ Stress Mpa
SE Superelasticity -
SEM Scanning Electron Microscopy -
SIMT Stress induced martensite transformation -
SMA Shape Memory Alloy -
SME Shape Memory Effect -
Syield Sputtering yield mm3/C
SZM Structure zone model -
Te Equilibrium temperature in Gibbs energy diagram °
TIM Thermally induced martensite transformation -
Tp Peak temperature for crystallization °
Tw Working temperature °
Vs Poisson's ration of substrate -

103
XPS X-ray Photoelectron Spectroscopy -
XRD X-ray Diffraction -
Z Photoresist thickness µm
β Heating rate applied K/min
Δεel Elastic strain rage %
Δεpl Plastic strain rage %
Δεt Total strain range %
ε Transformation strain %
εm Mean strain
εmax Maximum strain %
θs Sputtering angle °
λ Wavelength of the exposing radiation Nm
σm Mean stress Mpa
σmax Maximum stress Mpa
σmin Minimum stress Mpa
σuniaxial Uniaxial stress Mpa
104
Acknowledgment In this chapter, I would like to convey my profound appreciation to many people who
helped me during the past three years to complete this work. First and foremost, I would
like to express my sincerest acknowledgment to Prof. Dr. Eckhard Quandt, for giving me
the opportunity to work in his group under great research conditions as well as for his
scientific supervision. Deep gratitude to Prof. Dr. Franz Faupel for his support though my
early scientific years in Germany and for the willingness to examine this work. I would
like to express my deepest gratitude to Prof. Dr. Mady Elbahri for providing me with
unconditional help, advice, and support. I would like to show appreciation to my
supervisor Dr. Rodrigo Lima de Miranda for his supervision, administration, and helpful
discussions through out my work. Our arguments, though constructive criticism, over the
last three years made this work successful and prepared me well for future challenges to
come. Thank you for all what you have taught me.
I would like to express my recognition to Dr. Christiane Zamponi for the EDX
measurement, FIB cut, and the helpful scientific discussions. Also, I would like to thank
Dr.-Ing. Christoph Bechtold for his supports though helpful scientific discussion. My
thanks to Prof. Dr. Lorenz Kienle, Dr. Ulrich Schürmann, Christian Szillus, and
M.Sc. Burak Erkartal for carrying on the TEM examinations. I would like to express my
appreciation to all the work shop employees in the technical faculty and specially Meister
Bernt Neumann for the great help and the fast response when ever I needed him.
Moreover, I would like to express thanks to Prof. Dr. Jeffrey McCord and Dr. Mikhail
Kustov for the polarization microscope investigations and the supportive discussions. I
would like to extend my sincere appreciation to the ''Research Group Paleooceanography
and climate'' represented by Dr. Dieter Garbe-Schönberg and Dipl.-Ing.Ulrike Western-
ströer for the Ni ion release measurements as well as the friendly working atmosphere.
This dissertation would never come to pass without the help of Dr. Kristina Schlüter. Her
enthusiasm, friendship, and encouragement helped me a lot. Also, I would like to thank
Dipl.-Ing. Andre Piorra for his support in my early XRD measurements. As well I would
like to thank Dipl.-Ing.Thomas Metzing for the technical support. Furthermore I would
like to illustrate a great gratitude to Prof. Dr. Christine Selhuber-Unkel, Dr. Saskia
Viebig, and M.Sc. Qian Li for the biocompatibility investigations and the helpful
discussions. Big thanks to all my Inorganic Functional Materials colleagues M.Sc. Erdem
Yarar, M.Sc. Ali Tavassolizadeh, Dipl.-Phys. Claas Thede, Dipl.-Ing. Enno Lage, Dipl.-
Phys. Klaas Loger, Dr. Antonio Malave, and all the group members. I thank you very
much for the friendship. Of course one can not forget Gislinde Schroeder and Ellen
Riemer for the help with the office bureaucracy. Last but not least, I would like to thank
M.sc Ramzy Abdelaziz for the SEM support and the great friendship.
Most important of all I would like to thank my beautiful wife for her support, patient,
and unconditional love. Although her grandfather passed away suddenly before my final
examination, she refused to leave me is such hard conditions. I found with her another
home in Germany since we got married in the middle of my doctor work. I would like
also to thank my family and specially my twin brother for being helpful for me
throughout all my student years. Specially my father who respected my decision of
leaving the family business and come across the world to start a new life here in
Germany. His love, engorgements, and of course financial support made this dream come
true.

105
This dissertation is dedicated to my previous supervisor Dr. Vladimir Zaporojtchenko,
a great man who left us lately last year. Hearty thanks to all what you have tough me
during the time I knew you as a master student.

106
Eidesstattliche Erklärung
Ich versichere an Eides Statt durch meine Unterschrift, dass die vorliegende Arbeit
nach Inhalt und Form meine eigene Arbeit ist. Diese Arbeit ist unter Einhaltung der
Regeln guter wissenschaftlicher Praxis der Deutschen Forschungsgemeinschaft
entstanden. Alle Textpassagen, die wörtlich oder dem Sinn nach auf Publikationen oder
Vorträgen anderer Autoren beruhen, ebenso Zeichnungen, Skizzen und andere bildliche
Darstellungen, die nicht von mir stammen, sind als solche kenntlich gemacht. Ich
versichere außerdem, dass ich keine andere Literatur, als die hier angegebene verwendet
habe. Diese Arbeit wurde bisher keiner anderen Prüfungsbehörde vorgelegt und auch als
ganzes noch nicht veröffentlicht. Auszüge dieser Arbeit sind in wissenschaftlichen
Zeitschriften erschienen, wie der Liste der eigenen Publikationen (Kapitel 7) entnommen
werden kann.
_________________ __________________
Kiel Ahmed Zayed

107
Appendix A. Labview program utilized in this work

108

109
B. NiTi films sputtered on a silicon wafer with at 100 nm surface roughness
SEM cross-section images of 50.3 at% Ni films annealed at 650 °C for 05 min and 450 °C for 10 min. The
films were sputtered on a silicon wafer with 100 nm surface roughness. The result shows the influence of
the substrate surface roughness on the film growth. The film had a surface roughness of 240 nm ±20nm.
Figures (c) and (d) shows the same film cycled for 500 cycles at 1.5 % mean strain, which result in the
decomposition of columnar structure from the main film body.

110
C. The fatigue setup used in this work
1. Piezo actuator
2. Micormeter table
3. Load cell in polymer housing
4. Acutator control unit and sensor
5. Load cell power supply
6. Heating unit
7. Heating unit power supply
8. Oscilloscope
9. Motorized fan
10.Motorized fan power supply
11.Load cell amplifier
12.Wooden supports
1
2
3
4
5
6
8
7
9
10
11
12
The fatigue test setup system developed in this work for the fatigue investigation of freestanding NiTi thin
films. The setup components are: 1. Piezo actuator, 2. Micormeter table, 3. Load cell in polymer housing,
4. Acutator control unit and sensor, 5. Load cell power supply, 6. Heating unit, 7. Heating unit power
supply, 8. Oscilloscope, 9. Motorized fan, 10. Motorized fan power supply, 11. Load cell amplifier, and 12.
DAQ card for signal processing.

111
d. TEM investigation
a)
b)
c)
16 n
m21 n
m28 n
m

112
e. film edges quality at different cycling test frequencies
10 μm
10 μm
2 μm
2 μm
40 μm 10 μm40 Hz
20 Hz
10 Hz
a)
b)
c)

113
f. SEM surface investigation after different finishing methods