investigation of drug polymer compatibility: formulation ... · investigation of drug polymer...
TRANSCRIPT

Article ID: WMC003253 ISSN 2046-1690
Investigation of Drug Polymer Compatibility:Formulation and Characterization of MetronidazoleMicrospheres for Colonic Delivery.Corresponding Author:Mr. Prasanta K Choudhury,Sr. Lecturer, Pharmaceutical Technology, Royal College of Pharmacy and Health Sciences, 760002 - India
Submitting Author:Mr. Prasanta K Choudhury,Sr. Lecturer, Pharmaceutical Technology, Royal College of Pharmacy and Health Sciences, 760002 - India
Previous Article Reference: http://www.webmedcentral.com/article_view/3128
Article ID: WMC003253
Article Type: Research articles
Submitted on:02-May-2012, 04:30:16 AM GMT Published on: 02-May-2012, 07:57:05 PM GMT
Article URL: http://www.webmedcentral.com/article_view/3253
Subject Categories:PHARMACEUTICAL SCIENCES
Keywords:Metronidazole, Compatibility, Polymers, UV Spectrophotometric methods, FTIR, Colonic drug delivery,Quasiemulsification Solvent-diffusion technique
How to cite the article:Choudhury PK, Murthy PN, Tripathy NK, Panigrahi R, Behera S. Investigation of DrugPolymer Compatibility: Formulation and Characterization of Metronidazole Microspheres for Colonic Delivery. .WebmedCentral PHARMACEUTICAL SCIENCES 2012;3(5):WMC003253
Copyright: This is an open-access article distributed under the terms of the Creative Commons AttributionLicense, which permits unrestricted use, distribution, and reproduction in any medium, provided the originalauthor and source are credited.
WebmedCentral > Research articles Page 1 of 20

WMC003253 Downloaded from http://www.webmedcentral.com on 02-May-2012, 07:57:06 PM
Investigation of Drug Polymer Compatibility:Formulation and Characterization of MetronidazoleMicrospheres for Colonic Delivery.Author(s): Choudhury PK, Murthy PN, Tripathy NK, Panigrahi R, Behera S
Abstract
For the design and development of any novelformulation, assessment of compatibility of drug withexcipients by different techniques such as thermal andisothermal stress testing are recommended. Duringpre-formulation studies common methods likeUV-Spectrophotometric methods, FTIR are used forthe study of compatibility. In the present investigationdrug-excepient compatibility study of was conductedfor metronidazole with ethyl cellulose to formulatemicrospheres by using different ratio of drug: polymerfor colonic delivery. The drug and polymer mixtureswere stored at 50 °C for 2 weeks. The samples werethen characterized using UV Spectrophotometricmethod, FTIR. The results show that metronidazolewas compatible with ethyl cellulose; hence ethylcellulose can be used for formulation of metronidazolemicrospheres. Microspheres were prepared bymodified Novel Quasiemulsification solvent-diffusionmethod to study the effect of ethyl cellulose on drugrelease with different proportions of metronidazole andethyl cellulose. Prepared microspheres of ethylcellulose were evaluated for size, morphology,sphericity study, percentage yield, loose surfacecrystal study, drug content and entrapment efficiency.In vitro drug release study was conducted by bufferchange method to mimic Gastro Intestinal environment.The investigations revealed that microspheresprepared with metronidazole: ethyl cellulose ratio (1:2)show only 19.394 ±0.67% drug release in first 5 hoursand 46.72 ±0.69% in 12 hours, which prove thepotentiality of ethyl cellulose for colonic delivery ofdrugs.
Keywords: Metronidazole, Compatibility, Polymers,UV Spectrophotometric methods, FTIR, Colonic drugdelivery, Quasiemulsification Solvent-diffusiontechnique
Introduction
Drug excepient compatibility is one of the importantparameter to be considered during preformulation
studies, which can alter the physicochemicalproperties and bioavailability of the drugs. To developeffective, safe and stable formulation drug excepientcompatibility is an important process and it helps in theselection of right excepient. Despite of the importanceof the drug excepient compatibility tests, there is nouniversally accepted protocol for this purpose. Infraredspectroscopy is a technique based on the vibrations ofthe atoms of a molecule. An infrared spectrum iscommonly obtained by passing infrared radiationthrough a sample and determining what fraction of theincident radiation is absorbed at a particular energy.The energy at which any peak in an absorptionspectrum appears corresponds to the frequency of avibration of a part of a sample molecule [1]. UVSpectrophotometric method is common analyticaltechniques used to determine the drug content of mostof the drugs.
In the present study, the drug excepient compatibilityof the metronidazole with various ethyl cellulose wasdetermined by as a part of an ongoing project on thedevelopment of metronidazole microspheres. FTIRand UV Spectrophotometric methods were used forthe characterization study. Colonic diseases areimportant causes of death by protozoal infections inthe developing world and even in advanced countries.Hence, in the present study metronidazole (MNZ) wasselected as a model drug which has extremely broadspectrum of protozoal and antimicrobial activity. It isclinically effective in colonic diseases, both locally andsystemically[2]. Based on the observations, an attempthas been made to develop ethyl cel lulosemicrospheres for metronidazole by modified NovelQuasiemulsification solvent-diffusion method to deliveractive molecule to the colonic region, which combinespH-dependent and controlled drug release properties.
Experimental
MATERIALS AND METHODS
M/s Diamond Drugs Pvt Ltd, Howrah, WB, India,generously supplied metronidazole as a gift sample.Ethyl cellulose-LR (EC-LR), Span 80 and Tween 80were procured from S.D. fine-chem. Ltd., Mumbai,India. Light liquid paraffin was obtained from Loba
WebmedCentral > Research articles Page 2 of 20

WMC003253 Downloaded from http://www.webmedcentral.com on 02-May-2012, 07:57:06 PM
Chemie Ltd, Mumbai. All other solvents and reagentswere of analytical grade procured from local suppliers.
COMPATIBILITY STUDY
The drug and polymer mixtures of metronidazole withvarious polymers prepared at different ratio. The drugand ethyl cellulose were individually weighed in a 10ml glass vial and mixed on a vortex mixer for 2 min. Ineach of the vials, 10% of the ethanol-water was addedand the drug-excepient blend was further mixed. Eachvial was sealed Teflon-lined screw cap and stored at50°C for 2 weeks. These samples were periodicallyexamined for any change of unusual color change.
Characterization by UV spectrophotometer
The samples on the first day, after 1 week and 2weeks were withdrawn from storage and analyzed byUV spectrophotomer. The drug content wasdetermined at initial and stored samples in triplicate.An accurately weighed amount of the drug-polymermixture was taken and suitably dissolved in ethanol.The sample was analyzed after making appropriatedilutions using UV spectrophotometer at 311 nmagainst blank
Fourier transforms infrared radiation measurement(FT-IR)
The FT-IR spectra acquired were taken from driedsamples. A FT-IR (Shimdzu-840-os, Japan) was usedfor the analysis in the frequency range between 4000and 400 cm-1, with 4cm-1 resolution.
PREPARATION OF ETHYL CELLULOSEMICROSPHERES
Metronidazole loaded ethyl cel lulose (EC)mic rospheres were p repared by Nove lQuasiemulsification solvent-diffusion method[3]. Asolution of EC in acetone (2%, 4% and 8%) containingdrug (1g) was added to liquid paraffin containingemulgent (Span 80), while stirring, at a speed of 1500rpm. The emulsion was stirred for 5 to 6 hours at 25°Cto 30°C. Subsequently, a suitable amount of petroleumether was added to the dispersion. The microspheressuspended in liquid paraffin were filtered and collected.The resultant microspheres were washed with waterfollowed by petroleum ether to remove traces of liquidparaffin. The microspheres were dried at ambienttemperature and desiccated under vacuum. The batchwas coded as ECQ.
Characterization ofMicrospheres
The prepared microspheres were characterized by
evaluating following parameters like % yield, particlesize analysis, Determination of Shape and Sphericity,drug content, Drug Entrapment efficiency (DEE %),Loose surface crystal study and In Vitro Drug Releasefrom Microspheres (data disclosed in table 4 ).
Determination of the Yield of the Microspheres
The yield was calculated using the equation:
Yield of microspheres (%)
= Weight of the microspheres (mg) X 100
[Drug (mg) + Polymer (mg)]
Particle Size Analysis
Particle size distribution of the microspheres wasdetermined by optical microscopy using calibratedocular eyepiece[11]. Fifty microspheres were observedand the geometric mean diameter was calculatedusing the equation:
Xg = 10 X [(ni X log Xi) / N]
Where Xgis geometric mean diameter, ni is no ofparticles in the range, Xi is the mid point of range, andN is total no of particles analyzed.
Determination of Shape and Sphericity
Morphological appearance and surface characteristicsof the microspheres were studied by dispersing themicrospheres in liquid paraffin and observing under250X magnification in an optical microscope[11].
The particle shape was measured by computingcircularity factor (S). The tracings obtained from opticalmicroscopy were used to calculate area (A) andperimeter (P), which are used to calculate thecircularity factor (S) by using the equation[12]:
S = P2 / (12.56 X A)
Determination of drug content [13]
The amount of drug present in the Ethyl cellulosemicrospheres prepared by quasiemulsion method wasdetermined by a method reported by Thanoo et al(1992). A weighed quantity of the microspheres wasextracted with methanol for 24 hr, and drugconcentration in supernatant was determinedspectrophotometr ica l ly at 313.5 nm (UV1700Shimadzu,Japan).
Drug Entrapment efficiency (DEE %)
Entrapment efficiency of the microspheres wascalculated using the formula
DEE% = Practical Drug Loading X 100
Theoretical Drug Loading
Loose surface crystal study[14]
Loose surface crystal study was performed to observe
WebmedCentral > Research articles Page 3 of 20
WMC003253 Downloaded from http://www.webmedcentral.com on 02-May-2012, 07:57:06 PM
the excess drug present on the surface ofmicrospheres. From each batch 11mg of microsphereswere shaken in 100 ml of phosphate buffer, pH 7.4 for5 minutes and then filtered through Whattman filterpaper 41. The amount of drug in the filtrate wasdetermined spectrophotometrically at 319 nm andcalculated as percent of total drug content. Thisestimates the surface entrapment of the drug by themicrospheres.
In Vitro Drug Release from Microspheres
In vitro drug release studies were carried out usingUSP dissolution rate test apparatus (basket apparatus,100 rpm, 37 ± 0.1°C) by buffer change technique[15].Microspheres bearing MNZ were suspended insimulated gastric fluid (SGF), pH 1.2 (500 ml), for 1 hr.The dissolution media was then replaced with mixtureof simulated gastric fluid and simulated intestinal fluid(SIF), pH 4.5 (500 ml) for next two hours, then for nexttwo hours simulated intestinal fluid (SIF), pH 6.8 (500ml) and the release study was continued further insimulated intestinal fluid (500 ml) pH 7.4.
Samples were withdrawn periodical ly andcompensated with an equal amount of freshdissolution media. The samples were analyzed fordrug content by measuring absorbance at 319.5 nmusing UV spectrophotometer (UV 1700, Shimadzu,Japan).
Drug Release data model fitting
The suitability of several equations that are reported inthe literature to identify the mechanisms for therelease of drug was tested with respect to the releasedata up to the first 50% drug release. The data wereevaluated according to the following equations:
Zero order model [16]
Mt = M0+ K0t
Higuchi model [17]
Mt = M0 +KH t 0.5
Korsmeyer-Peppas model [18]
Mt = M0 + KKtn
Where Mt is the amount of drug dissolved in time t. M0
is the initial amount of the drug. K0 is the Zero orderrelease constant, KH is the Higuchi rate constant, KK isa release constant and n is the release exponent thatcharacterizes the mechanism of drug release.
Results and discussion
Drug content estimation
The drug and polymer mixture was physically
observed at different intervals. No characteristic colorchange was observed. The assay of the drug polymermixtures were found good. Assay value of 99.12 to100.1 was observed at initial. Good correlation wasobserved with the samples of drug polymer mixturesstored at 50 °C for 2 weeks. This clearly indicates thestable nature of the metronidazole with cellulosepolymers (Table 1).
Fourier transforms infrared radiation measurement(FT-IR)
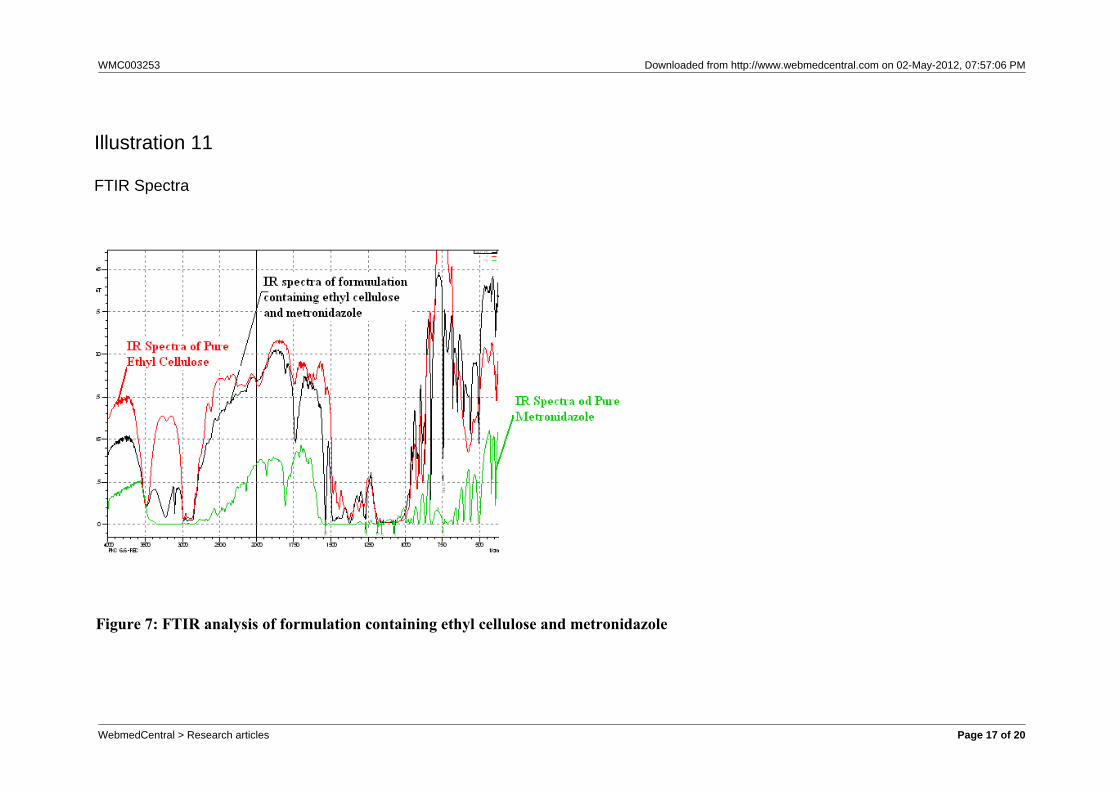
The characteristic band peaks acquired were takenfrom the prepared drug-polymer mixtures. Theinteraction study between drug and polymer wasevaluated. The characteristics peak of the drug wasfound at wave numbers 743.58 cm-1, 1070.53 cm-1,1160.22 cm-1, 1187.23 cm-1, 1264.38 cm-1 and 1536.35cm-1, these are almost same as reported in themonograph for metronidzole.
Formulation and characterization of Microspheres
Metronidazole (MNZ) loaded ethyl cellulosemicrospheres were successfully prepared by the NovelQuasiemulsification solvent-diffusion method usinglight liquid paraffin in the external phase. The effect ofdrug polymer ratios was analyzed in order to optimizethe formulation. It was observed that by changing drug:polymer ratio the shape, size as well as theentrapment efficiency of formulations considerablyinfluenced. The yield of microencapsulation processwas increased with increase in ethyl celluloseconcentration in the formulations. The microsphereswere discrete and fairly spherical in shape while thesurface roughness was slightly increased with theincorporation of the drug. Excellent microspheres wereproduced when the process was carried out with drug:ethyl cellulose ratio 1:2 while the shape of themicrospheres was distorted and some of them fusedwith each other when ethyl cellulose ratio wasdecreased. The drug particles appeared on thesurface of the microspheres when they were preparedwith drug: polymer ratio 2:1.
Particle size of the microspheres was determinedusing optical microscopic method. Mean particle sizewas found to be 21.76 ± 3.33µm in case ofmicrospheres having drug: ethyl cellulose ratio 2:1while it was significantly increased to 34.8±2.45µmwith drug: ethyl cellulose ratio (1:5) (Table 4). The sizeof the microspheres is controlled by the size of thedispersed droplets of Ethyl cellulose in liquid paraffin.When the concentration of the ethyl cellulose in theformulation was increased, there was increment in thesize of dispersed droplets that resulted in theformation of microspheres having bigger particle size.
WebmedCentral > Research articles Page 4 of 20
WMC003253 Downloaded from http://www.webmedcentral.com on 02-May-2012, 07:57:06 PM
With increase in the polymer ratio in the formulationsthe mean particle size of all the formulations increased(Table 4). All the microsphere formulations have thecircularity factor nearest to “1” which proves that theyare almost spherical in shape (Table 4). Themicrospheres showed better entrapment efficiencywith increase in polymer ratio. Highest entrapmentefficiency was observed for the formulation ECQ399.29±4.71 (Table 4). As the drug: polymer ratio wasincreased from 2:1 to 1:2 the surface entrapment ofthe drug on the microsphere surfaces was decreasedwhich is suitable for the colonic delivery of the drugsand the surface entrapment of drug shows a lessamount of drug lose due to the process variables butwith further increase in polymer ratio the surfaceentrapment was increased. It may be due to thedispersion of the drug in polymer layer more evenlyrather than entrapped into to the polymer layer.
The microspheres were subjected to in-vitro drugrelease rate studies in SGF (pH 1.2) for 1 hour and inmixture of SGF and SIF (pH 4.5) for the next 2 hoursin order to investigate the capability of the formulationto withstand the physiological environment of thestomach and small intestine. The MNZ percentreleased from the microspheres of drug: ethylcellulose ratio 1:2 after 12 h studies is 46.72 %. Theamount of MNZ released during first 5 h studies wasfound to be 29.993 ± 1.22 %, 16.342 ± 1.13 %, 19.790± 0.48 %, 14.495 ± 0.77 %, 19.394 ± 0.67 % and10.003 ± 0.88 % for ECQ1, ECQ2, ECQ3, ECQ4,ECQ5, and ECQ6 respectively (Figure. 6) whichattests the ability of ethyl cellulose to remain intact inthe physiological environment of stomach and smallintestine. The little amount of the drug, which isreleased during 5 h release rate studies, is due to thepresence of un-entrapped drug on the surface of themicrospheres. The release of the drug was muchfaster during the 6-12 hour study period. It is due tothe fact that during the initial period (0-5 h) thestrength of the barrier was too high to be broken andduring 6-12 hour period the network was somewhatloosened which facilitated the release of drug (Figure9.). Basing on all the evaluation parameters studied,like %yield, particle size, sphericity, surfaceentrapment, entrapment efficiency and in vitro drugrelease the formulation ECQ3 was found to be theideal formulation.
Summary and Conclusion
While carrying out drug polymer compatibility study, nocharacteristic color change was observed during thestorage at 50 °C for 2 weeks. Good correlation was
observed at initial and after 2 weeks of Isothermalstress testing (IST). This clearly indicates the stablenature of metronidazole with the cellulose polymersused in the preset study. FTIR study of the initial andIST clearly indicates the stable nature of themetronidazole. This study is definitely useful for thepreparation of metronidazole microsphere formulations.
The efficacy of the ethyl cellulose was evaluated forcolon targeted drug delivery by fabricating it intomicrospheres. The microspheres of ethyl celluloseprepared by modified quasiemulsion method werecapable of providing protection to the drug in thehostile environment of upper gastrointestinal tract andreleased the drug at the target site. The in vitro drugrelease studies of ethyl cellulose microspheresrevealed that very less amount of the drug wasreleased in the physiological environment of stomachand small intestine. Hence these data attests thepotentiality of ethyl cellulose for colon-specific deliveryof the drugs.
Acknowledgement(s)
We express our sincere thanks to Royal College ofPharmacy and Health Sciences, Berhampur, Orissafor their support in providing the facilities to completethe work. We also extend our thanks to M/s Diamonddrugs Pvt Ltd, Howrah, W.B. for providing us giftsamples of metronidazole.
References
1. Rubinstein A, Approaches and opportunities incolon-specific drug delivery. Crit Rev Ther DrugCarrier Syst. 1995; 12(2-3): 101-49.2. Chourasia MK and. Jain SK. Design andDevelopment of Multiparticulate System for TargetedDrug Delivery to Colon, Drug Delivery. 2004;(11):201–73. Ranga Rao KV, Devi KP. Swelling controlledrelease systems: recent developments and application.Int J Pharm. 1988; 48:1-16.4. Chourasia MK, Jain SK. Pharmaceuticalappraoaches to colon targeted drug delivery systems.J Pharm Pharmaceut Sci (www.ualberta.ca/~csps)2003; 6(1): 33-665. Ashford M, Fell JT, Attwood D, Sharma H andWoodhead P.J. An in vivo investigation into thesuitability of pH-dependent polymers for colonictargeting. Int J Pharm, 1993; 95: 193-96. Mishra B, et al. Development of chitosan-alginatemicrocapsules for colon specific delivery of
WebmedCentral > Research articles Page 5 of 20

WMC003253 Downloaded from http://www.webmedcentral.com on 02-May-2012, 07:57:06 PM
metronidazole. Indian Drugs, 2003; 40 (12): 695-700.7. Chourasia MK and Jain SK. Potential of Guar GumMicrospheres for Target Specific Drug Release toColon. Journal of Drug Targeting. August 2004; 12 (7):435–4428. Gohel MC, Parikh RK, Amin AF, Surati AK.Preparation and Formulation Optimization of SugarCross linked gelatin Microspheres of DiclofenacSodium. Indian J. Pharm Sci., 2005; 67(5): 575-819. Chowdary KPR, Rao YS. Preparation andevaluation of mucoadhesive microspheres ofIndomethacin. Indian J. Pharm Sci. 2003; 65(1): 49-5210. Kawashima et al. Preparation and in vitrocharacterization of Eudragit RL100 microspherecontaining 5 –fluorouracil. Indian J. Pharm Sci. 2003;60(2): 107-911. Chourasia MK, Jain SK. Design and Developmentof Multiparticulate System for Targeted Drug Deliveryto Colon. Drug Delivery. 2004; 11: 201–712. Shabaraya AR, Narayanacharyulu R. Design andevaluation of chitosan microspheres of metoprololtartarate for sustained release. Indian J. Pharm Sci.2003; 65(3): 250-213. Bhumkar DR, Maheswari M, Patil VB andPokharkar VB. Studies on effect of variabilities byresponse surface methodology for Naproxenmicrospheres. Indian drugs. 2003; 40 (8): 455-46114. Mishra B, Jayanta B, Sankar C. Development ofchitosan-alginate microcapsules for colon specificdelivery of Metronidazole. Indian drugs. 2003; 40(12):695-70015. Abu-Izza K, Garcia LC and Robert D. Preparationand evaluation of zidovudine loaded sustained releasemicrospheres: optimization of multiple responsevariables. J Pharm. Science. 1996; 85(6): 572-416. Danbrow M, Samuelov Y, Zero order drug deliveryfrom double –layered porous films: release rateprofiles from ethyl cellulose, hydroxypropyl celluloseand polyethylene glycol mixtures, Journal of Pharmacyand pharmacology. 1980; 32: 463-470.17. Higuchi T, Mechanism of sustained-actionmedication: theoretical analysis of rate of release ofsolid drugs dispersed in solid matrices. Journal ofpharmaceutical sciences. 1963; 52:1145-114918. Korsmeyer RW, Gurny R, Doelker EM, Buri P,Peppas NA. Mechanism of solute release from poroushydrophilic polymers. International Journal ofPharmacy. 1983; 15: 25-35.
WebmedCentral > Research articles Page 6 of 20

WMC003253 Downloaded from http://www.webmedcentral.com on 02-May-2012, 07:57:06 PM
Table 1 formulation composition of ethyl cellulose microspheresB a t c hcode.
Amountof drug(mg)
Amount ofpolymer(mg)
D r u g :p o l y m e rratio
Quantity ofethanol(ml)
Quantity ofl i q u i dparaffin (ml)
ECQ1 1000 500 2:1 25 50ECQ2 1000 1000 1:1 25 50ECQ3 1000 2000 1:2 25 50ECQ 4 1000 3000 1:3 25 50ECQ 5 1000 4000 1:4 25 50ECQ 6 1000 5000 1:5 25 50
Illustrations
Illustration 1
Formulation composition table
WebmedCentral > Research articles Page 7 of 20

WMC003253 Downloaded from http://www.webmedcentral.com on 02-May-2012, 07:57:06 PM
Table 2. Drug content of metronidazole at initial and storage at 50 °C for 2 weeks
Time intervals Drug-EC mixturesInitial 99.2750 °C for 1 week 99.3150 °C for 2 weeks 99.43
Illustration 2
Drug Content estimation
WebmedCentral > Research articles Page 8 of 20
WMC003253 Downloaded from http://www.webmedcentral.com on 02-May-2012, 07:57:06 PM
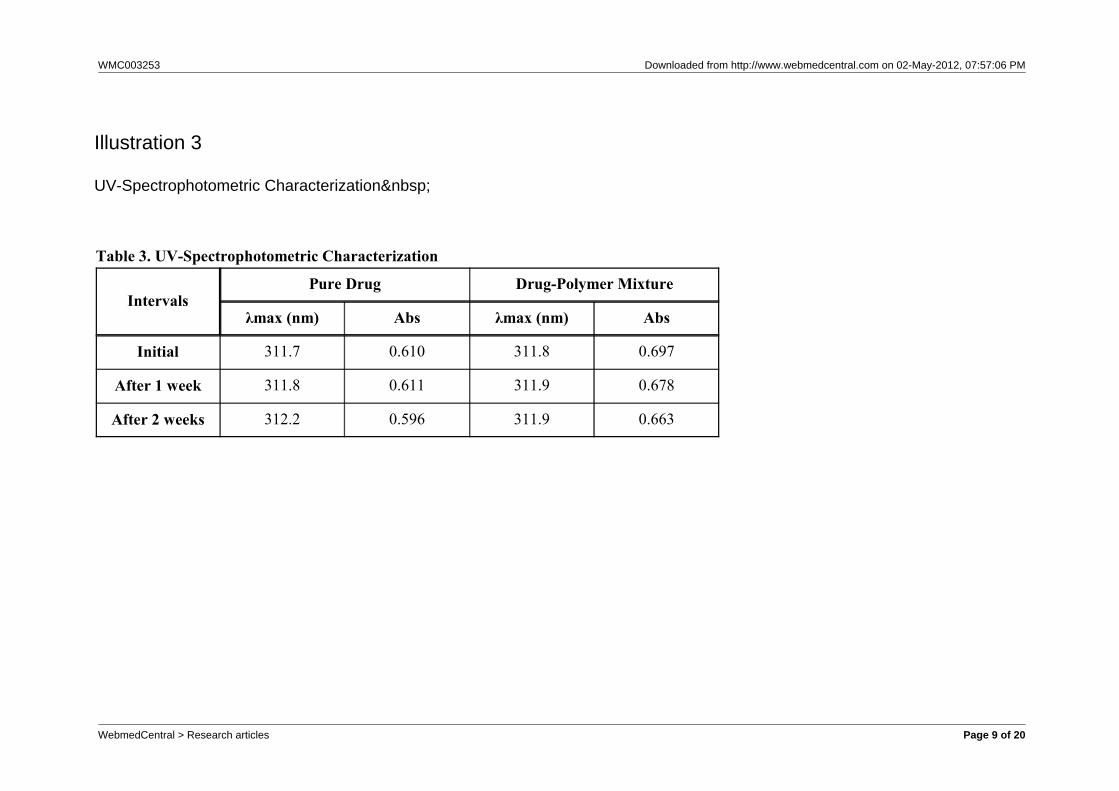
Table 3. UV-Spectrophotometric Characterization
IntervalsPure Drug Drug-Polymer Mixture
λmax (nm) Abs λmax (nm) Abs
Initial 311.7 0.610 311.8 0.697
After 1 week 311.8 0.611 311.9 0.678
After 2 weeks 312.2 0.596 311.9 0.663
Illustration 3
UV-Spectrophotometric Characterization
WebmedCentral > Research articles Page 9 of 20

WMC003253 Downloaded from http://www.webmedcentral.com on 02-May-2012, 07:57:06 PM
Table 4. Evaluation parameters of ethyl cellulose microspheresBatch code Drug :
polymerratio
Yield (%) Particle size(µm)
Circularityfactor (S)
Loose surfacecrystal study( s u r f a c eentrapment)
Entrapmentefficiency(%)
ECQ1 2:1 72.33 ± 3.74 21.76 ± 3.33 1.06 ± 0.030 23.044 ± 3.19 79.02±4.88ECQ2 1:1 95.11± 2.48 25.84 ± 1.43 1.05 ± 0.005 19.118 ± 3.78 86.96±2.49
ECQ 3 1:2 99.29 ± 4.71 28.36 ± 2.00 1.06 ±0.025 16.714 ± 4.22 98.796±4.68
ECQ 4 1:3 97.00 ± 3.27 30.2 ± 2.30 1.13 ± 0.018 32.347 ± 4.10 79.02±6.05
ECQ 5 1:4 81.00 ± 2.41 32.3 ± 2.43 1.10 ± 0.011 24.236 ± 4.08 73.35±5.34
ECQ 6 1:5 78.08 ± 3.24 34.8 ± 2.45 1.08 ± 0.026 29.442 ± 4.01 98.47±4.89
Values are expressed as Mean average ± SD (n=3)
Illustration 4
Evaluation parameters of ethyl cellulose microspheres
WebmedCentral > Research articles Page 10 of 20

WMC003253 Downloaded from http://www.webmedcentral.com on 02-May-2012, 07:57:06 PM
Figure 1: Overlay spectra of Metronidazole in ethanol
Illustration 5
Overlay spectra
WebmedCentral > Research articles Page 11 of 20

WMC003253 Downloaded from http://www.webmedcentral.com on 02-May-2012, 07:57:06 PM
Figure 4: Overlay spectra at 1st day
Illustration 6
Overlay spectra
WebmedCentral > Research articles Page 12 of 20

WMC003253 Downloaded from http://www.webmedcentral.com on 02-May-2012, 07:57:06 PM
Figure 2: Overlay spectra of ethyl cellulose in ethanol
Illustration 7
Overlay spectra
WebmedCentral > Research articles Page 13 of 20
WMC003253 Downloaded from http://www.webmedcentral.com on 02-May-2012, 07:57:06 PM
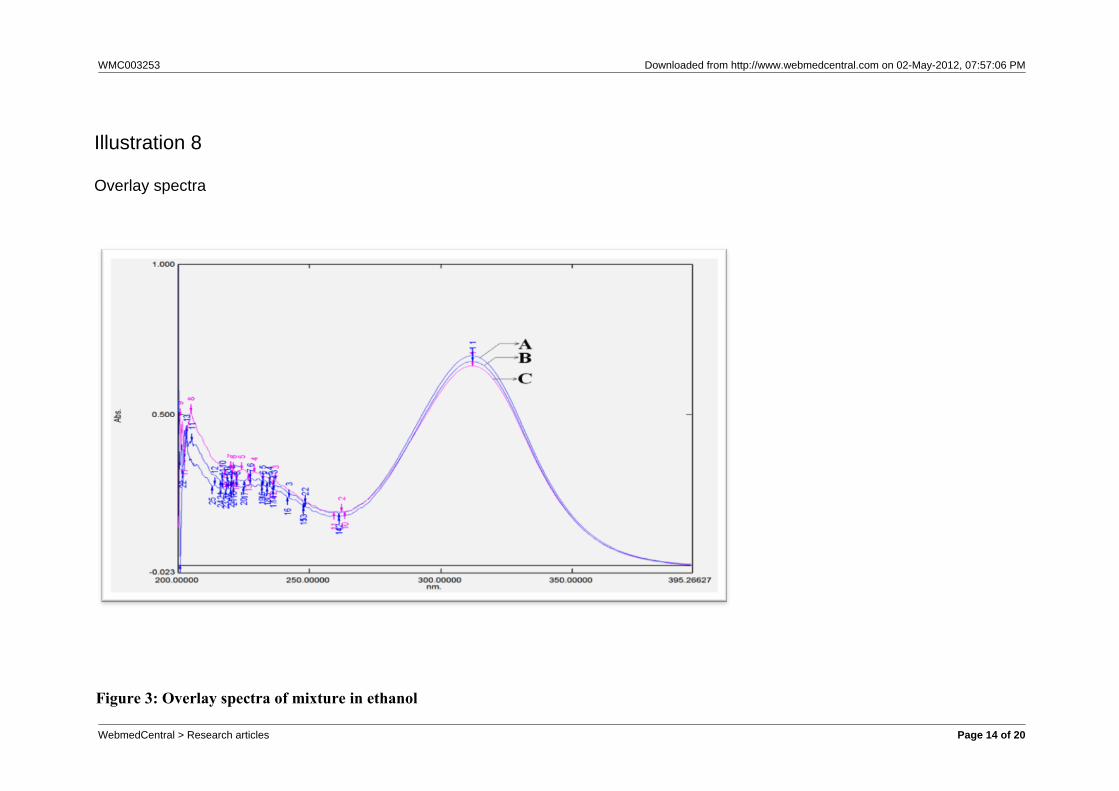
Figure 3: Overlay spectra of mixture in ethanol
Illustration 8
Overlay spectra
WebmedCentral > Research articles Page 14 of 20

WMC003253 Downloaded from http://www.webmedcentral.com on 02-May-2012, 07:57:06 PM
Figure 5: Overlay spectra after 1 week
Illustration 9
Overlay spectra
WebmedCentral > Research articles Page 15 of 20
WMC003253 Downloaded from http://www.webmedcentral.com on 02-May-2012, 07:57:06 PM
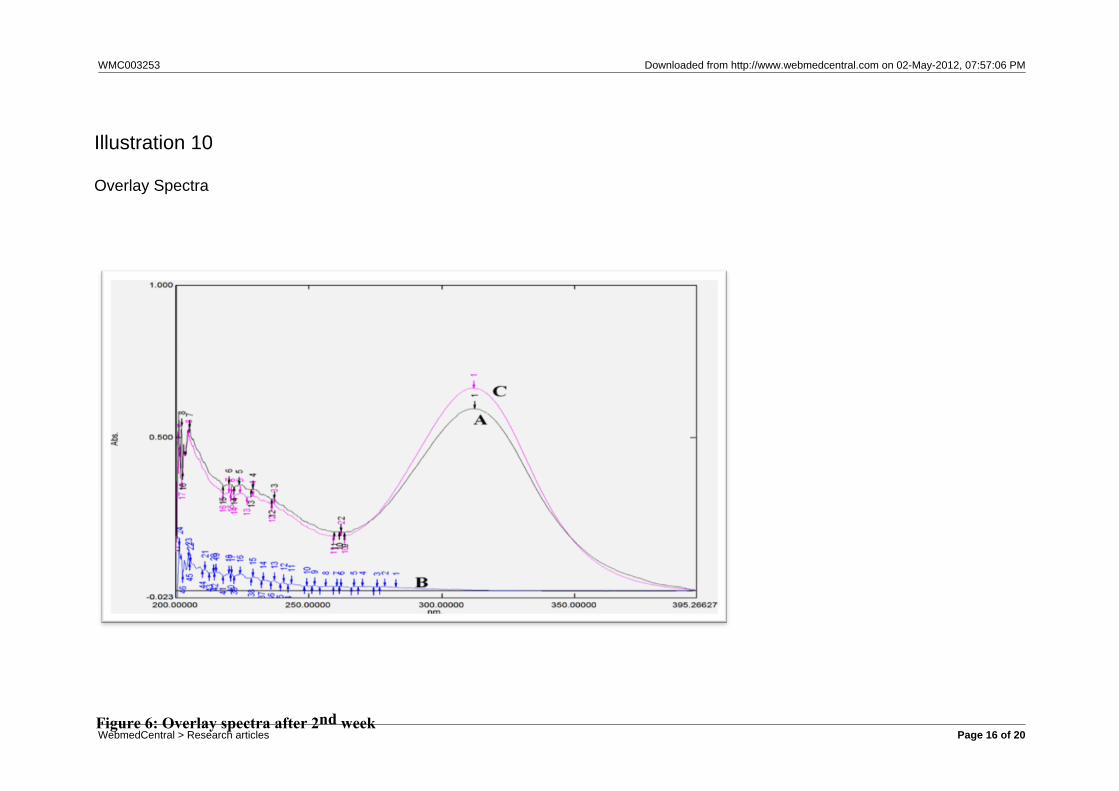
Figure 6: Overlay spectra after 2nd week
Illustration 10
Overlay Spectra
WebmedCentral > Research articles Page 16 of 20
WMC003253 Downloaded from http://www.webmedcentral.com on 02-May-2012, 07:57:06 PM
Figure 7: FTIR analysis of formulation containing ethyl cellulose and metronidazole
Illustration 11
FTIR Spectra
WebmedCentral > Research articles Page 17 of 20

WMC003253 Downloaded from http://www.webmedcentral.com on 02-May-2012, 07:57:06 PM
Figure 8: Photomicrograph of ethyl cellulose microspheres
Illustration 12
Photomicrographic studies
WebmedCentral > Research articles Page 18 of 20

WMC003253 Downloaded from http://www.webmedcentral.com on 02-May-2012, 07:57:06 PM
Figure 9: In vitro drug release profiles of all ethyl cellulose microsphere formulations
Illustration 13
In vitro dug release
WebmedCentral > Research articles Page 19 of 20

WMC003253 Downloaded from http://www.webmedcentral.com on 02-May-2012, 07:57:06 PM
DisclaimerThis article has been downloaded from WebmedCentral. With our unique author driven post publication peerreview, contents posted on this web portal do not undergo any prepublication peer or editorial review. It iscompletely the responsibility of the authors to ensure not only scientific and ethical standards of the manuscriptbut also its grammatical accuracy. Authors must ensure that they obtain all the necessary permissions beforesubmitting any information that requires obtaining a consent or approval from a third party. Authors should alsoensure not to submit any information which they do not have the copyright of or of which they have transferredthe copyrights to a third party.
Contents on WebmedCentral are purely for biomedical researchers and scientists. They are not meant to cater tothe needs of an individual patient. The web portal or any content(s) therein is neither designed to support, norreplace, the relationship that exists between a patient/site visitor and his/her physician. Your use of theWebmedCentral site and its contents is entirely at your own risk. We do not take any responsibility for any harmthat you may suffer or inflict on a third person by following the contents of this website.
WebmedCentral > Research articles Page 20 of 20