investigation of concentration and distribution of
TRANSCRIPT
International Journal of
Environmental Research
and Public Health
Article
Investigation of Concentration and Distribution of Elements inThree Environmental Compartments in the Region of Mitrovica,Kosovo: Soil, Honey and Bee Pollen
Granit Kastrati 1 , Musaj Paçarizi 2,* , Flamur Sopaj 2, Krste Tašev 3, Trajce Stafilov 4 and Mihone Kerolli Mustafa 5
�����������������
Citation: Kastrati, G.; Paçarizi, M.;
Sopaj, F.; Tašev, K.; Stafilov, T.;
Mustafa, M.K. Investigation of
Concentration and Distribution of
Elements in Three Environmental
Compartments in the Region of
Mitrovica, Kosovo: Soil, Honey and
Bee Pollen. Int. J. Environ. Res. Public
Health 2021, 18, 2269. https://
doi.org/10.3390/ijerph18052269
Academic Editor: Paul B. Tchounwou
Received: 1 February 2021
Accepted: 21 February 2021
Published: 25 February 2021
Publisher’s Note: MDPI stays neutral
with regard to jurisdictional claims in
published maps and institutional affil-
iations.
Copyright: © 2021 by the authors.
Licensee MDPI, Basel, Switzerland.
This article is an open access article
distributed under the terms and
conditions of the Creative Commons
Attribution (CC BY) license (https://
creativecommons.org/licenses/by/
4.0/).
1 Faculty of Agribusiness, University of Peja “Haxhi Zeka”, Street, UҪK, 30000 Pejë, Kosovo;[email protected]
2 Department of Chemistry, Faculty of Mathematics and Natural Sciences, University of Prishtina,Mother Teresa 5, 10000 Prishtina, Kosovo; [email protected]
3 State Phytosanitary Laboratory, Bul. Aleksandar Makedonski bb, 1000 Skopje, North Macedonia;[email protected]
4 Institute of Chemistry, Faculty of Natural Sciences and Mathematics, Ss Cyril and Methodius University,Arhimedova 5, 1000 Skopje, North Macedonia; [email protected]
5 Department of Environmental Management, International Business College Mitrovica, Bislim Bajgora nn,40000 Mitrovica, Kosovo; [email protected]
* Correspondence: [email protected]
Abstract: The abundances of selected elements in different environmental compartments, namelysoil, honey, and bee pollen, was determined in this study. For that purpose, sixteen soil and honeysamples, and nine pollen samples were taken in the region of Mitrovica, Kosovo. The concentration ofelements was measured by ICP-AES and ICP-MS. Pollution level concentrations of Pb, Zn, As, and Cdwere observed in soil. The level of soil pollution was estimated by calculating pollution indices. Pbwas also observed at high concentrations in honey, as was Cd and Pb in pollen. Pearson’s correlationcoefficients revealed mostly weak and moderate correlations of the concentrations of the eight selectedelements among the soil, honey, and pollen samples. Several groups of elements with geogenic andanthropogenic origin were identified by hierarchical cluster analysis. The concentrations of selectedheavy metals for soil and honey were compared to those in neighboring countries, and those forpollen with samples from Turkey, Serbia, and Jordan.
Keywords: Mitrovica; honey; pollen; soil; multivariate analysis; pollution; elements
1. Introduction
It is common knowledge that chemical elements are found everywhere in nature, andthat they are the building blocks of everything. Every chemical element has an irreplaceablerole in nature and the function of its entities. However, under the influence of naturalprocesses or human-driven ones, frequently, certain elements reach sites and concentrationswhereby they can have adverse effects on living organisms. It has been shown that metalscan induce toxic effects on microorganisms [1–3]. Some metals are essential to plants,playing a vital role in their development. However, the toxicity of certain elements, andeven that of fundamental nutrients when they surpass certain concentrations, has beenobserved in various wild and agricultural plants [4–8].
Humans are also intensely exposed to potentially toxic elements because of industrialdevelopment. Several researchers have shown various disturbing effects of these elementson human health [9–12]. They are ingested with food and contaminated water. They canalso be inhaled as dust and fine airborne particulate matter, as may be deduced fromnumerous reports on soil [13–17], water [17–19], food [20–22], and air pollution [23–25].
The subject of this investigation is the concentration of certain elements in soil, honey,and honey bee pollen, with a focus on selected, potentially toxic elements, in the Mitro-vica region of Kosovo. The contamination of soils has been reported in many research
Int. J. Environ. Res. Public Health 2021, 18, 2269. https://doi.org/10.3390/ijerph18052269 https://www.mdpi.com/journal/ijerph

Int. J. Environ. Res. Public Health 2021, 18, 2269 2 of 16
cases [13–17,26]. Sources of contaminants are of varying nature, e.g., emissions from auto-mobile engines [27,28], the metallurgic industry [14–16], the consumption of fossil fuels [29]and other urban processes. Metallic and other elements have been found as contaminantsin honey [30,31] and honey bee pollen [32]. Elevated concentrations of potentially toxicelements in soils, as compared to background levels, are probably the most common in-dicators of pollution [14,15,33]. However, many other components have been consideredfor monitoring the presence of potentially toxic elements. Among these, honey and honeybee pollen have been put forward as bioindicators. Given that beehives remain in theirlocation for long periods (there are also mobile beehive flocks), they accumulate nectar,water, and pollen from a wide area, i.e., up to 7 km2, during foraging. Thus, with somehive flocks, very large areas can be naturally sampled with very good temporal and spatialrepresentation. Although it has been shown that the mineral content of honey is stronglyinfluenced by botanical factors [34], pollution can easily reach it due to anthropogenic activ-ities [34,35]. Pollen is also considered as a bioindicator of pollution containing potentiallytoxic elements, as it can acquire them through the root systems of plants or through directatmospheric deposition [32,36].
This study was conducted in the region of Mitrovica, Kosovo, which was expectedto be polluted, as the area hosts mines, a lead/zinc smelter, and a battery productionplant. In 2000, the lead/zinc smelter was put out of operation, when it was identifiedas source of significant air pollution [37]; however, previously emitted contaminationremains. At present, only mining and ore concentration processes are still performed.The abundances of eighteen elements in soil, multifloral honey and multifloral honeybeepollen were evaluated in the region of Mitrovica; however, this research focuses on eightof them, namely: As, Cd, Co, Cr, Cu, Ni, Pb, and Zn. These elements were selected asthey are widely reported as pollutants in the literature, and were expected to be presentin the atmosphere of the studied area. An evaluation of the contamination of the areawas performed through a statistical analysis of the acquired data. The concentrations ofthese potentially toxic elements were compared to values found for honey and pollen inarticles published from neighboring countries, i.e., Albania, North Macedonia, Montenegro,and Serbia. In the case of pollen, concentrations were compared with those measuredin countries such as Turkey, Serbia, and Jordan. Possible correlations regarding selectedelements between the soil, honey, and pollen samples were also studied.
2. Materials and Methods2.1. Study Area
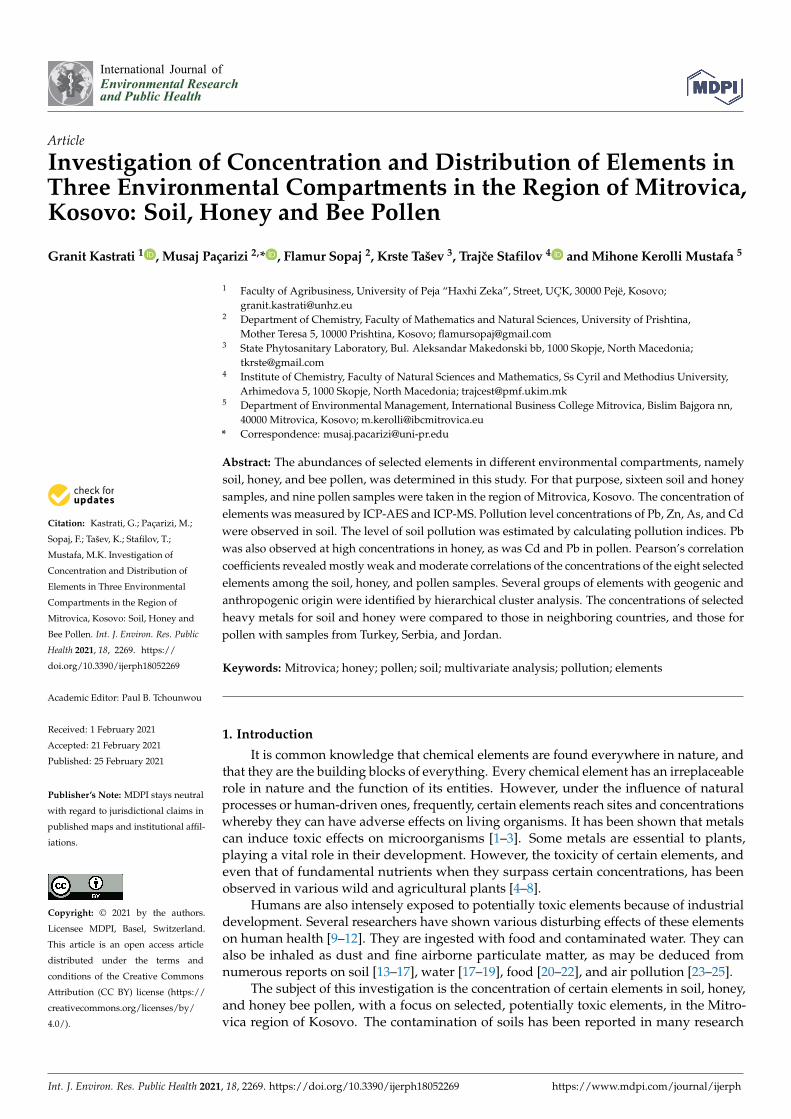
The sampling area was the region of Mitrovica, which is located in the north of Kosovo,and is 2077 km2 in size (Figure 1). The sampling locations were numbered as follows: 1(Polac), 2 (Vajnik), 3 (Padalishtë), 4 (Klinë e epërme), 5 (Bukosh), 6 (Dumnicë), 7 (Frashër),8 (Shupkofc), 9 (Mitrovicë), 10 (Kushtovë), 11 (Zveçan), 12 (Karaq), 13 (Zveçan), 14 (Kulla),15 (Krushevle) and 16 (Leposaviç). The samples of soil and honey were collected from16 locations spread as homogeneously as possible (Figure 1), and honey bee pollen sampleswere collected in 9 locations (3, 4, 5, 6, 7, 8, 9, 10 and 11).
2.2. Soil, Honey, Pollen Sampling
At each sampling point representing nonagricultural land, about 1 kg of 3 to 5 soilsubsamples in a 50 × 50 m area were taken. The soil samples were put into plastic bags,brought in the laboratory for cleaning and homogenization, and then dried in an ovenat 45 ◦C for three days until constant dry mass was achieved. Once the soil was dried,it was ground; then, subsamples were mixed to obtain a more representative sample,and the obtained mixture was sieved through a 125 µm sieve for better digestion. Thesieved soil was put in plastic containers and stored until further treatment. Honey sampleswere collected directly from beehives using a wooden spoon, and were stored in plasticcontainers. To collect pollen samples, a plastic grid equipped with a recipient was put at
Int. J. Environ. Res. Public Health 2021, 18, 2269 3 of 16
the entrance of each hive, so that the pollen could be combed off the bees into the recipient.Pollen was also stored in plastic containers.
Int. J. Environ. Res. Public Health 2021, 18, x FOR PEER REVIEW 3 of 18
Figure 1. Map of the region of Mitrovica and sample site distribution.
2.2. Soil, Honey, Pollen Sampling
At each sampling point representing nonagricultural land, about 1 kg of 3 to 5 soil
subsamples in a 50 × 50 m area were taken. The soil samples were put into plastic bags,
brought in the laboratory for cleaning and homogenization, and then dried in an oven at
45°C for three days until constant dry mass was achieved. Once the soil was dried, it was
ground; then, subsamples were mixed to obtain a more representative sample, and the
obtained mixture was sieved through a 125 μm sieve for better digestion. The sieved soil
was put in plastic containers and stored until further treatment. Honey samples were col-
lected directly from beehives using a wooden spoon, and were stored in plastic containers.
To collect pollen samples, a plastic grid equipped with a recipient was put at the entrance
of each hive, so that the pollen could be combed off the bees into the recipient. Pollen was
also stored in plastic containers.
2.3. Chemical Analysis
An amount of 0.25 g of each soil sample was put into a Teflon beaker, into which 5
mL 69% HNO3 were added. The mixture was then heated until evaporation was complete.
After cooling, 5 mL HF and 1.5 mL HClO4 were added. Finally, after evaporation and
cooling, 1.5 mL HCl and 3 mL distilled water was added into the sample. The solutions
were then diluted to 25 mL in a volumetric plastic flask and sent for analysis.
Honey and pollen samples were digested in a microwave system; 0.5 g of honey or
pollen was put in the Teflon tube, into which 7 mL HNO3 (69% V/V, trace pure, Merck,
Germany) and 2 mL H2O2 p.a. (30% V/V, Merck, Germany) were added, and a microwave
digestion system (Analytic Jena TOPwave, Jena, Germany) was applied with the follow-
ing program: 5 min up to 170°C , hold time of 10 min at 170°C, 1 min up to 200°C, hold
time of 15 min at 200°C , 1 min down to 50°C , and hold time of 23 min at 50°C . The
solutions obtained were then diluted to 25 mL in a volumetric flask and sent for analysis.
By the application of inductively coupled plasma–atomic emission spectrometry
(ICP-AES, Varian, model 715ES, Palo Alto, CA, USA), the concentrations of the following
Figure 1. Map of the region of Mitrovica and sample site distribution.
2.3. Chemical Analysis
An amount of 0.25 g of each soil sample was put into a Teflon beaker, into which 5 mL69% HNO3 were added. The mixture was then heated until evaporation was complete.After cooling, 5 mL HF and 1.5 mL HClO4 were added. Finally, after evaporation andcooling, 1.5 mL HCl and 3 mL distilled water was added into the sample. The solutionswere then diluted to 25 mL in a volumetric plastic flask and sent for analysis.
Honey and pollen samples were digested in a microwave system; 0.5 g of honey orpollen was put in the Teflon tube, into which 7 mL HNO3 (69% v/v, trace pure, Merck,Darmstadt, Germany) and 2 mL H2O2 p.a. (30% v/v, Merck, Darmstadt, Germany) wereadded, and a microwave digestion system (Analytic Jena TOPwave, Jena, Germany) wasapplied with the following program: 5 min up to 170 ◦C, hold time of 10 min at 170 ◦C,1 min up to 200 ◦C, hold time of 15 min at 200 ◦C, 1 min down to 50 ◦C, and hold time of23 min at 50 ◦C. The solutions obtained were then diluted to 25 mL in a volumetric flaskand sent for analysis.
By the application of inductively coupled plasma–atomic emission spectrometry(ICP-AES, Varian, model 715ES, Palo Alto, CA, USA), the concentrations of the following13 elements were determined: Al, Ba, Ca, Cr, Cu, Fe, K, Mg, Mn, Na, P, Sr and Zn. Induc-tively coupled plasma–mass spectrometry (ICP-MS, Plasma Quant ICP-MS, Analytic Jena,Jena, Germany) was applied for the analysis of As, Cd, Co, Ni and Pb. Standard solutionsof the analyzed elements were prepared by dilution of 1000 mg/L solutions (11355-ICPmulti Element Standard, Merck, Darmstadt, Germany).
Both certified reference materials (NIST-SRM 2711a, Montana II Soil, National Instituteof Standards & Technologies, Gaithersburg, MD, USA) and spiked intralaboratory sampleswere analyzed at a combined frequency of 20% of the samples. The recovery for all of theanalyzed elements ranges from 76.8% for Tl to 119% for Sb (for ICP-MS measurements)and from 87.5% for Na to 112% for P (for ICP-AES measurements).
Int. J. Environ. Res. Public Health 2021, 18, 2269 4 of 16
2.4. Methods for Estimating Pollution Indicators
In order to assess the level of pollution, five indices were calculated: contaminationfactor (CF) [16], degree of contamination (Cd) [38], modified degree of contamination(mCd) [39], pollution load index (PLI) [39,40], and geo accumulation index (Igeo) [41].
The formula used to calculate the contamination factor (CF) of each metal in the soilsamples was:
CF = Cisample/Ci
re f erence (1)
where CF is the contamination factor for heavy metal; Cisample is the measured value of the
heavy metal at 0–5 cm depth of soil; and Cireference are the parameters for calculation concern-
ing the background values, i.e., the European topsoil averages of potentially toxic elements [42].According to Hakanson [43], CF values may be assigned as follows:CF < 1—low contamination factor, 1 ≤ CF < 3—moderate contamination factor,3 ≤ CF < 6—considerable contamination factor, and CF ≥ 6—very high contamination factor.
The degree of contamination (Cd) is defined as the sum of all contamination factors ofthe investigated elements:
Cd = ∑n=8n=1 CFi (2)
The following classification proposed by Håkanson [43] was adopted to describe theextent of contamination for the analyzed elements: Cd < 6: low contamination degree,6 ≤ Cd < 12: moderate contamination degree; 12 ≤ Cd < 24: considerable contaminationdegree; and Cd ≥ 24: very high contamination degree.
To provide an overall average value for a range of pollutants, the Modified Degree ofContamination (mCd) was calculated using the generalized formula:
mCd =∑n=8
i=1 CFi
n(3)
where n is the number of analyzed element and CFi is the contamination factor. Abrahim [39]proposed the following modified degree of contamination (mCd): mCd < 1.5—nil to very lowdegree of contamination, 1.5 ≤ mCd < 2—low degree of contamination, 2 ≤ mCd < 4—moderatedegree of contamination, 4 ≤ mCd < 8—high degree of contamination, 8 ≤ mCd < 16—veryhigh degree of contamination, 16 ≤ mCd < 32—extremely high degree of contamination, andmCd ≥ 32—ultra-high degree of contamination.
The PLI provides information about the abundance of the analyzed element in theenvironment. The PLI of a single site is the n root of n number, multiplied with thecontamination factor (CF) values:
PLI = (CF1 x CF2 x CF3 x . . . CFn)1n (4)
where CF is the contamination factor and n is the number of metals. When PLI isgreater than 1, it means that contamination exists, while if PLI is less than 1, there isno such contamination.
To assess the contamination impact of potentially toxic elements in the soil, a commonapproach, the geoaccumulation index (Igeo), was used to calculate the concentrations ofelements relative to background or baseline concentrations. The method assesses thedegree of metal contamination in terms of seven classes, based on the increasing numericalvalues of the index. This index is calculated as follows:
Igeo =log2 x Cn
1.5 Bn(5)
where Cn is the concentration of the element in the enriched samples, and Bn is the averageof European topsoil [42]. Müller proposed the following descriptive classes for increasingIgeo values [41]: Igeo > 5—extremely contaminated, Igeo from 4 to 5—strongly to extremelycontaminated, Igeo from 3 to 4—strongly contaminated, Igeo from 2 to 3—moderately

Int. J. Environ. Res. Public Health 2021, 18, 2269 5 of 16
to strongly contaminated, Igeo from 1 to 2—moderately contaminated, Igeo from 0 to1—uncontaminated to moderately contaminated, and Igeo ≤ 0 uncontaminated.
All of the pollution indices in this work were calculated only for the eight selectedpotentially toxic elements: As, Cd, Co, Cr, Cu, Ni, Pb, and Zn.
2.5. Statistical Analysis
Microsoft Excel and SPSS 12 software (StatSoft. Inc, TULSA, OK, USA) were used toperform statistical analyses. Cluster analysis was also used to investigate the similaritiesbetween element patterns from soil, honey, and pollen samples. Evaluations of similaritybetween groups of cluster analyses were based on the Ward’s method [19].
3. Results and Discussions3.1. Soil
Eighteen elements were evaluated in 16 soil samples collected throughout the regionof Mitrovica at depths 0–5 cm and 20–30 cm. To show the concentration of these elements,basic statistical parameters such as mean, median, minimum and maximum concentrationare presented in Tables 1 and 2. The maximum concentrations of eight potentially toxicelements at 0–5 cm depth in mg/kg were as follows: Pb (3610) > Ni (1263) > Zn (1116) > Cr(1099) > As (272) > Cu (88.8) > Co (71.6) > Cd (8.80). The median of concentrations over thewhole sampling area for each element followed the order: Pb (166) > Zn (153) > Cr (102) >Ni (94.7) > Cu (35.7) > Co (14.0) > As (8.16) > Cd (0.41). A particularly high concentration ofPb was found in sample 11 (Mitrovicë–Zveçan), which is in accordance with the previouswork [14]. Concentrations of over 500 mg/kg of Pb were found at sampling sites 7, 8,and 14, whereas in 10 samples, the concentrations of Pb were over 100 mg/kg. Arsenicconcentration was relatively homogenously distributed, except in sample 8, which showeda remarkably high value, i.e., 272 mg/kg. Spikes in concentrations were also observedfor Ni and Cr in sample 14, and Zn in sample 11. The high concentrations of Ni andCr in sample 14 may have been due to vehicle exhaust and wear of vehicle parts froma regional road which almost surrounds it, and also from lead/zinc smelting facilities.However, the geochemical composition of the soil may be the most important reasonfor the high Ni and Cr concentrations in this location, because high concentrations ofthese two metals were measured at depths of 20–30 cm. Concentrations over 50 mg/kgwere measured for Cu in samples 2, 3, 8, and 11, whereas Co exceeded 50 mg/kg only atsampling point 14; in all other samples, its concentration was 40 mg/kg or less. The highestconcentration for Cd was observed at sampling point 8 and 3, with concentrations of 8.8and 6.6 mg/kg respectively; all other values were about 1 mg/kg or lower. Although theconcentration of Cd was much lower than those of other metals, it stood out in comparisonto its concentration in other locations, except for that at sampling point 8, which was thehighest. This increased concentration may have been a result of the dust transported bywind from a gravel excavation site which is located nearby, in the north.
The concentrations of the selected elements agree in general with those reported ina study by Šajn et al. [14]; however, some discrepancies may have arisen from the factthat the area covered in the present work was larger, and not limited to the area aroundthe lead/zinc smelting site, where higher pollution would be expected. However, justas Šajn et al. [14] indicated, most of the high concentrations of selected potentially toxicelements were found around the lead/zinc smelting site, which is located just besidethe city of Mitrovica. It is worth noting that the maximum lead concentration in thisregion significantly exceeds the maximum concentration allowed for some industrialsites in neighboring countries, namely Albania, Serbia, and North Macedonia [44–46];see Table 1. Arsenic was also found in higher concentrations than in soils surroundingindustrial facilities in Vojvodina, Serbia [45], and North Macedonia [46]. However thiscomparison is relatively accurate, because the dissolution method of soil samples in theaforementioned countries was not the same (aqua regia, and sequential extraction) as inthis work (total dissolution).

Int. J. Environ. Res. Public Health 2021, 18, 2269 6 of 16
Table 1. Basic statistics of element concentrations in surface soil, i.e., 0–5 cm (in mg/kg), in Balkan countries.
Kosovo 2019 (Present Work);n = 16
North Macedonia, 2010 [46];n = 344
Albania, 1998[44]; n = 8
Serbia, 2010 [45];n = 45
Mean Median Range STD Mean Median Range Range Mean Median Range
Al 22,608 19,331 8212–46,207 10,427 65,000 6600 900–11,000 - 20,399 20,417 10,444–31,386As 25.4 8.16 2.01–272 66.2 15 10 1–720 - 6.55 6.52 1.09–21.4Ba 251 247 157–449 87.0 500 430 6.0–2900 - - - -Ca 26,570 11.347 2344–146,582 37,474 28,000 13,000 500–350,000 2100–28,000 28,078 4734 24,062–68,422Cd 1.37 0.41 0.10–8.8 2.53 0.81 0.30 0.10–110 2.0–14 0.36 0.33 0.21–1.27Co 17.1 14 4.23–71.6 16.0 18 17 0.50–150 130–476 10.8 9.97 5.31–24.1Cr 175 102 45.7–1099 252 130 88 5.0–2700 91–3865 49.3 36.8 21.1–247Cu 41 35.7 16.5–88.8 18.7 32 28 1.6–270 6.0–1107 28.0 22.8 13.6–94.4Fe 24,936 23,287 14,693–45,381 8466 36,000 35,000 300–120,000 - 20,888 21,144 11,515–34,855K 11,653 11,616 7619–15,812 2614 19,000 19,000 200–53,000 - 1531 1614 391–3013
Mg 7205 5451 2603–20,450 4850 13,000 9400 1200–130,000 10,400–25,300 18,201 13,805 6061–85,900Mn 742 553 408–1983 407 1000 900 17–10,000 - 630 625 455–899Na 1868 1998 472–3415 944 13000 12000 130–60,000 - - - -Ni 199 94.7 29.9–1263 296 78 46 2.1–2500 54–3579 51.6 39.9 23.5–230P 752 627 524–1673 316 700 620 110–25,900 - - - -
Pb 487 167 15.5–3610 897 95 32 1.2–10,000 80–172 21.6 18.6 6.42–67.7Sr 87.9 60.9 31.4–2508 62.2 190 140 21–1400 - - - -Zn 224 153 69.6–1116 254 140 35 0.8–210 49–2495 65.9 51.3 33.4–192
On 28 August 2018, guidelines were approved by the government of Kosovo, i.e.,decision No.13/62 [47]. According to these regulations, polluted soil is divided into threecategories regarding metal pollution; A—clean, B—acceptable contamination, but furtherinvestigation is required, and C—high contamination and needs to be cleaned. The medianconcentrations of Pb, Zn, Ni, As, Cr measured in this investigation fell into category C;those of Cd and Ni were between A and B, and that of Cu corresponded with category A.
The highest concentrations of Pb and Zn, as well as other metals, were found aroundthe lead/zinc smelting site and the tailing waste dump. This was expected, since oreprocessing emits fine particles which contain these elements. At sampling points 7, 8,11, and 14, the concentration of lead corresponded to category C, whereas at samplingpoints 13, 15, and 16, it fell between category A and B. The rest of the sampling pointscorresponded to category A.
Zinc concentrations fell within category B at sample 8, and category C for sample 11.Higher concentrations of Cu were measured at sample points 2 and 3, and for Cd atsample point 3; those locations were the most distant from mineral processing facilitiesof lead/zinc in Zveçan and Mitrovica, and as such, they corresponded to the category A.Arsenic corresponded to category C only at sampling points 8 and 11, and to category A inthe remaining locations. In the case of Cr, all samples corresponded to category A, except14, which was within category C. Most Co concentrations were within category A, exceptfor those from sampling sites 14 and 15, which were between A and B.
Table 2. Basic statistics of element concentrations in the subsurface soil, i.e., 20–30 cm (in mg/kg).
Al As Ba Ca Cd Co Cr Cu Fe K Mg Mn Na Ni P Pb Sr Zn
Mean 22,889 9 286 30,100 1 19 197 35 25,890 12,059 6896 686 1889 219 617 252 100 190Median 22,023 7 232 12,399 0.14 13 96 34 24,594 13,026 5315 553 1979 91 527 135 73 130
Min 9962 1 114 1288 0.1 3 50 15 15,354 6513 1763 384 227 22 309 5 27 47Max 41,202 20 505 152,162 9 97 1429 57 55,976 16,572 24,626 1350 3783 1648 2040 1398 251 497STD 10,329 5.18 120 41,431 2.29 23.2 344 11 9894 3007 5497 292 1133 403 435 362 71 143
In Table 2, the basic statistical parameters for elements in subsoil samples with a depthof 20–30 cm are shown. The maximum values of selected potentially toxic elements (inmg/kg) in increasing order were: Ni (1648) > Cr (1429) > Pb (1398) > Zn (497) > Cu (57) >As (20) > Co (13) > Cd (9). The median values are Pb (135) > Zn (130) > Cr (96) > Ni (91) >Cu (34) > Co (19) > As (7) > Cd (0.14). The concentration of Pb in soil at a depth of 20–30 cmwas lower than at a depth of 0–5 cm. Its highest value, 1398 mg/kg, was measured atlocation 7, whereas at locations 11, 13, and 14, it was 631, 291, and 447 mg/kg, respectively.The rest of the values were under 200 mg/kg. Unlike at 0–5 cm depth, at 20–30 cm, the As

Int. J. Environ. Res. Public Health 2021, 18, 2269 7 of 16
concentration was far lower: in sample 8, its concentration was 6.43 mg/kg; in samples 7,10, 11, and 16, it ranged between 10 and 20 mg/kg, whereas the rest of the samples had aconcentration below 10 mg/kg. Ni and Cr were found at high concentrations at location14 (at 0–5 cm depth). Zn was found in concentrations between 200–500 mg/kg at fivelocations in increasing order 7 > 12 > 8 > 11 > 14. Cu was more homogeneously distributed,with most of its concentrations being between 20–40 mg/kg. Its highest concentration wasdetected at sampling points 7 (57.2 mg/kg) and 2 (54.2 mg/kg). The highest concentrationof Co was observed at sample location 14 (97.0 mg/kg); the other values were 35 mg/kgor less. For Cd, only at point 7 was it close to 9 mg/kg; elsewhere, concentrations were3 mg/kg or below.
The CF values for each sampling point for the selected potentially toxic elements aregiven in Table 3. The CF values varied greatly among the samples, from those indicatinglow contamination, moderate contamination, and highly contaminated. The highest CFwas found for Pb in sample 11, with a value of 157. Extremely high CF were also found forNi in sample 14 (70.2), Cd in sample 8 (58.7), and As in sample 8 (38.9).
Table 3. Contamination factors (CF) of selected elements for each sampling site.
No As Cd Co Cr Cu Ni Pb Zn
1 0.29 0.67 0.54 0.92 2.75 6.42 3.03 1.382 0.92 0.92 2.31 2.55 4.77 16.9 2.93 2.353 1.60 43.9 1.76 0.89 4.11 3.99 1.09 1.404 0.38 3.13 1.17 1.48 2.35 3.89 3.06 1.655 1.24 1.17 2.80 2.72 2.57 10.6 6.49 2.356 1.17 0.67 0.78 0.76 1.27 1.66 0.88 1.347 1.00 8.53 1.55 1.30 2.06 3.79 26.7 5.678 38.9 58.7 1.93 1.74 5.40 6.62 54.7 6.889 0.73 0.64 0.80 1.38 2.77 4.68 7.94 3.2610 1.16 6.20 2.23 3.39 2.74 15.4 0.67 1.8911 4.57 6.60 1.83 1.99 6.83 5.58 157 21.512 0.83 0.99 0.68 1.58 2.45 3.36 4.37 5.3313 1.52 5.33 1.79 1.66 2.19 4.90 16.4 2.8314 0.76 5.11 9.18 18.32 2.98 70.2 30.5 5.2115 1.53 1.51 3.91 3.84 3.15 14.3 11.0 3.0416 1.55 2.37 1.81 2.06 2.09 4.95 12.11 3.04
The contamination degree values are given in Table 4. All samples fell within the Cdinterval values for considerable or very high contamination degree. The most extreme Cdvalues were observed for samples 11 (206), 8 (175), and 14 (142). As can be seen in Table 4,only sample 6 showed a low modified degree of contamination (mCd); then, there weresamples with moderate, high, and very high degrees of contamination. Samples 8, 11, and14 were extremely contaminated, with mCd, 21.9, 25.7, and 17.8 respectively. Table 4 alsoshows that there was no sample with a PLI less than 1, which indicated that the whole areaof the region of Mitrovica is polluted with potentially toxic elements. The most pollutedsite was revealed to be location 8, with PLI 10.0, followed by 14, with PLI 8.26, and 11, withPLI 7.83.
According to the Igeo classification (Table 5), only samples 11 and 8 appeared to beextremely contaminated with Pb. Samples 14 and 8 were extremely contaminated with Niand Cd, respectively (Table 5). Sample 8 was strongly contaminated with As. Co, Cd, andAs were the least abundant contaminants, followed by Cr and Zn, whereas Ni and Pb hadthe highest Igeo values.

Int. J. Environ. Res. Public Health 2021, 18, 2269 8 of 16
Table 4. Degree of contamination (Cd), modified degree of contamination (mCd), and pollution loadindex (PLI) for each sampling site.
No Cd mCd PLI
1 16.0 2.00 1.282 33.6 4.21 2.693 58.8 7.35 2.694 17.1 2.14 1.775 29.9 3.74 2.876 8.54 1.07 1.027 50.6 6.33 3.468 175 21.9 10.09 22.2 2.78 1.9110 33.7 4.21 2.7111 206 25.7 7.8312 19.6 2.45 1.9013 36.7 4.58 3.2414 142 17.8 8.2615 42.3 5.28 3.8916 30.0 3.75 2.91
Table 5. Geoaccumulation index (Igeo) of selected elements for each sampling site.
No Igeo(As) Igeo(Cd) Igeo(Co) Igeo(Cr) Igeo(Cu) Igeo(Ni) Igeo(Pb) Igeo(Zn)
1 −2.388 −1.170 −1.47 −0.70 0.88 2.10 1.02 −0.122 −0.711 −0.705 0.62 0.76 1.67 3.49 0.97 0.653 0.091 4.872 0.23 −0.75 1.45 1.41 −0.46 −0.104 −1.991 1.063 −0.36 −0.02 0.65 1.37 1.03 0.145 −0.274 −0.363 0.90 0.86 0.78 2.81 2.11 0.656 −0.359 −1.170 −0.93 −0.98 −0.24 0.15 −0.77 −0.167 −0.589 2.508 0.05 −0.20 0.46 1.34 4.16 1.928 4.697 5.290 0.36 0.21 1.85 2.14 5.19 2.209 −1.032 −1.229 −0.90 −0.12 0.88 1.64 2.40 1.1210 −0.367 2.047 0.57 1.18 0.87 3.36 −1.16 0.3411 1.608 2.138 0.29 0.41 2.19 1.89 6.71 3.8412 −0.858 −0.595 −1.13 0.08 0.71 1.16 1.54 1.8313 0.017 1.830 0.26 0.15 0.55 1.71 3.45 0.9214 −0.979 1.769 2.61 3.61 0.99 5.55 4.34 1.8015 0.028 0.013 1.38 1.36 1.07 3.25 2.87 1.0216 0.045 0.658 0.27 0.46 0.48 1.72 3.01 1.02
A hierarchical cluster analysis is presented in Figure 2. The dendrogram constructedby Ward’s method revealed six clusters. The first was associated with Ca, the second withAl and Fe, the third with K and Mg, the forth with Na, the fifth with Zn, Mn, Pb, andthe sixth with As, Cd, Co, Cu, Sr, Cr and Ni. Clusters of Ca, Al and Fe, and K and Mg,are not presented in Figure 2, as the aforementioned very high values obscured the data.Clusters 1, 2, 3, 5 and 6 were mostly related to the geochemical composition of the soil [14].Cluster 5 appeared to be due to the anthropogenic activities, i.e., mainly from the leadsmelting sites in Zveçan and Mitrovica (samples 9, 11 and 13). Although elements in cluster6 may have been of geogenic origin, the concentrations of these elements and the pollutionindices indicated that some sites were also polluted with As, Cd, Co, Cr, Ni, and Cu. Theincreased concentrations of these elements also originated from mineral processing at theaforementioned lead and zinc smelting sites [14,48].

Int. J. Environ. Res. Public Health 2021, 18, 2269 9 of 16
Int. J. Environ. Res. Public Health 2021, 18, x FOR PEER REVIEW 10 of 18
13 0.017 1.830 0.26 0.15 0.55 1.71 3.45 0.92
14 −0.979 1.769 2.61 3.61 0.99 5.55 4.34 1.80
15 0.028 0.013 1.38 1.36 1.07 3.25 2.87 1.02
16 0.045 0.658 0.27 0.46 0.48 1.72 3.01 1.02
A hierarchical cluster analysis is presented in Figure 2. The dendrogram constructed
by Ward’s method revealed six clusters. The first was associated with Ca, the second with
Al and Fe, the third with K and Mg, the forth with Na, the fifth with Zn, Mn, Pb, and the
sixth with As, Cd, Co, Cu, Sr, Cr and Ni. Clusters of Ca, Al and Fe, and K and Mg, are not
presented in Figure 2, as the aforementioned very high values obscured the data. Clusters
1, 2, 3, 5 and 6 were mostly related to the geochemical composition of the soil [14]. Cluster
5 appeared to be due to the anthropogenic activities, i.e., mainly from the lead smelting
sites in Zveçan and Mitrovica (samples 9, 11 and 13). Although elements in cluster 6 may
have been of geogenic origin, the concentrations of these elements and the pollution indi-
ces indicated that some sites were also polluted with As, Cd, Co, Cr, Ni, and Cu. The
increased concentrations of these elements also originated from mineral processing at the
aforementioned lead and zinc smelting sites [14,48].
Figure 2. Hierarchical cluster dendrogram for elements in soil.
3.2. Honey
Multifloral honey samples were collected at the same locations as the soil samples,
and after analysis, the maximum concentrations in mg/kg for selected elements were as
follows (Table 6): Cu (2.98) > Pb (2.10) > Zn (1.90) > Cr (0.84) > Ni (0.22) > As (0.12) > Cd
(0.04) > Co (0.03), and median values: Cu (1.33) > Zn (0.73) > Pb (0.42) > Ni (0.13) > Cr (0.1)
> As (0.04) > Cd (0.02) > Co (0.01). Samples from seven sampling locations showed Cu
concentrations between 1.52 –2.98 mg/kg; at the other sites, these values were 1.24 mg/kg
or lower. A spike in the lead concentration was observed at site 11; five other locations fell
within the range of 0.55–1.14 mg/kg, and the concentrations of Cu in the rest of the sam-
ples were under 0.5 mg/kg. Samples 6, 7, 8, 10, and 16, had concentrations of Zn between
1.04–1.9 mg/kg, while in the rest of them, it was below 1 mg/kg. Cr spikes were identified
in samples 4, 6, 9, 11, with concentrations between 0.37–0.84 mg/kg; at point 3, it was 0.2
mg/kg, and in all other samples, it was 0.1 mg/kg. The highest concentration of As was
measured in the sample from location 4, whereas the rest of the concentrations ranged
Figure 2. Hierarchical cluster dendrogram for elements in soil.
3.2. Honey
Multifloral honey samples were collected at the same locations as the soil samples,and after analysis, the maximum concentrations in mg/kg for selected elements were asfollows (Table 6): Cu (2.98) > Pb (2.10) > Zn (1.90) > Cr (0.84) > Ni (0.22) > As (0.12) > Cd(0.04) > Co (0.03), and median values: Cu (1.33) > Zn (0.73) > Pb (0.42) > Ni (0.13) > Cr (0.1)> As (0.04) > Cd (0.02) > Co (0.01). Samples from seven sampling locations showed Cuconcentrations between 1.52 –2.98 mg/kg; at the other sites, these values were 1.24 mg/kgor lower. A spike in the lead concentration was observed at site 11; five other locationsfell within the range of 0.55–1.14 mg/kg, and the concentrations of Cu in the rest of thesamples were under 0.5 mg/kg. Samples 6, 7, 8, 10, and 16, had concentrations of Znbetween 1.04–1.9 mg/kg, while in the rest of them, it was below 1 mg/kg. Cr spikes wereidentified in samples 4, 6, 9, 11, with concentrations between 0.37–0.84 mg/kg; at point 3, itwas 0.2 mg/kg, and in all other samples, it was 0.1 mg/kg. The highest concentration of Aswas measured in the sample from location 4, whereas the rest of the concentrations rangedbetween 0.02–0.06 mg/kg. Most of the Cd concentrations were between 0.01–0.044 mg/kg,while most of the Co concentrations were around 0.01 mg/kg.
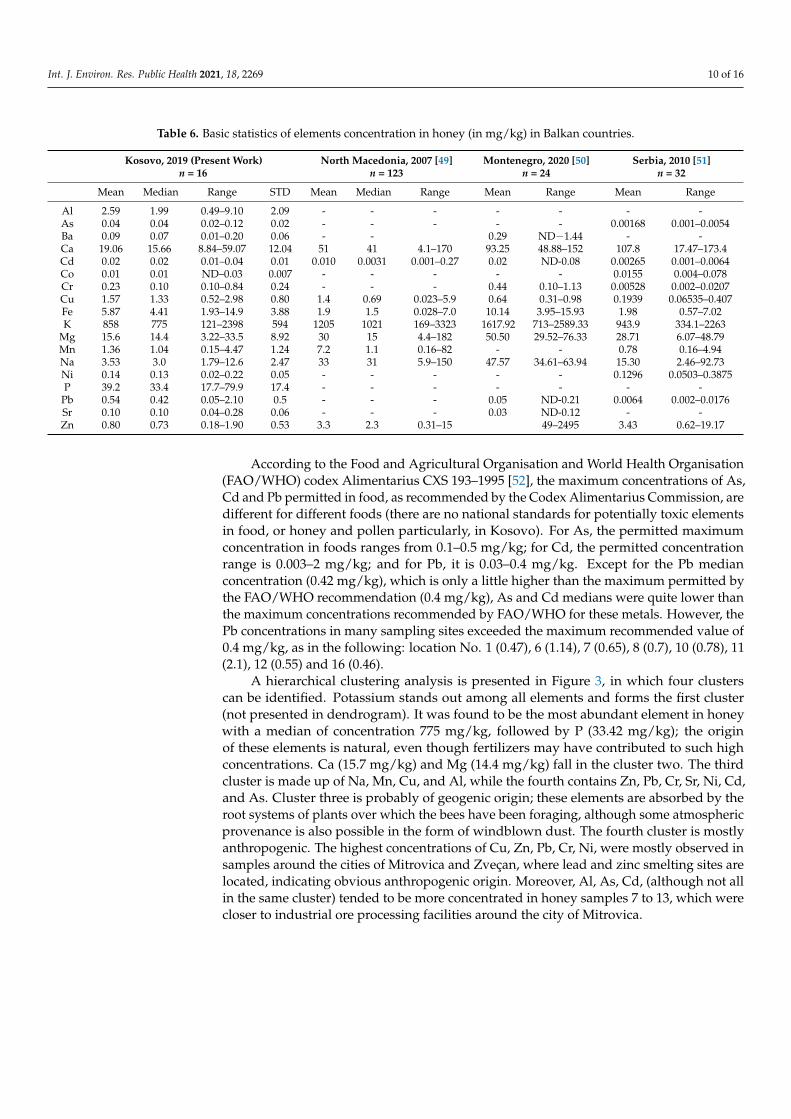
The most abundant of the eight selected potentially toxic elements in honey wasCu, with a median of 1.33 mg/kg and a maximum concentration of 2.98 mg/kg. Acomparison among three Balkan countries is given below (Table 6). The median for Cuwas higher than that measured in honey from the whole territory of North Macedonia,which was 0.69 mg/kg, while the maximum concentration, i.e., 2.98 mg/kg, was lowercompared to that measured in North Macedonia, i.e., 5.9 mg/kg [49]. However, themean concentration of Cu (1.57 mg/kg) was higher than those found in Montenegro [50]and Serbia [51]. Lead mean concentration (0.54 mg/kg) was higher than that found inSerbia (0.0064 mg/kg) [51] and in honey from some locations in Montenegro [50] (with amaximum mean of 0.21 mg/kg). The median value for zinc (0.73 mg/kg) was lower thanthat of North Macedonia (2.3 mg/kg) [49], whereas the mean concentration was lowerthan in honey samples from the countries mentioned. The Cr mean value was higherthan in Serbia (0.0053 mg/kg) and lower than in some areas in Montenegro. The Ni mean(0.14 mg/kg) was close to that in Serbia (0.129 mg/kg). The As mean concentration inhoney from the Mitrovica region was 0.04 mg/kg, i.e., higher than in Serbia. Cd waspresent with a median of 0.02 mg/kg, which was higher than that in North Macedonia(0.0031 mg/kg)
Int. J. Environ. Res. Public Health 2021, 18, 2269 10 of 16
Table 6. Basic statistics of elements concentration in honey (in mg/kg) in Balkan countries.
Kosovo, 2019 (Present Work)n = 16
North Macedonia, 2007 [49]n = 123
Montenegro, 2020 [50]n = 24
Serbia, 2010 [51]n = 32
Mean Median Range STD Mean Median Range Mean Range Mean Range
Al 2.59 1.99 0.49–9.10 2.09 - - - - - - -As 0.04 0.04 0.02–0.12 0.02 - - - - - 0.00168 0.001–0.0054Ba 0.09 0.07 0.01–0.20 0.06 - - 0.29 ND−1.44 - -Ca 19.06 15.66 8.84–59.07 12.04 51 41 4.1–170 93.25 48.88–152 107.8 17.47–173.4Cd 0.02 0.02 0.01–0.04 0.01 0.010 0.0031 0.001–0.27 0.02 ND-0.08 0.00265 0.001–0.0064Co 0.01 0.01 ND–0.03 0.007 - - - - - 0.0155 0.004–0.078Cr 0.23 0.10 0.10–0.84 0.24 - - - 0.44 0.10–1.13 0.00528 0.002–0.0207Cu 1.57 1.33 0.52–2.98 0.80 1.4 0.69 0.023–5.9 0.64 0.31–0.98 0.1939 0.06535–0.407Fe 5.87 4.41 1.93–14.9 3.88 1.9 1.5 0.028–7.0 10.14 3.95–15.93 1.98 0.57–7.02K 858 775 121–2398 594 1205 1021 169–3323 1617.92 713–2589.33 943.9 334.1–2263
Mg 15.6 14.4 3.22–33.5 8.92 30 15 4.4–182 50.50 29.52–76.33 28.71 6.07–48.79Mn 1.36 1.04 0.15–4.47 1.24 7.2 1.1 0.16–82 - - 0.78 0.16–4.94Na 3.53 3.0 1.79–12.6 2.47 33 31 5.9–150 47.57 34.61–63.94 15.30 2.46–92.73Ni 0.14 0.13 0.02–0.22 0.05 - - - - - 0.1296 0.0503–0.3875P 39.2 33.4 17.7–79.9 17.4 - - - - - - -
Pb 0.54 0.42 0.05–2.10 0.5 - - - 0.05 ND-0.21 0.0064 0.002–0.0176Sr 0.10 0.10 0.04–0.28 0.06 - - - 0.03 ND-0.12 - -Zn 0.80 0.73 0.18–1.90 0.53 3.3 2.3 0.31–15 49–2495 3.43 0.62–19.17
According to the Food and Agricultural Organisation and World Health Organisation(FAO/WHO) codex Alimentarius CXS 193–1995 [52], the maximum concentrations of As,Cd and Pb permitted in food, as recommended by the Codex Alimentarius Commission, aredifferent for different foods (there are no national standards for potentially toxic elementsin food, or honey and pollen particularly, in Kosovo). For As, the permitted maximumconcentration in foods ranges from 0.1–0.5 mg/kg; for Cd, the permitted concentrationrange is 0.003–2 mg/kg; and for Pb, it is 0.03–0.4 mg/kg. Except for the Pb medianconcentration (0.42 mg/kg), which is only a little higher than the maximum permitted bythe FAO/WHO recommendation (0.4 mg/kg), As and Cd medians were quite lower thanthe maximum concentrations recommended by FAO/WHO for these metals. However, thePb concentrations in many sampling sites exceeded the maximum recommended value of0.4 mg/kg, as in the following: location No. 1 (0.47), 6 (1.14), 7 (0.65), 8 (0.7), 10 (0.78), 11(2.1), 12 (0.55) and 16 (0.46).
A hierarchical clustering analysis is presented in Figure 3, in which four clusterscan be identified. Potassium stands out among all elements and forms the first cluster(not presented in dendrogram). It was found to be the most abundant element in honeywith a median of concentration 775 mg/kg, followed by P (33.42 mg/kg); the originof these elements is natural, even though fertilizers may have contributed to such highconcentrations. Ca (15.7 mg/kg) and Mg (14.4 mg/kg) fall in the cluster two. The thirdcluster is made up of Na, Mn, Cu, and Al, while the fourth contains Zn, Pb, Cr, Sr, Ni, Cd,and As. Cluster three is probably of geogenic origin; these elements are absorbed by theroot systems of plants over which the bees have been foraging, although some atmosphericprovenance is also possible in the form of windblown dust. The fourth cluster is mostlyanthropogenic. The highest concentrations of Cu, Zn, Pb, Cr, Ni, were mostly observed insamples around the cities of Mitrovica and Zveçan, where lead and zinc smelting sites arelocated, indicating obvious anthropogenic origin. Moreover, Al, As, Cd, (although not allin the same cluster) tended to be more concentrated in honey samples 7 to 13, which werecloser to industrial ore processing facilities around the city of Mitrovica.
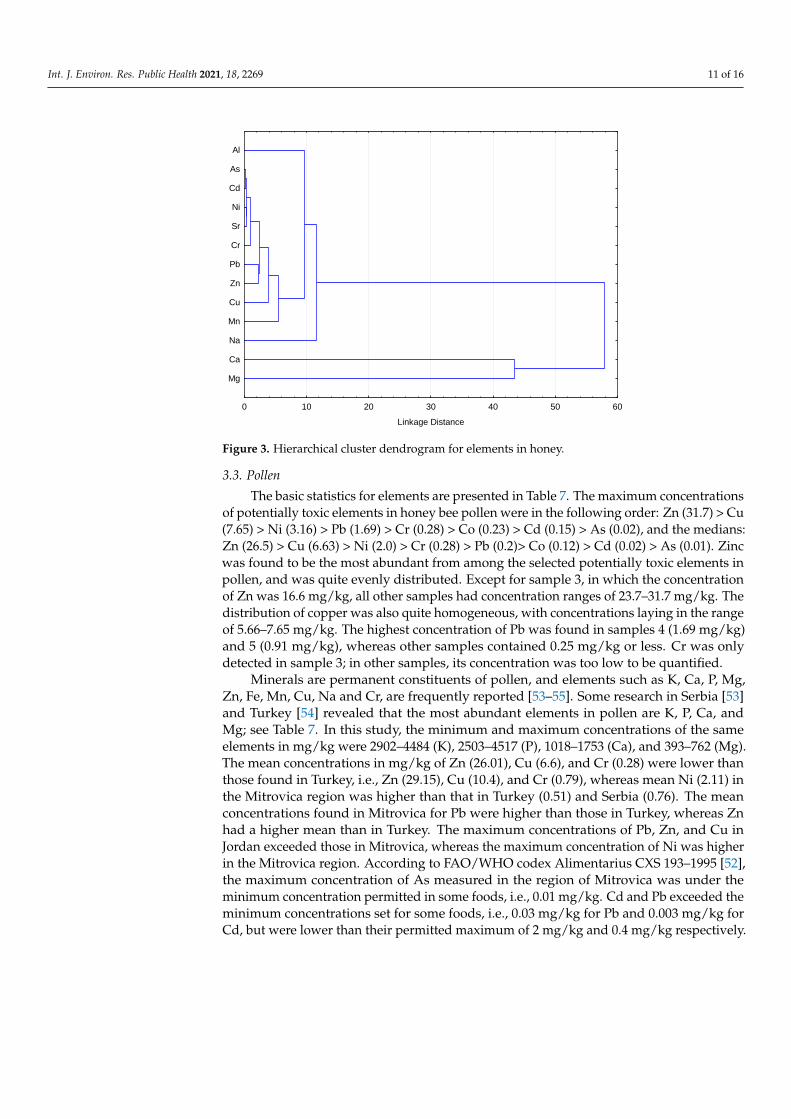
Int. J. Environ. Res. Public Health 2021, 18, 2269 11 of 16
Int. J. Environ. Res. Public Health 2021, 18, x FOR PEER REVIEW 12 of 18
presented in dendrogram). It was found to be the most abundant element in honey with
a median of concentration 775 mg/kg, followed by P (33.42 mg/kg); the origin of these
elements is natural, even though fertilizers may have contributed to such high concentra-
tions. Ca (15.7 mg/kg) and Mg (14.4 mg/kg) fall in the cluster two. The third cluster is
made up of Na, Mn, Cu, and Al, while the fourth contains Zn, Pb, Cr, Sr, Ni, Cd, and As.
Cluster three is probably of geogenic origin; these elements are absorbed by the root sys-
tems of plants over which the bees have been foraging, although some atmospheric prov-
enance is also possible in the form of windblown dust. The fourth cluster is mostly an-
thropogenic. The highest concentrations of Cu, Zn, Pb, Cr, Ni, were mostly observed in
samples around the cities of Mitrovica and Zveçan, where lead and zinc smelting sites are
located, indicating obvious anthropogenic origin. Moreover, Al, As, Cd, (although not all
in the same cluster) tended to be more concentrated in honey samples 7 to 13, which were
closer to industrial ore processing facilities around the city of Mitrovica.
0 10 20 30 40 50 60
Linkage Distance
Mg
Ca
Na
Mn
Cu
Zn
Pb
Cr
Sr
Ni
Cd
As
Al
Figure 3. Hierarchical cluster dendrogram for elements in honey.
3.3. Pollen
The basic statistics for elements are presented in Table 7. The maximum concentra-
tions of potentially toxic elements in honey bee pollen were in the following order: Zn
(31.7) > Cu (7.65) > Ni (3.16) > Pb (1.69) > Cr (0.28) > Co (0.23) > Cd (0.15) > As (0.02), and
the medians: Zn (26.5) > Cu (6.63) > Ni (2.0) > Cr (0.28) > Pb (0.2)> Co (0.12) > Cd (0.02) >
As (0.01). Zinc was found to be the most abundant from among the selected potentially
toxic elements in pollen, and was quite evenly distributed. Except for sample 3, in which
the concentration of Zn was 16.6 mg/kg, all other samples had concentration ranges of
23.7–31.7 mg/kg. The distribution of copper was also quite homogeneous, with concentra-
tions laying in the range of 5.66–7.65 mg/kg. The highest concentration of Pb was found
in samples 4 (1.69 mg/kg) and 5 (0.91 mg/kg), whereas other samples contained 0.25 mg/kg
or less. Cr was only detected in sample 3; in other samples, its concentration was too low
to be quantified.
Minerals are permanent constituents of pollen, and elements such as K, Ca, P, Mg,
Zn, Fe, Mn, Cu, Na and Cr, are frequently reported [53–55]. Some research in Serbia [53]
and Turkey [54] revealed that the most abundant elements in pollen are K, P, Ca, and Mg;
see Table 7. In this study, the minimum and maximum concentrations of the same ele-
ments in mg/kg were 2902–4484 (K), 2503–4517 (P), 1018–1753 (Ca), and 393–762 (Mg). The
mean concentrations in mg/kg of Zn (26.01), Cu (6.6), and Cr (0.28) were lower than those
Figure 3. Hierarchical cluster dendrogram for elements in honey.
3.3. Pollen
The basic statistics for elements are presented in Table 7. The maximum concentrationsof potentially toxic elements in honey bee pollen were in the following order: Zn (31.7) > Cu(7.65) > Ni (3.16) > Pb (1.69) > Cr (0.28) > Co (0.23) > Cd (0.15) > As (0.02), and the medians:Zn (26.5) > Cu (6.63) > Ni (2.0) > Cr (0.28) > Pb (0.2)> Co (0.12) > Cd (0.02) > As (0.01). Zincwas found to be the most abundant from among the selected potentially toxic elements inpollen, and was quite evenly distributed. Except for sample 3, in which the concentrationof Zn was 16.6 mg/kg, all other samples had concentration ranges of 23.7–31.7 mg/kg. Thedistribution of copper was also quite homogeneous, with concentrations laying in the rangeof 5.66–7.65 mg/kg. The highest concentration of Pb was found in samples 4 (1.69 mg/kg)and 5 (0.91 mg/kg), whereas other samples contained 0.25 mg/kg or less. Cr was onlydetected in sample 3; in other samples, its concentration was too low to be quantified.
Minerals are permanent constituents of pollen, and elements such as K, Ca, P, Mg,Zn, Fe, Mn, Cu, Na and Cr, are frequently reported [53–55]. Some research in Serbia [53]and Turkey [54] revealed that the most abundant elements in pollen are K, P, Ca, andMg; see Table 7. In this study, the minimum and maximum concentrations of the sameelements in mg/kg were 2902–4484 (K), 2503–4517 (P), 1018–1753 (Ca), and 393–762 (Mg).The mean concentrations in mg/kg of Zn (26.01), Cu (6.6), and Cr (0.28) were lower thanthose found in Turkey, i.e., Zn (29.15), Cu (10.4), and Cr (0.79), whereas mean Ni (2.11) inthe Mitrovica region was higher than that in Turkey (0.51) and Serbia (0.76). The meanconcentrations found in Mitrovica for Pb were higher than those in Turkey, whereas Znhad a higher mean than in Turkey. The maximum concentrations of Pb, Zn, and Cu inJordan exceeded those in Mitrovica, whereas the maximum concentration of Ni was higherin the Mitrovica region. According to FAO/WHO codex Alimentarius CXS 193–1995 [52],the maximum concentration of As measured in the region of Mitrovica was under theminimum concentration permitted in some foods, i.e., 0.01 mg/kg. Cd and Pb exceeded theminimum concentrations set for some foods, i.e., 0.03 mg/kg for Pb and 0.003 mg/kg forCd, but were lower than their permitted maximum of 2 mg/kg and 0.4 mg/kg respectively.

Int. J. Environ. Res. Public Health 2021, 18, 2269 12 of 16
Table 7. Basic statistics of element concentrations in pollen (in mg/kg) in different countries.
Kosovo, 2019 (Present Work)n = 9
Turkey, 2017 [54]n = 24
Serbia, 2011 [53]n = 25
Jordan, 2017 [55]n =22
Mean Median Range STD Mean Range Mean Range
Al 33.2 31.7 8.96–57.7 16.2 - - 38.6 -As 0.01 0.01 ND-0.02 0.008 0.391 0.006–1.035 - <0.02Ba 4.66 4.72 3.47–6.25 1.12 - - 1.22 -Ca 1234 1194 1018–1753 215 862.435 491.85–1472.10 1425 -Cd 0.05 0.02 0.02–0.15 0.05 0.069 0.006–1.035 0.067 <0.005Co 0.13 0.12 0.06–0.23 0.05 - - 0.047 -Cr 0.28 0.28 0.28 - 0.793 0.124–1.595 0.26 -Cu 6.61 6.63 5.66–7.65 0.59 10.418 3.728–14.994 7.8 0.032–11.388Fe 59.0 59.4 22.0–94.3 22.5 203.165 30.719–725.36 70.1 -K 3891 4026 2902–4484 428 1945.87 992.107–2894.15 3391 -
Mg 577 578 393–762 120 669.7 271.1–1278.3 749 641.38–1575.18Mn 13.2 12.8 8.83–18.7 3.10 29.33 8.15–201.04 21.33 -Na 37.0 37.6 21.3–45.3 8.59 - - 21.6 -Ni 2.11 2.00 0.98–3.16 0.82 0.51 0.02–1.76 0.76 <0.01–2.839P 3633 3780 2503–4517 607 2659.7 795.9–5247 - -
Pb 0.43 0.20 0.14–1.69 0.53 0.193 ND-0.479 - 0.03–2.567Sr 3.09 3.27 1.99–4.50 0.97 - - 1.38 -Zn 26.0 26.5 16.6–31.7 4.53 29.15 14.83–39.08 23.7 25.24–77.022
A cluster analysis with Ward’s method revealed three distinct groups of elements inpollen (Figure 4). The first group was made up of K and P (not shown in the cluster), thesecond comprised Ca and Mg, and the largest group was constituted of Mn, Cu, Sr, Ni,Pb, Cr, Cd, As, Zn, Na, Al. The first and second groups were of natural origin. Groupthree included elements which are not used during in industrial process in the area ofinvestigation. However, Pb and particularly Zn are indicators of pollution because ofmining and ore processing activities, as are elements which are associated with their ores.An important pathway for the pollution of pollen with anthropogenic elements can beatmospheric deposition, since pollen is exposed to open air and elements can be transportedas fine dust onto flowers [32].
Int. J. Environ. Res. Public Health 2021, 18, x FOR PEER REVIEW 14 of 18
0 500 1000 1500 2000 2500
Linkage Distance
Ca
Mg
Mn
Cu
Sr
Ni
Pb
Cr
Cd
Zn
Na
Al
Figure 4. Hierarchical cluster dendrogram for elements in pollen.
3.4. Correlations between Three Types of Samples
According to the results shown in Figure 5, as expected, the highest values of all the
potentially toxic elements were found in soil (vertical axes in the first two rows of the
plots). Also, a higher concentration of a given metal in soil is not necessarily reflected in
pollen or honey. For example, although Cu concentrations in soil were lower than those
of Ni and Pb, in honey, they were higher. Also, if one element is found at higher concen-
trations in soil, it may be present at lower concentrations in honey. In Figure 5, the Pear-
son’s coefficients show that there was no correlation for As for soil–honey, Co for soil–
pollen, and Cd for soil–pollen. There were 11 weak correlations, six moderate, and only
two strong correlations. The strongest correlation was that for Pb between soil and honey,
with a value of 0.788, and for Ni in the pair honey–pollen, with a value of 0.728. Soil–
pollen and honey–pollen were the pairs with the greatest number of significant correla-
tions. Eight correlations were negative, despite the fact that in all cases, no correlation or
positive correlation was to be expected. The weak and negative correlations between con-
centrations of heavy metals in soil, honey and pollen can be attributed to the complexity
of honey and pollen collection by bees. The distribution of heavy metals in soil is quite
heterogeneous, and there is a large variety of plants which can absorb different elements
in different quantities through their root systems [56]. Honey, and particularly pollen, are
effected very much by dust. Bees forage in places such as dumps, when they can take
water or other materials which may be heavily polluted with heavy metals, leading to the
contamination of honey and pollen which is otherwise situated in a not heavily polluted
area.
Figure 4. Hierarchical cluster dendrogram for elements in pollen.
3.4. Correlations between Three Types of Samples
According to the results shown in Figure 5, as expected, the highest values of all thepotentially toxic elements were found in soil (vertical axes in the first two rows of the plots).

Int. J. Environ. Res. Public Health 2021, 18, 2269 13 of 16
Also, a higher concentration of a given metal in soil is not necessarily reflected in pollen orhoney. For example, although Cu concentrations in soil were lower than those of Ni and Pb,in honey, they were higher. Also, if one element is found at higher concentrations in soil,it may be present at lower concentrations in honey. In Figure 5, the Pearson’s coefficientsshow that there was no correlation for As for soil–honey, Co for soil–pollen, and Cd for soil–pollen. There were 11 weak correlations, six moderate, and only two strong correlations.The strongest correlation was that for Pb between soil and honey, with a value of 0.788,and for Ni in the pair honey–pollen, with a value of 0.728. Soil–pollen and honey–pollenwere the pairs with the greatest number of significant correlations. Eight correlations werenegative, despite the fact that in all cases, no correlation or positive correlation was to beexpected. The weak and negative correlations between concentrations of heavy metals insoil, honey and pollen can be attributed to the complexity of honey and pollen collectionby bees. The distribution of heavy metals in soil is quite heterogeneous, and there is a largevariety of plants which can absorb different elements in different quantities through theirroot systems [56]. Honey, and particularly pollen, are effected very much by dust. Beesforage in places such as dumps, when they can take water or other materials which maybe heavily polluted with heavy metals, leading to the contamination of honey and pollenwhich is otherwise situated in a not heavily polluted area.
Int. J. Environ. Res. Public Health 2021, 18, x FOR PEER REVIEW 15 of 18
Figure 5. Pearson’s correlation coefficients of selected element concentrations among three sample types: soil, honey, and
pollen.
4. Conclusions
An investigation into the concentrations of certain elements in soil, honey, and pollen
was conducted in the region of Mitrovica, Kosovo. Extremely high concentrations of Pb,
Zn, and Ni were found around the lead and zinc smelting sites in the towns of Mitrovica
and Zvecan. As and Cr were also present in very high concentrations at locations close to
an ore processing facility in Mitrovica. Pollution indices showed values indicating not
polluted areas, moderately polluted areas, and extremely polluted ones, particularly with
lead and zinc.
Cluster analyses revealed groups of elements related to sources of pollution, and also
those that are usually expected to be of geogenic origin. It can be said that the soil in the
region of Mitrovica, mostly around the industrial facilities, is highly polluted with poten-
tially toxic elements. In honey and pollen, lead concentrations were concerning, and zinc
was particularly abundant in pollen. The correlations between types of samples for each
selected potentially toxic element were mostly weak and moderate. There were, however,
important correlations indicating some pollution transfer from one environmental com-
partment to another. Also, since this is the first research on honey and pollen in the entire
region of Mitrovica, more research should be conducted in order to more thoroughly eval-
uate the contamination situation of these two natural products. The lead/zinc smelting
sites in Mitrovica have not been in operation since 2000; however, the ore concentration
process should be improved to reduce dust emissions. Clearly, a strong source of pollu-
tion are tailings dumps, as fine particles are transported from them toward the surround-
Figure 5. Pearson’s correlation coefficients of selected element concentrations among three sample types: soil, honey,and pollen.

Int. J. Environ. Res. Public Health 2021, 18, 2269 14 of 16
4. Conclusions
An investigation into the concentrations of certain elements in soil, honey, and pollenwas conducted in the region of Mitrovica, Kosovo. Extremely high concentrations of Pb,Zn, and Ni were found around the lead and zinc smelting sites in the towns of Mitrovicaand Zvecan. As and Cr were also present in very high concentrations at locations closeto an ore processing facility in Mitrovica. Pollution indices showed values indicating notpolluted areas, moderately polluted areas, and extremely polluted ones, particularly withlead and zinc.
Cluster analyses revealed groups of elements related to sources of pollution, and alsothose that are usually expected to be of geogenic origin. It can be said that the soil inthe region of Mitrovica, mostly around the industrial facilities, is highly polluted withpotentially toxic elements. In honey and pollen, lead concentrations were concerning,and zinc was particularly abundant in pollen. The correlations between types of samplesfor each selected potentially toxic element were mostly weak and moderate. There were,however, important correlations indicating some pollution transfer from one environmentalcompartment to another. Also, since this is the first research on honey and pollen in theentire region of Mitrovica, more research should be conducted in order to more thoroughlyevaluate the contamination situation of these two natural products. The lead/zinc smeltingsites in Mitrovica have not been in operation since 2000; however, the ore concentrationprocess should be improved to reduce dust emissions. Clearly, a strong source of pollutionare tailings dumps, as fine particles are transported from them toward the surroundingenvironment. To prevent the spread of pollution, such should be covered with unpollutedsoil or concrete. Another possibility is to transport the tailings into the cavities created inmore remote areas during gravel excavation, and then to cover them with soil.
Author Contributions: Conceptualization, M.P. and T.S.; methodology, M.P. and T.S.; software,M.K.M.; validation, M.P. and T.S.; formal analysis, T.S., G.K., M.P. and K.T.; investigation, G.K.;resources, M.P., T.S.; writing—original draft preparation, G.K. and F.S.; writing—review and editing,M.P., F.S., T.S. and M.K.M.; visualization, F.S. and M.K.M.; supervision, M.P., T.S.; project adminis-tration, M.P.; funding acquisition, G.K. and M.P. All authors have read and agreed to the publishedversion of the manuscript.
Funding: This research received no external funding.
Institutional Review Board Statement: Not applicable.
Informed Consent Statement: Not applicable.
Acknowledgments: We thank the Ministry of Agriculture Forestry and Rural Development ofRepublic of Kosovo, and Ekrem Gjokaj for their support in collecting samples and collaborationduring this project.
Conflicts of Interest: The authors declare no conflict of interest.
References1. Rico, D.; Martín-González, A.; Díaz, S.; De Lucas, M.P.; Gutiérrez, J.-C. Heavy metals generate reactive oxygen species in terrestrial
and aquatic ciliated protozoa. Comp. Biochem. Physiol. Part C Toxicol. Pharmacol. 2009, 149, 90–96. [CrossRef] [PubMed]2. Madoni, P.; Romeo, M.G. Acute toxicity of heavy metals towards freshwater ciliated protists. Environ. Pollut. 2006, 141, 1–7.
[CrossRef] [PubMed]3. Gallego, A.; Martín-González, A.; Ortega, R.; Gutiérrez, J.C. Flow cytometry assessment of cytotoxicity and reactive oxygen species
generation by single and binary mixtures of cadmium, zinc and copper on populations of the ciliated protozoan Tetrahymenathermophila. Chemosphere 2007, 68, 647–661. [CrossRef]
4. Singh, S.; Parihar, P.; Singh, R.; Singh, V.P.; Prasad, S.M. Heavy Metal Tolerance in Plants: Role of Transcriptomics, Proteomics,Metabolomics, and Ionomics. Front. Plant Sci. 2016, 6, 1143. [CrossRef]
5. Yadav, S.K. Heavy metals toxicity in plants: An overview on the role of glutathione and phytochelatins in heavy metal stresstolerance of plants. S. Afr. J. Bot. 2010, 76, 167–179. [CrossRef]
6. Assche, F.; Clijsters, H. Effects of metals on enzyme activity in plants. Plant Cell Environ. 1990, 13, 195–206. [CrossRef]7. Küpper, H.; Andresen, E. Mechanisms of metal toxicity in plants. Metallomics 2016, 8, 269–285. [CrossRef] [PubMed]

Int. J. Environ. Res. Public Health 2021, 18, 2269 15 of 16
8. Clemens, S. Toxic metal accumulation, responses to exposure and mechanisms of tolerance in plants. Biochimie 2006, 88, 1707–1719.[CrossRef]
9. Jan, A.T.; Azam, M.; Siddiqui, K.; Ali, A.; Choi, I.; Haq, Q.M.R. Heavy Metals and Human Health: Mechanistic Insight intoToxicity and Counter Defense System of Antioxidants. Int. J. Mol. Sci. 2015, 16, 29592–29630. [CrossRef]
10. Yi, Y.; Yang, Z.; Zhang, S. Ecological risk assessment of heavy metals in sediment and human health risk assessment of heavymetals in fishes in the middle and lower reaches of the Yangtze River basin. Environ. Pollut. 2011, 159, 2575–2585. [CrossRef]
11. Mishra, K.P.; Singh, V.K.; Rani, R.; Yadav, V.S.; Chandran, V.; Srivastava, S.P.; Seth, P.K. Effect of lead exposure on the immuneresponse of some occupationally exposed individuals. Toxicology 2003, 188, 251–259. [CrossRef]
12. Abdul, K.S.M.; Jayasinghe, S.S.; Chandana, E.P.; Jayasumana, C.; De Silva, P.M.C. Arsenic and human health effects: A review.Environ. Toxicol. Pharmacol. 2015, 40, 828–846. [CrossRef]
13. Motuzova, G.; Minkina, T.; Karpova, E.; Barsova, N.; Mandzhieva, S. Soil contamination with heavy metals as a potential and realrisk to the environment. J. Geochem. Explor. 2014, 144, 241–246. [CrossRef]
14. Šajn, R.; Aliu, M.; Stafilov, T.; Alijagic, J. Heavy metal contamination of topsoil around a lead and zinc smelter in KosovskaMitrovica/Mitrovicë, Kosovo/Kosovë. J. Geochem. Explor. 2013, 134, 1–16. [CrossRef]
15. Stafilov, T.; Šajn, R.; Pancevski, Z.; Boev, B.; Frontasyeva, M.V.; Strelkova, L.P. Heavy metal contamination of topsoils around alead and zinc smelter in the Republic of Macedonia. J. Hazard. Mater. 2010, 175, 896–914. [CrossRef]
16. Kerolli–Mustafa, M.; Fajkovic, H.; Roncevic, S.; Curkovic, L. Assessment of metal risks from different depths of jarosite tailingwaste of Trepça Zinc Industry, Kosovo based on BCR procedure. J. Geochem. Explor. 2015, 148, 161–168. [CrossRef]
17. Wu, Q.; Leung, J.Y.; Geng, X.; Chen, S.; Huang, X.; Li, H.; Huang, Z.; Zhu, L.; Chen, J.; Lu, Y. Heavy metal contamination ofsoil and water in the vicinity of an abandoned e-waste recycling site: Implications for dissemination of heavy metals. Sci. Total.Environ. 2015, 506–507, 217–225. [CrossRef]
18. Ahmad, J.U.; Goni, A. Heavy metal contamination in water, soil, and vegetables of the industrial areas in Dhaka, Bangladesh.Environ. Monit. Assess. 2010, 166, 347–357. [CrossRef]
19. Ferati, F.; Kerolli-Mustafa, M.; Kraja-Ylli, A. Assessment of heavy metal contamination in water and sediments of Trepça andSitnica rivers, Kosovo, using pollution indicators and multivariate cluster analysis. Environ. Monit. Assess. 2015, 187, 1–15.[CrossRef]
20. Dziubanek, G.; Piekut, A.; Rusin, M.; Baranowska, R.; Hajok, I. Contamination of food crops grown on soils with elevated heavymetals content. Ecotoxicol. Environ. Saf. 2015, 118, 183–189. [CrossRef]
21. Ali, M.H.; Al-Qahtani, K.M. Assessment of some heavy metals in vegetables, cereals and fruits in Saudi Arabian markets.Egypt. J. Aquat. Res. 2012, 38, 31–37. [CrossRef]
22. Cuadrado, C.; Kumpulainen, J.; Carbajal, A.; Moreiras, O. Cereals Contribution to the Total Dietary Intake of Heavy Metals inMadrid, Spain. J. Food Compos. Anal. 2000, 13, 495–503. [CrossRef]
23. Sawidis, T.; Marnasidis, A.; Zachariadis, G.; Stratis, J. A study of air pollution with heavy metals in Thessaloniki city (Greece)using trees as biological indicators. Arch. Environ. Contam. Toxicol. 1995, 28, 118–124. [CrossRef]
24. Onder, S.; Dursun, S. Air borne heavy metal pollution of Cedrus libani (A. Rich.) in the city centre of Konya (Turkey). AtmosphericEnviron. 2006, 40, 1122–1133. [CrossRef]
25. Allajbeu, S.; Qarri, F.; Marku, E.; Bekteshi, L.; Ibro, V.; Frontasyeva, M.V.; Stafilov, T.; Lazo, P. Contamination scale of atmosphericdeposition for assessing air quality in Albania evaluated from most toxic heavy metal and moss biomonitoring. Air Qual. Atmos.Health 2016, 10, 587–599. [CrossRef]
26. Spiteri, C.; Kalinski, V.; Rösler, W.; Hoffmann, V.; Appel, E.; Team, M. Magnetic screening of a pollution hotspot in the Lausitzarea, Eastern Germany: Correlation analysis between magnetic proxies and heavy metal contamination in soils. Environ. EarthSci. 2005, 49, 1. [CrossRef]
27. Duong, T.T.; Lee, B.-K. Determining contamination level of heavy metals in road dust from busy traffic areas with differentcharacteristics. J. Environ. Manag. 2011, 92, 554–562. [CrossRef]
28. Li, F.-R.; Kang, L.-F.; Gao, X.-Q.; Hua, W.; Yang, F.-W.; Hei, W.-L. Traffic-Related Heavy Metal Accumulation in Soils and Plants inNorthwest China. Soil Sediment Contam. Int. J. 2007, 16, 473–484. [CrossRef]
29. Yue, Y.; Liu, Z.; Liu, Z.; Zhang, J.; Lu, M.; Zhou, J.; Qian, G. Rapid evaluation of leaching potential of heavy metals from municipalsolid waste incineration fly ash. J. Environ. Manag. 2019, 238, 144–152. [CrossRef] [PubMed]
30. Pacarizi, M.A.; Berisha, A.; Halili, J. Electrochemical assessment of the presence of some heavy metals in honey samples in theindustrial region of mitrovica (Kosovo). J. Environ. Prot. Ecol. 2019, 20, 170–176.
31. Jones, K.C. Honey as an indicator of heavy metal contamination. Water Air Soil Pollut. 1987, 33, 179–189. [CrossRef]32. Kalbande, D.M.; Dhadse, S.N.; Chaudhari, P.R.; Wate, S.R. Biomonitoring of heavy metals by pollen in urban environment.
Environ. Monit. Assess. 2007, 138, 233–238. [CrossRef]33. Baltas, H.; Sirin, M.; Gökbayrak, E.; Ozcelik, A.E. A case study on pollution and a human health risk assessment of heavy metals
in agricultural soils around Sinop province, Turkey. Chemosphere 2020, 241, 125015. [CrossRef]34. Bogdanov, S.; Haldimann, M.; Luginbühl, W.; Gallmann, P. Minerals in honey: Environmental, geographical and botanical aspects.
J. Apic. Res. 2007, 46, 269–275. [CrossRef]35. Bilandžic, N.; Gacic, M.; Ðokic, M.; Sedak, M.; Šipušic, Ð.I.; Koncurat, A.; Gajger, I.T. Major and trace elements levels in multifloral
and unifloral honeys in Croatia. J. Food Compos. Anal. 2014, 33, 132–138. [CrossRef]

Int. J. Environ. Res. Public Health 2021, 18, 2269 16 of 16
36. Roman, A. Content of some trace elements in fresh honeybee pollen. Polish J. Food Nutr. Sci. 2007, 57, 475–478.37. Organization for Security and Co-operation in Europe OSCE Mission in Kosovo. Background Report Lead Contamination in
Mitrovicë/Mitrovica Affecting the Roma Community February 2009; OSCE: Mitrovicë/Mitrovica, Kosovo, 2009; pp. 1–9.38. Özkan, E.Y. A new assessment of heavy metal contaminations in an eutrophicated bay (Inner Izmir Bay, Turkey). Turkish J. Fish.
Aquat. Sci. 2012, 12, 135–147. [CrossRef]39. Abrahim, G.M.S.; Parker, R.J. Assessment of heavy metal enrichment factors and the degree of contamination in marine sediments
from Tamaki Estuary, Auckland, New Zealand. Environ. Monit. Assess. 2007, 136, 227–238. [CrossRef]40. Tomlinson, D.L.; Wilson, J.G.; Harris, C.R.; Jeffrey, D.W. Problems in the assessment of heavy-metal levels in estuaries and the
formation of a pollution index. Helgol. Mar. Res. 1980, 33, 566–575. [CrossRef]41. Müller, G. Index of geo-accumulation in sediments of the Rhine River. Geol. J. 1969, 3, 108–118.42. Salminen, R.; Tarvainen, T.; Demetriades, A.; Duris, M.; Fordyce, F.M.; Gregorauskiene, V.; Kahelin, H.; Kivisilla, J.; Klaver, G.;
Klein, H.; et al. FOREGS Geochemical Mapping Field Manual; Geological Survey of Finland (GTK): Espoo, Finland, 1998; Volume 22,ISBN 9516906931.
43. Hakanson, L. An ecological risk index for aquatic pollution control.a sedimentological approach. Water Res. 1980, 14, 975–1001.[CrossRef]
44. Shallari, S.; Schwartz, C.; Hasko, A.; Morel, J. Heavy metals in soils and plants of serpentine and industrial sites of Albania.Sci. Total. Environ. 1998, 209, 133–142. [CrossRef]
45. Spahic, M.P.; Sakan, S.; Cvetkovic, Ž.; Tancic, P.; Trifkovic, J.; Nikic, Z.; Manojlovic, D. Assessment of contamination, environmentalrisk, and origin of heavy metals in soils surrounding industrial facilities in Vojvodina, Serbia. Environ. Monit. Assess. 2018, 190,208. [CrossRef] [PubMed]
46. Stafilov, T.; Šajn, R. Spatial distribution and pollution assessment of heavy metals in soil from the Republic of North Macedonia.J. Environ. Sci. Health Part A 2019, 54, 1457–1474. [CrossRef]
47. Republic of Kosovo. Udhëzim Administrativ Qrk Nr.11/2018 për Vlerat Kufitare të Emisioneve të Materieve Ndotëse të Tokë, Republikae Kosovës (Administrative Instruction of GRK No. 11/2018 on Limited Values of Emissions of Polluted Materials into Soil); Qeveria eRepublikës së Kosovës: Prishtina, Kosovo, 2018.
48. Stafilov, T.; Aliu, M.; Sajn, R. Arsenic in Surface Soils Affected by Mining and Metallurgical Processing in K. Mitrovica Region,Kosovo. Int. J. Environ. Res. Public Health 2010, 7, 4050–4061. [CrossRef]
49. Stankovska, E.; Stafilov, T.; Šajn, R. Monitoring of trace elements in honey from the Republic of Macedonia by atomic absorptionspectrometry. Environ. Monit. Assess. 2007, 142, 117–126. [CrossRef]
50. Vukašinovic-Pešic, V.; Blagojevic, N.; Brašanac-Vukanovic, S.; Savic, A.; Pešic, V. Using Chemometric Analyses for Tracing theRegional Origin of Multifloral Honeys of Montenegro. Foods 2020, 9, 210. [CrossRef] [PubMed]
51. Spiric, D.; Ciric, J.; Ðordevic, V.; Nikolic, D.; Jankovic, S.; Nikolic, A.; Petrovic, Z.; Katanic, N.; Teodorovic, V. Toxic and essentialelement concentrations in different honey types. Int. J. Environ. Anal. Chem. 2019, 99, 474–485. [CrossRef]
52. Garcés, S.B. Ideas previas y cambio conceptual. Educ. Química 2018, 15, 210. [CrossRef]53. Kostic, A.Ž.; Pešic, M.B.; Mosic, M.D.; Dojcinovic, B.P.; Natic, M.M.; Trifkovic, J.Ð. Mineral content of bee pollen from Ser-
bia/Sadržaj minerala u uzorcima pcelinjega peluda iz Srbije. Arch. Ind. Hyg. Toxicol. 2015, 66, 251–258. [CrossRef] [PubMed]54. Altunatmaz, S.S.; Tarhan, D.; Aksu, F.; Barutçu, U.B.; Or, M.E. Mineral element and heavy metal (cadmium, lead and arsenic)
levels of bee pollen in Turkey. Food Sci. Technol. 2017, 37, 136–141. [CrossRef]55. Aldgini, H.M.; Al-Abbadi, A.A.; Abu-Nameh, E.S.; Alghazeer, R.O. Determination of metals as bio indicators in some selected
bee pollen samples from Jordan. Saudi J. Biol. Sci. 2019, 26, 1418–1422. [CrossRef] [PubMed]56. Intawongse, M.; Dean, J.R. Uptake of heavy metals by vegetable plants grown on contaminated soil and their bioavailability in
the human gastrointestinal tract. Food Addit. Contam. 2006, 23, 36–48. [CrossRef] [PubMed]