investigation of cancer concerns in frederick, maryland
TRANSCRIPT

1
Maryland Department of Health and Mental HygieneFrederick County Health Department
INVESTIGATION OF CANCER CONCERNS INFREDERICK, MARYLAND
SUMMARY REPORT
OCTOBER 3, 2011
Maryland DHMH/Frederick County Health Department October 3, 2011Summary Report: Frederick County Cancer Investigation
2
Table of Contents
EXECUTIVE SUMMARY ............................................................................................................ 3BACKGROUND ............................................................................................................................ 5COMMUNITY DESCRIPTION .................................................................................................... 6
Definition of Frederick and Population of Interest ..................................................................... 6Community Health Concerns...................................................................................................... 6Air Quality ................................................................................................................................ 13Drinking Water Supply............................................................................................................. 14Potentially Significant Industrial and Waste Sites.................................................................... 14Groundwater Monitoring Data from Fort Detrick .................................................................... 14
HEALTH DATA .......................................................................................................................... 17Background to the Investigation of Cancer .............................................................................. 17Phase 1 Investigation: Initial Analysis of Cancer Incidence in 3 Census Tracts around FortDetrick....................................................................................................................................... 20Phase II Investigation: Expansion of Area and Period of Interest ........................................... 25Analysis of Geographic and Temporal Clustering.................................................................... 29Age at Diagnosis ....................................................................................................................... 32Citizen List Evaluation ............................................................................................................. 34
CONCLUSIONS........................................................................................................................... 36NEXT STEPS ............................................................................................................................... 39Appendix A: MCR GIS Methods/Processes for Geocoding...................................................... A-1Appendix B: Description of Standardized Incidence Ratio Calculations .................................. A-2

Maryland DHMH/Frederick County Health Department October 3, 2011Summary Report: Frederick County Cancer Investigation
3
EXECUTIVE SUMMARYThis report summarizes the investigation of cancer in Frederick County using data from theMaryland Cancer Registry for cancer diagnosed from 1992 – 2008. The investigation wasprompted by community concerns about cancer incidence in Frederick County, particularly inthe area around Fort Detrick. The analysis consisted of:
An evaluation of cancer incidence for cancers diagnosed from 2000 – 2007 in the threecensus tracts that comprise approximately a one-mile buffer around the perimeter of theFort Detrick installation;
An expanded evaluation in the same three census tracts for cancers diagnosed from 1992– 2008;
An evaluation of cancer incidence for cancers diagnosed from 1992 – 2008 in the 10census tracts that comprise approximately a two-mile buffer around the perimeter of theFort Detrick installation;
A statistical analysis of how and whether cancers were clustered by geography, time, andtype of cancer for all of Frederick County for the period 1992 – 2008; and,
An analysis of the age of diagnosis for different cancers in the areas closest to FortDetrick, compared with the age of diagnosis for the same cancers in Frederick Countyand Maryland.
Overall, this investigation did not find a consistent pattern of cancer diagnoses that wouldsuggest clustering. Specifically, the investigation showed the following:
There were no statistically significant increases in all cancer or in specific types of cancerin the three census tracts that constitute an area of 1-mile radius around Fort Detrick forthe period 1992 – 2008, with the exception of lymphoma. Lymphoma was slightlyincreased compared with Maryland as a whole, but not with Frederick County. Thismeans that the rate of lymphomas in the area immediately around Fort Detrick was notsignificantly different than the rate of lymphomas in the County overall. However, it wasslightly increased compared with the State rate of lymphomas.
When an additional seven census tracts were added to the original three, expanding thebuffered area around Fort Detrick to approximately a 2-mile radius, there were nosignificant increases in either all cancers or in specific types of cancer around Ft. Detrickfor the period 1992—2008, compared with Frederick County or the State as a whole.
The increase in cancer rates for all cancers noted between 2001 and 2006 is unlikely to berelated to environmental exposures in the Fort Detrick area. If cancer occurrences wereaffected by environmental exposures from decades ago, the effect would be less likely toshow up in a narrow range of time than to be spread out over many years. Analysis of thecancer rates for the three census tracts closest to Fort Detrick for the period 2000-2007did not show significant increases in the cancers of greatest concern, compared witheither Frederick County or the State. Other potential explanations for the increase shouldbe investigated, such as changes in reporting patterns, before the increase is assumed tobe related to environmental exposures.

Maryland DHMH/Frederick County Health Department October 3, 2011Summary Report: Frederick County Cancer Investigation
4
Analysis of potential space-time “clustering” using the SaTScan program showed nosignificant clusters, when comparing specific cancer diagnosis groups with all cancer inthe ten census tracts and Frederick County for the period 1992 – 2008.
There was no significant difference in the ages at diagnosis for cancers in specificdiagnostic groups in people living close to Fort Detrick (within the 10 census tractsimmediately surrounding the installation) compared with people in Frederick as a whole.
Examination of the reports by the citizens in the community showed that while there wassome correspondence between those on the citizen list and those registered with theMaryland Cancer Registry, the disparity between the two data sources was sufficientlyhigh that the cases reported by citizens could not be used directly as a case finding sourcewithout an amount of effort and resources that were not available.
Based on these findings, the report offers several next steps:
1. The Frederick County Health Department and the Maryland Cancer Registry will continue toreview cancer incidence in Frederick County as a whole as new data become available. Inlight of questions related to the observed increase in cancer rates between Frederick Countyand Maryland between 2001 and 2006, it will be helpful to look in more detail at whichcancers contributed to the observed increase and potential explanations. While the increaseis unlikely to be related to environmental exposures in the Fort Detrick area, it will be usefulto the public, the County, and the State to examine possible explanations for the increase.
2. The Department of Health and Mental Hygiene and the Frederick County Health Departmentwill specifically look in more detail at lymphoma rates for the areas in question and forFrederick County as a whole, including different types of lymphoma, and ages of onset ofdifferent types of lymphoma.
3. If new information about environmental exposures, environmental risks, or other factorsbecomes available, the Department of Health and Mental Hygiene and Frederick CountyHealth Department will review that new information in light of this and future evaluations ofcancer in Frederick County.
4. Frederick County Health Department and the Department of Health and Mental Hygiene willreport back to the community on the above efforts, and use those opportunities for publiceducation and information around issues of cancer, cancer prevention, and cancer detection.

Maryland DHMH/Frederick County Health Department October 3, 2011Summary Report: Frederick County Cancer Investigation
5
BACKGROUND
In 2010, the Maryland Department of Health and Mental Hygiene (DHMH) and FrederickCounty Health Department (FCHD) began a formal investigation into community concerns overcancer in Frederick City and Frederick County, Maryland. The investigation was prompted inresponse to:
Concerns raised by individuals in the community about the number of persons withcancer in the community;
Similar concerns raised by a private foundation (the Kristen Renee Foundation, KRF)that was created in memory of a family member who had died of cancer;
Concerns raised in the community regarding the potential for chemical exposuresassociated with activities at Fort Detrick; and
A recent trend upward in the annual incidence rate relative to the Maryland and U.S. rates(the rate has now returned to below the Maryland and U.S. incidence rates).0F0 F
1,1F1F
2
A history of general community concerns regarding cancer incidence in Frederick County
The Secretary of Health and Mental Hygiene has broad authority to investigate the causes ofdisease in Maryland. The Secretary shall investigate causes of diseases and mortality (Md. CodeAnn., Health-General § 18-101); may adopt procedures to obtain information about diseases thatare caused by toxic substances and about the incidence of these diseases (Md. Code Ann.,Health-General § 18-101, § 18-105); shall investigate, if feasible, means to prevent, treat, andcure cancer; and may adopt procedures to obtain information about cancers that are caused bycarcinogens and about the incidence of these cancers (Md. Code Ann., Health-General § 18-104).
The Department of Health and Mental Hygiene (DHMH) has established a formal process torespond to questions and concerns regarding cancer, which involves collaboration between theCenter for Environmental Health Coordination, the Maryland Cancer Registry, and the localhealth department. There is also collaboration with the Maryland Department of theEnvironment when there are questions about potential environmental contributions to cancer orpotential exposures.
Early in the investigation, meetings were held with various stakeholders, including the KristenRenee Foundation, Fort Detrick, and the community, to learn about the concerns and questionsand gather background information. These meetings generally involved both the local healthdepartment (Dr. Barbara Brookmyer, Health Officer, FCHD) and the DHMH Center forEnvironmental Health Coordination (Dr. Clifford Mitchell, Assistant Director for EnvironmentalHealth and Food Protection).
1 http://fhadevlmt/pdf/cancer/CRF_Cancer_Report_2010.pdf2 http://fhadevlmt/pdf/cancer/Incidence&MortalitySelectedTables2002-2007.pdf

Maryland DHMH/Frederick County Health Department October 3, 2011Summary Report: Frederick County Cancer Investigation
6
COMMUNITY DESCRIPTION
Definition of Frederick and Population of Interest
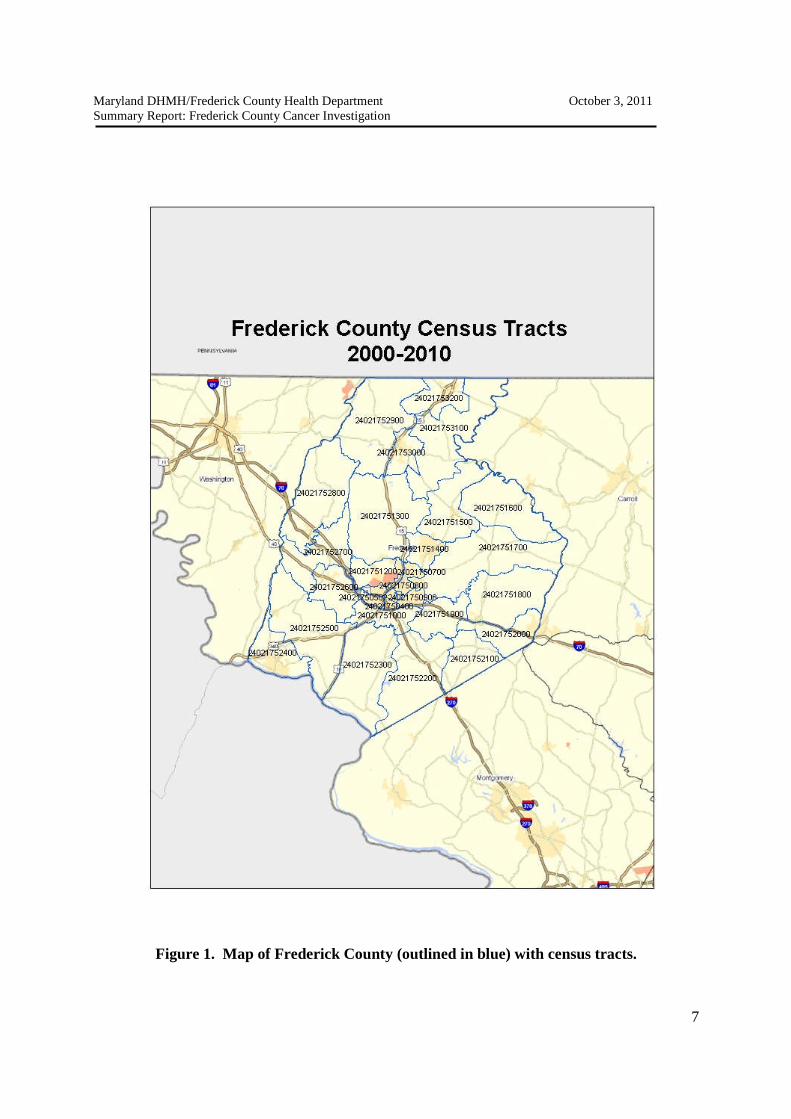
Frederick County is Maryland’s largest county geographically, with an area of 664 square miles(Figure 1). The county was primarily agricultural through the mid-twentieth century, but duringand after World War II, there was a rapid expansion of the industrial and manufacturing base ofthe county. According to the recently released 2010 decennial census, Frederick County has anofficial population of 233,385, an increase of 19.5% from the 2000 population of 195,277.Frederick City’s population in 2010 had grown to 65,239 (28.0% of the county population).Table 1 shows the approximate breakdown of the populations by various demographiccharacteristics.
Frederick County still has both agriculture and light manufacturing, and more recentlybiotechnology, but is now also a residential exurb for Washington, DC. One of the largestemployers in the county is now the Fort Detrick complex (including all of the facilities locatedwithin the boundaries of Fort Detrick), which was established and expanded rapidly in the yearsfollowing the Second World War.
Community Health Concerns
Concerns in Frederick County regarding health and the environment are not new. There havebeen concerns raised in public forums for many years regarding the Fort Detrick facility. TheAgency for Toxic Substances and Disease Registry (ATSDR) report used a 40 year exposureassumption (approximately 1955 -1992) for its assessment (ATSDR, p. 1). 2F2 F
3 At public meetingsin 2009—2011, the community has raised concerns about health impacts ranging from cancer toauto-immune conditions. The main focus of concern, however, has been on cancer.
The 2007 Frederick County community health assessment described some of the major healthconcerns for the county. The major causes of death in the county are heart disease, followed bycancer, each of which accounts for a bit more than a quarter of all deaths in the population,similar to Maryland and the U.S. (Table 2).
3 Agency for Toxic Substances and Disease Registry. “Public Health Assessment: Evaluation of Drinking WaterWell Exposure via Confirmed Off-Site Contamination, Fort Detrick Area B Groundwater, Frederick, Maryland,EPA Facility ID: MDD985397249.” Atlanta (GA): U.S. Department of Health and Human Services, Agency forToxic Substances and Disease Registry: December 9, 2009.
Maryland DHMH/Frederick County Health Department October 3, 2011Summary Report: Frederick County Cancer Investigation
7
Figure 1. Map of Frederick County (outlined in blue) with census tracts.

Maryland DHMH/Frederick County Health Department October 3, 2011Summary Report: Frederick County Cancer Investigation
8
Table 1. Demographic characteristics of Frederick City, Frederick County, and Maryland State, based onthe 2009 American Community Survey.
Characteristic Frederick City FrederickCounty*
Maryland
Population 58,939 224,185 2,313,193
Sex Male 49.2% 49.4% 48.4%
Female 50.8% 50.6% 51.6%
Age distribution Under 5 years 8.0% 7.0% 6.7%
5 to 9 years 7.0% 7.0% 6.4%
10 to 14 years 5.6% 7.6% 6.8%
15 to 19 years 6.9% 7.4% 7.2%
20 to 24 years 7.4% 5.9% 6.6%
25 to 34 years 17.1% 11.5% 13.1%
35 to 44 years 15.5% 16.7% 15.0%
45 to 54 years 12.9% 16.1% 15.4%
55 to 59 years 4.8% 6.0% 6.2%
60 to 64 years 4.3% 4.7% 4.9%
65 to 74 years 5.1% 5.4% 6.2%
75 to 84 years 3.6% 3.2% 3.9%
85 years and over 1.8% 1.5% 1.5%
RacialCharacteristics
People declaringone race
97.7% 97.9% 98.0%
White 69.4% 83.4% 74.5%
Black or African-American
17.8% 8.1% 12.4%
Asian 6.3% 3.5% 4.9%
All other 6.5% 5% 8.2%
Hispanic or Latino(any race)
8.8% 5.6% 6.6%
MedianHouseholdIncome
$64,833 $80,970 $69,475
Families belowpoverty level
5.3% 3.3% 5.5%
* Including Frederick City
Source: U.S. Census, American Community Survey 2005-2009, accessed 4/11/2011 at:http://factfinder.census.gov/home/saff/.

Maryland DHMH/Frederick County Health Department October 3, 2011Summary Report: Frederick County Cancer Investigation
9
Table 2. Age-Adjusted Death Rates for Selected Causes (2002-2004 Annual Average Deaths per 100,000 Population)
Frederick County Maryland United States Healthy People2010
Diseases of the Heart 235.2 227.7 233.1 213.7*Malignant Neoplasms (Cancers) 191.9 194.6 191.1 159.9Cerebrovascular Disease (Stroke) 59.6 53.5 53.2 48.0Chronic Lower Respiratory Diseases 43.3 38.1 42.6Alzheimer’s Disease 27.4 17.4 21.1Unintentional Injuries (Accidents) 25.7 25.8 37.2 17.5Diabetes Mellitus 19.7 28.0 25.1 15.1Influenza/Pneumonia 17.2 22.1 21.5Motor Vehicle Accidents 12.0 12.8 15.4 9.2Intentional Self-Harm (Suicide) 10.8* 8.8 10.9 5.0Liver Disease/Cirrhosis 6.2* 7.8 9.3 3.0Homicide/Legal Intervention 2.3* 10.2 6.1 3.0HIV 1.7* 10.5 4.7 0.7Source: (Source: Frederick County Health Assessment, 2007). Accessed 9/18/2011 at:https://www.co.frederick.md.us/documents/Health%20Department/Health%20Care%20Coalition/Needs%20Assessment/Community%20Health%20Assessment%20Report%20-%20Frederick%20County%202007.pdf, page 40.Notes: Rates are per 100,000 population, age-adjusted to the 2000 U.S. Standard Population and coded using ICD-10 codes.The Healthy People 2010 Heart Disease target is adjusted to account for all diseases of the heart;the Healthy People 2010 target for Diabetes is adjusted to account for only diabetes mellitus coded deaths.Rates with a * denote statistically unreliable numbers.

Maryland DHMH/Frederick County Health Department October 3, 2011Summary Report: Frederick County Cancer Investigation
10
As a result of meetings held with the community that led to this investigation, residents raised anumber of issues concerning health and the environment. Most of these concerns related tocancer in the area surrounding Fort Detrick that houses several institutions, primarily the FortDetrick Garrison, the U.S. Army Medical Research Institute for Infectious Disease(USAMRIID), the United States Department of Agriculture, and the National Cancer Institute-Frederick (NCI-Frederick) research facility.
The specific concerns raised by community members and interest groups pertained to thepossible association between cancers observed in the community and exposures to some agent oragents that were part of historic operations at Fort Detrick. Some of the principal concernsincluded:
Organic compounds potentially released to groundwater from wastes disposedin Area B, an area adjacent to the main Fort Detrick facilities; and
Herbicides, including Agent Orange, tested at Fort Detrick (including in AreaB) in the 1950-1970 period.
Concerns about cancer in Frederick County have been raised for several years. These concernshave increased in part because in some recent reports the annual incidence rates for cancer inFrederick County have been higher than the overall State rate (Figure 3), particularly for theperiod 2001 – 2006. However, that trend line was returning to the baseline rate similar to theMaryland and the U.S rates by 2007 (Figure 4). The MCR has been looking at cancers thataccounted for the increase during this period, and at possible explanations for the increase.While some community concerns about cancer were related to environmental factors, some weremore generally related to issues of cancer rates without attribution to specific exposures.
Most of the health concerns related to cancers of different types occurring in the areasurrounding Fort Detrick. No one cancer type predominated in discussions with the community,although some cancers (e.g., leukemia, prostate, and breast cancer) were repeatedly mentionedduring public discussions.
There was also an effort by one organization, the Kristen Renee Foundation (named after aformer Frederick County resident who died of cancer), to survey the community about cancerconcerns. The survey results were described and/or presented during several communitymeetings (but are not used directly in this current report). The results did help DHMH andFCHD to identify community questions regarding possible relationships between environmentalexposures and cancer in Frederick. For example, a number of individuals reported concernsabout thyroid cancer and potential environmental exposures. Although thyroid cancer was notoriginally one of the cancers investigated by DHMH, it was added after the Kristen ReneeFoundation’s presentation of those survey results.

Maryland DHMH/Frederick County Health Department October 3, 2011Summary Report: Frederick County Cancer Investigation
11
Figure 2. Age-adjusted rates for all cancer incidence, by county, 2003-2007. Source: Maryland Cigarette Restitution FundProgram. Cancer Report 2009, p. 19. http://fhadevlmt/pdf/cancer/CRF_Cancer_Report_2010.pdf

Maryland DHMH/Frederick County Health Department October 3, 2011Summary Report: Frederick County Cancer Investigation
12
Figure 3. Incidence rates of all cancer in Frederick County, in Maryland and in the United states, 1997 --2008
0.0
100.0
200.0
300.0
400.0
500.0
600.0
700.0
1997 1998 1999 2000 2001 2002 2003 2004 2005 2006 2007 2008
Inci
de
nce
Ra
tep
er
10
0,0
00
Diagnosis Year
Incidence Rates for All Cancers 1997--2008:Frederick County, Maryland, and U.S.*
Frederick
MD
US
*Incidence rates age adjusted and standardized to the 2000 U.S. Standard PopulationSource: Maryland Cancer Registry, September, 2011

Maryland DHMH/Frederick County Health Department October 3, 2011Summary Report: Frederick County Cancer Investigation
13
ENVIRONMENTAL DATA
The assessment of potentially hazardous environmental factors in Frederick County wasconducted with input from the Maryland Department of the Environment (MDE) and the FCHD,as well as the environmental health unit of Fort Detrick. The goal was to conduct an inventoryof potential environmental hazards, based on available data sources. These included:
Air quality data Water quality data Hazardous waste sites Point sources History of land use
As part of the assessment of environmental issues, DHMH reviewed data supplied by the FortDetrick environmental health unit. This included a large number of reports prepared bycontractors for the U.S. Army Environmental Command that looked at groundwater issues on, orpotentially originating from, the base.
Air Quality
Air quality in Frederick County is monitored by MDE at one fixed monitoring station, located atthe Frederick Municipal Airport that began monitoring in 1998. This station only monitors forozone and contributes to the regional picture of air pollution used by EPA and MDE. The stationis not particularly helpful in pinpointing any local sources of air pollution, since ozone is notemitted directly into the atmosphere from any source, but is secondarily produced through thechemical reaction of nitrogen oxides, volatile organic compounds and sunlight.
Based on data from this monitoring station, air quality with respect to ozone in the region hasimproved considerably over the past decade, with the design value declining from 92 parts perbillion (ppb) in 2000 to 75 ppb in 2010. The design value is a measure of air quality used todetermine compliance with the National Ambient Air Quality Standards (NAAQS). The currentNAAQS for ozone is 85 ppb. It should be noted that this measure of air quality does not includeany other pollutants for which NAAQS have been established (carbon monoxide, sulfur dioxide,nitrogen dioxide, particulate matter less than 2.5 microns in diameter (PM-2.5) and lead) or anyhazardous air pollutants (HAPs), which consist of many volatile and semi-volatile organicchemicals and other organic chemicals, some of which have been implicated as potential orlikely carcinogens. Some emissions data for HAPs are available from the toxic release inventory(TRI)3 F3F
4, discussed below.
It is also important to recognize that while the objective of Frederick area air monitoring stationis population exposure, the data are not as useful in distinguishing possible differences in
4 http://www.epa.gov/tri/

Maryland DHMH/Frederick County Health Department October 3, 2011Summary Report: Frederick County Cancer Investigation
14
exposure within the region. In order to look at differences in air pollution levels in differentgeographic areas within Frederick County, one would generally need to estimate differences bydeveloping computer models of air quality.
Drinking Water Supply
Most residences surrounding Fort Detrick are now served by the public water supply. Most ofthe water (88%) for Frederick City and County comes from surface water sources, primarily thePotomac River. According to the most recent consumer confidence report for the public watersupply, the system meets all federal and state standards for drinking water quality. 4F4 F
5
Potentially Significant Industrial and Waste Sites
Historically, Frederick County included both agriculture and industrial activity. A map ofcurrent and recent industries supplying data to the U.S. EPA’s TRI shows that, in addition to FortDetrick, there are a number of industries producing hazardous chemicals, including metals(primarily aluminum and steel), cement and building materials, and paints (Figure 4). TRI dataare available for these facilities, but because TRI data are not exposure measurements and havelittle relationship to individual risk, the TRI data were not used in the assessment of personalexposures in this investigation.
Groundwater Monitoring Data from Fort Detrick
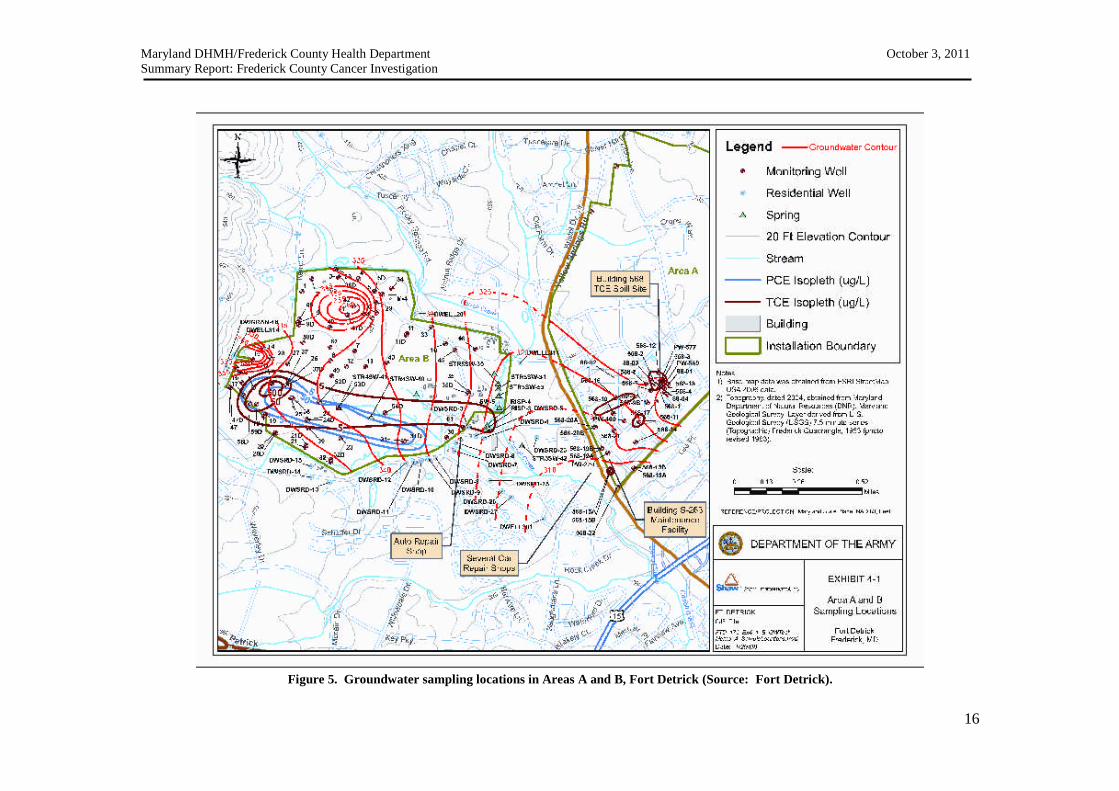
Area B of the Fort Detrick site was used for disposal of chemical, biological, and radiologicalmaterial from the 1940s through approximately 1970. Area B had been used in the past to storeexplosives and to test materials and currently includes a landfill for municipal waste. The U.S.EPA placed Fort Detrick Area B Ground Water on the National Priorities List (NPL) in April,2009 because of groundwater contaminated with the organic solvents trichloroethene (TCE) andtetrachloroethene (PCE). Extensive groundwater monitoring has been performed to evaluate thefate and transport of contaminants in groundwater at Area B (Figure 5). There is currentlyadditional site evaluation underway, but the results were not available at the time this report wasprepared.
5 Source: Frederick County Division of Utilities & Solid Waste Management, Annual Water Quality Report, 2010

Maryland DHMH/Frederick County Health Department October 3, 2011Summary Report: Frederick County Cancer Investigation
15
Figure 4. Frederick County entities reporting to the Toxic Release Inventory as of 2000 (accessed onTRIExplorer, http://iaspub.epa.gov/triexplorer/tri_release.chemical, 6/26/2011).
Maryland DHMH/Frederick County Health Department October 3, 2011Summary Report: Frederick County Cancer Investigation
16
Figure 5. Groundwater sampling locations in Areas A and B, Fort Detrick (Source: Fort Detrick).

Maryland DHMH/Frederick County Health Department October 3, 2011Summary Report: Frederick County Cancer Investigation
17
HEALTH DATA
Background to the Investigation of Cancer
The initial phase of the investigation was to review any relevant historical studies and basic datafrom the Maryland Cancer Registry (MCR). MCR receives reports of tumors from hospitals,laboratories, radiation facilities, ambulatory surgical centers, and physicians licensed inMaryland. For Maryland residents diagnosed outside of Maryland, the MCR has 13 interstatenotification agreements, including one with the District of Columbia, and receives data fromthese jurisdictions twice yearly.
Data Sources and Selection of Cases and Comparison Data
Sources of data used in the investigation included: (1) cancers diagnosed in Maryland residentsbetween 1992 and 2008 that were reported to the MCR (described in more detail below); (2) U.S.Census data; and (3) reports from the community from people who were concerned about cancer,reported either to the Kristen Renee Foundation or to the FCHD.
The MCR data:o Cancer cases are reportable to DHMH by Maryland statute (Health-General §§ 18-
203 and 18-204) and Code of Maryland Regulations 10.14.01.o Annually, Maryland geocodes the Address at Diagnosis (geocoding is the
assignment of a latitude and longitude for mapping, in this case based on theAddress at Diagnosis) of the cases reported to the MCR with Diagnosis Date ofJanuary 1, 2000 or later and revises ZIP codes and determines Census Tract oneach case. See Appendix A for additional information.
o The MCR provided the Center for Environmental Health Coordination with apreliminary line list of all the reported cancer cases diagnosed between 2000through 2007 who had Address at Diagnosis in three Census Tracts of interest andwho were in the MCR database as of 12/1/2009.
o The MCR geocoded the Frederick County cancer cases with date of diagnosis in1992 through 1999 and 2008 (i.e., new cases not yet geocoded for 2008).Additionally, cases in the data set with diagnosis years 2000—2007 that wereoriginally not geocoded in the first analysis were reviewed, and those withAddresses at Diagnosis that had addresses sufficiently complete to be geocodedwere then geocoded. All cases with diagnosis years 1992—1999 and 2008, wereadded to the initial 2000—2007 Frederick County data set along with theirlatitude, longitude, updated ZIP codes, and Census Tracts.
o Overall, for Frederick County cancer cases from1992—2008, 94% had anAddress at Diagnosis that could be geocoded.

Maryland DHMH/Frederick County Health Department October 3, 2011Summary Report: Frederick County Cancer Investigation
18
o Data were reviewed and cases with addresses that were not in Frederick Countywere removed (n=278).
o The MCR staff provided the Center for Environmental Health Coordination witha final geocoded line list (a line list is literally a listing of each individual case) ofall reported Frederick County cancer cases diagnosed between 1992 through2008, where the Address at Diagnosis was Frederick County, from the MCRdatabase as of 02/08/2011.
o The MCR staff calculated final standardized incidence ratios (SIRs) thatcompared the data from the MCR consolidated database as of 02/08/2011 forobserved invasive cancer cases (invasive cancers are generally more aggressivecancers that have spread either locally or by metastasis from where they originallydeveloped) in the 10 Census Tracts compared to the expected invasive cases forthe 10 Census Tracts using Frederick County and Maryland State age-specificrates. The SIRs were derived using SEER Stat to determine Frederick County andMaryland State age-specific rates for cases diagnosed between 1992 through 2008that were registered in the MCR consolidated database of 02/08/2011. (SeeAttachment B.)
o All data for calculation of SIRs were derived from the MCR data to standardizemethods of data collection from 1992 to 2008. No data reported from the citizenlist (see below) was used in calculation of SIRs
Cases for Maryland were selected by:o Diagnosis State = Maryland
Cases for Frederick County were selected by:o Diagnosis County = Frederick County;o Diagnosis State = Maryland; ando Removing cases that were incorrectly attributed to Frederick
County (e.g., documented Hagerstown address in WashingtonCounty) (n=278 cases).
Cases in the three Census Tract areas that were included in the initial SIRsincluded invasive cancer cases from Frederick County that had:
o Census Tract of Address at Diagnosis = 750501, 750700,751200
Cases in the ten Census Tract area that were included in the later SIRs includedinvasive cancer cases from Frederick County that had:
o Census Tract of Address at Diagnosis =750100,750200,750300,750400,750501,750502,750600,750700,750800, 751200
Census data used to calculate the SIRs for the three original and 10 final Census Tractswere obtained for 1990 and 2000 from http://factfinder.census.gov

Maryland DHMH/Frederick County Health Department October 3, 2011Summary Report: Frederick County Cancer Investigation
19
The citizens who were concerned about cancer began developing a list of people withhealth concerns. This list (“citizen list”) was submitted to the Frederick County HealthDepartment and transmitted to DHMH, MCR in late September, 2010.
Calculation of Standardized Incidence Ratios
The first part of the investigation was to determine whether specific types of cancer or cancer asa whole in the area of Fort Detrick have been occurring at an increased rate compared with somereference population (in this case, Frederick County and the State of Maryland). To do this, astandardized incidence ratio (SIR) was calculated for all invasive cancer and for each selectedcancer type. An SIR is an estimate of the occurrence of cancer in a population relative to whatmight be expected if the population had the same cancer experience as some larger comparisonpopulation designated as “normal” or average. It is obtained as following:
SIR= Observed Cases/ Expected Cases
The “observed” cancer of interest cases in the Census Tract areas surrounding Fort Detrick werecompared to the “expected” number of cases in that same area derived from the MCR data. The“expected” number of cases for the Census Tract areas surrounding Fort Detrick were estimatedby multiplying the incidence rates, based respectively on Frederick County and on MarylandState over the same period of years, times the population in the Census Tract areas.
Expected cases based on Frederick County rates = the sum over all age groups of the [(age-specific cancer incidence rate for Frederick) X (population of the census tract areas surroundingFort Detrick)]
Expected cases based on Maryland rates = the sum over all age groups of the [(age-specificcancer incidence rate for Maryland) X (population of the Census Tract areas surrounding FortDetrick)]
The direct method was applied as described by Breslow and Day, 5F5 F
6 to compare the number ofinvasive cancers with Address at Diagnosis in the Census Tract area surrounding Fort Detrick to“standard populations,” in this case the Frederick County and State of Maryland as a wholepopulations. The refined cancer cases list from the census tract areas surrounding Fort Detrickfrom the MCR were used for the observed value of cases when calculating standardizedincidence ratios (SIRs) and 95% confidence intervals (CIs) for the cancer types included in theinvasive cancer case definitions.
6 Breslow N.E., Day N.E. Statistical Methods in Cancer Research: Vol.2 Lyons France;International Agency for Research on Cancer. 1987

Maryland DHMH/Frederick County Health Department October 3, 2011Summary Report: Frederick County Cancer Investigation
20
When the MCR data were complete through 2008, final SIRs were calculated using data for theyears 1992 – 2008 for both the observed cases in the census tracts surrounding Fort Detrick andthe expected cases based on Frederick County and Maryland State MCR data from February 8,2011. To calculate SIRs, the most current Census data available at the time (1990 and 2000)were used to estimate the annual population for each year between 1990 and 2000, assuming aconstant, linear growth from 1992 to 2008 for each age group.
More information on SIRs is provided in Appendix B.
Phase 1 Investigation: Initial Analysis of Cancer Incidence in 3 Census Tractsaround Fort Detrick
The first analysis of MCR data was a calculation of standardized incidence ratios for cancers thatare usually thought to be important and affected by environmental exposures in investigations ofcancer and the environment. These include cancers that are the most common in the generalpopulation (lung and bronchus, female breast, colorectal, and prostate), and those that have beenassociated with environmental exposures in the past (brain and central nervous system, kidneyand bladder, leukemia and lymphoma, liver, and thyroid). The first phase looked at the rates ofthese cancers in three census tracts approximately equivalent to a one mile buffer around FortDetrick. The justification for this approach was to look at cancers in those individuals who liveclosest to Fort Detrick and would therefore be most likely to be exposed to any environmentalrelease from the facility. It was recognized, however, that simply living close to the facility didnot mean that such exposures had occurred; furthermore, if groundwater contamination had beenthe route of exposure, the exposure of individuals to chemicals in groundwater was probablyaffected by other factors as well as distance, such as the direction of water flow underground, orwhether households used bottled water or tap water.
The FCHD worked with the Frederick County government to construct a map, using ageographic information system (GIS) program, that showed buffers around the perimeter of FortDetrick (Areas A and B), at one-mile increments, out to a distance of 10 miles. Census tractmaps were superimposed on the buffers (Figure 5), and three census tracts were identified thatmost nearly corresponded to the inner 1 mile buffer (census tracts 751200, 750501, and 750700).
The MCR staff calculated SIRs using the MCR database as of 12/1/2009 for observed invasivecancer cases in these three census tracts compared to expected incidence from Frederick Countyand Maryland State rates. Invasive cancer includes all invasive cancer reportable to the MCR(see http://fha.state.md.us/cancer/mcr_regs.cfm, which excludes basal and squamous cellcarcinoma of the non-genital skin) and includes in situ bladder cancer. The disease-specific rateswere derived using SEER Stat on cases diagnosed between 2000 through 2007 in the updatedconsolidated MCR database as of 12/1/2009.
The SIRs for the following individual invasive cancer types: lung and bronchus, female breast,colorectal, prostate, brain and central nervous system, kidney and bladder (including renalpelvis), leukemia and lymphoma, liver, and thyroid as well as all cancers were calculated. The

Maryland DHMH/Frederick County Health Department October 3, 2011Summary Report: Frederick County Cancer Investigation
21
International Classification of Disease for Oncology (ICD-O-3) primary site (PSite) andhistology codes for the site-specific cancers used for SIR calculation are listed below:
Lung and bronchus: C34.0-C34.9; any histology except 9050-9055, 9140 and 9590-9989. Female breast: C50-50.9, female gender; any histology except codes 9050-9055, 9140
and 9590-9989. Colorectal: C18.0-C20.9, C26.0; any histology except codes 9050-9055, 9140 and 9590-
9989. Prostate: C61.9; any histology except codes 9050-9055, 9140 and 9590-9989. Brain and Central Nervous System (CNS): C70.0-C72.9 any histology except codes
9050-9055, 9140 and 9590-9989. Kidney and Bladder (including in-situ bladder):
o C64.9, C65.9; any histology except 9050-9055, 9140 and 9590-9989; ando C67.0-C67.9 (invasive, Behavior=3; in situ, Behavior=2); any histology except
9050-9055, 9140 and 9590-9989. Leukemia:
o C42.0, 42.1, 42.4; with Histology=9823, 9827o Any PSite with Histology= 9733, 9742, 9800, 9801, 9805, 9820, 9826, 9831-
9837, 9840, 9860, 9861, 9863, 9866, 9867, 9870-9876, 9891, 9895-9897, 9910,9920, 9930, 9931, 9940, 9945, 9946, 9948, 9963, 9964.
Lymphoma:o C 00.0-C80.9; with Histology=9650-9667o Any PSite with Histology=9590-9596, 9670-9671, 9673, 9675, 9678-9680, 9684,
9687, 9689-9691,9695, 9698-9702, 9705, 9708-9709, 9714-9719, 9727-9729o C00.0-C80.9 excluding codes C42.0, C42.1, C42.2; with Histology=9823, 9827.
Liver: C22.0-C22.9; any histology except codes 9050-9055, 9140 and 9590-9989. Thyroid: C73.9; any histology except codes 9050-9055, 9140 and 9590-9989.
The results, which were shared with the community at an October 4, 2010 public meeting, aresummarized in Table 3, which shows the observed and the expected cases for the three censustracts and the preliminary SIRs with 95% confidence intervals (CIs) compared to rates inFrederick County and to Maryland as a whole. Overall, there were no individual cancers in thethree census tracts of concern that were statistically significantly different than expected fromFrederick County or Maryland rates. Only All Cancers for the three census tracts weresignificantly increased in comparison the State of Maryland but not to Frederick County as awhole.
Some of the limiting factors in this initial analysis included:
The MCR was created in the early 1990’s, and the first complete year of data was1992. The period of concern for cancer cases in Frederick ranged from diagnoses inthe 1970’s and after, and the MCR did not contain cancers diagnosed before 1992,limiting the utility of the MCR data for a 40 year evaluation.

Maryland DHMH/Frederick County Health Department October 3, 2011Summary Report: Frederick County Cancer Investigation
22
When the investigation started, MCR data were available only through 2007, andcancer cases diagnosed prior to 2000 had not been geocoded and did not havecensus tract assignments. This limited the ability to perform SIRs with cancer casesdiagnosed from 1990-1999; geocoding of the earlier cases rectified the issue by thetime of this final report.
The initial analysis looked at a very broad range of cancer diagnoses becauseexposures of concern could be varied (based on historical reports and recentrestoration activities).

Maryland DHMH/Frederick County Health Department October 3, 2011Summary Report: Frederick County Cancer Investigation
23
Figure 6. Maps of census tracts and 1, 2, and 3-mile buffers included in Phase 1 (initial) and Phase 2 (followup) investigation of cancer in Frederick.

Maryland DHMH/Frederick County Health Department October 3, 2011Summary Report: Frederick County Cancer Investigation
24
Table 3. Cases Observed in the 3 Census Tracts and Expected Numbers of Cases for Specific Cancer Sites, 2000-2007 (Census Tracts750501, 750700, 751200)
Cancer Type*
ObservedNumber of
Cases inCT
750501,750700,751200
^ ExpectedNumber of Cases
based onFrederick
County rates2000-2007
SIR**compared to
FrederickCounty
95% CI
CT 750501,750700,751200
Statisticallydifferent from
FrederickCounty
ExpectedNumber of
Casesbased onMaryland2000-2007
SIR**compared
toMaryland
95% CI
CT 750501,750700,751200
Statisticallydifferent from
Maryland
All sites 1059 1072 0.99 0.93-1.05 No 957 1.11 1.04-1.17 YesLung &Bronchus 149 141 1.06 0.89-1.24 No 133 1.12 0.94-1.31 NoFemaleBreast 159 161 0.99 0.84-1.15 No 148 1.07 0.91-1.25 NoColorectalCancer 102 114 0.89 0.73-1.08 No 99 1.03 0.83-1.24 No
Prostate 141 146 0.96 0.81-1.14 No 136 1.04 0.87-1.22 No
Brain & CNS 11 17 0.66 0.32-1.15 No 14 0.80 0.39-1.41 NoKidney &Bladder 79 76 1.04 0.82-1.29 No 65 1.21 0.95-1.50 NoLeukemia &Lymphoma 79 71 1.11 0.88-1.38 No 63 1.26 1.00-1.57 No
Thyroid 29 32 0.90 0.60-1.29 No 24 1.18 0.78-1.69 No
* Includes all invasive cancer excluding basal and squamous cell carcinoma of the non-genital skin, and including in situ bladder cancer** Standard Incidence Ratio = Observed Cases/ Expected Cases^ Observed and Expected cases derived from Maryland Cancer Registry consolidated data as of 12/1/2009

Maryland DHMH/Frederick County Health Department October 3, 2011Summary Report: Frederick County Cancer Investigation
25
Phase II Investigation: Expansion of Area and Period of Interest
Following the presentation of the Phase I investigation results, there were discussions amongFrederick County citizens, the county health officer, and state health officials about how toproceed. Based on recommendations from the public and health officials, we decided to look atMCR data for Frederick prior to the year 2000 from 1992—1999 because the dates of operationand contamination at Fort Detrick went back to the 1940s and 50s. The earliest completepopulation-based cancer data in the MCR is diagnosis year 1992. In addition, the area ofinvestigation was expanded, as described below.
At the time of the Phase I investigation, the MCR had not geocoded “address at diagnosis” forcancer cases with diagnosis dates of 1992 through 1999; therefore, geocoding of these data wasundertaken. The public also felt the one mile area of concern was too tight around Fort Detrick;therefore, the area of concern was expanded to approximately a two mile radius that included tencensus tract areas (census tracts 750100, 750200, 750300, 750400, 750501, 750502, 750600,750700, 750800 or 751200). Figure 5 is a map of the original three census tract area, the 1-mileand 2-mile buffers, and the additional seven census tracts. For calculation of the SIRs for the 10Census Tracts, an invasive cancer case was defined as an invasive cancer case registered in theMCR as of February 8, 2011.
Table 4 shows the expanded analysis of cancer cases observed and expected in the three censustracts corresponding to the one mile buffer for the entire period available (1992-2008). The tableshows that the SIR for lymphomas in the three census tracts was statistically increased incomparison to the State of Maryland, but not to Frederick County as a whole. This means thatthe rate of lymphomas in the area immediately around Fort Detrick was not significantlydifferent than the rate of lymphomas in the County overall. However, it was significantlyincreased compared with the State rate of lymphomas.
The finding of a small but significant increase in the standardized incidence rate for lymphomacompared with Maryland but not with Frederick County bears some discussion. First, becausethe standardized incidence rate was not significantly increased for Frederick County, thereappears to be no significant difference between the three census tracts surrounding Fort Detrickand the rest of the County as a whole. This does not suggest that there is some difference inlymphoma rates between the population closer to Fort Detrick and the County as a whole. At thesame time, the increase in observed versus expected cases based on overall State rates should beinvestigated further, looking for example at rates of lymphoma in Frederick County for differenttypes of lymphomas (Hodgkins versus non-Hodgkins), and different ages of onset.
Table 5 shows the final SIRs that include the ten census tracts and data from incidence years1992-2008. Overall, there were no individual cancers in the ten census tracts of concern thatwere statistically significantly different than what would be expected from Frederick County orMaryland rates. The All Site SIR of 0.097 for the ten census tract area was significantly lowerthan Frederick County as a whole, but not significantly different from Maryland (in other words,based on the population at the time, if the rate had been the same as the rate of cancer for

Maryland DHMH/Frederick County Health Department October 3, 2011Summary Report: Frederick County Cancer Investigation
26
Frederick County overall, one would have expected there to be a slightly higher total number ofcancers, 4,592, rather than the 4,379 actually observed).

Maryland DHMH/Frederick County Health Department October 3, 2011Summary Report: Frederick County Cancer Investigation
27
Table 4. Cases Observed in the 3 Census Tracts and Expected Numbers of Cases for Specific Cancer Sites, 1992-2008 (Census Tracts 750501, 750700,751200)
SeerStat data as of 02/08/2011 was used to calculate expected number of cases using Frederick County and Maryland.CT* Census Tract. SIR** Standard Incidence Ratio= Observed Cases/Expected Cases. ^ expected number of cases=( 1992-2008 Frederick orMaryland State cancer rates) X ( population of 3 CTs*). Observed and Expected cases derived from Maryland Cancer Registry consolidated data as ofFebruary 8, 2011 with county and Maryland age-specific rates calculated in SEER Stat and used to determine expected numbers the 3 census tracts.
CancerType
ObservedNumber in
CTs750501,750700,751200
Expectedcases based
on FrederickCounty
1992-2008
SIR**compared to
FrederickCounty
95% CI
CTs 750501,750700, 751200
Statisticallydifferent from
FrederickCounty
Expectedcases based
onMaryland1992-2008
SIR**compared to
Maryland95% CI
CTs 750501,750700,751200
Statisticallydifferent from
Maryland
n n^ n^
All sites 1906 1931 0.99 0.94-1.03 No 1896 1.00 0.96-1.05 NoLung &Bronchus 269 257 1.05 0.92-1.18 No 271 0.99 0.88-1.12 NoFemaleBreast 315 299 1.05 0.94-1.18 No 296 1.06 0.95-1.19 No
Prostate 255 261 0.98 0.86-1.10 No 278 0.92 0.80-1.04 NoBrain &CNS 25 31 0.80 0.51-1.17 No 27 0.92 0.59-1.34 NoKidney &Bladder 136 139 0.98 0.82-1.15 No 127 1.07 0.89-1.27 No
Leukemia 37 42 0.89 0.62-1.22 No 40 0.93 0.65-1.28 No
Lymphoma 102 91 1.12 0.91-1.36 No 82 1.25 1.01-1.50 Yes
Liver 17 13 1.31 0.75-2.08 No 19 0.88 0.50-1.39 No
Thyroid 44 50 0.89 0.64-1.18 No 39 1.13 0.82-1.51 No

Maryland DHMH/Frederick County Health Department October 3, 2011Summary Report: Frederick County Cancer Investigation
28
Table 5. Cases Observed in the 10 Census Tracts and Expected Numbers of Cases for Specific Cancer Sites, 1992-2008 (Census Tracts750100,750200,750300,750400,750501,750502,750600,750700,750800, 751200)
Cancer Site*^ObservedNumber in10 Census
Tracts
^ExpectedNumber of
CasesBased on
Age-Specific
FrederickCountyRates
1992-2008
SIR**compared to
FrederickCounty
95% CI
10 CensusTracts
StatisticallyDifferent from
FrederickCounty?
^ExpectedNumber of
CasesBased on
Age-Specific
MarylandRates
1992-2008
SIR**compared
toMaryland
95% CI
10 CensusTracts
StatisticallyDifferent from
Maryland?
n n^ n^
All sites 4,379 4,592 0.95 0.93-0.98 Yes--Lower 4,498 0.97 0.94-1.00 No
Lung &Bronchus 605 620 0.98 0.89-1.06 No 651 0.93 0.86-1.00 No
Female Breast 682 698 0.98 0.90-1.05 No 689 0.99 0.92-1.07 No
ColorectalCancer 480 517 0.93 0.85-1.02 No 495 0.97 0.88-1.06 No
Prostate 599 634 0.95 0.87-1.23 No 667 0.89 0.83-0.97 NoBrain & CNS 65 72 0.90 0.69-1.15 No 62 1.04 0.80-1.32 No
Kidney &Bladder*** 316 334 0.95 0.84-1.06 No 304 1.04 0.93-1.16 No
Leukemia 82 99 0.83 0.66-1.03 No 94 0.87 0.69-1.08 No
Lymphoma 207 213 0.97 0.84-1.11 No 192 1.08 0.94-1.24 No
Liver 34 31 1.10 0.76-1.54 No 46 0.74 0.50-1.03 No
Thyroid 97 111 0.88 0.70-1.07 No 87 1.12 0.90-1.36 No
* Includes all invasive cancer excluding basal and squamous cell carcinoma of the non-genital skin, and including in situ bladder cancer** Standard Incidence Ratio= Observed Cases/Expected Cases***Includes in situ bladder cancer^ expected number of cases=( 1992-2008 Frederick or Maryland State cancer rates) X ( population of 10 CTs*). Observed and Expected casesderived from Maryland Cancer Registry consolidated data as of February 8, 2011 with county and Maryland age-specific rates calculated in SEERStat and used to determine expected numbers the 10 census tracts.
Maryland DHMH/Frederick County Health Department October 3, 2011Summary Report: Frederick County Cancer Investigation
29
Analysis of Geographic and Temporal Clustering
After evaluation of the SIRs, the Frederick County cancer data from the MCR for years ofdiagnosis 1992-2008 was analyzed for geographic and temporal clustering, using the SaTScansoftware.6 F6 F
7 Essentially, the SaTScan software creates a number of circles at each point and looksat those circles over time, identifying those circles in which the number of cases (of a cancer ofone diagnostic group) is unusually high, when compared with the overall number of cancersoccurring over time for the entire area, but outside of that circle, and adjusting for age atdiagnosis and gender. The software identifies the most likely cluster with a log-likelihood ratioand a probability statistic (p-value) that corresponds to the probability that the cluster did notoccur by chance alone. Another unique feature of SaTScan is that since the probability of thelargest log likelihood statistic is only evaluated once using the Markov Chair Monte Carloprocedure, the reported probability value is not influenced by multiple comparisons, e.g., inflatedp value.
The MCR provided a file to the Center for Environmental Health Coordination of all cancerdiagnoses with Address at Diagnosis of Frederick County, 1992-2008. This consisted of 17,315total cases, of which 15,594 were invasive cancer cases. An additional 1,721 cases were in situand “benign” brain or central nervous system cases that were excluded from the subsequentcluster analysis. Another 958 cases were excluded because they did not have latitude/longitude,and could therefore not be mapped by the program. There were 592 records with cancer types(these included eye cancers, Kaposi’s sarcoma, lip cancers, a category of other poorly-defined,and soft tissue cancers) that were not coded in a diagnostic group, but were included in the14,636 cases used as a “denominator” population of all cancers for SaTScan. The total numberof diagnoses that could be coded in the analysis by cancer diagnostic group was 14,044 (Table6).
Each cancer diagnostic group was analyzed using a retrospective space-time analysis with thediscrete Poisson probability model in SaTScan version 9.1.1.7F7F
8 The study period included theyears 1992 – 2008, and cases within diagnostic groups were compared with the underlyingpopulation of all cancers in Frederick County for the same period, adjusting for the age categoryat diagnosis (in 10 year intervals) and sex of each case. Alpha was set at p<0.05 for all analyses.
Table 7 summarizes the results of the cluster analysis. No cluster was found to be significant(that is, the probability for all cluster outcomes were p>0.05). The common cancer groups(breast, prostate, lung, and gastro-intestinal) were not significant and had very large radii (thiswas expected, as these cancers constituted a significant proportion of the all cancers, i.e., thedenominator data). Of note, the various clusters were widely distributed geographically aroundthe county, rather than in only a few locations. This lends support to the absence of a “true”
7 Kulldorff M. and Information Management Services, Inc. SaTScanTM v9.1.1: Software for thespatial and space-time scan statistics. http://www.SaTScan.org/, 2011.8 Kulldorff M. A spatial scan statistic. Communications in Statistics: Theory and Methods,26:1481-1496, 1997.

Maryland DHMH/Frederick County Health Department October 3, 2011Summary Report: Frederick County Cancer Investigation
30
clustering of cases of cancer of a specific type, as well as the absence of a confirmed statisticalevent.
Table 6. Diagnostic Groups Constructed for Cluster Analysis, Based on Cancer Diagnoses in MarylandCancer Registry, 1992-2008
Cancer DiagnosticGroup
MCR “Cancertypes” Included inGroup
Number ofCases
Total Cases inClusterAnalysis
Breast 2,243
Female breast 2,223
Male breast or gender not identified 20
Bone Bone and Joint 38 38
Dermatologic 747
Other skin 47
Skin melanoma 700
Endocrine 411
Other endocrine 26
Thyroid 385
Gastrointestinal 2,875
Anus 28
Colon not rectal 1,150
Esophagus 155
Floor of mouth 28
Gall bladder 41
Gum other mouth 48
Hypopharynx 26
Larynx 128
Majel salivary gland 31
Oropharynx 13
Other digestive 117
Other buccal pharyngeal 58
Pancreas 309
Rectum and sigmoid 454
Small intestine 48
Stomach 155
Tongue 86
Genitourinary 1,247
Bladder 407
In situ bladder 239
Kidney and renal 425
Other urinary or Other male genital 14
Penis 19
Testis 116
Ureter 27
Gynecologic 901

Maryland DHMH/Frederick County Health Department October 3, 2011Summary Report: Frederick County Cancer Investigation
31
Cervix 143
Corpus uteri 429
Other female genital 75
Ovary 237
Uterus, not otherwise specified 17
Hematologic 1,166
Acute lymphocytic leukemia 37
Acute myelocytic leukemia 90
Chronic lymphocytic leukemia 96
Chronic myelocytic leukemia 35
Hodgkin’s lymphoma 118
Multiple myeloma 177
Non-Hodgkin’s lymphoma 568
Other leukemia 45
Liver Liver 80 80
Neurologic 231
Brain 218
Other nerve 13
Prostate Prostate 2,133 2,133
Lung 1,972
Lung and bronchus 1,897
Mesothelioma 20
Nasopharynx or Other respiratory 55
Diagnoses Included inthe Analysis by MajorDiagnostic Group
14,044
Diagnoses NotAssigned to a Groupbut Included inDenominator
592
Total Diagnoses Usedfor Denominator
14,636

Maryland DHMH/Frederick County Health Department October 3, 2011Summary Report: Frederick County Cancer Investigation
32
Table 7. Results of SaTScan Cluster Analysis of Cancers Diagnosed with an Address in Frederick County,1992-2008 (N=14,044)*
Cancer DiagnosticGroup
Cluster Size (radiusin kilometers)
Probability Value(p-value)
StatisticallySignificant
Breast 5.5 1.0 No
Bone 1.8 0.93 No
Dermatologic 6.3 0.86 No
Endocrine 3.4 0.098 No
Gastrointestinal 6.9 1.0 No
Genitourinary 8.0 1.0 No
Gynecologic 11.7 0.91 No
Hematologic 7.2 0.57 No
Liver 3.2 0.89 No
Neurologic 0 0.129 No
Prostate 22.1 0.94 No
Pulmonary 3.6 0.93 No*Based on a discrete Poisson probability model using SaTScan version 9.1.1.
Age at Diagnosis
To test the hypothesis that exposure might lead to earlier age at cancer diagnosis, median age atcancer diagnosis was calculated for the cases with Address at Diagnosis in the 10 census tracts ofinterest, to compare to the same data for cases in Frederick County, and in Maryland. We used a“proc means” procedure in PC SAS 9.2 software to compute descriptive statistical analyses suchas means, medians, and standard deviations. Table 8 shows the median age at diagnosis forinvasive and in situ cancer cases in the 10 census tract area around Ft. Detrick, Frederick County,and Maryland by the diagnostic groupings described above (Table 6, column 1). The cases in the10 census tract area are not different from the median age at diagnosis of cases in Frederick as awhole.
In order to test statistically the difference in ages of diagnosis, mean age of diagnosis wascalculated for all diagnostic groups. The diagnostic groups were used because the relativelysmall number of cases for individual cancer types made the comparison of mean age at diagnosisless likely to show a statistically significant difference. Differences in means were thencompared using a t-test. This showed no significant difference in age at diagnosis between thediagnosed cases with addresses in the 10 census tracts and all of Frederick County (Table 9).

Maryland DHMH/Frederick County Health Department October 3, 2011Summary Report: Frederick County Cancer Investigation
33
Table 8. Age at Diagnosis for all In Situ and Invasive Cancer*
for All Cancer Diagnoses, 1992 - 2008*
Median Age at Diagnosis in Years
Cancer Group Frederick,10 Census
Tracts
FrederickCounty
Maryland
Bone 38 38 44
Breast 61 59 60Endocrine 42 45 49Gastrointestinal 70 68 69Genito urinary(incl. bladder)
70 66 68
Gynecologic 58 58 59Hematologic 65 64 65
Liver 61 62 65Lung 71 70 69Neurologic 59 56 57Prostate 69 68 68Skin--Melanoma 59 57 59
*Includes all invasive and in situ cancer excluding basal and squamous cell carcinoma.
Source: Maryland Cancer Registry, Consolidated Data 02082011

Maryland DHMH/Frederick County Health Department October 3, 2011Summary Report: Frederick County Cancer Investigation
34
Table 9. Age at Diagnosis for all In Situ and Invasive Cancerfor All Cancer Diagnoses, 1992 - 2008*
Mean Age at Diagnosis in Years (standard deviation)
Cancer Group Frederick,10 Census
Tracts
FrederickCounty
SignificantDifference?
Bone 42.6 (25.9) 40.6 (22.9) No
Breast 61.6 (15.4) 60.6 (14.9) NoEndocrine 44.8 (15.1) 47.2 (15.4) NoGastrointestinal 68.3 (13.8) 67.8 (22.2) NoGenito urinary 65.2 (17.7) 63.4 (17.2) No
Gynecologic 60.5 (16.2) 59.9 (15.2) NoHematologic 59.9 (20.0) 59.6 (20.1) No
Liver 61.8 (17.9) 62.8 (16.0) NoLung 69.3 (11.6) 68.5 (11.5) NoNeurologic 55.7 (20.7) 52.0 (22.9) NoProstate 68.4 (10.5) 69.0 (30.3) NoSkin--Melanoma 57.1 (17.9) 57.1 (38.6) No
*Includes all invasive and in situ cancer excluding basal and squamous cell carcinoma.
Source: Maryland Cancer Registry, Consolidated Data 02082011
Citizen List Evaluation
In addition to the quantitative analysis of cancer data within the MCR, DHMH attempted toevaluate the list of diagnoses provided by citizens in order to determine whether and how the listmight be incorporated in the investigation.
In order to compare the citizen list to the Maryland Cancer Registry, the following fields wereadded to the list:
Whether the report was for a single person (some listings referred to multipleindividuals);
Whether the report was about cancer or some other health concern; Whether the cancer on the citizen list was “reportable” under MCR policy and
State law (some cancers do not have to be reported, so would be unlikely to befound in the MCR)
Once this was done, the list was then reviewed by MCR staff. If an individual entry had morethan one apparent tumor location (for example, if a listing reported cancer of the lung, liver, andbrain), then the entry was re-entered so that the same individual would be listed three times (one

Maryland DHMH/Frederick County Health Department October 3, 2011Summary Report: Frederick County Cancer Investigation
35
for each of the different tumors). This is the same way that the MCR works, because it is aregistry in which each tumor identified has its own entry (even if it is from the same individual).The Citizen List was then matched to the MCR database as of 12/01/2009.
Based on the comparison, there were three possible outcomes:
1. The cancer found in the MCR for that person was only in the MCR and not reportedby the citizen;
2. Whether the citizen report of cancer matched the type of cancer in the MCR;3. Whether the citizen report of cancer did not match the type of cancer in the MCR.
For citizen reports that did not match with data in the MCR, a field captured possible reasonswhy the case was not found in the MCR. Five match attempts between the two lists were done,matching on the following fields:
First name, last name, city Last name, city First name, last name Last name, diagnosis year First name, diagnosis year
The results of each match were reviewed and information about probable matches was added tothe citizen list. The results are shown in Table 10.
There were 435 people (as distinct from diagnosis, since a person may have more than onediagnosis) with one or more conditions reported on the citizen list including conditions otherthan cancer; 398 of those were reports of people having one or more types of cancer. For these398 people, 452 were cancers that would have been reportable to the MCR if the person’saddress at diagnosis had been Maryland, and the date of diagnosis had been between 1992 and2008. In the MCR as of 12/9/2010, there were 15,594 cancer cases with date of diagnosisbetween 1992 and 2008 and address at diagnosis in Frederick County.
Of the 452 cancers, 183 reports on the citizen list were matches to cancers in MCR by personname and type of cancer, 269 cancers reported on the citizen list were not found in MCR.Possible reasons for not finding the cancers are shown in Table 10. There were 68 reports forwhich no reason was identified as to why the cancer was not listed in the MCR. Additionally, 21cancers were found in the MCR for the people listed on the citizen list but their cancer(s) had notbeen reported on the citizen list.
Based on this evaluation, health officials concluded that the reports from citizens representedonly a selected sample of cancer cases diagnosed in Frederick County during 1992—2008. Inaddition, the reports on the list could not be incorporated into the ongoing investigation withoutan entirely separate process of gathering additional cases and identifying the size of thepopulation living in the community at the time (which is necessary to calculate the rates used to

Maryland DHMH/Frederick County Health Department October 3, 2011Summary Report: Frederick County Cancer Investigation
36
compare cancer over time), all of which was outside the scope and resources of thisinvestigation.
Table 10. Evaluation of the Citizen List and Match to the Maryland Cancer Registry
Number of people with one or more conditions reported includingconditions other than cancer
435
Number of people reporting one or more cancers 398
Number of tumors reported 476Number of reportable tumors reported 452
Probable matches found in the MCR 183Not found in the MCR 269
Reasons why potentially not found:No Name or insufficient identifying info 42Diagnosed before 1992 68Diagnosed in 2008—2010, too recent to be inMCR
46
No diagnosis date 27Could be a metastatic site from anothertumor that was found *
16
Possibly not reportable 2No reason identified 68
Number of reportable tumors NOT reported by citizensbut a probable match was found in MCR by the patient’sname
21
* Bone, brain, liver, and lung are common metastatic sites; if they were reported but not found,they could have been reported in the MCR with the primary site and not as the metastatic sitegiven in the citizen list.
CONCLUSIONS
The purpose of this investigation was to determine whether there was evidence of an increase incancer in Frederick County, particularly in the area around Fort Detrick. The investigationshowed the following:
There were no statistically significant increases in all cancer or in specific types of cancerin the three census tracts that constitute an area of 1-mile radius around Fort Detrick forthe period 1992 – 2008, with the exception of lymphoma. Lymphoma was slightlyincreased compared with Maryland as a whole, but not with Frederick County. Thismeans that the rate of lymphomas in the area immediately around Fort Detrick was not
Maryland DHMH/Frederick County Health Department October 3, 2011Summary Report: Frederick County Cancer Investigation
37
significantly different than the rate of lymphomas in the County overall. However, it wasslightly increased compared with the State rate of lymphomas.
When an additional seven census tracts were added to the original three, expanding thebuffered area around Fort Detrick to approximately a 2-mile radius, there were nosignificant increases in either all cancers or in specific types of cancer around Ft. Detrickfor the period 1992—2008, compared with Frederick County or the State as a whole.
The increase in cancer rates for all cancers noted between 2001 and 2006 is unlikely to berelated to environmental exposures in the Fort Detrick area. If cancer occurrences wereaffected by environmental exposures from decades ago, the effect would be less likely toshow up in a narrow range of time than to be spread out over many years. Analysis of thecancer rates for the three census tracts closest to Fort Detrick for the period 2000-2007did not show significant increases in the cancers of greatest concern, compared witheither Frederick County or the State. Other potential explanations for the increase shouldbe investigated, such as changes in reporting patterns, before the increase is assumed tobe related to environmental exposures.
Analysis of potential space-time “clustering” using the SaTScan program showed nosignificant clusters, when comparing specific cancer diagnosis groups with all cancer inthe ten census tracts and Frederick County for the period 1992 – 2008.
There was no significant difference in the ages at diagnosis for cancers in specificdiagnostic groups in people living close to Fort Detrick (within the 10 census tractsimmediately surrounding the installation) compared with people in Frederick as a whole.
Examination of the reports by the citizens in the community showed that while there wassome correspondence between those on the citizen list and those registered with theMaryland Cancer Registry, the disparity between the two data sources was sufficientlyhigh that the cases reported by citizens could not be used directly as a case finding sourcewithout an amount of effort and resources that were not available.
In 1992, the Maryland General Assembly enacted Maryland Health-General Article, §§18-203and 18-204 which created consistent reporting of quality data to Maryland Cancer Registry.Analysis of MCR data can only be conducted on cases reported to the MCR during the officialyears. Cases reported prior to 1992 are suspect for quality and consistency and do not provideadequate data for analysis. The number of cancers in a given community is influenced bycompleteness of reporting of cancer cases to the MCR.
In addition, the MCR stresses caution in analysis by address at cancer diagnosis. This addressmay or may not be where the person with cancer was possibly exposed to any potentialcarcinogen. The complex nature of cancer, potential environmental exposures, family history,personal behavior, and movement into and out of a geographic area, can make it difficult to see aclear relationship between exposure and cancer diagnosis in the analysis of the cancer registrydata.
Other potential limitations of this investigation should also be noted:
Cancers occurring prior to 1992 were not addressed, and cannot be evaluated using datafrom the Maryland Cancer Registry. If there is concern about possible cancers linked to
Maryland DHMH/Frederick County Health Department October 3, 2011Summary Report: Frederick County Cancer Investigation
38
exposures occurring in the period from the 1940s or 1950s to 1970, even with the latencyperiod for cancer (the period between a chemical exposure that has the potential to causecancer and the clinical appearance of the cancer) of up to several decades, it is possiblethat any cancer potentially related to exposures might have occurred prior to 1992.However, in order to determine whether some cancers that happened before 1992 weremore frequent than they should have been, it would be necessary to have the same kind ofinformation that the MCR provides for the earlier time period. To know the baselinerates of cancer by type in this area would require some way of counting or reconstructingthe population living in the area, as well as a means of identifying many if not most of thecancers diagnosed. This effort would require considerable resources and is beyond thescope of this investigation.
The quantitative analysis of space-time clustering is a relatively new type of analysis, andthere are many assumptions built into the analysis. The assumptions about howdiagnoses are grouped, what the comparison population should be, and how to structurethe analysis can be debated. In this investigation, the analysis was used to helpstrengthen the overall conclusions, but is not seen at this point as having sufficientvalidity that it could be used by itself to determine in fact whether a cluster is or is notoccurring.
Maryland Cancer Registry data is based on address of residence at cancer diagnosis.MCR data on other risk factors such as smoking, family history, occupation, occupationalexposures, and industry or address where a case worked, is lacking. Therefore, it is notpossible to incorporate those risk factors in the analysis. It is possible that these riskfactors could play a role in cancer development. However, it is not possible to addressthis omission without collecting additional data.
In conclusion, there is no consistent evidence from Maryland Cancer Registry data, by a varietyof analyses, that there is an increase in the rate of cancers diagnosed in people whose address ofresidence at the time of cancer diagnosis was within the 3 or 10 census tracts immediatelysurrounding Fort Detrick for the period 1992 – 2008, when compared with cancer rates forFrederick County as a whole. When compared with cancer rates for Maryland as a whole, thereis a small increase observed for lymphoma, but this difference may not be limited to the censustracts surrounding Fort Detrick. Similarly, there is no indication that cancers in this area wereoccurring at significantly younger ages than in the rest of the population. This investigation doesnot offer any conclusions regarding potential exposures in this population, but does indicate that,given all of the limitations described above, it does not appear that the cancers investigated herebehaved any differently in this population than in Frederick County or Maryland as a whole.

Maryland DHMH/Frederick County Health Department October 3, 2011Summary Report: Frederick County Cancer Investigation
39
NEXT STEPS
1. The Frederick County Health Department and the Maryland Cancer Registry will continue toreview cancer incidence in Frederick County as a whole as new data become available. Inlight of questions related to the observed increase in cancer rates between Frederick Countyand Maryland between 2001 and 2006, it will be helpful to look in more detail at whichcancers contributed to the observed increase and potential explanations. While the increaseis unlikely to be related to environmental exposures in the Fort Detrick area, it will be usefulto the public, the County, and the State to examine possible explanations for the increase.
2. The Department of Health and Mental Hygiene and the Frederick County Health Departmentwill specifically look in more detail at lymphoma rates for the areas in question and forFrederick County as a whole, including different types of lymphoma, and ages of onset ofdifferent types of lymphoma.
3. If new information about environmental exposures, environmental risks, or other factorsbecomes available, the Department of Health and Mental Hygiene and Frederick CountyHealth Department will review that new information in light of this and future evaluations ofcancer in Frederick County.
4. Frederick County Health Department and the Department of Health and Mental Hygiene willreport back to the community on the above efforts, and use those opportunities for publiceducation and information around issues of cancer, cancer prevention, and cancer detection.

Maryland DHMH/Frederick County Health Department October 3, 2011Summary Report: Frederick County Cancer Investigation
A-1
Appendix A: MCR GIS Methods/Processes for Geocoding
Step 1: Three passes with stepwise removal of prefix, suffix, and street type
Pass 1. Geocode using full address (house number + street name + prefix +suffix + street type + 5-digit Zip code).
Pass 2. With full address, remove only prefix + suffix from address Pass 3. With full address, remove prefix + suffix + street type. Keep house
number + street name + 5-digit Zip code.
Step 2: Three passes introducing Zip code relaxation (first 3 digits of zip code only)
Pass 1: Use full address with 3-digit zip (house number + street name + prefix+ suffix + street type + 3-digit zip)
Pass 2: Remove only prefix + suffix; keep house number + street name +street type + 3-digit zip
Pass 3: Remove prefix + suffix + street type; keep house number + streetname + 3-digit zip
Step 3: Three passes introducing County of Diagnosis (dxcounty) using FIPS code andremoving Zip code from all passes in Step 3 Pass 1: Use full address with FIPS code instead of Zip code (house number +
street name + prefix + suffix + street type + FIPS code) Pass 2: Remove only prefix + suffix; keep house number + street name +
street type + FIPS code Pass 3: Remove prefix + suffix + street type; keep house number + street
name + FIPS code
Maryland DHMH/Frederick County Health Department October 3, 2011Summary Report: Frederick County Cancer Investigation
A-2
Appendix B: Description of Standardized Incidence RatioCalculations
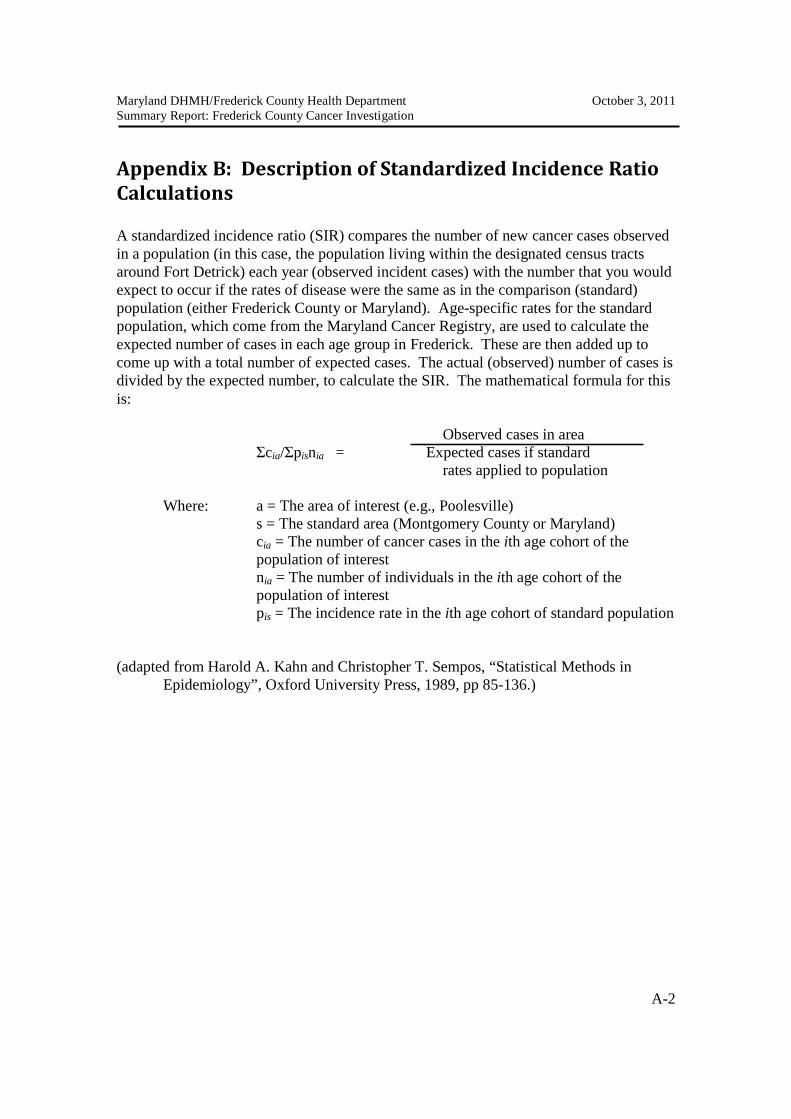
A standardized incidence ratio (SIR) compares the number of new cancer cases observedin a population (in this case, the population living within the designated census tractsaround Fort Detrick) each year (observed incident cases) with the number that you wouldexpect to occur if the rates of disease were the same as in the comparison (standard)population (either Frederick County or Maryland). Age-specific rates for the standardpopulation, which come from the Maryland Cancer Registry, are used to calculate theexpected number of cases in each age group in Frederick. These are then added up tocome up with a total number of expected cases. The actual (observed) number of cases isdivided by the expected number, to calculate the SIR. The mathematical formula for thisis:
Observed cases in areaΣcia/Σpisnia = Expected cases if standard
rates applied to population
Where: a = The area of interest (e.g., Poolesville)s = The standard area (Montgomery County or Maryland)cia = The number of cancer cases in the ith age cohort of thepopulation of interestnia = The number of individuals in the ith age cohort of thepopulation of interestpis = The incidence rate in the ith age cohort of standard population
(adapted from Harold A. Kahn and Christopher T. Sempos, “Statistical Methods inEpidemiology”, Oxford University Press, 1989, pp 85-136.)