investigation of boundary migration during grain growth in fully recrystallised high purity nickel
TRANSCRIPT

Investigation of boundary migration duringgrain growth in fully recrystallised high puritynickel
Y. B. Zhang1, A. Godfrey*1, W. Liu1 and Q. Liu2
The movement of individual boundaries during grain growth after primary recrystallisation in a
96% cold rolled sample of pure nickel has been followed using electron backscatter diffraction
maps of the same surface area taken after each of several annealing steps. Particular attention is
given to the migration of boundaries with near S3 misorientations. During annealing, a small
reduction in the length fraction the S3 boundaries was observed in the early stages of annealing.
Analysis of individual boundaries shows that only those boundary segments with a misorientation
angle greater than 4u move during annealing. In addition, the S3 boundaries can be divided into
two groups: those with misorientations very close to the ideal twin misorientation (‘twin type’) and
those with a larger deviation to the ideal twin misorientation, but still satisfying the Brandon
criterion (‘neighbour type’). Of these, only neighbour type S3 boundaries are observed to move
during annealing. Some implications of these observations for twin development during grain
boundary engineering are discussed.
Keywords: Nickel, Electron backscattering diffraction, Grain growth, CSL boundaries
IntroductionThere has been much interest recently in the use of nickeland nickel alloys as a substrate material for secondgeneration high temperature superconductor (HTS)tapes, in part due to the strong cube texture that canbe developed in these metals by heavy cold rollingfollowed by annealing treatments.1–5 During annealing,the cube texture is developed as a result of bothrecrystallisation and subsequent grain growth. Previousinvestigations, for example, have shown that, after fullrecrystallisation, the volume fraction of cube texturemay only be y50%,6 with further high temperatureannealing required to develop a very high (.95%) cubefraction. However, even after high temperature anneal-ing, it is usual that some annealing twins are present inthe microstructure, especially for nickel alloys.7,8 Thesetwin boundaries are linked to weakening of the cubetexture, and their spatial arrangement may also affectthe achievable critical current density of any depositedsuperconducting layer.9 It is desirable therefore to avoidthe presence of annealing twins in HTS substratematerials.
In other applications, however, the presence ofannealing twins may be desirable. For example, manystudies have demonstrated that boundaries associated
with low S value coincident site lattice (CSL) misor-ientations show reduced susceptibility to impuritysegregation, superior ductility and higher resistance tointergranular corrosion.10–14 Based on these observa-tions, the concept of grain boundary engineering hasbeen proposed, in which attempts are made to controlmaterial properties by a manipulation of the grainboundary character distribution (GBCD).15,16 It iscommonly accepted that, for face centred cubic metalsof low to medium stacking fault energy metals, includingNi and many Ni alloys, the GBCD developed inannealed samples is often dominated by S3 boundaries,which arise due to annealing twinning.17–19 Moreover, ithas been found that repetitive thermomechanical pro-cessing can be used to increase further the fraction of S3(and S3n) boundaries.20–23 A mechanism for this wasrecently proposed based on the regeneration of S3boundaries during thermomechanical processing.19,21
An important feature of this model is the presence ofhighly mobile non-coherent S3 boundaries (note that inthis article the term ‘non-coherent’ is used to refer to anyS3 boundary not on a {111} plane, rather than the term‘incoherent twin’, which is used by some researchers torefer to a S3 boundary on a {112} plane).
The evolution of twin boundaries during annealing istherefore of interest for a wide range of problems.Although it is recognised that coherent twin boundarieshave a generally low mobility, very few data existconcerning the range of mobilities for non-coherent S3boundaries. In the present experiment, therefore, theauthors focus on analysing the movement of S3boundaries during annealing and using a sequential
1Laboratory for Advanced Materials, Department of Materials Science andEngineering, Tsinghua University, Beijing 100084, China2College of Materials Science and Engineering, Chongqing University,Chongqing 400044, China
*Corresponding author, email [email protected]
� 2010 Institute of Materials, Minerals and MiningPublished by Maney on behalf of the InstituteReceived 3 April 2009; accepted 17 April 2009DOI 10.1179/174328409X448493 Materials Science and Technology 2010 VOL 26 NO 2 197
annealing process, investigate the mobility of non-coherent twin boundaries as a function of theirmisorientation characteristics.
Experimental methodsThe starting material was 99?996% purity Ni cold rolledto a reduction of 96% (250 mm thickness). A sequentialannealing treatment was carried out at 600uC to giveaccumulated annealing times of 3?5, 23?5, 43?5, 83?5 and243?5 min (steps of 3?5, 20, 20, 40 and 160 min). Aftereach annealing step, the microstructure was investigatedusing a Leo 1530 scanning electron microscope equippedwith a fully automated electron backscatter diffraction(EBSD) analysis system (Channel 5, HKL Technology-Oxford Instruments, UK). For this, the followingprocedure was used. After the first annealing step(3?5 min), the rolling plane surface was ground to SiC-4000 followed by electropolishing in a 1 : 3 : 4 HClO4/CH3COOH/C2H5OH solution at 0uC/12 V for 45 s. Amicrohardness indent was then made on the polishedsurface for use as a reference mark to facilitatereidentification of the same area after each annealingstep. For all subsequent annealing steps, the sample wasenclosed in a glass vacuum tube (1026 Pa) containing0?3 atm Ar2/H2 to protect the sample surface.
Orientation maps were obtained using step size of0?8 mm over an area of 4006400 mm.2 For analysis oftexture, regions were classified as being either cube ornon-cube, based on a definition of 15u deviation to theideal {001}n100.orientation. In all the EBSD orienta-tion maps presented in this paper, cube orientations areshown in grey, and non-cube orientations are shown inwhite, with black pixels indicating non-indexed points.Cyan and black lines represent boundary misorienta-tions of .2u and .15u respectively. Coincident sitelattice boundaries were categorised according to theBrandon criterion (Dh,15u/S21/2),24 where Dh iscalculated from the total deviation between the observedmisorientation RAB and the nearest ideal CSL misor-ientation RS, i.e. from cos21 {K[Tr(RABRS
21)21]}.The authors focus our analysis in the present paperon S3n boundaries, which are illustrated in the figuresby red, magenta and green for S3, S9 and S27respectively.
Results
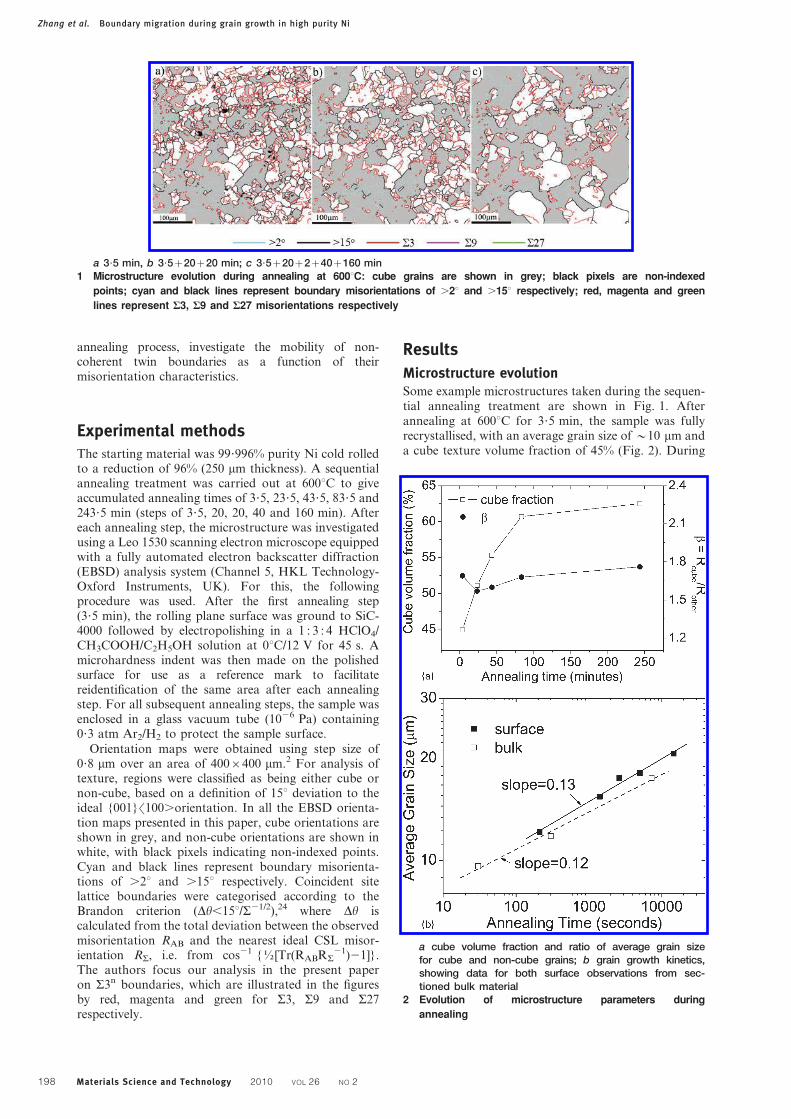
Microstructure evolutionSome example microstructures taken during the sequen-tial annealing treatment are shown in Fig. 1. Afterannealing at 600uC for 3?5 min, the sample was fullyrecrystallised, with an average grain size of y10 mm anda cube texture volume fraction of 45% (Fig. 2). During
a 3?5 min, b 3?5z20z20 min; c 3?5z20z2z40z160 min1 Microstructure evolution during annealing at 600uC: cube grains are shown in grey; black pixels are non-indexed
points; cyan and black lines represent boundary misorientations of .2u and .15u respectively; red, magenta and green
lines represent S3, S9 and S27 misorientations respectively
a cube volume fraction and ratio of average grain sizefor cube and non-cube grains; b grain growth kinetics,showing data for both surface observations from sec-tioned bulk material
2 Evolution of microstructure parameters during
annealing
Zhang et al. Boundary migration during grain growth in high purity Ni
198 Materials Science and Technology 2010 VOL 26 NO 2

subsequent annealing, some grains shrink, while somegrains grow. In some places, grains of new orientationappear, either from growth below the sample surface oras a result of twinning of existing grains. After the finalannealing step (243?5 min), the average grain size hascoarsened to 20 mm, and the cube volume fractionincreased to 63% (Fig. 2). During the entire annealingprocess, the average grain size for cube orientationgrains is 1?5–1?7 times larger than that for the non-cubegrains (Fig. 2a). This result is in agreement withprevious research,25 where it was shown that cubetexture fraction increases during grain growth due toadvantages both of size and volume fraction.
Previous in situ annealing experiments26 have demon-strated that events occurring at the surface and withinthe bulk of an annealed single phase aluminium alloywere similar, with similar final grain sizes in each case.To verify this for the material used in the current work,the grain growth kinetics as observed on the surface(obtained from the sequential annealing experiments)were compared with the kinetics for bulk volume(obtained from a separate series of annealed and thensectioned samples) using measurements of the grain sized from isothermal annealing data. The results are shownin Fig. 2b. For both cases (surface and bulk), the datapoints fall on straight lines with similar gradient. Themagnitude of the gradient is approximately equal tothe inverse of the grain growth exponent under the
assumption that d&d0.27 These results suggest that thesequential annealing results are not significantly affectedby any surface effects and thus confirm the validity ofthis technique as a means of studying of grain growth.
Evolution of boundary misorientationdistribution during annealingThe evolution of the grain boundary misorientationdistribution as calculated from the EBSD data is shownin Fig. 3a. Note that, for clarity in this figure, data forS3, S9 and S27 boundaries are excluded due to theirmuch higher length fractions. The increase in fractionduring annealing of low angle boundaries (,15u), with acorresponding decrease in the fraction of high angleboundaries, results from the increase in cube texturefraction during grain growth.
In order to analyse more carefully the evolution of theS3, S9 and S27 boundaries (S3n: n51, 2, 3), the changein length fraction for these boundaries are plottedseparately (calculated as the total length of each type ofS3n boundary divided by the total length of allboundaries with misorientation .2u). A slight reductionin the length density S3 boundaries is seen in the firstthree annealing steps, after which the value remainsfairly constant. This is consistent with the results thatthe fraction of S3 boundaries decreases during anneal-ing of textured copper samples.28,29
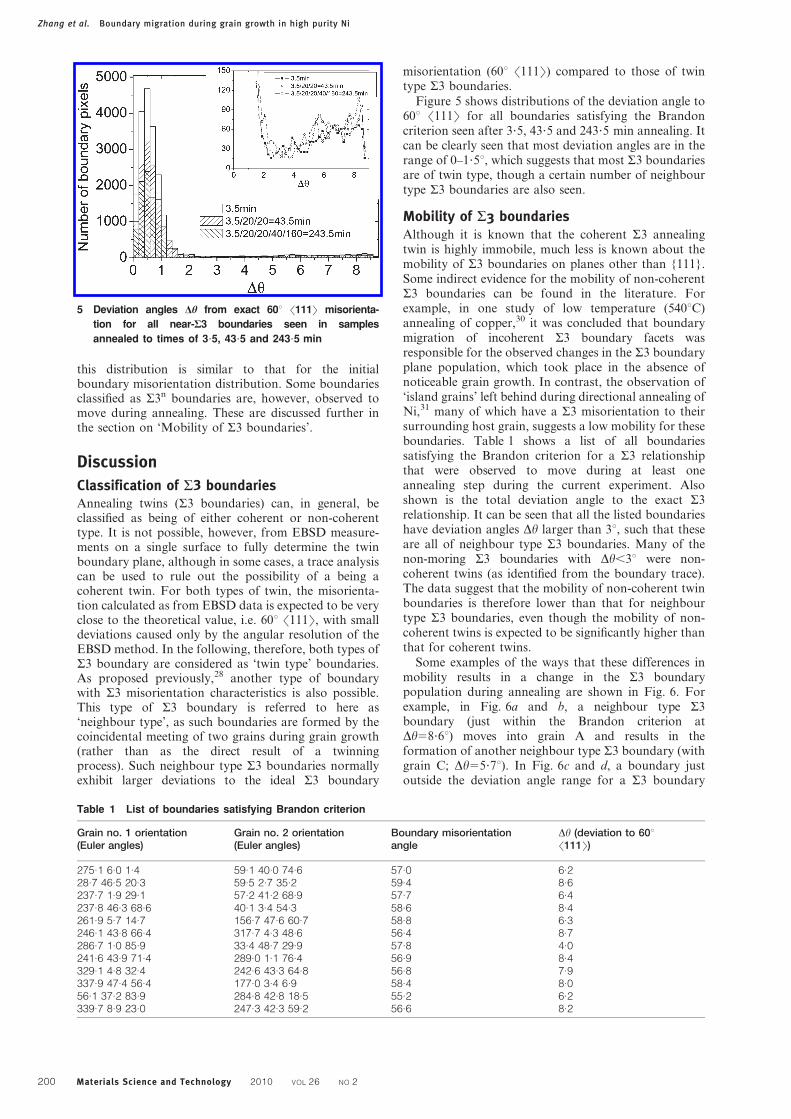
Misorientation distribution of movingboundariesFrom a direct comparison of the microstructureobserved at the sample surface after successive annealingsteps, those boundaries that move during each annealingstep can be identified and their misorientation char-acteristics can be calculated. Collated results for allboundaries observed to move during the annealingsequence are shown as a histogram (by number, ratherthan length) in Fig. 4 (the grey shaded area in the figurerepresents values below the 2u cutoff used for definitiona boundary in the EBSD data). It can be seen that noboundaries with misorientation angle ,4u are observedto move during annealing. It is important to note herethat 10–15 boundaries with misorientation between 2and 4u were seen in the examined region after each of thevarious annealing steps. Except for this very low angleboundary range and for twin boundaries, the shape of
a all values excluding S3n misorientations; b just valuesfor S3n (n51, 2 and 3) misorientations
3 Evolution of grain boundary misorientation distribu-
tions during annealing for total annealing times of 3?5,
43?5 and 243?5 min
4 Misorientation distribution for all boundaries observed
to migrate, collated from all annealing steps
Zhang et al. Boundary migration during grain growth in high purity Ni
Materials Science and Technology 2010 VOL 26 NO 2 199
this distribution is similar to that for the initialboundary misorientation distribution. Some boundariesclassified as S3n boundaries are, however, observed tomove during annealing. These are discussed further inthe section on ‘Mobility of S3 boundaries’.
Discussion
Classification of S3 boundariesAnnealing twins (S3 boundaries) can, in general, beclassified as being of either coherent or non-coherenttype. It is not possible, however, from EBSD measure-ments on a single surface to fully determine the twinboundary plane, although in some cases, a trace analysiscan be used to rule out the possibility of a being acoherent twin. For both types of twin, the misorienta-tion calculated as from EBSD data is expected to be veryclose to the theoretical value, i.e. 60u n111m, with smalldeviations caused only by the angular resolution of theEBSD method. In the following, therefore, both types ofS3 boundary are considered as ‘twin type’ boundaries.As proposed previously,28 another type of boundarywith S3 misorientation characteristics is also possible.This type of S3 boundary is referred to here as‘neighbour type’, as such boundaries are formed by thecoincidental meeting of two grains during grain growth(rather than as the direct result of a twinningprocess). Such neighbour type S3 boundaries normallyexhibit larger deviations to the ideal S3 boundary
misorientation (60u n111m) compared to those of twintype S3 boundaries.
Figure 5 shows distributions of the deviation angle to60u n111m for all boundaries satisfying the Brandoncriterion seen after 3?5, 43?5 and 243?5 min annealing. Itcan be clearly seen that most deviation angles are in therange of 0–1?5u, which suggests that most S3 boundariesare of twin type, though a certain number of neighbourtype S3 boundaries are also seen.
Mobility of S3 boundariesAlthough it is known that the coherent S3 annealingtwin is highly immobile, much less is known about themobility of S3 boundaries on planes other than {111}.Some indirect evidence for the mobility of non-coherentS3 boundaries can be found in the literature. Forexample, in one study of low temperature (540uC)annealing of copper,30 it was concluded that boundarymigration of incoherent S3 boundary facets wasresponsible for the observed changes in the S3 boundaryplane population, which took place in the absence ofnoticeable grain growth. In contrast, the observation of‘island grains’ left behind during directional annealing ofNi,31 many of which have a S3 misorientation to theirsurrounding host grain, suggests a low mobility for theseboundaries. Table 1 shows a list of all boundariessatisfying the Brandon criterion for a S3 relationshipthat were observed to move during at least oneannealing step during the current experiment. Alsoshown is the total deviation angle to the exact S3relationship. It can be seen that all the listed boundarieshave deviation angles Dh larger than 3u, such that theseare all of neighbour type S3 boundaries. Many of thenon-moring S3 boundaries with Dh,3u were non-coherent twins (as identified from the boundary trace).The data suggest that the mobility of non-coherent twinboundaries is therefore lower than that for neighbourtype S3 boundaries, even though the mobility of non-coherent twins is expected to be significantly higher thanthat for coherent twins.
Some examples of the ways that these differences inmobility results in a change in the S3 boundarypopulation during annealing are shown in Fig. 6. Forexample, in Fig. 6a and b, a neighbour type S3boundary (just within the Brandon criterion atDh58?6u) moves into grain A and results in theformation of another neighbour type S3 boundary (withgrain C; Dh55?7u). In Fig. 6c and d, a boundary justoutside the deviation angle range for a S3 boundary
5 Deviation angles Dh from exact 60u n111m misorienta-
tion for all near-S3 boundaries seen in samples
annealed to times of 3?5, 43?5 and 243?5 min
Table 1 List of boundaries satisfying Brandon criterion
Grain no. 1 orientation(Euler angles)
Grain no. 2 orientation(Euler angles)
Boundary misorientationangle
Dh (deviation to 60un111m)
275.1 6.0 1.4 59.1 40.0 74.6 57.0 6.228.7 46.5 20.3 59.5 2.7 35.2 59.4 8.6237.7 1.9 29.1 57.2 41.2 68.9 57.7 6.4237.8 46.3 68.6 40.1 3.4 54.3 58.6 8.4261.9 5.7 14.7 156.7 47.6 60.7 58.8 6.3246.1 43.8 66.4 317.7 4.3 48.6 56.4 8.7286.7 1.0 85.9 33.4 48.7 29.9 57.8 4.0241.6 43.9 71.4 289.0 1.1 76.4 56.9 8.4329.1 4.8 32.4 242.6 43.3 64.8 56.8 7.9337.9 47.4 56.4 177.0 3.4 6.9 58.4 8.056.1 37.2 83.9 284.8 42.8 18.5 55.2 6.2339.7 8.9 23.0 247.3 42.3 59.2 56.6 8.2
Zhang et al. Boundary migration during grain growth in high purity Ni
200 Materials Science and Technology 2010 VOL 26 NO 2
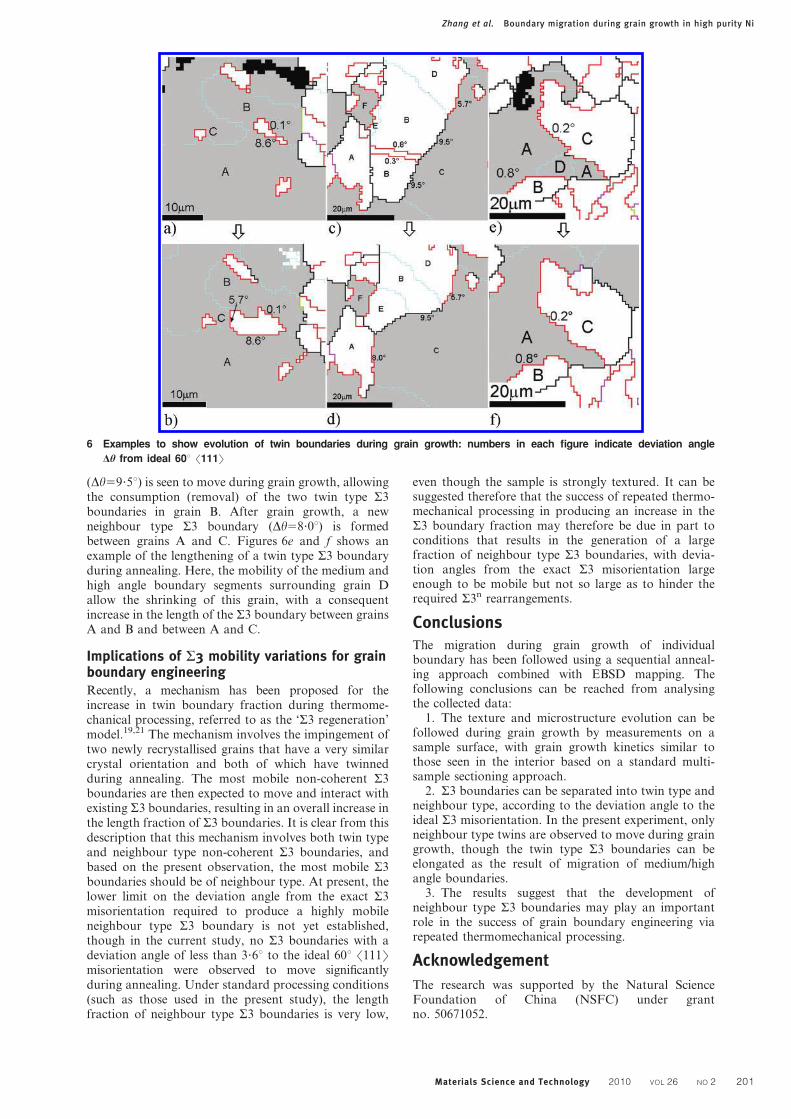
(Dh59?5u) is seen to move during grain growth, allowingthe consumption (removal) of the two twin type S3boundaries in grain B. After grain growth, a newneighbour type S3 boundary (Dh58?0u) is formedbetween grains A and C. Figures 6e and f shows anexample of the lengthening of a twin type S3 boundaryduring annealing. Here, the mobility of the medium andhigh angle boundary segments surrounding grain Dallow the shrinking of this grain, with a consequentincrease in the length of the S3 boundary between grainsA and B and between A and C.
Implications of S3 mobility variations for grainboundary engineeringRecently, a mechanism has been proposed for theincrease in twin boundary fraction during thermome-chanical processing, referred to as the ‘S3 regeneration’model.19,21 The mechanism involves the impingement oftwo newly recrystallised grains that have a very similarcrystal orientation and both of which have twinnedduring annealing. The most mobile non-coherent S3boundaries are then expected to move and interact withexisting S3 boundaries, resulting in an overall increase inthe length fraction of S3 boundaries. It is clear from thisdescription that this mechanism involves both twin typeand neighbour type non-coherent S3 boundaries, andbased on the present observation, the most mobile S3boundaries should be of neighbour type. At present, thelower limit on the deviation angle from the exact S3misorientation required to produce a highly mobileneighbour type S3 boundary is not yet established,though in the current study, no S3 boundaries with adeviation angle of less than 3?6u to the ideal 60u n111mmisorientation were observed to move significantlyduring annealing. Under standard processing conditions(such as those used in the present study), the lengthfraction of neighbour type S3 boundaries is very low,
even though the sample is strongly textured. It can besuggested therefore that the success of repeated thermo-mechanical processing in producing an increase in theS3 boundary fraction may therefore be due in part toconditions that results in the generation of a largefraction of neighbour type S3 boundaries, with devia-tion angles from the exact S3 misorientation largeenough to be mobile but not so large as to hinder therequired S3n rearrangements.
ConclusionsThe migration during grain growth of individualboundary has been followed using a sequential anneal-ing approach combined with EBSD mapping. Thefollowing conclusions can be reached from analysingthe collected data:
1. The texture and microstructure evolution can befollowed during grain growth by measurements on asample surface, with grain growth kinetics similar tothose seen in the interior based on a standard multi-sample sectioning approach.
2. S3 boundaries can be separated into twin type andneighbour type, according to the deviation angle to theideal S3 misorientation. In the present experiment, onlyneighbour type twins are observed to move during graingrowth, though the twin type S3 boundaries can beelongated as the result of migration of medium/highangle boundaries.
3. The results suggest that the development ofneighbour type S3 boundaries may play an importantrole in the success of grain boundary engineering viarepeated thermomechanical processing.
Acknowledgement
The research was supported by the Natural ScienceFoundation of China (NSFC) under grantno. 50671052.
6 Examples to show evolution of twin boundaries during grain growth: numbers in each figure indicate deviation angle
Dh from ideal 60u n111m
Zhang et al. Boundary migration during grain growth in high purity Ni
Materials Science and Technology 2010 VOL 26 NO 2 201
References1. A. Goyal, S. X. Ren, E. D. Specht, D. M. Kroeger, R. Feenstra,
D. Norton, M. Paranthaman, D. F. Lee and D. K. Christen:
Micron, 1999, 30, (5), 463–478.
2. Y. Zhou, A. Godfrey, W. Liu, Z. Han and Q. Liu: Physica C, 2003,
386C, 358–362.
3. B. de Boer, N. Reger, G. R. L. Fernandez, J. Eickemeyer,
P. Berberich, W. Prusseit, B. Holzapfel and L. Schultz: IEEE
Trans. Appl. Supercond., 2001, 11, (1), 3477–3480.
4. V. S. Sarma, J. Eickemeyer, A. Singh, L. Schultz and B. Holzapfel:
Acta Mater., 2003, 51, (16), 4919–4927.
5. J. Eickemeyer, D. Selbmann, R. Opitz, H. Wendrock, E. Maher,
U. Miller and W. Prusseit: Physica C, 2002, 372C, 814–817.
6. X. L. Li, W. Liu, A. Godfrey, D. Juul Jensen and Q. Liu: Acta
Mater., 2007, 55, (10), 3531–3540.
7. P. P. Bhattacharjee, R. K. Ray and A. Upadhyaya: Scr. Mater.,
2005, 53, (12), 1477–1481.
8. V. S. Sarma, J. Eickemeyer, L. Schultz and B. Holzapfel: Scr.
Mater., 2004, 50, (7), 953–957.
9. D. Dimos, P. Chaudhari and J. Mannhart: Phys. Rev. B, Condens.
Matter, 1990, 41B, (7), 4038–4049.
10. K. T. Aust and J. W. Rutter: Trans. AIME, 1959, 215, (1), 119–127.
11. G. A. Chadwick and D. A. Smith (eds.): ‘Grain boundary structure
and properties’, 388; 1976, London, Academic Press.
12. U. Erb, H. Gleiter and G. Schwitzgebel: Acta Metall. Mater., 1982,
30, (7), 1377–1380.
13. H. Gleiter and B. Chalmers: Prog. Mater. Sci., 1972, 16, 1–12.
14. U. Krupp, P. E. G. Wagenhuber, W. M. Kane and C. J.
McMahon, Jr: Mater. Sci. Technol., 2005, 21, (11), 1247–1254.
15. T. Watanabe: Res. Mech., 1984, 11, (1), 47–84.
16. P. Davies and V. Randle: Mater. Sci. Technol., 2001, 17, (6), 615–
626.
17. P. Lin, G. Palumbo, U. Erb and K. T. Aust: Scr. Metall. Mater.,
1995, 33, (9), 1387–1392.
18. E. M. Lehockey and G. Palumbo: Mater. Sci. Eng. A, 1997, A237,
(2), 168–172.
19. V. Randle: Acta Mater., 1999, 47, (15–16), 4187–4196.
20. V. Randle, Y. Hu, G. S. Rohrer and C. S. Kim: Mater. Sci.
Technol., 2005, 21, (11), 1287–1292.
21. V. Randle: Acta Mater., 2004, 52, (14), 4067–4081.
22. A. J. Schwartz and W. E. King: JOM, 1998, 50, (2), 50–55.
23. M. Kumar, A. J. Schwartz and W. E. King: Acta Mater., 2002, 50,
(10), 2599–2612.
24. D. G. Brandon: Acta Metall. Mater., 1966, 14, (11), 1479–1484.
25. Y. B. Zhang, A. Godfrey, M. A. Miodownik, W. Liu and Q. Liu:
Mater. Sci. Forum, 2007, 558–559, 1043–1050.
26. F. J. Humphreys, M. Ferry, C. P. Johnson and I. Brough: Textures
Microstruct., 1996, 26–27, 281–301.
27. F. J. Humphreys and M. Hatherly: ‘Recrystallization and related
annealing phenomena’, 2nd edn, 658; 2004, Oxford, Elsevier.
28. O. V. Mishin: J. Mater. Sci., 1998, 33, (21), 5137–5143.
29. O. V. Mishin and G. Gottstein: Mater. Sci. Eng. A, 1998, A249, (1–
2), 71–78.
30. V. Randle, P. Davies and B. Hulm: Philos. Mag. A, 1999, 79A, (2),
305–316.
31. J. Li and I. Baker: Mater. Sci. Eng. A, 2005, A392, (1–2), 8–22.
Zhang et al. Boundary migration during grain growth in high purity Ni
202 Materials Science and Technology 2010 VOL 26 NO 2