investigation of barley proteins interfacial properties ... · investigation of barley proteins‘...
TRANSCRIPT
Investigation of Barley Proteins‘ Interfacial Properties and Their Applications as Nanoscaled
Materials
by
Jingqi Yang
A thesis submitted in partial fulfillment of the requirements for the degree of
Doctor of Philosophy
in
Food Science and Technology
Department of Agricultural, Food and Nutritional Science
University of Alberta
©Jingqi Yang, 2016
ii
Abstract
The overall objective of this thesis research is to gain fundamental knowledge on the relationship
between barley protein molecular structures and their interfacial properties as well as to develop
barley protein value-added applications with special emphasis on their utilization as
nanoparticles for delivery systems of lipophilic bioactive compounds and electrospun nanofibers.
Firstly, the interfacial properties of barley proteins were investigated using B-hordein as a
representative. The results revealed that B-hordein had the ability to lower the air-water surface
tension to 45 mN/s within 2 h and formed an elastic-dominant film at the interface through
intermolecular β-sheets, which stabilized the interface. Compression at the interfacial B-hordein
film triggered the conformation and orientation changes of B-hordein. This resulted in the
occultation of the repetitive region of B-hordein from aqueous phase, leading to a low
digestibility in simulated gastric fluids. Based on this knowledge, barley protein based
nanoparticles were successfully developed by high pressure homogenization as a delivery system
for lipophilic bioactive compounds. At optimized processing conditions, nanoparticles with
regular spherical shape, smooth surface, size of 90-150 nm and zeta-potential of -35 mV were
obtained. Barley protein based nanoparticles had less than 2% of the encapsulated bioactive
compounds released after incubation in simulated gastric fluids for 2 h and the complete release
occurred in simulated intestinal fluids due to pancreatin degradation. Thus, they had potential to
protect the encapsulated bioactive compounds in harsh gastric environment, and completely
release them in the small intestine, which was the main adsorption site to improve absorption.
iii
Barley protein based nanoparticles were resistant to pepsin digestion, had low cytotoxicity and
could be internalized by Caco-2 cells. Thus, these barley protein nanoparticles showed strong
potential to be used as delivery systems of bioactive compounds for food, pharmaceutical and
cosmetic applications.
The third and fourth studies explored the opportunity of using barley protein based electrospun
fabrics for applications as electrode materials for supercapacitors. Hordein, the major fraction of
barley proteins, was electrospun into fibers with zein and lignin. The protein-lignin fibers were
then converted into carbon fibers by carbonization at 900°C under argon. The specific surface
area was 772 m2/g after activation by CO2 at 800°C for 3 h. These carbon fibers had 3D
hierarchical porous structure, high amount (4 atomic%) of nitrogen on the carbon surface and
graphene-like nanosheet structures. Such morphology and chemical composition allowed carbon
fibers with excellent capacitance of 240 F/g and 31.2 µF/cm2 in 6 M KOH with high cyclic
stability. To further increase the nitrogen content, in the last study, calcium acetate was added in
the electrospinning solution to form nanofibers with protein, sustain the fibrous structure and
generate pores during carbonization. Nitrogen-doped (7%) porous graphitic carbon fibers were
derived from protein-Ca2+
fibers through one-step pyrolysis, which was facile and
environmentally friendly. Moreover, it was the first time that highly ordered spherical graphitic
structure was observed in carbon fibers derived from biomass at relatively low temperature
(850°C) without catalysis and corrosive reagents. Based on their structure and chemical features,
these carbon fibers had a specific capacitance of 64 µF/cm2 and 98% retention after 5,000 cycles,

iv
which was ranking in the most excellent range of carbon fibers reported recently. These carbon
fibers have the potential to be used in industrial energy storage systems and personal electronic
products.
v
Preface
Chapter 2 of this thesis has been published as Jingqi Yang, Jun Hunag, Hongbo Zheng, Lingyun
Chen, ―Surface pressure affects B-hordein network formation at the air-water interface in
relation to gastric digestibility‖ in Colloids and Surfaces B: Biointerfaces 2015, 135, 784-792. I
was responsible for conducting experiments and analyzing data as well as preparing the
manuscript. Assistance was received from Jun Huang in obtaining atomic force microscopic
images. Drs. Hongbo Zeng and Lingyun Chen were supervisory authors. Dr. Zeng provided
accessible lab equipment including AFM and Langmuir-Blodgett trough. Dr. Lingyun Chen was
responsible for manuscript revision, editing and submission.
Chapter 3 of this thesis has been published as Jingqi Yang, Ying Zhou, Lingyun Chen,
―Elaboration and characterization of barley protein nanoparticles as an oral delivery system for
lipophilic bioactive compounds‖ in Food & Function 2014, 5, 92-101. I was responsible for
conducting experiments and analyzing data as well as preparing the manuscript. Ying Zhou
provided me assistance with the cell culture work. Dr. Lingyun Chen was supervisory author and
responsible for manuscript revision, editing and submission.
Chapter 4 of this thesis has been submitted as Jingqi Yang, Yixiang Wang, Jingli Luo, Lingyun
Chen, ―Creation of 3D hierarchical porous nitrogen-doped carbon fibers for supercapacitors from
plant protein and lignin electrospun fibers‖. I was responsible for conducting experiments and
analyzing data as well as preparing the manuscript. Yixiang Wang provided assistance in
protein-lignin electrospun fabric preparation and manuscript preparation. Drs. Jingli Luo and
vi
Lingyun Chen were supervisory authors. Dr. Luo provided assistance in electrochemical
properties measurements. Dr. Lingyun Chen was responsible for manuscript revision, editing and
submission.
Another manuscript based on Chapter 5 is to be submitted soon as Jingqi Yang, Yixiang Wang,
Jingli Luo and Lingyun Chen, ―Nitrogen-doped porous graphitic carbon fibers for supercapacitor
from plant proteins‖. I was responsible for conducting experiments and analyzing data as well as
preparing the manuscript. Yixiang Wang provided assistance in protein-lignin electrospun fabric
preparation and manuscript preparation. Drs. Jingli Luo and Lingyun Chen were supervisory
authors. Dr. Luo provided assistance in electrochemical properties measurements. Dr. Lingyun
Chen was responsible for manuscript revision, editing and submission.

vii
Acknowledgements
Firstly, I would like to give my sincere appreciation to Dr. Lingyun Chen, my supervisor for this
long-term PhD program. Without her support, guidance, encouragement and trust, this tough
journey would never be accomplished. I still remembered the telephone interview with Dr. Chen
in early 2010 when she offered me the opportunity to come to Canada and pursue my dream of
doing research. From that point, my life was completely changed. Dr. Chen provides me with
abundance of help on my way to become a qualified PhD student and a more mature researcher. I
also would like to thank Drs. Feral Temelli and Thava Vasanthan for serving as supervisory
committee members. They give me lots of patience, support and encouragement in these
unforgettable five years. I am also grateful to Drs. Weixing Chen and Ashraf Ismail for their help
with my thesis and final exam.
Also, I would like to thank my parents and my husband. I would like to say many thanks to my
parents who love me unconditionally and give me endless support. My husband, Victor Liu, is
always my sunshine. Thank you for going through all the ups and downs together with me.
Victor makes my life bright and colorful. I am very happy that we will have our first baby Yuzhi
Liu in early 2016.
Special thanks also go to my lovely group members. I am so grateful to have all of them in my
life. They are all genius in doing research and they are great friends in daily life. It is my honor
and pleasure to work with these excellent people. All the joyful moments we share together are
unforgettable.
viii
Table of Contents
Abstract .......................................................................................................................................... ii
Preface ............................................................................................................................................ v
Acknowledgements ..................................................................................................................... vii
Table of Contents ....................................................................................................................... viii
List of Tables ............................................................................................................................... xv
List of Figures ............................................................................................................................. xvi
List of Abbreviations and Symbols ........................................................................................... xx
Chapter 1 ....................................................................................................................................... 1
Literature Review ......................................................................................................................... 1
1.1 Barley grains ......................................................................................................................... 1
1.2 Barley protein........................................................................................................................ 2
1.2.1 Overview of barley protein ............................................................................................ 2
1.2.2 Amino acid composition of barley proteins ................................................................... 3
1.2.3 Structure of barley proteins ............................................................................................ 6
1.2.4 Nutritive value and functionalities of barley proteins .................................................... 8
1.3 Interfacial properties of barley proteins and their applications .......................................... 11
ix
1.3.1 Protein behaviour at the interface ................................................................................ 12
1.3.2 Interfacial tension......................................................................................................... 13
1.3.3 Interfacial rheology of protein films ............................................................................ 15
1.3.4 Protein conformational changes at the interface .......................................................... 18
1.4 Protein electrospun nanofibers ............................................................................................ 20
1.4.1 Electrospinning technique ............................................................................................ 20
1.4.2 Protein electrospun nanofibers ..................................................................................... 24
1.4.3 Applications of electrospun nanofibers ....................................................................... 26
1.5 Applications of protein based electrospun nanofibers as carbon based supercapacitor ..... 27
1.5.1 Supercapacitors ............................................................................................................ 27
1.5.2 Design of carbon materials for supercapacitor electrodes ........................................... 33
1.5.3 Biomaterials as electrode materials for supercapacitor ............................................... 38
1.6 Hypothesis and objectives................................................................................................... 39
1.6.1 Summary of the key justifications of this research ...................................................... 39
1.6.2 Hypotheses ................................................................................................................... 42
1.6.3 Objectives .................................................................................................................... 43
Chapter 2 ..................................................................................................................................... 45
x
Surface Pressure Affects B-hordein Network Formation at the Air-Water Interface in
Relation to Gastric Digestibility ................................................................................................ 45
2.1 Introduction ......................................................................................................................... 45
2.2 Materials and methods ........................................................................................................ 49
2.2.1 Materials ...................................................................................................................... 49
2.2.2 B-hordein extraction .................................................................................................... 49
2.2.3 Surface tension ............................................................................................................. 50
2.2.4 Interfacial dilatational rheology ................................................................................... 50
2.2.5 Interfacial shear rheology ............................................................................................ 51
2.2.6 Surface pressure – area (π-A) isotherm and interfacial protein film deposition .......... 51
2.2.7 In situ digestion ............................................................................................................ 53
2.2.8 Atomic force microscopy (AFM) ................................................................................ 53
2.2.9 Polarization modulation - infrared reflection absorbance Spectroscopy (PM-IRRAS)54
2.2.10 Statistical analysis ...................................................................................................... 55
2.3 Results and discussion ........................................................................................................ 55
2.3.1 The interfacial properties of B-hordein ........................................................................ 55
2.3.2 B-hordein orientation and conformation at the interface by PM-IRRAS .................... 62
xi
2.3.3 The morphology of B-hordein at the air-water interface ............................................. 69
2.4 Conclusions ......................................................................................................................... 73
Chapter 3 ..................................................................................................................................... 74
Elaboration and Characterization of Barley Protein Nanoparticles as an Oral Delivery
System for Lipophilic Bioactive Compounds ........................................................................... 74
3.1 Introduction ......................................................................................................................... 74
3.2 Materials and methods ........................................................................................................ 76
3.2.1 Materials ...................................................................................................................... 76
3.2.2 Nanoparticle preparation .............................................................................................. 78
3.2.3 Nanoparticle characterizations ..................................................................................... 78
3.2.4 In vitro protein matrix degradation .............................................................................. 80
3.2.5 In vitro release properties of barley protein nanoparticles ........................................... 81
3.2.6 In vitro cytotoxicity and Caco-2 cell uptake ................................................................ 82
3.2.7 Statistical analysis ........................................................................................................ 84
3.3 Results and discussion ........................................................................................................ 84
3.3.1 Barley protein nanoparticle preparation ....................................................................... 84
3.3.2 Nanoparticle characterization ...................................................................................... 94

xii
3.3.3 In vitro release and degradation in the simulated gastrointestinal tract ....................... 97
3.3.4 Cytotoxicity and cell uptake ...................................................................................... 102
3.4 Conclusions ....................................................................................................................... 105
Chapter 4 ................................................................................................................................... 107
Creation of 3D Hierarchical Porous Nitrogen-Doped Carbon Fibers for Supercapacitors
from Plant Protein and Lignin Electrospun Fibers ............................................................... 107
4.1 Introduction ....................................................................................................................... 107
4.2 Materials and methods ...................................................................................................... 111
4.2.1 Materials .................................................................................................................... 111
4.2.2 Preparation of plant protein-lignin electrospun fibers ............................................... 111
4.2.3 Carbonization and activation ..................................................................................... 112
4.2.4 Fiber size and morphology observation ..................................................................... 113
4.2.5 Fiber textural characterization and chemical analysis ............................................... 113
4.2.6 Electrochemical performances ................................................................................... 114
4.2.7 Statistical analysis ...................................................................................................... 115
4.3 Results and discussion ...................................................................................................... 116
4.3.1 Morphology of carbon fibers ..................................................................................... 116
xiii
4.3.2 Morphology and porous texture of L5P5-900-ACT .................................................. 119
4.3.3 Chemical characterization of L5P5-900-ACT. .......................................................... 124
4.3.4 Electrochemical performance of L5P5-900-ACT. ..................................................... 127
4.4 Conclusions ....................................................................................................................... 132
Chapter 5 ................................................................................................................................... 133
Plant proteins - nitrogen-doped porous graphitic carbon fibers for supercapacitor ......... 133
5.1 Introduction ....................................................................................................................... 133
5.2 Materials and methods ...................................................................................................... 137
5.2.1 Materials .................................................................................................................... 137
5.2.2 Preparation of plant protein-calcium electrospun fabrics .......................................... 137
5.2.3 Carbonization ............................................................................................................. 138
5.2.4 Fiber size and morphology observation ..................................................................... 139
5.2.5 Fiber textural characterization and chemical analysis ............................................... 139
5.2.6 Electrochemical performance in 6 M KOH ............................................................... 140
5.2.7 Statistical analysis ...................................................................................................... 141
5.3 Results and discussion ...................................................................................................... 142
5.3.1 Morphologies of the plant protein-calcium fibers ..................................................... 142
xiv
5.3.2 Morphologies of the carbon samples derived from protein-calcium fibers ............... 144
5.3.3 Chemical characterization and porous structure of P-10%Ca-CL ............................. 147
5.3.4 Electrochemical properties......................................................................................... 155
5.4 Conclusions ....................................................................................................................... 160
Chapter 6 ................................................................................................................................... 161
Final Remarks ........................................................................................................................... 161
6.1 Summary and conclusions ................................................................................................ 161
6.1.1 Conclusions of study 1 ............................................................................................... 161
6.1.2 Conclusions of study 2 ............................................................................................... 163
6.1.3 Conclusions of study 3 ............................................................................................... 164
6.1.4 Conclusions of study 4 ............................................................................................... 165
6.2 Significance of this work .................................................................................................. 166
6.3 Recommendations for future work ................................................................................... 167
References .................................................................................................................................. 169
Appendix A1 .............................................................................................................................. 195
Appendix A2 .............................................................................................................................. 197

xv
List of Tables
Table 1-1 Amino acid composition of barley protein fractions (mol%) ………………………….4
Table 1-2 Amino acid compositions of hordein fractions (mol%)………………………………..5
Table 2-1 Percentage of the deconvoluted amine I band components and their corresponding
secondary structures of B-hordein at air-water interface……………………………………67
Table 3-1 Formation of stable nanoparticle suspension…………………………………………90
Table 3-2 Surface oil content, encapsulation efficiency, loading capacity and zeta potential for 4
selected samples prepared with 16kpsi…………………………………………………...…96
Table 4-1 Comparison of the specific capacitances of some carbon fibers materials reported
previously…………………………………………………………………………………..131
Table 5-1 Element composition information of plant protein-calcium derived carbon
samples……………………………………………………………………………………..148
xvi
List of Figures
Figure 1-1 Simplified structure of orthologous B-hordeins………………………………………6
Figure 1-2 SEM image of orientated electrospun hordein/zein fibers. Scale bar: 5µm………….21
Figure 1-3 Schematic diagram of the set up of horizontal electrospinning apparatus…………...22
Figure 2-1 Image of LB trough machine setup…………………………………………………..47
Figure 2-2 (A) Time evolution of the surface pressure of B-hordein with different concentrations
at the air-water interface; (B) time evolution of the interfacial dilatational storage modulus E‘
and loss modulus E‘‘; (C) time evolution of the interfacial shear storage modulus G‘ and the
tan(δ) for 1.0 mg/mL B-hordein solution; (D) plot of surface pressure-molecule area (π-A)
isotherms of B-hordein solution. Inset is the compression-surface pressure (β-π) plot for
B-hordein……………………………………………………………………………………57
Figure 2-3 PM-IRRAS spectra of B-hordein at the air-water interface: 10 mN/m, 20 mN/m and
30 mN/m. Inset shows the deconvolution of amide I band………………………………….65
Figure 2-4 AFM images of the B-hordein films formed at 10, 20 and 30 mN/m after incubated at
pH 7.0 (room temperature), pH 2.0 (37˚C) and in SGF (pH 2.0, 37˚C and pepsin). The scale
bars: 100 nm…………………………………………………………………………………70
Figure 3-1 (A) Photograph of barley protein nanoparticles; (B) TEM image of barley protein
nanoparticle (2 wt% protein and 2.5% v/v oil) prepared at 16 kpsi with 14 kx magnification;
(C) same sample observed with 110kx magnification………………………………………85
Figure 3-2 Effect of number of recirculation on the mean particle size of samples produced with
2 wt% barley protein and 2.5% v/v oil. The inserted figure showed the effect of number of
recirculation on particle size distribution as indicated by PDI………………………….…..7

xvii
Figure 3-3 Effect of homogenizing pressure on the mean particle size of samples produced with
2 wt% and 3 wt% barley proteins and 2.5% v/v oil by 6 passes. The inserted figure showed
the effect of homogenizing pressure on particle size distribution as indicated by PDI……..89
Figure 3-4 Effect of protein concentration and oil content on the mean particle size of samples
produced at 12 kpsi by 6 passes. The inserted figure showed the effect of protein
concentration and oil content on particle size distribution as indicated by PDI…………….92
Figure 3-5 Effect of protein concentration and oil content on the mean particle size of samples
produced at 16 kpsi using 6 passes. The inserted figure showed the effect of protein
concentration and oil content on particle size distribution as indicated by PDI…………….93
Figure 3-6 Mean particle size changes of 4 samples prepared at 16kpsi in 15 days…………….97
Figure 3-7 Release profile of cumulated free fatty acid from barley protein nanoparticles (2%
protein and 2.5% oil) in SIF for 8 h. The inset showed the cumulated release percentage of
β-carotene from the barley protein nanoparticles incubated in SGF for 2 h………………...98
Figure 3-8 TEM images of nanoparticle morphology changes during digestion in SGF and SIF
for different time: (A) original nanoparticles prepared with 2%protein & 2.5%oil, (B) in
SGF with pepsin for 20min, (C) in SGF with pepsin for 1h, (D) in SIF with pancreatin for 1
h, (E) in SIF with pancreatin for 3 h and (F) in SIF with pancreatin for 7 h. Scale bars: 200
nm……………………...………………………………………………………………..…100
Figure 3-9 Percentage of cell viability evaluated by MTT assay on Caco-2 cells treated with
increasing concentration of barley protein nanoparticles for 6h and with pancreatin digested
nanoparticles for 1 to 6 h respectively………………….………………………………….103
Figure 3-10 Confocal micrographs of Caco-2 cells after 6 h incubation with (A) initial
nanoparticles; (B) particles after 1 h digestion in SGF with pepsin; (C) to (E) particles after
another 1, 3 and 6 h digestion in SIF with pancreatin respectively……………..…………104
xviii
Figure 4-1 SEM images of carbon samples derived from plant protein and plant protein-lignin
electrospun fibers at 750 and 900°C. Scale bars: 5 µm…………………...……………….118
Figure 4-2 FE-SEM (A and B) and HR-TEM (C and D) images of L5P5-900-ACT sample….121
Figure 4-3 Nitrogen adsorption and desorption isotherm and pore size distribution (inset) of
L5P5-900-ACT…………………………………………………………………………….124
Figure 4-4 XRD pattern (A), Raman spectrum (B) and XPS spectra (C, D & E) of
L5P5-900-ACT sample. D and E are the deconvoluted N 1s and C 1s peaks,
respectively………………………………………………………………...……………....125
Figure 4-5 (A) CV curves of carbon fibers at scan rate of 50 mV/s; (B) CV curves of
L5P5-900-ACT at different scan rates from 10 to 100 mV/s; (C) galvanostatic
charge-discharge curves of carbon fibers at current density of 0.5 A/g; (D) specific
capacitance of L5P5-900 and L5P5-900-ACT as a function of current density; (E) EIS
Nyquist plots of L5P5-900-ACT (inset is the high and medium frequency regions); (F)
cyclic stability of L5P5-900-ACT at current density of 4 A/g…………………………….129
Figure 5-1 (A)-(E) SEM images of original plant protein-calcium electrospuns fibers; (F) the
mean fiber diameter of 5 original fibers. Scale bars: 5 µm…………...……………………143
Figure 5-2 SEM images of carbon samples derived from plant protein-calcium electrospun fibers
at 850°. Scale bars: 2.5 µm……………………………………………………...…………146
Figure 5-3 XPS of P-10%Ca-CL sample….……………………………………………………148
Figure 5-4 TEM images of ground P-10%Ca-CL carbon nanofibers of different magnifications.
Inset of Figure 5-4A is the magnified image of the selected area…………………………151
Figure 5-5 XRD pattern (A) and Raman spectroscopy (B) of P-10%Ca-CL carbon
nanofibers………………………………………………………………………………….152

xix
Figure 5-6 Nitrogen adsorption and desorption isotherm and pore size distribution (inset) of
P-10%Ca-CL……………………………………………………………………………….155
Figure 5-7 (A) CV curves of carbon samples at scan rate of 50 mV/s; (B) CV curves of
P-10%Ca-CL at different scan rates from 10 to 150 mV/s; (C) galvanostatic
charge-discharge curves of P-10%Ca-CL at different scan rates from 0.5 to 8 A/g; (D)
specific capacitance of P-10%Ca-CL and (E) cyclic stability of and capacitance retention of
P-10%Ca-CL at current density of 10 A/g; (F) EIS Nyquist plots of P-10%Ca-CL………157
xx
List of Abbreviations and Symbols
AFM Atomic force microscopy
ANOVA Analysis of variance
ATR Attenuated total reflectance
CA Calcium acetate
CLSM Confocal laser scanning microscopy
CNF Carbon nanofiber
CV Cyclic voltammetry
Cys Cysteine
DAPI 4‘,6-diamidino-2-phenylindole
DMF Dimethylformamide
DMEM Dulbecco‘s modified Eagle's medium
DMSO Dimethyl sulfoxide
E‘ Interfacial dilatational storage modulus
E‘‘ Interfacial dilatational loss modulus
EDLC Electric double layer capacitor
EDTA Ethylenediaminetetraacetic acid
EE Encapsulation efficiency
EIS Electrochemical impedance spectroscopy
FBS Fetal bovine serum
FE-SEM Field emission-scanning electron microscope
FTIR Fourier transform infrared
G‘ Interfacial shear storage modulus
G‘‘ Interfacial shear loss modulus
GI Gastrointestinal
Gln Glutamine
xxi
Glx Glutamine or glutamic acid
HBSS Hanks' balanced salt solution
HEPES 4-(2-hydroxyethyl)-1-piperazineethanesulfonic acid
HR-TEM High resolution-transmission electron microscopy
Ile Isoleucine
IRRAS Infrared absorption reflection spectroscopy
LC Loading capacity
Leu Leucine
Lys Lysine
MTT 3-(4,5-Dimethylthiazol-2-yl)-2,5-Diphenyltetrazolium Bromide
NEAA Non-essential amino acid
NMP N-methyl-2-pyrrolidone
PAN Polyacrylonitrile
PANI Polyaniline
PBS Phosphate-buffered saline
PDI Polydispersity index
Phe Phenylalanine
pI Isoelectric point
PM-IRRAS Polarization modulation- infrared absorption reflection spectroscopy
PPy Polypyrrol
Pro Proline
PVDF Polyvinylidene fluoride
RI Refractive index
RMS Root mean square
SDS-PAGE Sodium dodecyl sulfate polyacrylamide gel electrophoresis
SEM Scanning electron microscope
xxii
SGF Simulated gastric fluid
SIF Simulated intestinal fluid
t Time
TEM Transmission electrical microscopy
TFA Trifluoroacetic acid
TGA Thermogravimetric analysis
Trp Tryptophan
UV Ultraviolet
Val Valine
XPS X-ray photoelectron spectroscopy
XRD X-ray powder diffraction
α-Lac α-Lactalbumin
β-Lac β-Lactoglobulin
δ Phase lag
Dielectric constant
Wavelength
Surface pressure
Surface tension
1
Chapter 1
Literature Review
1.1 Barley grains
Barley (Hordeum vulgare L.) is the fourth most important crop on earth after wheat, rice and
corn. Barley is adapted to a wide range of natural climate and soil conditions. European Union,
Russia and Canada are the major producers of barley, providing about 100 million tons of barley
per year.1, 2
Alberta produces more than 5 million tons of barley per year, which contributes more
than half of the barley production in Canada. Livestock feeding and malt products are the main
consumptions of barley production (about 80-90%) in many western countries. Human
consumption of Alberta barley is rather limited.2 Recently, barley has attracted great attention
since the high amount of dietary fibers in grains, especially β-glucan has been reported to show
health-promoting benefits, such as controlling diabetes, reducing cholesterol level and the risk of
cardiovascular diseases.3, 4
Despite the large production and the potential health benefits,
value-added applications of barley in food and non-food industries have not been sufficiently
developed.
Barley grain kernel has a spindle like shape, which is thicker in the center and tapered towards
two ends. It consists of two parts, the caryopsis and the hull. Some hullless varieties have been
developed. The caryopsis is comprised of the pericarp, integuments, aleurone layer, endosperm
and germ/embryo.2 After removing the husk, endosperm, aleurone layer and the embryo are the
2
three major tissues. The major components of barley grain are starch (60-64% of dry weight),
protein (8-15%), arabinoxylans (4.4-7.8%), β-glucans (3.6-6.1%), lipids (2-3%) and minerals
(3%).2
1.2 Barley protein
1.2.1 Overview of barley protein
Proteins are the second major component of dry barley grains. Due to the high production every
year, barley is an affordable and abundant source of food proteins. The content and profile of
proteins in barley seeds vary among different cultivars and are affected by the environmental
conditions during growth, such as temperature, sunshine and soil conditions.5 According to the
classification method developed by Osborne, barley seed proteins can be classified into 4
categories, i.e. albumin, globulin, hordein and glutelin, based on their different solubilities.
Albumins and globulins are mainly located in the bran and embryo, thus, called cytoplasmic
proteins. They comprise 3-4% and 10-20% of the total seed proteins, respectively. Albumins are
water soluble while globulins can be extracted by dilute salt buffer (0.5M NaCl). Hordeins, the
prolamin in barley grain, are soluble in 70% ethyl alcohol and comprise about 30-50% of total
barley proteins. Glutelins are soluble in dilute acid/alkali, which are the leftover fraction after
sequential extraction by water, dilute salt solution and 70% ethanol. Some recent studies reported
that glutelins were considered as a group of the prolamin (hordein for barley) family due to their
similar gene sequences, biosynthesis mechanism and also the physiological functions.6 Hordeins
3
and glutelins are mainly found in the starchy endosperm, together contributing to about 70-90%
of the total dry seed proteins.
Hordeins are the major barley storage proteins, which can be classified into 5 fractions based on
their electrophoretic mobilities and amino acid compositions: A-hordein, B-hordein (70-90%),
C-hordein (10-20%), D- and γ-hordein (less than 5%).7 A-hordeins are a group of low molecular
weight polypeptides (Mw<15 kDa). B hordeins are the main fraction of hordein and can be
separated into 3 distinguishable subtypes, B1-, B2- and B3-hordeins. Their molecular weights
range from 34 to 46 kDa. As the second major hordein fraction, C-hordeins appear as monomers
with 55 kDa. D-hordeins are larger than 100 kDa and belong to high molecular weight prolamin
family. D-hordein molecules are composed of two or more polypeptides cross-linked by
intra-chain disulfide bonds.7 γ-Hordeins are less than 20 kDa and composed of two classes, γ-
and γ3-hordeins.8
1.2.2 Amino acid composition of barley proteins
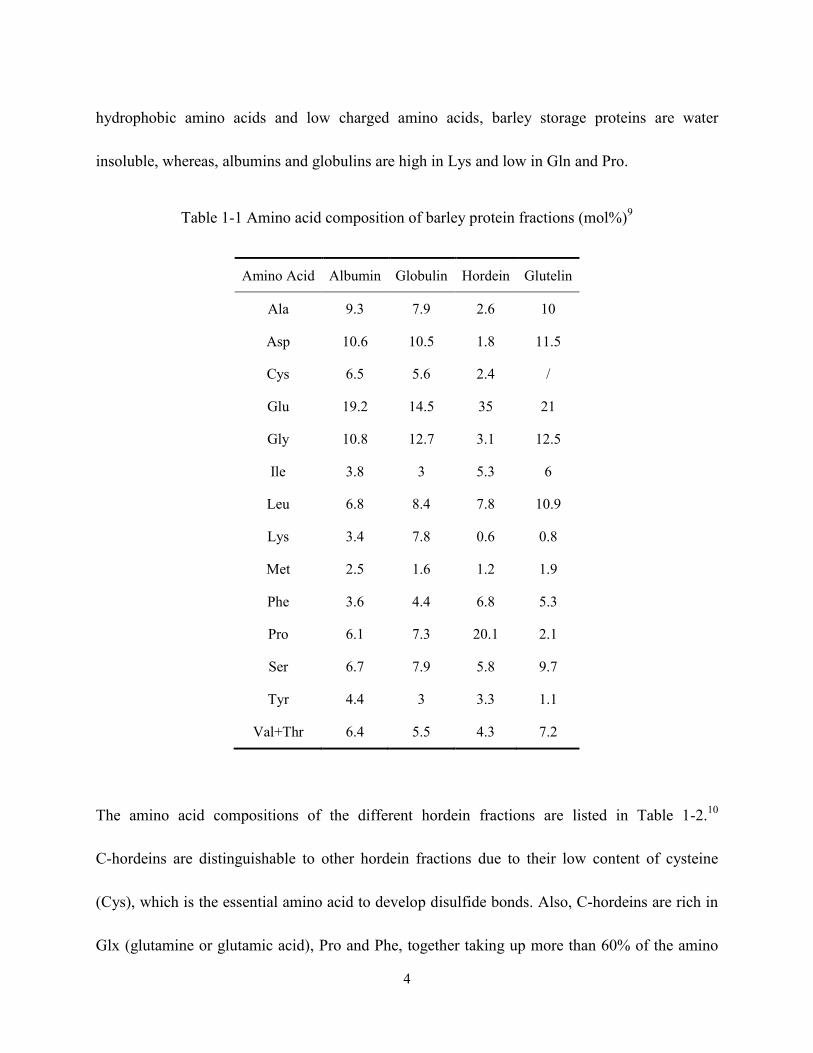
The amino acid compositions of the 4 barley protein fractions are shown in Table 1-1.9 Barley
proteins are recognized as incomplete proteins for food and feed applications because of the low
content of lysine (Lys) and tryptophan (Trp) in the major storage proteins. Both hordeins and
glutelins are rich in glutamine (Gln), proline (Pro) and hydrophobic amino acids such as valine
(Val), leucine (Leu), isoleucine (Ile) and phenylalanine (Phe). Due to the large amount of
4
hydrophobic amino acids and low charged amino acids, barley storage proteins are water
insoluble, whereas, albumins and globulins are high in Lys and low in Gln and Pro.
Table 1-1 Amino acid composition of barley protein fractions (mol%)9
Amino Acid Albumin Globulin Hordein Glutelin
Ala 9.3 7.9 2.6 10
Asp 10.6 10.5 1.8 11.5
Cys 6.5 5.6 2.4 /
Glu 19.2 14.5 35 21
Gly 10.8 12.7 3.1 12.5
Ile 3.8 3 5.3 6
Leu 6.8 8.4 7.8 10.9
Lys 3.4 7.8 0.6 0.8
Met 2.5 1.6 1.2 1.9
Phe 3.6 4.4 6.8 5.3
Pro 6.1 7.3 20.1 2.1
Ser 6.7 7.9 5.8 9.7
Tyr 4.4 3 3.3 1.1
Val+Thr 6.4 5.5 4.3 7.2
The amino acid compositions of the different hordein fractions are listed in Table 1-2.10
C-hordeins are distinguishable to other hordein fractions due to their low content of cysteine
(Cys), which is the essential amino acid to develop disulfide bonds. Also, C-hordeins are rich in
Glx (glutamine or glutamic acid), Pro and Phe, together taking up more than 60% of the amino
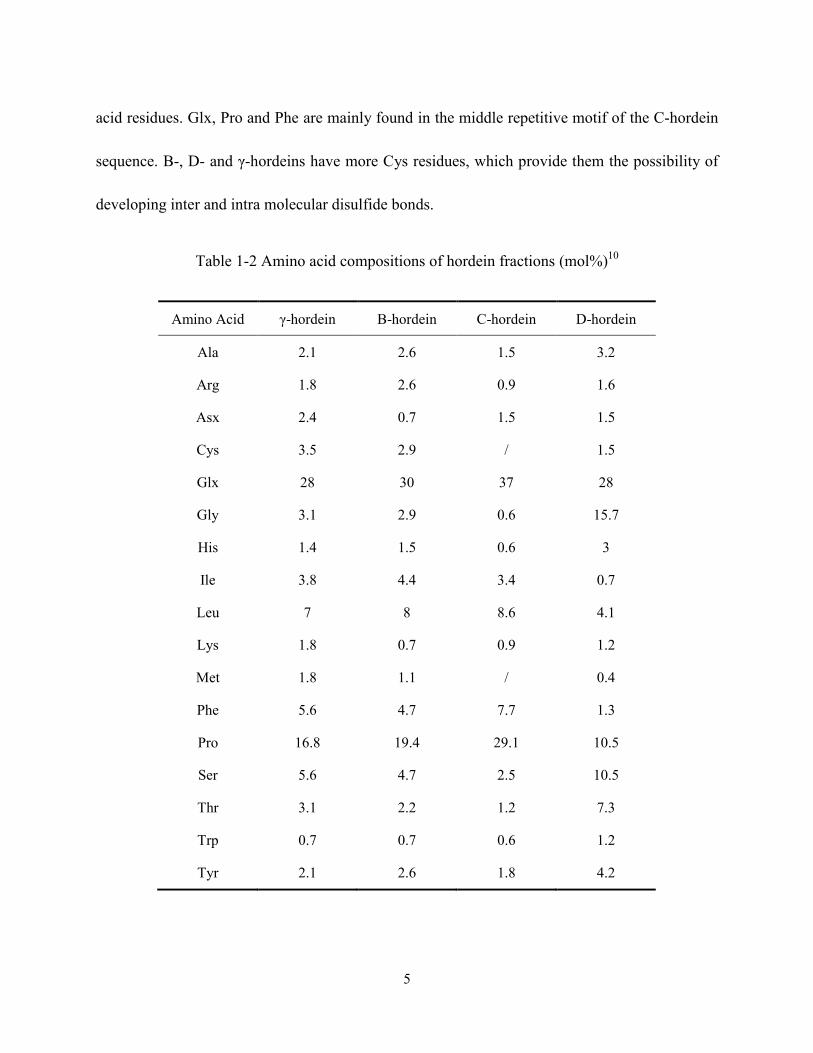
5
acid residues. Glx, Pro and Phe are mainly found in the middle repetitive motif of the C-hordein
sequence. B-, D- and γ-hordeins have more Cys residues, which provide them the possibility of
developing inter and intra molecular disulfide bonds.
Table 1-2 Amino acid compositions of hordein fractions (mol%)10
Amino Acid γ-hordein B-hordein C-hordein D-hordein
Ala 2.1 2.6 1.5 3.2
Arg 1.8 2.6 0.9 1.6
Asx 2.4 0.7 1.5 1.5
Cys 3.5 2.9 / 1.5
Glx 28 30 37 28
Gly 3.1 2.9 0.6 15.7
His 1.4 1.5 0.6 3
Ile 3.8 4.4 3.4 0.7
Leu 7 8 8.6 4.1
Lys 1.8 0.7 0.9 1.2
Met 1.8 1.1 / 0.4
Phe 5.6 4.7 7.7 1.3
Pro 16.8 19.4 29.1 10.5
Ser 5.6 4.7 2.5 10.5
Thr 3.1 2.2 1.2 7.3
Trp 0.7 0.7 0.6 1.2
Tyr 2.1 2.6 1.8 4.2
6
1.2.3 Structure of barley proteins
Though hundreds of barley proteins have been identified, only a few of them has been
characterized and their structures have not been clearly revealed. B and C hordeins are the most
intensively explored barley proteins.
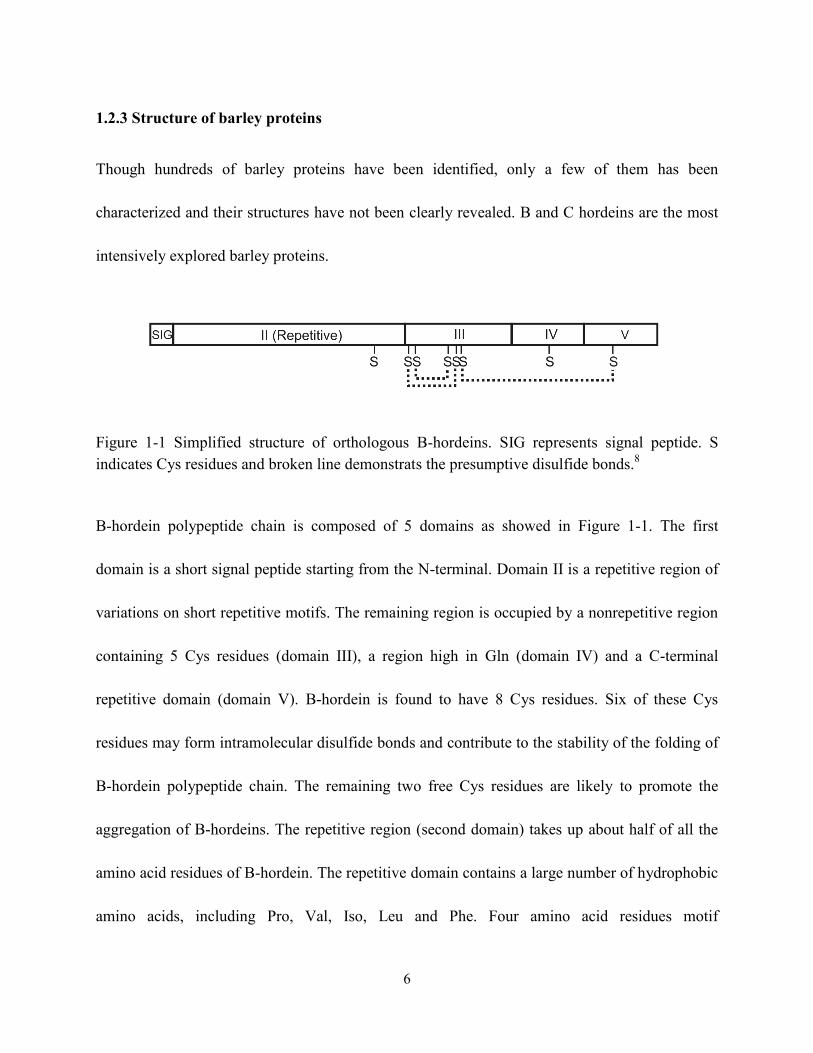
Figure 1-1 Simplified structure of orthologous B-hordeins. SIG represents signal peptide. S
indicates Cys residues and broken line demonstrats the presumptive disulfide bonds.8
B-hordein polypeptide chain is composed of 5 domains as showed in Figure 1-1. The first
domain is a short signal peptide starting from the N-terminal. Domain II is a repetitive region of
variations on short repetitive motifs. The remaining region is occupied by a nonrepetitive region
containing 5 Cys residues (domain III), a region high in Gln (domain IV) and a C-terminal
repetitive domain (domain V). B-hordein is found to have 8 Cys residues. Six of these Cys
residues may form intramolecular disulfide bonds and contribute to the stability of the folding of
B-hordein polypeptide chain. The remaining two free Cys residues are likely to promote the
aggregation of B-hordeins. The repetitive region (second domain) takes up about half of all the
amino acid residues of B-hordein. The repetitive domain contains a large number of hydrophobic
amino acids, including Pro, Val, Iso, Leu and Phe. Four amino acid residues motif

7
(Pro-Phe/Tyr-Pro-Gln) is a common repeat motif pattern found within the repetitive domain.8
Pro is a unique amino acid since its side chain is cyclised back onto the backbone amide position.
The backbone φ dihedral angle is restricted to a limited range around -65°. Meanwhile, the
bulkiness of the N-CH2 group leads to space restriction on the conformation of Pro residue,
making it unfavourable to form α-helix. Since the amide proton is replaced by a CH2 group, Pro
residue is not able to be a hydrogen bond donor. Based on the knowledge gained from other
proline-rich tandomly repetitive proteins, such as the salivary proline-rich proteins and elastin, B
hordein polypeptide chains are more likely to be rigid, extended and have a higher chance to
form β-conformation.11
The repetitive appearance of aromatic amino acids, such as Tyr, Phe and
Trp in domain II is much more frequent than in other domains. Large amount of aromatic amino
acids may contribute to the stability of protein conformation and development of inter/intra
protein interactions.12
The third domain contains about 5 Cys residues, which may participate in
the development of inter/intra protein disulfide bonds. Moreover, within domain IV, about 50%
of amino acid residues are Gln, which result in a relatively hydrophilic nature.8 However, the
conformation of B-hordein is still insufficiently explored. Gaining knowledge in this area is
important to support its further application development.
Compared to B-hordein, the structure and conformation of C-hordein received more intensive
studies. C-hordeins also have high content of Gln (40-50 mol%), Pro (20-30 mol%) and Phe (7-9
mol%), but do not contain Cys and have low content of charged amino acid residues. C-hordeins
are a group of proteins sharing highly homologous structure with short N- and C-terminal
8
domains at two sides and a long repetitive domain in between.13
The consensus repeat sequence
is (Pro-Phe-Pro-Gln)1-2(Pro-Gln-Gln)1-2. Molecular modelling techniques were used to predict
the possible structure of repetitive motif. Results suggested that they were more likely to form
overlapping β-turns and develop a helical structure with little or no α-helix and β-sheet.14
The
circular dichroism (CD) spectroscopy of C hordein in 70% ethanol concluded that β-turns were
found while α-helix and β-sheet were absent. C-hordein was in rod shape with a molecular size
from about 36 × 1.7 nm to 26.5 × 2 nm.15
1.2.4 Nutritive value and functionalities of barley proteins
Barley endosperm proteins have a moderate nutritional quality due to its relatively low content of
Lys and Trp, which are essential amino acids for human.16
Although barley proteins are not
competitive for nutritional purpose, barley proteins show some interesting functionalities, which
have potential to be utilized in food and non-food industries. Some previous studies have
characterized the emulsifying, foaming, encapsulating and film-forming properties of barley
proteins as following described in detail.
1.2.4.1 Emulsifying capacity
Emulsification is one of the most important processes in manufacturing of many food and
non-food products. Proteins are used as emulsifiers since they have the ability to lower the
oil-water interfacial tension and stabilize the emulsion by forming a protein film at the surface of
oil droplets.17
The relation between protein structure and their emulsifying capacity will be
9
discussed in the next section. Wang et al. 18
concluded that barley glutelin demonstrated
balanced water and oil holding capacities and strong oil binding capacity, which resulted in
supreme emulsifying capacity. Since the emulsifying properties of proteins were positively
correlated to their solubility,19
Zhao and her colleges 20, 21
tried to improve the solubility and
emulsifying properties of barley glutelin and hordein by deamidation treatments. Even a limited
degree of deamidation significantly increased glutelin and hordein solubility in water and
strongly improved their emulsifying capacities at a wide pH range.20, 21
However, the
fundamental knowledge of barley protein behaviour at the interface has not been explored yet.
1.2.4.2 Foaming capacity
Foaming properties are another kind of protein functionality related to protein behaviour at the
interface. Protein characteristics, including solubility, size, surface hydrophobicity, structure
flexibility and protein-protein interactions, all play important roles in its foaming capacity. Kapp
et al.22
found that both barley albumin and hordein fraction had the capacity to produce stable
foams. Kapp et al. 22
believed that the flexible structure of albumin and the hydrophobic nature
of hordein contributed to their foaming capacities. The application of barley protein as a foaming
agent was limited by its low solubility at neutral pH. Modification techniques, such as
denaturation, proteolysis,22
acetylation1 and deamidation,
20, 21 have been employed to improve
the foaming capacity of barley protein.
10
1.2.4.3 Film forming capacity
Biodegradable films produced from biopolymers, such as proteins, have attracted extensive
attention recently, since they can provide alternatives for petroleum-based films. Barley protein
film has been successfully prepared by thermopressing with glycerol as plasticizer. Barley
proteins are good candidates to prepare film because barley proteins, especially hordein, show
good cohesive and elastic properties. Barley protein films possessed good moisture barrier
properties, resulting from the hydrophobic nature of barley protein.23
1.2.4.4 Encapsulation capacity
Due to the good emulsifying and film forming properties, barley proteins can be used as wall
materials to encapsulate active compounds.24, 25
Microcapsules of fish oil and β-carotene based
on barley protein had been successfully developed.26, 27
Barley proteins could form a thick and
solid matrix after high pressure homogenization, encapsulating the oil phase inside. Barley
proteins microencapsulation prevented fish oil and β-carotene from oxidation since the thick and
integrate protein coating was a good oxygen barrier. Moreover, due to the low solubility of
barley prolamin in the aqueous environment, barley protein encapsulations potentially resisted
swelling and controlled the release of the encapsulated compounds in solution and under humid
conditions. This was a unique characteristic for barley protein microcapsules as compared to
other food grade hydrophilic proteins, such as soy proteins and whey proteins. Notably, a thin
layer of barley protein could resist pepsin degradation and prevent the encapsulated compound
11
from being released. The oil phase was slowly released under simulated intestinal conditions.26, 27
Based on its release profile, barley protein microcapsule has potential to be used as a delivery
system to improve the bioavailability of the encapsulated bioactive compounds.
1.2.4.5 Electrospinnability
Hordeins, the major faction of barley proteins, can be prepared into nanofibers through
electrospinning without any assistance of synthetic polymers.28
When cooperating with zein
nanoparticles, hordein nanofibers exhibited a stable network structure and had improved tensile
strength and stability in both water and ethanol.28
The mechanical properties of electrospun
hordein and zein nanofibers could be further improved by adding cellulose nanowhiskers.29
Protein nanofibers have various potential applications, such as delivery systems, wound dressing
materials, smart textile, composites of biosensor and precursor of carbon fibers.30, 31
1.3 Interfacial properties of barley proteins and their applications
The boundary between two immiscible phases is defined as an ‗interface‘. This thesis research
focused on water-oil and water-air interfaces. To simplify, here, the word ‗interface‘ refers to
both water-oil and water-air interfaces. Emulsions and foams commonly exist in complex food
systems. Their formation and stabilization strongly rely on the behaviour of interfaces during
processing and storage.32
Usually, interface is occupied by one or more layers of surface active
components, which prevents oil droplets/ air bubbles from aggregation and/or coalescence.
Surface active components can be roughly classified into two categories, small molecular
12
surfactants (such as polysorbate, fatty acids, phospholipids) and surface active polymers.33
Proteins are widely utilized as emulsifying and foaming agents since they are biocompatible and
have the capacity to adsorb to the interface, lower interfacial tension and form a 2D viscoelastic
film to stabilize the interface 17
. The surface activity of protein depends on many factors, such as
its thermodynamic stability, structure flexibility, amphipathicity, size and charge.34
As mentioned above, barley proteins were shown to be surface active18
and able to form a
solid-like coating at oil-water interfaces. The latter was different from many hydrophilic food
proteins which were more likely to form liquid-like or gel-like films at oil-water interfaces.27, 35
Despite this, their interfacial behaviour is not well studied yet.
1.3.1 Protein behaviour at the interface
In general, proteins stabilize the interface through the following process. First, proteins diffuse
from solution to the interface and anchor onto the interface. This step depends on intrinsic
properties of proteins and also on physical properties of the bulk phase, such as viscosity, density,
purity and polarity.32
Protein absorption results in a decrease of interfacial tension. Generally,
protein absorption is considered as irreversible since desorption of protein molecules from
interface, especially air-water surface, is a hindered process due to the existence of an activation
energy barrier.36
In bulk solution, protein molecules tend to expose the hydrophilic residues to
water, covering the hydrophobic interior. Once proteins are adsorbed to interface, hydrophobic
segments may be in contact with the air or oil phase which reduce the hydrophobic interactions
13
and destabilize protein‘s original secondary and tertiary structures. Thus, protein molecules
change their conformation to expose the hidden hydrophobic regions and re-orient themselves
towards the air/oil phase.37
The adsorption and further conformation changes of proteins play an
essential role in reducing the interfacial tension. When more proteins adsorb to the interface, the
space between protein molecules decreases, which results in physical entanglements and
intermolecular interactions with each other through non-covalent and covalent bonds.17
The
physical entanglements and intermolecular interactions among protein molecules play an
important role in determining the mechanical property of interfacial protein layers.
1.3.2 Interfacial tension
Interfacial tension at the water interface is considered as the result of the attraction of the bulk
liquid for the surface layer. At air-water interface, the cohesive forces between liquid molecules
contribute to interfacial tension phenomenon.38
Protein adsorption and the subsequent
conformation changes and re-orientation could reduce the interface tension.39, 40
The interfacial
tension is not lowered instantaneously, especially when polymers are used as surface active
materials. When protein is adsorbed to the interface, both the equilibrium interfacial tension
value and the time at which equilibrium value is reached are important.41
Static interfacial tension measurements are used to determine the equilibrium interfacial
tension.42
Dynamic interfacial tension shows the change in interfacial tension as a function of
time. The dynamic interfacial tension is usually measured to obtain the information on protein
14
absorption kinetics. The interfacial tension-time plot demonstrates three distinct regions: (1)
initial induction region with minimal tension reduction, which depends on the diffusion and
protein interfacial affinity; (2) steep tension decline region in which protein molecules contact
the interface and change their orientation and conformation until the formation of monolayer
coverage; (3) final region in which the rate of tension reduction slows down until the equilibrium
is reached. The final region is attributed to the further conformational changes of protein,
continued relaxation of the adsorbed layer and possible build-up of multilayers.43
Some studies
also separate the final stage into the mesoequilibrium region and the steady-state region.44
During foaming and emulsifying, large interfacial areas are created. Newly formed interfaces are
needed to be stabilized by surface active molecules to prevent bubbles or droplets from
coalescence. In these cases, the dynamic surface tension of protein plays an important role in
determining the final emulsion droplet size/foam bubble size.45
The slower proteins can adsorb to
interface, the higher is the chance to have large droplet sizes under the same processing
conditions.
The ability of proteins to lower the surface tension is recognized to be dependent on intrinsic
factors of protein molecules (such as molecular weight, hydrophobicity and chain flexibility) as
well as factors of the bulk solution (such as protein concentration, pH, temperature, ionic
strength, viscosity and present of other surfactants).46, 47
For example, Suttiprasit et al. 48
compared the surface activity of α-lactalbumin (α-Lac), β-lactoglobulin (β-Lac) and bovine
serum albumin. They found that α-Lac had the fastest rate to reduce the surface tension and the

15
lowest equilibrium surface tension at the same condition, which was possibly due to its low
molecular weight and least stable protein structure. Tripp et al. 44
found that the protein
concentration in solution influenced both the equilibrium interfacial tension and the rate of
reaching an equilibrium status. For higher protein concentration, diffusion step was no longer a
rate-limiting process.44
The change in interfacial tension from pure fluid value is considered as surface pressure
t0twhere 0 is the surface tension of the pure fluid and t is time.49
Techniques to
measure dynamic surface pressure include maximum bubble pressure, inclined plate, drop
pressure, drop volume, pendant drop and plate or ring tensiometry, which have various
measurement time windows.39
Pendant drop technique is widely used to observe the dynamic
surface tension change of protein absorption from dilute solution to interface.43
For pendant drop
method, a drop is suspended from a needle in another bulk liquid or gas phase. The shape of the
drop is determined by the relationship between the surface tension and gravity.50
The surface
tension is calculated from the drop shape through Young-Laplace equation. A computer
controlled system allows the acquisition of drop image, detection of the drop shape and fitting
the equation to determine the dynamic surface tension automatically.43
1.3.3 Interfacial rheology of protein films
Interfacial rheology studies the relationship between the deformation of a liquid surface and the
accompanying forces. When proteins adsorb to the interface, protein molecules can form a
16
visco-elastic film around the oil-water or air-water interface through non-covalent and/or
covalent interactions. The viscosity and elasticity of protein interfacial thin film can be
determined by interfacial rheology.32
Interfacial rheological properties are commonly considered
to be correlated to the structure and composition of the protein film. The major difference
between interfacial dilatation and shear rheology is that dilatational deformation has area change
while shear deformation does not. Thus, interfacial dilatational rheology is able to provide
information on the kinetics of adsorption and desorption of the surface active molecules and
detect the intrinsic softness and hardness of the molecules at the interface. Interfacial shear
rheology is an indicator of the conformational changes of protein molecules and their
interactions.51
The changes of shear storage modulus (G‘) and loss modulus (G‘‘) as a function of time
elucidate the adsorption of protein molecules and the interfacial protein network development.52,
53 Freer et al.
54 found that for lysozyme, the complex interfacial shear modulus G* (G* = G‘ +
iG‘‘) increased as aging time extended, indicating a conversion from liquid-like behaviour at the
early stage to more gel-like network formation. Lysozyme molecules partially unfolded after
being adsorbed to the interface, which facilitated the build-up of strong intermolecular
interactions leading to the increase of G‘ with time. However, the strong intramolecular
interaction of lysozyme molecules was considered as a kinetic barrier for partial denaturation at
the adsorption stage.54
Cascão Pereira et al. 55
found that both the intrinsic stability of protein
structure and the lateral interactions between protein molecules contributed to the shear elasticity

17
of the protein film. The conformation and orientation changes of protein at interface strongly
influence the development of intermolecular interactions; thus, influence the interfacial
rheological properties.51
Factors disrupting or strengthening the inter and/or intramolecular
interactions can lead to changes in the interfacial rheological properties, such as ionic strength,
temperature, aging, chemical and enzymatic modification as well as the addition of
polysaccharides and/or small molecular surfactants.51
The direct quantitative relationship between protein interfacial rheological properties, and
formation and stability of foam and/or emulsion is difficult to determine, since all the interfacial
rheology measurements are made on model macroscopic interfaces and the range of analysis
parameters (such as stress, strain and rate of deformation) do not reflect the turbulent
non-equilibrium conditions during foaming and emulsifying.32
Despite this consideration,
experimental evidence still confirms that the formation of interfacial protein network is
correlated to the stability of air-water and oil-water interfaces.52
The stability of emulsions and
foams is linked to both dilatational and shear rheological properties, because both dilatational
and shear deformations occur in oil droplet (air bubble) collision and film drainage.52
For
instance, Kim et al.56
compared the interfacial shear rheological properties of native and heated
β-Lac. The heated β-Lac had a higher surface hydrophobicity and more flexible structure,
leading to lower surface tension and increase of intermolecular interactions between interfacial
protein molecules. Thus, they found that the G‘ of heated β-Lac increased and resulted in an
increased resistance to coalescence of oil droplets and higher stability of the bulk emulsion.56
18
Understanding the relationship between protein interfacial film rheology and emulsion
degradation processes is important for controlling lipid digestibility and rational design of
emulsions with desired digestibility.57-60
However, research on this new area is insufficient.60
Lipases work at the oil-water interface. For emulsions stabilized by proteins, the resistance of
proteins to lipase displacement from interface and the resistance of protein layers to degradation
play important roles in controlling the digestibility of emulsion.61
Maldonado-Valderrama 59, 62
found that β-Lac had a higher dilatational modulus at air-water than oil-water interface, which
might be caused by the higher level of conformational changes of β-Lac at air-water interface.
The stronger protein film formed at air-water interfaces hindered bile salt displacement more
than the weaker structure formed at oil-water interfaces. Previous study in our group showed that
a thin film of barley protein at the oil-water interface can resist the degradation in simulated
gastric fluid (SGF). This result is interesting for developing delivery systems with controlled
lipid digestibility.27
However, the resistance mechanism of barley protein is still not clear. The
relationship between interfacial rheological properties of barley protein film and its digestibility
needs to be investigated.
1.3.4 Protein conformational changes at the interface
The partial denaturation of protein at interface influences its adsorption kinetics and the further
development of the viscoelastic interfacial protein film. Thus, the conformation and orientation
of protein at interface play a significant role in the formation and stabilization of the emulsion
19
and/or foams.63-65
Hence, many studies attempted to reveal protein conformational changes. The
degree of protein conformational rearrangement at the interface depends not only on the
properties of the interface but also on the protein intrinsic conformational stability.66
It has found
that although proteins have the tendency to unfold at interface, they still maintain some
secondary structures.67, 68
Fourier transform infrared (FTIR) and infrared absorption reflection spectroscopy (IRRAS) are
two of the most popular techniques used to study the protein conformation and orientation at
interfaces. The amide I and II regions of the infrared spectra are the most prominent vibrational
bands of the protein backbone. Amide I (1700 to 1600 cm-1
) is the most sensitive region to the
protein secondary structure because the C=O stretch vibrations of the peptide linkages contribute
to approximately 80% of the amide I region.69
Each type of their secondary structure has a
different C=O stretching frequency due to unique molecular geometry and hydrogen bonding
pattern.69-71
FTIR involves a measurement of the intensity of the absorption of IR radiation at a
given wavelength by a sample, whereas with IRRAS, interfacial protein structures are measured
by the spectrum of an IR beam that is reflected from the interface.72
Polarization
modulation-IRRAS (PM-IRRAS) has high sensitivity to the orientation of the transition moment
at the interface due to surface selection rule, which can reveal the orientation of interfacial
proteins.72-75
As analyzed by FTIR, after being adsorbed to the oil-water interface, β-lactoglobulin had an
increase in the band at 1682 cm-1
, which is assigned to intermolecular β-sheets.76
Banc et al. 77
20
coupled Langmuir-Blodgett trough with PM-IRRAS and found that intermolecular β-sheets of
γ-gliadin increased at the expense of β-turns when the interface was getting crowded with
γ-gliadin molecules. These results confirmed that the conformational changes of protein after
being adsorpted to the interface played an important role in the formation of interfacial protein
network. Moreover, studies also revealed that the protein conformation changes influenced the
response of protein films to different pH 78
and surfactant replacement.62
1.4 Protein electrospun nanofibers
1.4.1 Electrospinning technique
Polymer nanofibers have a large surface area to volume ratio, flexible surface functionalities and
controllable mechanical performance, which make them suitable for many applications, such as
separation membranes, wound dressing materials, controlled drug release system, biocompatible
scaffolds and many other applications.79
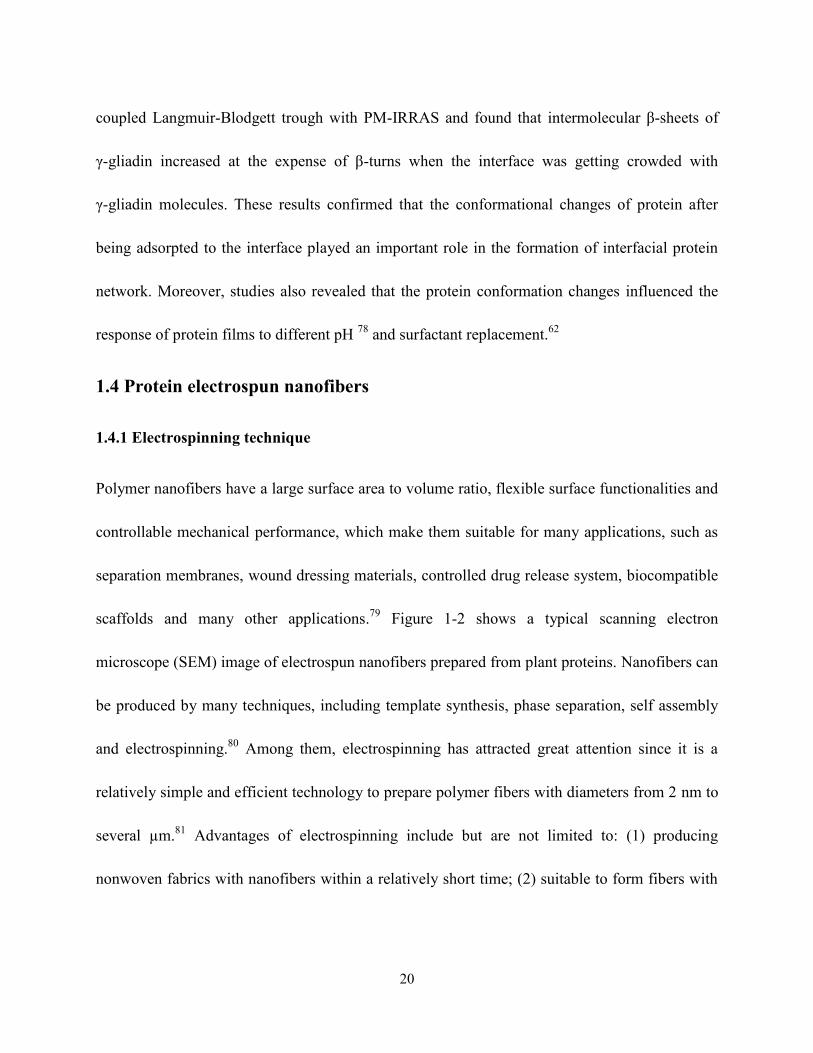
Figure 1-2 shows a typical scanning electron
microscope (SEM) image of electrospun nanofibers prepared from plant proteins. Nanofibers can
be produced by many techniques, including template synthesis, phase separation, self assembly
and electrospinning.80
Among them, electrospinning has attracted great attention since it is a
relatively simple and efficient technology to prepare polymer fibers with diameters from 2 nm to
several µm.81
Advantages of electrospinning include but are not limited to: (1) producing
nonwoven fabrics with nanofibers within a relatively short time; (2) suitable to form fibers with
21
wide varieties of materials; (3) able to encapsulate core materials inside fibers and (4) able to
control the fiber diameter and alignment.80, 82, 83
Figure 1-2 SEM image of orientated electrospun hordein/zein fibers. Scale bar: 5µm.30
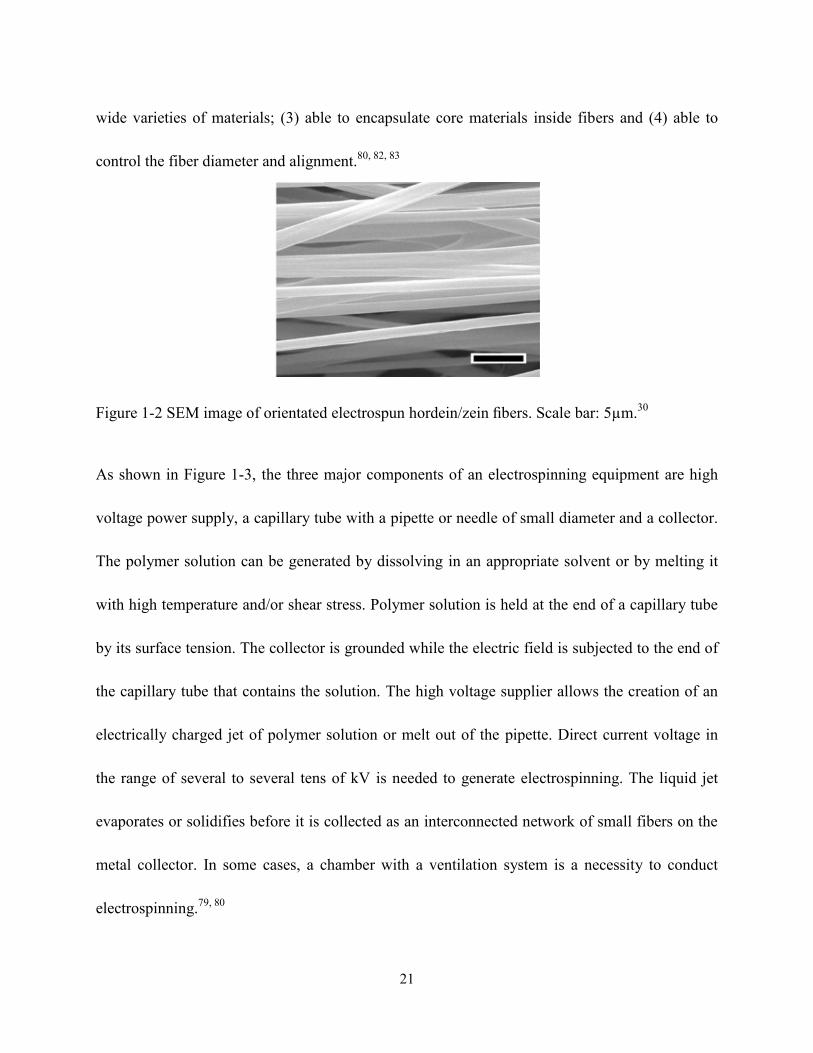
As shown in Figure 1-3, the three major components of an electrospinning equipment are high
voltage power supply, a capillary tube with a pipette or needle of small diameter and a collector.
The polymer solution can be generated by dissolving in an appropriate solvent or by melting it
with high temperature and/or shear stress. Polymer solution is held at the end of a capillary tube
by its surface tension. The collector is grounded while the electric field is subjected to the end of
the capillary tube that contains the solution. The high voltage supplier allows the creation of an
electrically charged jet of polymer solution or melt out of the pipette. Direct current voltage in
the range of several to several tens of kV is needed to generate electrospinning. The liquid jet
evaporates or solidifies before it is collected as an interconnected network of small fibers on the
metal collector. In some cases, a chamber with a ventilation system is a necessity to conduct
electrospinning.79, 80
22
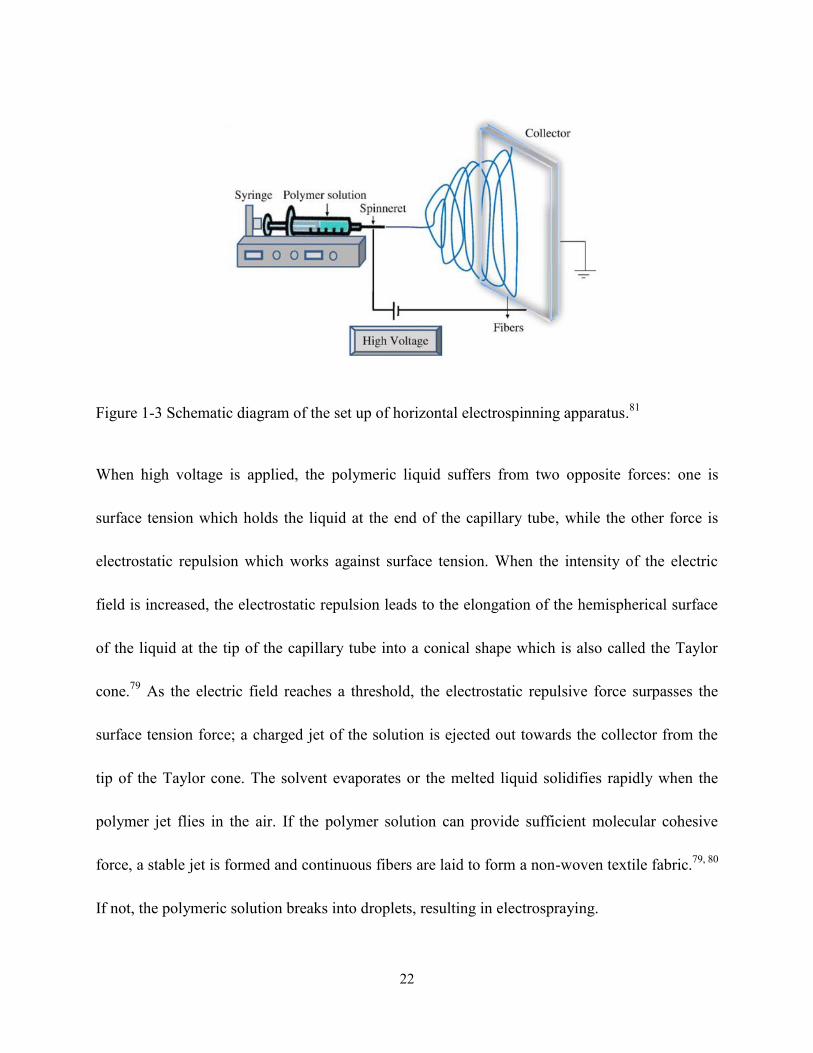
Figure 1-3 Schematic diagram of the set up of horizontal electrospinning apparatus.81
When high voltage is applied, the polymeric liquid suffers from two opposite forces: one is
surface tension which holds the liquid at the end of the capillary tube, while the other force is
electrostatic repulsion which works against surface tension. When the intensity of the electric
field is increased, the electrostatic repulsion leads to the elongation of the hemispherical surface
of the liquid at the tip of the capillary tube into a conical shape which is also called the Taylor
cone.79
As the electric field reaches a threshold, the electrostatic repulsive force surpasses the
surface tension force; a charged jet of the solution is ejected out towards the collector from the
tip of the Taylor cone. The solvent evaporates or the melted liquid solidifies rapidly when the
polymer jet flies in the air. If the polymer solution can provide sufficient molecular cohesive
force, a stable jet is formed and continuous fibers are laid to form a non-woven textile fabric.79, 80
If not, the polymeric solution breaks into droplets, resulting in electrospraying.
23
There are many factors influencing the formation, diameter, morphology and mechanical
properties of the final nanofibers. These factors come from intrinsic polymer properties (such as
molecular weight, molecular weight distribution and architectures), solution properties (i.e.
concentration, viscosity, surface tension, conductivity and dielectric constant), process
parameters (i.e. voltage, electrostatic field shape, working distance, feeding rate, nozzle diameter)
and environmental parameters (i.e. temperature, humidity, air flow).80, 84
Briefly, these
parameters mainly affect the final fibers through chain entanglements, solvent evaporation and
forces on the charged jet. Chain entanglements are important to produce a stable jet. Rate of
evaporation influences the thinning of the jet and the morphology of fibers. The forces on the
spinning jet determine its stretching and bending instability. Fibers with desired properties can be
formed by appropriately varying one or more of these parameters.85
For different spinning polymers, the spinning conditions are different. For example, for
electrospinning poly(ethylene oxide) (PEO) in ethanol-in-water solutions, when the viscosities
are higher than 20 poises, the formation of fiber is prohibited due to the high cohesiveness of the
solution. When viscosities are lower than 1 poise, electrospraying may happen since a stable jet
is not formed.86
In the case of electrospinning cellulose acetate in acetone/dimethylacetamide
solution, the spinnable viscosity range is 1.2 to 10.2 poises.87
Diameter is one of the most important fiber properties. Many efforts have been made to correlate
the electrospinning parameters with final fiber diameters. Some trends have been found
regardless of polymer types. For example, generally, within the spinnable range, a higher
24
viscosity leads to larger fiber diameter. Since the viscosity is proportional to the polymer
concentration in a certain solvent, the higher polymer concentration leads to a larger fiber
diameter.88
Another important factor is the net charge density carried by the electrospinning jet,
which is affected by the intensity of the electrostatic field and the conductivity of the polymer
solution. In many cases, increasing voltage can reduce the fiber diameter since increasing electric
potential at capillary tip enhances repulsive force, resulting in thinner fibers.89
Also, the addition
of extra salt into the polymer solution is observed to increase the charge density of the spinning
jet. By adding salt, the elongation forces imposed on the jet is stronger due to the self repulsive
forces of the excess charges under electrical field. Thus, adding salt leads to a straighter shape
and smaller fiber diameter.90
Therefore, it is considered that the higher the net charge density is,
the more likely it is to obtain smooth fibers without beads.86
1.4.2 Protein electrospun nanofibers
It is reported that more than a hundred of polymers has been successfully spun into ultrafine
fibers through electrospinning techniques.80
A variety of electrospun fabrics have also been
developed based on biopolymers and their derivatives and composites, such as polysaccharides
(i.e. cellulose, chitosan, dextrose, lignin), proteins and DNA.83
Using biopolymers as
electrospinning materials has attracted great attention since biopolymers are renewable resources,
biodegradable and biocompatible. However, it is notable that electrospinning of biopolymers can
still be challenging since the intrinsic properties of biopolymers such as their molecular weight,
25
molecular structure, solubility, charge, crystallinity and glass-transition temperature, vary greatly.
Also, applications of biopolymer electrospun fabric are needed to be broadened.
Proteins are a major category of biopolymers and protein fibers play important biological
functions naturally. However, due to their complex macromolecular structures and strong inter
and intra molecular interactions, the process of electrospinning protein is still challenging. In
spite of this, much progress has been made recently to prepare protein nanofibers and apply them
in medical, food, paper, textile and other industries. Examples include but are not limited to
silkworm silk, collagen, gelatin, elastin, casein, wheat gluten and zein.28, 83, 91
However, their
application is limited by poor tensile strength and low water resistance.92
In previous work, Wang and Chen28
have successfully developed electrospun fibers based on
plant prolamin zein and hordein in acetic acid. In these novel protein nanofibers, compact zein
nanoparticles were incorporated into electrospun hordein network.28
The conformation of protein
molecules in solvent strongly influenced their electrospinnability and the mechanical properties
of the final fibers.93
Wang and Chen93
found that hordein molecules were unfolded and form an
extended and flexible structure in acetic acid. This structure allowed hordeins to form
intermolecular interactions more easily during electrospinning. Also, similar to high molecular
weight wheat glutelin, hordeins have large domains comprised of repeated sequences and contain
β-turn as a structural motif. These structural features allows hordein to possess rubber-like
elasticity, which may contribute to the electrospinnability of hordein and the good tensile
strength of hordein based electrospun fibers.94
Meanwhile, zein molecules kept compact
26
molecular conformation in acetic acid, which acted as reinforced fillers within hordein
network.93
This novel hordein/zein electrospun nanofiber exhibited improved tensile strength and
wet stability in both water and ethanol solution. The potential of using hordein/zein electrospun
nanofibers in food and biomedical industries has been preliminary justified.28-30, 95
Although
protein electrospun nanofibers have demonstrated many excellent properties, their applications
are still limited in food, biomedical and related industries. Further research is needed to develop
and broaden their applications.
1.4.3 Applications of electrospun nanofibers
When fiber diameter decreases to nano-scale, the specific surface area increases, leading to the
occurrence of some nano-effects, such as increased quantum efficiency, surface energy, surface
reactivity, and thermal and electrical conductivity.83
The small pore size of nanofibers is also
important for some applications, such as filtration.80
The fiber diameter, the pore size between
fibers and alignment can be modified to fit desired applications. These interesting features
provide electrospun nanofibers potential to be utilized as biomedical devices, supports for
enzymes and catalysts, nanofiber-reinforced composites, textile and smart clothes, sensors,
templates for materials synthesis, energy devices and electrode materials.31
Electrospun nanofibrous materials are considered to be promising candidates to prepare electrode
materials for energy storage devices, such as lithium batteries and supercapacitors. This is
because electrospun nanofiber textiles possess interesting 3D interconnected pore structure. The
27
high porosity associated with the nanofiber network leads to rapid transport of ions through the
fiber network. Also, the high specific surface area endows electrode with high capacitance.31, 96
Most attention has been paid to synthetic polymer electrospun fibers for electrodes preparation,
such as polyacrylonitrile (PAN), polyvinyl alcohol (PVA) and polyvinylpyrrolidone (PVP).96
In
limited cases, electrospun nanofibers based on biopolymers, mainly lignin 97
and cellulose 98
,
have been converted into carbon fibers and applied as electrode materials. However, protein
based electrospun nanofibers have not been explored in this area yet.
1.5 Applications of protein based electrospun nanofibers as carbon based
supercapacitor
1.5.1 Supercapacitors
1.5.1.1 Introduction of supercapacitors
Nowadays, the three major energy storage and conversion devices are batteries, fuel cells and
supercapacitors, which have different properties and applications. Supercapacitors have attracted
extensive attention in recent years due to their high power density, rapid charging time and long
cyclic stability. The specific energy of supercapacitors is several orders of magnitude higher than
that of conventional capacitors. Thus, supercapacitors have the potential to fill the gap between
batteries and conventional capacitors in terms of power density.99, 100
Based on the energy
storage mechanisms, supercapacitors can be classified into two categories: electric double layer
capacitors (EDLCs) and pseudocapacitors.

28
The energy storage mechanism of EDLCs is similar to conventional capacitors, which was based
on the separation of charged species in an electrical double layer across the electrode/solution
interface.101
In EDLCs, the reversible electrostatic accumulation of ions on the surface of porous
carbon contributed to their energy storage. An EDLC is comprised of one positive electrode with
deficient electrons and one negative electrode with excessive electron. During charging,
electrons travel from the negative electrode to the positive electrode through an external pathway.
Meanwhile, cations move towards the negative electrode while anions move towards the positive
electrode in the electrolytes. During discharging, reverse processes occur.102
Supercapacitors can
store much more energy than the conventional capacitors because of two reasons. Firstly, the
distance between separated charges is very small in electric double layer which constitutes the
interphase between an electrode and the adjacent electrolyte. Secondly, due to the large amount
of pores and high specific surface area, a larger amount of charge can be stored on the electrode
surface.100
Pseudocapacitors are also called faradaic supercapacitors. In pseudocapacitors, the electrode is
electrochemically active and reversible faradaic-type charge transfer happens. When a potential
is applied to a pseudocapacitor, fast and reversible faradaic reactions (redox reactions) take place
on the electrode materials, which induce the passage of charge across the double layer and result
in faradaic current passing through the supercapacitor cell. The way of pseudocapacitors to store
energy is similar to the charge-discharge processes in batteries. The capacitance of a
pseudocapacitor is determined by the electrochemical charge transfer process that is limited by a
29
finite amount of electrochemically active materials and/or specific surface.100
The common
electrode materials for pseudocapacitor are transition metal oxides (such as RuO2, MnO2 and
Co3O4) and conductive polymers.100
There are three types of faradaic processes which may occur
in pseudocapacitor electrodes, including reversible adsorption, redox reactions of transition metal
oxides and reversible electrochemical doping-dedoping process for conductive polymers.102
Compared to EDLCs, pseudocapacitors can provide the energy density with one order of
magnitude higher. However, pseudocapacitors may have a lower power density since the
faradaic reactions involved in the pseudocapacitor systems are slower than nonfaradaic
processes.102, 103
Also, the cyclic stability of pseudocapacitors is poorer due to the redox reactions.
Cost of electrode materials also limits the application of pseudocapacitors.
Nowadays, hybrid systems have been developed to utilize the advantages of both EDLC and
pseudocapacitors for improved energy-storage performances. Hybrid systems can be constructed
by coupling an EDLC electrode with a pseudocapacitor electrode or coupling a supercapacitor
electrode with a battery electrode.102, 104
1.5.1.2 Cell construction of supercapacitor
Supercapacitors have a sandwich-like structure consisting of two electrodes which are separated
by a thin layer of ion permeable separator and immersed inside electrolytes. Usually, a rigid
exterior package is used to hold the supercapacitors and prevent possible electrolyte leakage.100

30
Electrolyte is one of the most important elements for supercapacitors. There are mainly three
types of electrolytes: aqueous, organic and ionic liquid electrolytes. Aqueous electrolytes, such
as H2SO4, KOH, Na2SO4 and other salt aqueous solutions, provide a high ionic concentration and
lower resistance than organic electrolytes. The higher ionic concentration and relatively smaller
ionic radius allow supercapacitors containing aqueous electrolytes to have a high capacitance and
high power. Additionally, the preparation of aqueous electrolytes is convenient and the cost is
relatively low. However, due to the narrow voltage window of water, the major disadvantage of
aqueous electrolyte is the small voltage window of about 1.2 V, which strongly limits its energy
and power density. On the other hand, organic electrolytes can have a voltage window as high as
about 3.5 V. Organic electrolytes are made from organic solvents (such as acetonitrile and
propylene carbonate) and organic salts (such as tetraethylammonium tetrafluoroborate and
triethylmethylammonium tetrafluoroborate). The issue of using organic electrolyte is that the
preparation is strict since water contamination will significantly reduce its voltage window. Ionic
liquids are molten salts at desired temperatures. The advantages of ionic liquid electrolytes are
low vapour pressure, high thermal and chemical stability, low flammability and even a larger
voltage window (2-6 V). Extensive efforts are made to improve the interface properties,
temperature range and conductivity of ionic liquid electrolytes.102, 104, 105
In additional to electrolytes, electrode materials strongly determine the performance of
supercapacitors. Mainly, there are three kinds of electrode materials: metal oxides, conductive
polymers and carbon materials. Metal oxide and conductive polymers are mainly used for
31
pseudocapacitors. Metal oxides can store energy through electrostatic adsorption and also exhibit
electrochemical faradaic reactions between electrode and ions. Metal oxides for
pseudocapacitors are electric conductive, have two or more oxidation states that coexist without
any phase changes. Protons can intercalate into the oxide lattice on reduction. RuO2 is the most
promising candidate. The specific capacitance can reach up to 720 F/g in H2SO4 electrolytes, but
its high cost strongly limits its commercial applications.106
Some examples of conductive
polymers includes polyaniline (PANI),107
polypyrrol (PPy)108
and
poly(3,4-ethylenedioxythiophene) (PEDOT) .109
When oxidation occurs, ions are transferred to
the polymer backbone. Ions are released from the backbone into the electrolyte solution when
reduction happens.110
The specific capacitance of polyaniline can reach 775 F/g in H2SO4 at the
sweep rate of 10 mV/s.111
Despite the high voltage window and storage capacity, long-term
cyclic stability is a problem due to the swelling and shrinking of conductive polymers. One of
the methods to overcome this problem is to cooperate conductive polymer nanostructures, such
as PANI nanofibers, with carbon materials.112
Carbon materials store energy in the electric double-layer at the interface between electrode and
electrolyte, thus they are widely used for the assembly of EDLCs. Carbon materials are
cost-effective, stable in a wide temperature range, chemically stable and have high specific
surface area and good conductivity. Carbon materials can be produced from abundantly available
organic materials, such as natural biomass, food waste and by-products of various industries.104
The structure, pore and surface chemistry of carbon can be engineered. In this thesis research, the
32
opportunity of using barley protein based electrospun nanofibers into carbon materials for
supercapacitor application was explored, which is an approach to open up the utilization of
barley proteins in the energy industry.
1.5.1.4 Advantage, applications and challenges of supercapacitors
As compared with the other types of energy storage systems, such as batteries, fuel cells and
conventional capacitors, supercapacitors exhibit some advantages. For example, since
supercapacitors store electrical charges at the interface or the narrow layer near the surface of the
electrode, the rate of charge-discharge process is not restricted to the ionic conduction into the
electrode bulk. Thus, supercapacitors, especially, EDLCs have rapid charge-discharge rate and
high power density. Since a relatively small amount of energy is lost in the form of heat during
charge-discharge cycle, the efficiency of EDLCs is relatively high. Moreover, the low toxicity,
safety, good cyclic stability and long shelf life are advantages of EDLCs.102
Therefore,
supercapacitors can be widely used in many areas, such as electric vehicles, electrical tools,
portable electronic devices, uninterruptible power supplies and other energy storage systems.103
However, efforts are still needed to improve the energy density of supercapacitors, which are low
(about 5 Wh/kg) as compared with batteries (>50 Wh/kg). Some of the excellent electrode
materials for supercapacitors (such as RuO2) are too expensive to be commercialized. Also,
industrial standards are still under construction.102

33
1.5.2 Design of carbon materials for supercapacitor electrodes
Carbon materials store energy in the electric double-layer at the interface between electrode and
electrolyte, indicating that the capacitance is determined by the surface area which is accessible
to the electrolyte ions. The essential factors contributing to the capacitive performance of carbon
materials include specific surface area, pore-size distribution, pore shape and structure, surface
functionality and carbon structure.
1.5.2.1 Surface area and pores of carbon materials
Based on the model developed by Helmholtz in 1853, the capacitance of each EDLC electrode
can be estimated according to the following equation 113
:
𝐶 = 휀𝑟휀0𝐴
𝑑
where r and 0 is the dielectric constant of electrolyte and vacuum, d is the effective thickness of
the double layer and A is the electrode surface area. Therefore, among all the factors, specific
surface area and pore size are the two of the most important elements determining the
capacitance of EDLCs.
Generally, the increase of specific surface area leads to increased capacitance. Activation of
carbon materials can increase the surface area by creating pores at the carbon surface and/or
opening pores that are closed, clogged or obstructed.114
By using different carbon precursor and
activation conditions (such as chemicals, temperature, activation time and gaseous environment),
the porosity, pore structure and pore size can be controlled.100
Activation of carbon materials can
34
be done through physical or chemical treatments. Physical activation modified the carbon surface
by controlled gasification and the elimination of volatile pyrolysis products. Usually, physical
activation is conducted under oxidising gases such as steam, carbon dioxide, air or gas mixture at
700 to 1000°C. No post-treatment is needed after physical activation. On the other hand,
chemical activation is conducted at a temperature of 400 to 700°C with the assistance of
chemicals such as phosphoric acid, zinc chloride and potassium hydroxide. The activation
process involves the dehydrating action of these reagents. Carbon needs to be washed after
activation to remove chemical residues.100
Over activation may result in thinner pore wall and
lower strength of carbon materials. Another approach to increase pores are applying sacrificial
templates, such as zeolites or silica.115
However, the capacitance is not always proportional to the specific surface area, since not all the
pores are accessible to electrolyte ions. The capacitance is also influenced by the relationship
between the pore size and the effective size of ions. For aqueous and organic electrolytes, the
effective ion size is larger due to the solvation shell. When the pore size is smaller than that of
ion, ion sieving effect may happen.116
Interconnected 3D pore network with hierarchical pores
consisting of macro, meso and micropores have attracted extensive attention in supercapacitor
applications. Meso and micropores provide the carbon with high surface area resulting in a large
capacitance. Meanwhile, the interconnected micro and mesopores facilitate rapid ion transport to
ensure high rate capability by working as ion-buffering reservoirs and ion transport pathways.117
35
1.5.2.2 Surface chemistry of carbon materials
In addition to tailoring the pore size and surface area, introducing pseudocapacitance at the
electrode/electrolyte interface is another strategy to increase the capacitance of EDLCs.
Pseudocapacitance comes from materials such as transit metal oxides, conducting polymers and
heteroatoms on the surface of carbon.104, 118
Addition of heteroatoms into the carbon matrix, such
as nitrogen, oxygen, boron and phosphorus, etc., is an efficient way to improve the capacitance
of EDLCs through inducing faradaic reaction at the carbon surface without sacrificing the
excellent characteristics of carbon materials such as good conductivity, high rate capability and
excellent cyclic stability.119, 120
Nitrogen (N) is one of the most studied heteroatomes in
optimizing carbon capacitance. Besides pseudocapacitance, nitrogen functional groups change
the electron distribution of the carbon, which enhances the wettability between electrode
materials and electrolytes.119, 121
Generally, there are two approaches to prepare carbonaceous
materials rich in N. Firstly, N atoms can originate from the carbon precursor and become part of
the chemical structure as a result of incomplete carbonization. Hair,122
and PPy,123
which are
nitrogen-rich biomass and polymers, are used to prepare carbon materials for supercapacitor
electrodes with nitrogen content of 5% and 10% as measured by X-ray photoelectron
spectroscopy (XPS). Secondly, N can be incorporated onto the carbon surface through
subsequent treatments, such as treating carbon materials with ammonia gas or ammonia
solution,124
urea120
and/or nitrogen plasma.125
The post-treatment methods are less preferred due
to the toxic gases released during the process and the limited amount of N-functional groups
36
introduced onto the carbon surface. For graphitic carbon, heteroatoms are located in two kinds of
positions: center and edge carbon sites. Functional groups at edges are considered to be more
reactive than those in the center as they are often associated with unpaired electrons.100
There are
four configurations of nitrogen present in carbon structure, including pyridinic N (N-6), pyrrolic
N (N-5), quaternary N (N-Q) and oxidized N (N-X).126
N-6 and N-5, which are usually
considered to be located at the edge, are the main contributors to the pseudocapacitance by
faradaic reactions. N-Q are more likely to be located at the center and can benefit the carbon
electrode performance by enhancing its conductivity.119
1.5.2.3 Carbon forms
Various forms of carbon materials, such as activated carbon, carbon aerogels, graphite, carbon
nanotubes, carbon fibers and carbon onion, have been studied extensively as electrode materials
for supercapacitors.127
For example, activated carbon is the most widely used today due to its
low cost and high specific surface area. Highly conductive carbon blacks are usually applied as
conductive fillers in many battery and supercapacitor electrodes.100
Carbon aerogels are highly
porous materials prepared by pyrolysis of organic aerogels. Sponge-like Carbon aerogels made
from watermelon have 3D flexible structure and achieve 333 F/g with the assistant of Fe3O4 at 1
A/g in 6 M KOH.128
Continuous carbon nanofibers (CNFs) have shown potential to develop porous electrodes for
supercapacitor electrodes which are cost-effective, flexible and property tailorable.100
Also, the
37
interconnected pores structure formed by CNF interlacement facilitates the transport of
electrolyte. CNFs have low electrical resistance along the fiber axis, but the contact resistance
between fibers can be an issue. Interconnected fiber webs can solve this problem by providing
shorter and more continuous pathways for electron transport.129
CNFs can be derived from
synthesis and/or natural polymers electrospun nanofibers such as PPy,123
PAN,130
lignin131
and
cellulose118
.
Graphitic carbons are considered as all varieties of substances consisting of the element carbon
in the allotropic form of graphite (sp2) irrespective of the presence of structural defects.
132
Carbon precursors decompose and eliminate volatile materials during carbonization. With
increasing temperature, condensation reactions occur and local graphitic units begin to grow and
become aligned into small graphitic-like microcrystallites, such as ‗graphene-like‘ nanosheets.100
Graphitic carbon materials are justified by the detection of 3D hexagonal crystalline long-range
order through diffraction methods, such as X-ray diffraction (XRD).132
Porous graphitic carbon,
which is a promising supercapacitor electrode material, may present excellent features from both
porous carbon and graphene. The porous structure can provide high specific surface area and
increase the accessibility of electrolyte to the micropores while the graphitic structure endows
the excellent intrinsic electrical conductivity in plane and low resistance pathways for ion
transport.133
The porous carbon with partially graphitic nanostructures derived from resol showed
excellent capacitance of 25 µF/cm2.134
38
1.5.3 Biomaterials as electrode materials for supercapacitor
In recent years, there is a new trend in recycling natural and industrial wastes to produce carbon
for energy storage systems.127
Biomass materials can be utilized as precursor of carbon materials.
These biomasses can be carbonized under inert atmosphere and/or partially carbonized through
hydrothermal carbonization methods to be converted into carbon materials. Then, through
physical or chemical activation, the surface area and pore size distribution can be further
improved.135
Carbon materials from biomass show excellent capacitance performance, for
example, 400 F/g from dead leaves carbon136
, 268 F/g from coconut.137
Most of these cases are
based on lignocelluloses biomass, containing mainly lignin and polysaccharides (such as
cellulose, hemicelluloses, starch, chitin and alginate). However, the research on the utilization of
proteins, another important category of biomaterials, is still insufficient. Recently, several
attempts have been made to employ protein based biomass to produce carbon materials for
supercapacitors. For example, human hair,122
egg shell membrane,138
collagen,139
silk fibers140,
141 and gelatine.
142 The major advantage of using protein based biomass as a carbon precursor is
that the large amount of nitrogen on the polypeptide chain can directly endow various nitrogen
functional groups on the surface of the final carbon products without any further nitrogen doping
process.
After carbonization/activation processes, the intrinsic structures of biomass may be either
preserved or lost.135
It is essential to engineer biomaterials to control the pore texture, structure
39
and surface chemistry of the final carbons. For example, Lai131
used electrospinning to turn
natural alkali lignin into fibers network and successfully prepared free-standing and
mechanically flexible carbon nanofiber mat. Wu et al.128
used watermelon to prepare
carbonaceous aerogels containing both carbon nanofiber and nanospheres for supercapacitors.
1.6 Hypothesis and objectives
1.6.1 Summary of the key justifications of this research
Barley is an ancient cereal grain, widely grown around the world. Once upon a time, barley was
an important food grain in many areas, but nowadays, it evolved to a feed and malting grain.16
Currently, 80% of the Canadian barley is used as livestock feed in the domestic market.
Around10% of barley production is utilized as malt for beer and whisky production domestically
and overseas. In recent years, there is a renewed interest in using barley as food ingredients due
to the health benefits of bioactive compounds in barley grains, such as β-glucan, tocols and
nonpolar lipids.16
Commercially available barley products include pot and pearled barley, grits,
flakes as well as malt flours. Barley flour and cracked barley can be incorporated into bread and
cake formulations.143
Additionally, barley products can be applied in breakfast cereals, stews,
soups, porridge and baby foods.16, 144
Despite these, barley remains an underutilized cereal for
human consumption.2 Following starch, proteins are the second major component in dried barley
grains with a content of 8-15%.2 Due to the large production of barley, barley is an abundant
40
source of plant proteins. Thus, exploring human utilization of barley protein can add value to
barley and bring more profit to the growers and processors.
Hordeins and glutelins are the major protein components, contributing to 70-90% of total barley
proteins. Hordeins are high in Gln, Pro and some hydrophobic amino acids, but low in charged
amino acids, resulting in low water solubility.9 B-hordein, the major fraction of hordeins,
contains a large repetitive domain with repetitive pattern of Pro-Phe/Tyr-Pro-Gln,8 resulting in
an extended structure with a high amount of β-turns. Such a structure endows hordein with
elasticity and tendency to build up intermolecular interactions, which may contribute to its
interfacial behaviour and electrospinnability.
Barley proteins were reported to have foaming, emulsifying, and encapsulating capacities. This
can be explained by the high hydrophobic amino acid contents of hordein and glutelin, which
makes them capable of adsorbing to the interface. Recently, microparticles from barley proteins
have been developed in our group by a pre-emulsifying process followed by microfluidizing
without using any organic solvent. Interestingly, hordein formed a solid coating on oil-water
interface after high pressure homogenization, which protected the encapsulated neutraceutical
from oxidation. This was different from that observed for emulsions prepared by globular
proteins, where emulsions only formed soluble aggregates after high pressure treatment. This
might be due to the strong tendency of barley protein molecules to develop intermolecular
interactions at the interface through hydrophobic interactions.35
Thus, a cross-linking reagent
was not needed to prepare solid barley protein microparticles. However, the detailed mechanism

41
was not investigated. In addition, these microparticles exhibited the ability to protect the
encapsulated lipid phase in SGF and release them under SIF.27
This was unique as compared to
other food protein based microparticles which degraded rapidly in SGF.145-147
These
characteristics might be related to the interfacial properties of the major component B-hordein.27
However, study on the interfacial properties of barley protein were still lacking. A better
understanding on how barley proteins formed a solid coating at the interface and the correlation
between protein interfacial behaviour and the particle digestibility will allow us to broaden the
applications of barley proteins as well as to design emulsions/particles with desired digestibility.
When particle sizes decrease from micro to nano-scale, some advantages may appear. For
example, nanoparticles may improve the bioavailability of nutraceutical compounds.
Nanoparticles allow prolonged compound residence time in the gastrointestinal tract and the
surface available to interact with biological support increase. Also, nanoparticles have a higher
chance to be taken up by cell.148
Therefore, it would be interesting to adapt this technology to
create new nanoparticles from barley proteins for new or improved properties. However,
nanoencapsulation system based on barley protein has never been reported.
Another interesting value-added application for barley protein is converting hordein based
electrospun nanofiber network into carbon nanofiber as electrode material for supercapacitors.
As developed in our previous studies, hordein exhibited good electrospinnability and formed
nanofibers through electrospinning without the addition of other synthetic polymers. Also, barley
protein based nanofibers showed improved tensile strength and stability in water and ethanol
42
environment, which surpassed many other protein based electrospun nanofibers.28, 92
Hordein
molecules unfold and have an extended and flexible structure in acetic acid, which helps the
formation of intermolecular interactions and the generation of electrospun nanofibers.93
Electrospun fibres are potential candidates to prepare carbon nanofibers for supercapacitor. Due
to the growing market of electronic devices and energy management, there is an increasing
demand of supercapacitor. Carbon electrode materials derived from electrospun protein fabric
have at least three significant advantages: (1) high content of nitrogen originating from protein
contributes additional pseudocapacitance to carbon surface; (2) the fibrous structure provides
carbon hierarchical pore structure for electrolyte ion transport and low charge resistance along
the fiber axis; and (3) proteins are renewable biomaterials. However, to our knowledge, such
research is currently unavailable.
1.6.2 Hypotheses
In the light of these key points, this thesis research was conducted based on the following
hypotheses:
Hypothesis 1: B-hordein may form a solid like film at the air-water or oil-water interface upon
compression. (Chapter 2)
Hypothesis 2: Conformation and orientation of B-hordein can be changed upon compression to
different surface pressures and these conformational changes may subsequently influence its
susceptibility to pepsin degradation in the gastric tract. (Chapter 2)
43
Hypothesis 3: Barley protein may be converted to nanocapsules to incorporate lipophilic
bioactive compounds by high pressure technique and such nanocapsules may protect
nutraceuticals in harsh gastric juice and target deliver nutraceuticals to small intestine where they
are absorbed. (Chapter 3)
Hypothesis 4: Barley protein based electrospun fibers may be converted into nitrogen-doped
porous carbon fibers and used as supercapacitor electrode materials. (Chapter 4 and 5)
1.6.3 Objectives
The overall objective of this research is to develop value-added applications of barley proteins.
Special focue is placed on barley protein based nanocapsules as nutraceutical delivery systems,
and carbon electrode materials derived from barley protein electrospun nanofibers for
supercapacitor. This overall objective can be separated into 3 specific objectives:
Objective 1: To study the interfacial properties of B-hordein and to investigate the
conformational changes of B-hordein at the interface under compression in relation to the
interfacial network degradation in SGF. (Chapter 2)
Objective 2: To elaborate on barley protein based nanoparticles, to study the processing
conditions on particle microscopic features and to evaluate their in vitro release profile,
cytotoxicity and cellular uptake. (Chapter 3)

44
Objective 3: To develop barley proteins based electrospun nanofibers fabric and to convert them
into N-doped carbon fibers with 3D interconnected hierarchical porous structure as electrode
materials for supercapacitor. (Chapters 4 and 5)
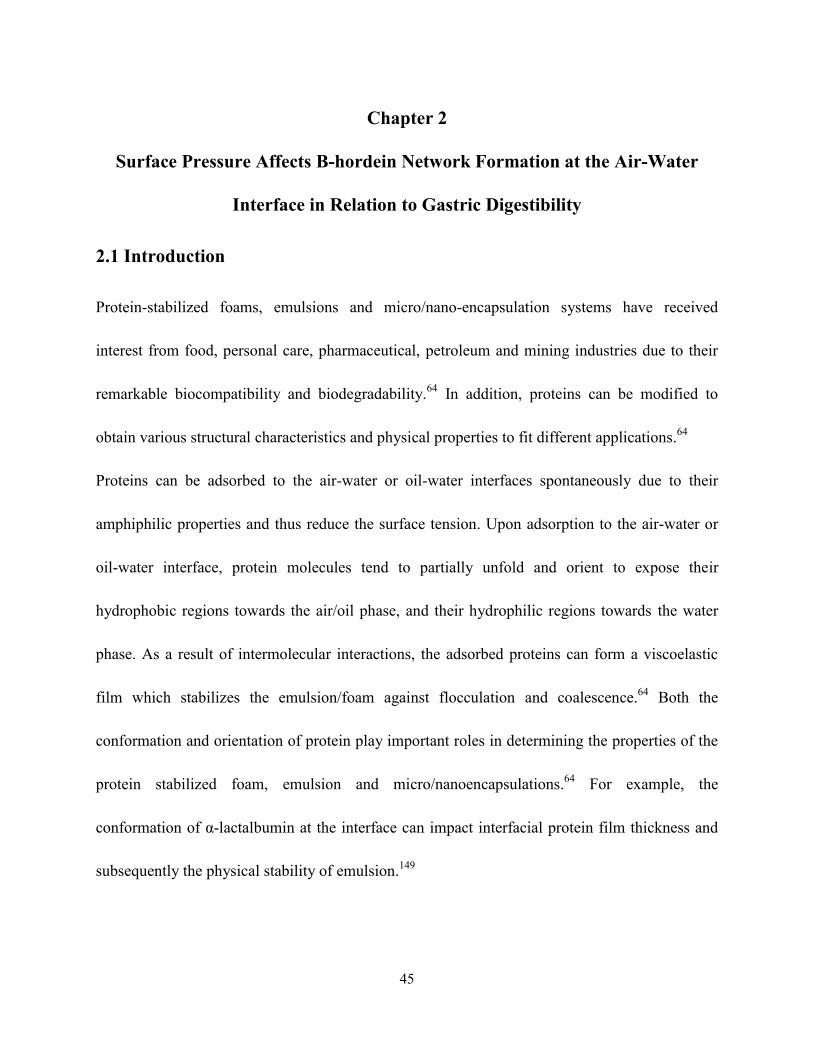
45
Chapter 2
Surface Pressure Affects B-hordein Network Formation at the Air-Water
Interface in Relation to Gastric Digestibility
2.1 Introduction
Protein-stabilized foams, emulsions and micro/nano-encapsulation systems have received
interest from food, personal care, pharmaceutical, petroleum and mining industries due to their
remarkable biocompatibility and biodegradability.64
In addition, proteins can be modified to
obtain various structural characteristics and physical properties to fit different applications.64
Proteins can be adsorbed to the air-water or oil-water interfaces spontaneously due to their
amphiphilic properties and thus reduce the surface tension. Upon adsorption to the air-water or
oil-water interface, protein molecules tend to partially unfold and orient to expose their
hydrophobic regions towards the air/oil phase, and their hydrophilic regions towards the water
phase. As a result of intermolecular interactions, the adsorbed proteins can form a viscoelastic
film which stabilizes the emulsion/foam against flocculation and coalescence.64
Both the
conformation and orientation of protein play important roles in determining the properties of the
protein stabilized foam, emulsion and micro/nanoencapsulations.64
For example, the
conformation of α-lactalbumin at the interface can impact interfacial protein film thickness and
subsequently the physical stability of emulsion.149
46
Emulsions and encapsulation systems with controllable enzyme degradation profiles are desired
in many applications, such as controlled-release pesticides in agriculture, food delivery systems,
and cosmetic and pharmaceutical products.147
Increasing interest has been paid to understand the
degradation of emulsions in order to strategically design emulsions with different digestion
profiles to accommodate various applications.150
For instance, Maldonado-Valderrama59
highlighted that different conformations of β-lactoglobulin at the interfaces of
tetradecane-in-water and olive oil-in-water emulsions may partially explain the different
responses of these emulsions to gastric degradation. However, how protein conformation and
orientation affect the digestibility of protein emulsions, in other words, the susceptibility of
interfacial protein network to enzyme degradation are still not fully understood.
The conformation and orientation of interfacial protein molecules can be modulated by process
conditions.64
For example, high pressure technologies, such as microfluidization and
homogenization, are widely used to produce industrial protein-based foams and emulsions.64
However, basic understanding on how pressure impacts protein molecular structures and
functionalities at the interface is still limited. Lee et al.151
showed that the secondary structures,
especially β-sheets and α-helices, significantly changed subsequent to protein adsorption to the
interface under high pressure homogenization. Under dynamic conditions, such as
homogenization, when oil droplet and/or air bubble size decreases, proteins work in two steps at
molecular level to facilitate the formation of foams or emulsions: first by stabilizing the newly
formed air-water or oil-water interfaces and droplet structure, and second by rearranging the
47
molecular conformation to promote a network that inhibits air bubble or oil droplet
coalescence.64
In current study, a Langmuir-Blodgett (LB) protein monolayer was used as a 2D
model film to mimic the adsorption of protein molecules to the interface and the formation of an
interfacial protein network. Also, this was a practical approach to investigate the protein
conformation and orientation changes under mechanical pressure by applying physical stresses to
the monolayer through compression of LB trough barriers.77, 152
During compression, the average
molecular area decreased, and protein molecules got crowded, which resulted in strengthened
interactions between neighbouring molecules at the interface.153
The setup of the LB trough was
shown in Figure 2-1.
Figure 2-1 Image of LB trough machine setup (biolinscientific.com). 1: frame; 2: barriers; 3:
trough top; 4: surface pressure sensor; 5: dipping mechanism for sampling; 6: interface unit.
Barley is one of the most important cereals on earth and hordein is one of the major endosperm
storage proteins of barley grain. Due to high content of proline, leucine and valine, hordein is
relatively hydrophobic and soluble in 70% ethanol.8 Hordein can be classified into 4 categories,
i.e. B, C, D and γ-hordeins. B-hordein is the dominant group and comprises about 70% of barley
prolamins.8 The amino acid sequence of B-hordein is composed of 5 distinguished domains,
48
including a non-repetitive N-terminal, a repetitive domain, a non-repetitive domain containing 5
cysteine residues, a region high in glutamine residues and a C-terminal.8 Among them, the
repetitive domain is the major part, composed of half of the amino acid residues. It was reported
that hordein has excellent surface functional properties, such as foaming154
and encapsulating26
.
Wang et al.27
β-carotene micro and nanocapsules have been successfully prepared with hordein
by high pressure homogenization. Interestingly, these hordein based micro/nanocapsules
exhibited special characteristics, where hordein formed a solid coating on oil-water interface
after high pressure homogenization and protect the encapsulated neutraceutical from oxidation.
Moreover, the thin protein film attached to the oil droplet surface was resistant to pepsin
digestion.27, 155
These characteristics might be related to the interfacial properties of the major
component B-hordein. Thus, in current study, the behaviour of B-hordein at the interface was
investigated systematically.
It was hypothesized that the conformation and orientation of B-hordein would be changed upon
compression of different surface pressures by LB-trough and these conformational changes will
subsequently influence its susceptibility to pepsin degradation. The conformation and orientation
of B-hordein films at the air-water interface were analyzed by polarization modulation - infrared
reflection absorbance spectroscopy (PM-IRRAS). The use of LB-trough in combination with
atomic force microscope (AFM) allowed the visualization the digestion process of interfacial
protein network in simplified gastric environment.
49
2.2 Materials and methods
2.2.1 Materials
Barley grains (Falcon) were kindly provided by Dr. James Helm, Alberta Agricultural and Rural
Development, Lacombe, Alberta. Hordeins were extracted from barley grains (Falcon) using an
ethanol solution according to a procedure reported elsewhere.18
In brief, barley flour was
defatted by hexane before treated with 70% (v/v) ethanol at 60°C. The supernatant of ethanol
extraction was stored at -20°C to precipitate hordein. Hordein was collected by centrifugation
and dried at room temperature (25°C). Pepsin (from porcine gastric mucosa, 424 U mg-1
) was
purchased from Sigma-Aldrich Canada Ltd (Oakville, ON, Canada). Ultrapure water, purified by
a Milli-Q Advantage A10 system (EMD Millipore Corporation, MA, USA), was used to prepare
buffers. All other chemicals were from Fisher Scientific (ON, Canada) and used as received
unless otherwise specified.
2.2.2 B-hordein extraction
B-hordein was isolated from the extracted hordeins by a protein purification system (Gilson PLC
2020,WI, USA) on a Zorbax 300SB-C8 semipreparative column (4.6 X 250 mm) with a linear
gradient mixture composed of 0.1% trifluoroacetic acid (TFA) in water and 0.1% TFA in
acetonitrile.156
The acetonitrile and TFA in the collected fraction were removed by rotary
evaporation at 60°C. The isolated sample was freeze-dried and characterized by polyacrylamide

50
gel electrophoresis (PAGE). Only one narrow band was observed in SDS-PAGE. The band was
compared with the previous work of Shewry 157
and verified as B-hordein.
2.2.3 Surface tension
The surface tension of B-hordein adsorbed to the air-water interface was measured by the
pendant drop technique with an automatic drop tensiometer (Ramѐ-Hart Instrument Co., NJ,
USA) using a method similar to a previous report.158
The drop profile was fitted to the
Young-Laplace equation to obtain the surface tension γ.
2.2.4 Interfacial dilatational rheology
The interfacial dilatational rheology was measured with the same tensiometer aforementioned
equipped with an automatic dispensing system (Ramѐ-Hart Instrument Co., NJ, USA). B-hordein
suspensions of different concentrations (0.01, 0.1 and 1 mg/mL) were filled into the tube and
needle of the dispensing system. Sinusoidal interfacial area alteration was conducted by precisely
controlling the droplet volume. In order to study the change in interfacial dilatational rheology as
a function of time, the amplitude and the frequency of the oscillation were fixed as 0.5 μL and
0.1 Hz, respectively. The dilatational modulus (Ed) was calculated by the following equation:
Ed = dγ/dlnA = E'+iE''
where A is the area and γ is the surface tension of the interface. The storage modulus (elastic
modulus, E') is the real part of the dilatational modulus and the loss modulus (viscous modulus,
51
E'') is the imaginary part. The measurements of surface tension and the dilatational rheology
were performed at room temperature.
2.2.5 Interfacial shear rheology
The air-water interfacial shear rheology of B-hordein was measured using a rheometer (HR-3,
TA instrument, Delaware, USA) equipped with a Du Noüy ring (a platinum ring with a 19 mm
inner diameter and 19.8 mm outer diameter). The interfacial oscillatory shear measurements
were conducted according to a method reported previously.53
In brief, 20 mL of the B-hordein
suspension (1.0 mg/mL) was added to a cylindrical glass dish and the Du Noüy ring was placed
at the air-water interface with caution. Experiments were conducted at a constant frequency of
0.1 Hz, and the strain was set at 1%, which was within the linear viscoelastic range. The storage
modulus (G') and the loss modulus (G'') were not dependent on the strain amplitude. The phase
lag δ was defined as tan(δ) = G''/G'. The measurements lasted for 2 h and the temperature was
kept at 25°C. A plastic cover was used to avoid possible water evaporation.
2.2.6 Surface pressure – area (π-A) isotherm and interfacial protein film deposition
A Langmuir-Blodgett Deposition Trough (KSV NIMA Biolin Scientific, Espoo, Finland) was
used to measure the π-A isotherm of B-hordein at air-water interface and to deposit the protein
films. The surface of the trough was 98 cm2. The surface pressure was monitored using the
Wilhelmy plate method. Surface pressure (π) was defined by the following equation: π = γ0 – γ,
where γ0 is the surface tension of the subphase without contamination and γ is the surface tension
52
of the subphase loaded with protein solution.49
B-hordein was dissolved in 70% ethanol solution
with 10 mM acetic acid to obtain a concentration of 1 mg/mL. Using ethanol solution helps to
spread B-hordein molecules evenly at the subphase surface and form a monolayer in LB
experiments. Phosphate buffer (50 mM, pH 7.0) filtered using a 0.22 μm filter was used as
subphase. The cleanliness of the subphase surface was checked and confirmed by compressing
the surface with the compression barriers and monitoring the surface pressure. If the surface
pressure is below 0.3 mN/m, the subphase meets the cleanliness requirement. To measure the
π-A isotherm, system temperature was maintained at 25˚C. The protein solution was spread to
the air-water interface by using a 50 μL microsyringe (Hamilton, Reno, USA) following a
well-established method.159
The injected volume of protein solution was adjusted to obtain three
different surface pressures including 10, 20 and 30 mN/m.160
The system was allowed to
equilibrate for 15 min before the film was compressed at a constant rate of 3 mm/min (equal to
1.5 cm2/min). The molecular weight of B-hordein is 14.5 kDa which was used to calculate the
area per molecule.8 After equilibrating at selected surface pressure for 15 min, the surface protein
film was deposited onto a freshly-cleaved mica surface or gold coated slides (100 nm thick gold
coating, Sigma-Aldrich Canada Ltd, ON, Canada) under constant surface pressure condition for
further measurements.

53
2.2.7 In situ digestion
The in situ digestion was conducted using the same Langmuir-Blodgett Trough at 37˚C. The
surface protein films were first compressed to selected pressures, and the systems were allowed
to equilibrate for 0.5 h. During this period, the LB barriers were controlled by the computer
software to maintain a constant surface pressure. Then, 1 M HCl was used to adjust the pH of
subphase to 2.0. The system was equilibrated for another 0.5 h, and then 20 μl pepsin (1% w/v)
was added to the subphase to initiate the digestion test. All the additions were applied carefully
using a microsyringe into the aqueous subphase outside the protein film region confined by the
two LB barriers to avoid possible disturbance of the protein film. The surface pressure changes
during the digestion process were recorded in real time. The protein film at the air-water
interface was sampled after 1 h digestion by depositing it onto mica using the method
aforementioned.
2.2.8 Atomic force microscopy (AFM)
The surface morphology and roughness of interfacial protein films before and after digestion
were characterized by an MFP-3D AFM (Asylum Research, Santa Barbara, USA) in air. The
imaging was carried out in Tapping Mode so as to minimize possible surface damage due to the
scanning of AFM tip across sample surfaces. The deposited LB protein films were air dried at
25°C before AFM characterization. To demonstrate the reproducibility of AFM results, each
experiment was repeated three times. At least three images were taken from the same protein
54
film. Images were analyzed by the software of Asylum Research Igor Pro 6.32A. The particle
sizes were measured and analyzed by ImageJ software. Particles (n=100) were randomly selected
from each image to obtain the particle size. Data were presented as mean ± standard deviation (n
= 100).
2.2.9 Polarization modulation - infrared reflection absorbance Spectroscopy (PM-IRRAS)
Protein conformation at the interface was studied by PM-IRRAS spectra, recorded using a
photoelastic modulator (HINDS PEM-90, Hillsboro, USA) in conjunction with a Fourier
transform infrared (FTIR) spectrometer (Thermo Scientific Nicolet 8700, MA, USA). The
detector used in all measurements was liquid nitrogen-cooled HgCdTe (MCT) detector with
recommended range between 4000 cm-1
to 650 cm-1
. The PEM-90 was set to a wavelength of
1700 cm-1
and half-wave retardation (λ/2) of 0.5. The incident laser beam angle was adjusted to
83˚. Dual channel-double modulation experiment was used in this study, in which two signals,
one for the sample and one for the environment were collected spontaneously. B-hordein protein
interfacial film was deposited onto the gold coated slide and dried in air for PM-IRRAS
measurement. A bare gold coated slide was applied as a reference. Each sample was scanned
1600 times at a resolution of 8 cm-1
. The amide I band was analyzed by the curve-fitting function
of the PeakFit software (Systat Software, Inc., CA, USA). A linear baseline was drawn between
1760 and 1590 cm-1
. The deconvolution was conducted by using Gaussian Lorentzian functions
with an iterative linear least-squares algorithm.74
First, peak widths and positions were fixed and

55
the intensities were allowed to change until best estimation was achieved. Then, widths,
positions and intensities of all peaks were allowed to vary simultaneously. The fitting was
continued until an iteration resulted in a decrease in the least-squares error of less than 5%
compared to that of the previous iteration.161
The deconvoluted component peaks were assigned
to specific protein secondary structures and the integrated area of the peak was proportional to
the percentage of the specific secondary structure presented in the protein.
2.2.10 Statistical analysis
All experiments were performed at least in three independent batches. The percentages of the
secondary structure elements of B-hordein and the average size of B-hordein were presented as
mean ± standard deviation.
2.3 Results and discussion
2.3.1 The interfacial properties of B-hordein
The interfacial properties and intermolecular interactions of B-hordein play important roles in the
formation of foams and emulsions for various applications, which have been systematically
investigated, for the first time, in this work.
2.3.1.1 Surface tension
The adsorption of proteins to air-water or oil-water interface is concentration and time
dependent.53
As shown in Figure 2-2 A, the evolution of surface tension as a function of time
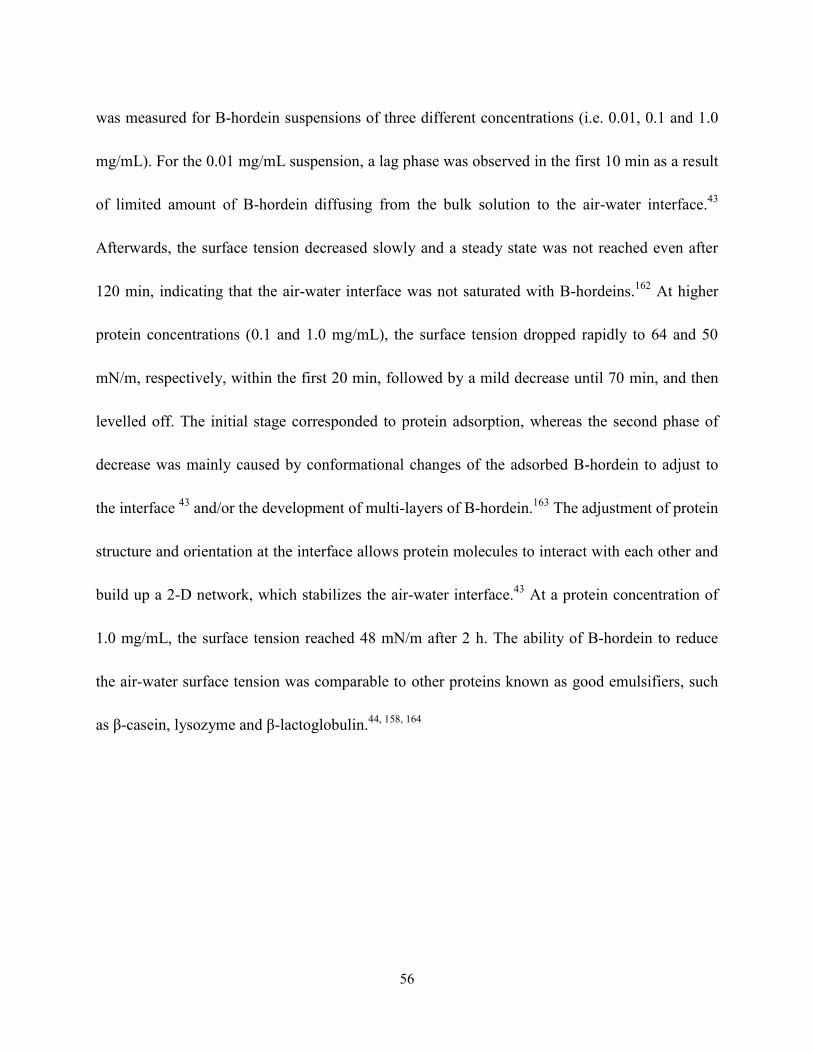
56
was measured for B-hordein suspensions of three different concentrations (i.e. 0.01, 0.1 and 1.0
mg/mL). For the 0.01 mg/mL suspension, a lag phase was observed in the first 10 min as a result
of limited amount of B-hordein diffusing from the bulk solution to the air-water interface.43
Afterwards, the surface tension decreased slowly and a steady state was not reached even after
120 min, indicating that the air-water interface was not saturated with B-hordeins.162
At higher
protein concentrations (0.1 and 1.0 mg/mL), the surface tension dropped rapidly to 64 and 50
mN/m, respectively, within the first 20 min, followed by a mild decrease until 70 min, and then
levelled off. The initial stage corresponded to protein adsorption, whereas the second phase of
decrease was mainly caused by conformational changes of the adsorbed B-hordein to adjust to
the interface 43
and/or the development of multi-layers of B-hordein.163
The adjustment of protein
structure and orientation at the interface allows protein molecules to interact with each other and
build up a 2-D network, which stabilizes the air-water interface.43
At a protein concentration of
1.0 mg/mL, the surface tension reached 48 mN/m after 2 h. The ability of B-hordein to reduce
the air-water surface tension was comparable to other proteins known as good emulsifiers, such
as β-casein, lysozyme and β-lactoglobulin.44, 158, 164
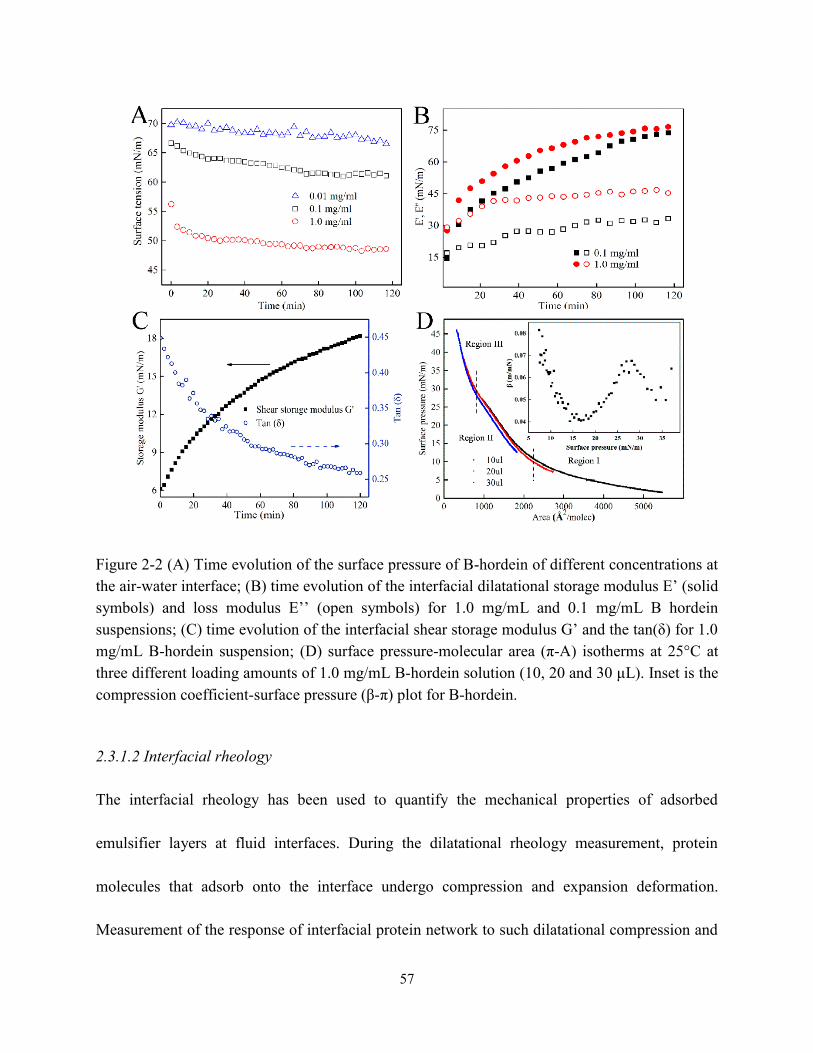
57
Figure 2-2 (A) Time evolution of the surface pressure of B-hordein of different concentrations at
the air-water interface; (B) time evolution of the interfacial dilatational storage modulus E‘ (solid
symbols) and loss modulus E‘‘ (open symbols) for 1.0 mg/mL and 0.1 mg/mL B hordein
suspensions; (C) time evolution of the interfacial shear storage modulus G‘ and the tan(δ) for 1.0
mg/mL B-hordein suspension; (D) surface pressure-molecular area (π-A) isotherms at 25°C at
three different loading amounts of 1.0 mg/mL B-hordein solution (10, 20 and 30 μL). Inset is the
compression coefficient-surface pressure (β-π) plot for B-hordein.
2.3.1.2 Interfacial rheology
The interfacial rheology has been used to quantify the mechanical properties of adsorbed
emulsifier layers at fluid interfaces. During the dilatational rheology measurement, protein
molecules that adsorb onto the interface undergo compression and expansion deformation.
Measurement of the response of interfacial protein network to such dilatational compression and
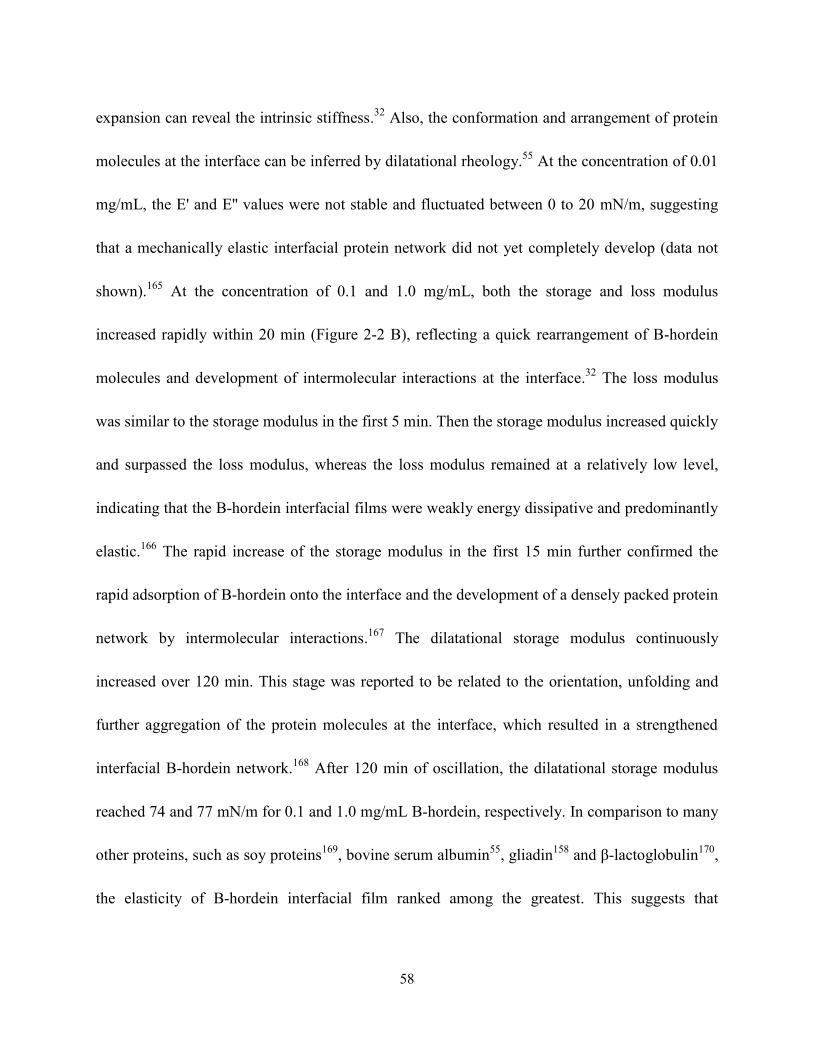
58
expansion can reveal the intrinsic stiffness.32
Also, the conformation and arrangement of protein
molecules at the interface can be inferred by dilatational rheology.55
At the concentration of 0.01
mg/mL, the E' and E'' values were not stable and fluctuated between 0 to 20 mN/m, suggesting
that a mechanically elastic interfacial protein network did not yet completely develop (data not
shown).165
At the concentration of 0.1 and 1.0 mg/mL, both the storage and loss modulus
increased rapidly within 20 min (Figure 2-2 B), reflecting a quick rearrangement of B-hordein
molecules and development of intermolecular interactions at the interface.32
The loss modulus
was similar to the storage modulus in the first 5 min. Then the storage modulus increased quickly
and surpassed the loss modulus, whereas the loss modulus remained at a relatively low level,
indicating that the B-hordein interfacial films were weakly energy dissipative and predominantly
elastic.166
The rapid increase of the storage modulus in the first 15 min further confirmed the
rapid adsorption of B-hordein onto the interface and the development of a densely packed protein
network by intermolecular interactions.167
The dilatational storage modulus continuously
increased over 120 min. This stage was reported to be related to the orientation, unfolding and
further aggregation of the protein molecules at the interface, which resulted in a strengthened
interfacial B-hordein network.168
After 120 min of oscillation, the dilatational storage modulus
reached 74 and 77 mN/m for 0.1 and 1.0 mg/mL B-hordein, respectively. In comparison to many
other proteins, such as soy proteins169
, bovine serum albumin55
, gliadin158
and β-lactoglobulin170
,
the elasticity of B-hordein interfacial film ranked among the greatest. This suggests that

59
B-hordein may possess a relatively rigid internal structure and/or develop stronger
intermolecular interactions at the interface.55
B-hordein suspension at the concentration of 1.0 mg/mL was selected for the interfacial shear
rheology study because it can form an elastic 2D network at the interface as shown by the
dilatational rheology. As shown in Figure 2-2 C, the storage modulus of B-hordein protein film
increased rapidly over 2 h. The storage modulus was predominantly larger than the loss modulus
throughout the whole measurement time range. Also the tan (δ) value remained low, supporting
the conclusion that the elasticity dominated the rheological property of the interfacial protein
film. For ideal elastic behaviour of an interface, tan (δ) equals to zero. For B-hordein, value of
tan (δ) decreased from 0.45 to 0.26, indicating that the protein network at the interface became
stiffer and more elastic as the aging time extended. As a comparison, the network of β-casein
formed at the air-water interface with a lower shear storage modulus and large tan (δ), was
described as a more viscous ―gel-like‖ structure.162
Due to its high elasticity, the B-hordein
interfacial network would be considered as a ―solid-like‖ film.171
This may be due to the
formation of a network through non-covalent intermolecular interaction such as hydrogen
bonding and hydrophobic interactions.172
This is in accordance with the findings of Wang et al.35
that hordein exhibited solid-like behaviour at the water-oil interface, although the stress used in
the interfacial shear rheology measurement was significantly less than that employed during a
real emulsification process.
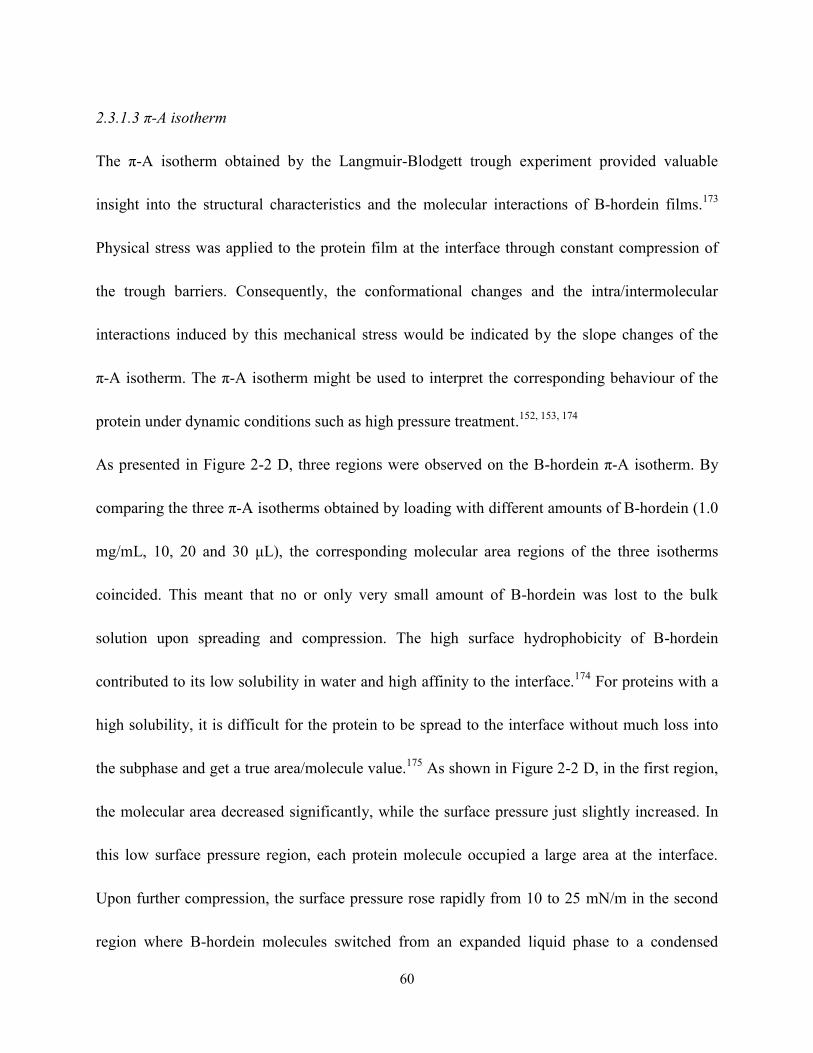
60
2.3.1.3 π-A isotherm
The π-A isotherm obtained by the Langmuir-Blodgett trough experiment provided valuable
insight into the structural characteristics and the molecular interactions of B-hordein films.173
Physical stress was applied to the protein film at the interface through constant compression of
the trough barriers. Consequently, the conformational changes and the intra/intermolecular
interactions induced by this mechanical stress would be indicated by the slope changes of the
π-A isotherm. The π-A isotherm might be used to interpret the corresponding behaviour of the
protein under dynamic conditions such as high pressure treatment.152, 153, 174
As presented in Figure 2-2 D, three regions were observed on the B-hordein π-A isotherm. By
comparing the three π-A isotherms obtained by loading with different amounts of B-hordein (1.0
mg/mL, 10, 20 and 30 μL), the corresponding molecular area regions of the three isotherms
coincided. This meant that no or only very small amount of B-hordein was lost to the bulk
solution upon spreading and compression. The high surface hydrophobicity of B-hordein
contributed to its low solubility in water and high affinity to the interface.174
For proteins with a
high solubility, it is difficult for the protein to be spread to the interface without much loss into
the subphase and get a true area/molecule value.175
As shown in Figure 2-2 D, in the first region,
the molecular area decreased significantly, while the surface pressure just slightly increased. In
this low surface pressure region, each protein molecule occupied a large area at the interface.
Upon further compression, the surface pressure rose rapidly from 10 to 25 mN/m in the second
region where B-hordein molecules switched from an expanded liquid phase to a condensed
61
liquid phase 176
. This is in agreement with the model built up previously, suggesting that
molecules experienced several phases upon compression, from gaseous phase at large molecular
area to liquid expanded, liquid condensed, solid and collapsed phases at highly condensed
molecular area.177
Furthermore, another slope change was observed upon continuous
compression to above 27 mN/m on the B-hordein π-A isotherm. In order to better characterize
this phase transition, the surface compressibility was introduced. The compressibility coefficient
β of the B-hordein interfacial film at a constant temperature (T) was calculated from the π-A
isotherm according to the following equation178
:
𝛽 = −1
𝐴 × (
𝛿𝐴
𝛿𝜋)
By plotting the β-π curve (inset of Figure 2-2 D), the phase transition can be better displayed.
The peaks at about 27 mN/m on the β-π curve represented the largest compressibility of the
protein film, which may be attributed to the alteration of the protein structure and maximization
of the intermolecular interactions.175
This phase transition to a more solid-like structure of the
B-hordein interfacial film is correlated to high storage modulus and low tan (δ) value of the
adsorbed protein film as exhibited in the abovementioned interfacial shear rheology results.
Langmuir159
interpreted this change as the transition from liquid film to a gel-like solid film. This
phase transition was not commonly found in protein emulsifiers. For example, the interfacial
protein film collapsed upon further compression after condensed liquid phase for bovine serum
albumin173
and ovalbumin.175
High molecular-weight wheat glutenin subunit 1D×5 monolayer at
the air-water interface was another plant protein showing a similar phase transition.174
But, the

62
B-hordein provided a much higher surface pressure than the wheat glutenin subunit 1D×5 at a
similar area per molecule, indicating that B-hordein was more surface active and had the
capacity to rearrange and interact with each other to adapt to very small molecular area.179
2.3.2 B-hordein orientation and conformation at the interface by PM-IRRAS
The alteration of protein conformation and susceptibility of the protein film to pepsin digestion
maybe correlated; however, more information is needed to understand the details of such a
mechanism.58
The surface selection rule leads to the high sensitivity of PM-IRRAS to the
orientation of the transition moment at the interface, which makes it suitable to analyze the
conformation and orientation of the interfacial protein molecules.74, 75
Thus, PM-IRRAS was
employed to monitor the B-hordein conformation and orientation changes at the air-water
interface under different surface pressures.
Figure 2-3 showed the PM-IRRAS spectra (1800-1400 cm-1
and the amide I band) with fitted
deconvoluted peaks. The percentage of each component and their correlated secondary structures
were summarized in Table 2-1. B-hordein PM-IRRAS spectra exhibited three major bands from
1800 to 1400 cm-1
, referring to the amide I (1700-1600 cm-1
), amide II (1600-1500 cm-1
) and CN
vibration band (1500-1400 cm-1
). The band at 1450 cm-1
, which had similar intensity as amide II,
was not commonly found in protein IR spectrum. According to previous studies based on gliadin
and polyproline,77, 180
this band could be assigned to the CN vibration in proline residues due to
the high proline content of B-hordein (~18%).8 Due to the surface selection rule, the transition
63
moments lying parallel to the surface plane show positive bands while the perpendicular
transition moments contribute to the negative bands.77
Thus, the positive bands of B-hordein
films were attributed to the amide chains lying parallel to the interface. Due to the selection rules,
in PM-IRRAS spectra, the intensity ratio of amide I and amide II is sensitive to the protein
orientation because the dipole moments of these two bands are approximately perpendicular to
each other.181
For the B-hordein interfacial film, the intensity ratio of amide I/II decreased from
6.17, 5.14 to 4.15 upon compression from 10 to 30 mN/m. The low intensity of amide II band
and the high amide I/II ratio was not commonly found among spectra reported for other proteins.
The only comparable example was α-gliadin whose amide I/II ratio was reported to be 7.77
The
contamination of TFA might contribute to the intensity of amide I. However, most of the TFA
was removed from B-hordein sample before freeze-drying by evaporation. The low intensity of
amide II band might be explained by the reason that α-helix structure orientated flat and parallel
to the surface plane when in expanded liquid phase.182
183
Upon compression, the α-helix tilted
towards the normal of the surface, leading to a decrease of the amide I/II ratio. The change of the
amide I/II ratio showed that the interfacial protein molecules rearranged to adapt to the
environment with low molecular surface area and high surface pressure. Additionally, the
shadow shoulder at 1585 cm-1
, corresponding to the antisymmetric COO- stretching vibration in
the glutamic acid residue (Glu) side chains, strongly decreased when the protein film was
compressed to 30 mN/m.184
The decrease revealed that the glutamic acid residue may tile
towards the perpendicular position of the plane of the air-water interface.78
This also indicates

64
that the interfacial B-hordein molecules changed their orientation to adapt to the smaller
molecular area upon compression. Notably, the glutamic acid residues, which are hydrophilic,
are more likely to be exposed towards a hydrophilic environment, the aqueous phase. This may
result in energy reduction and stabilization of the air-water interface.
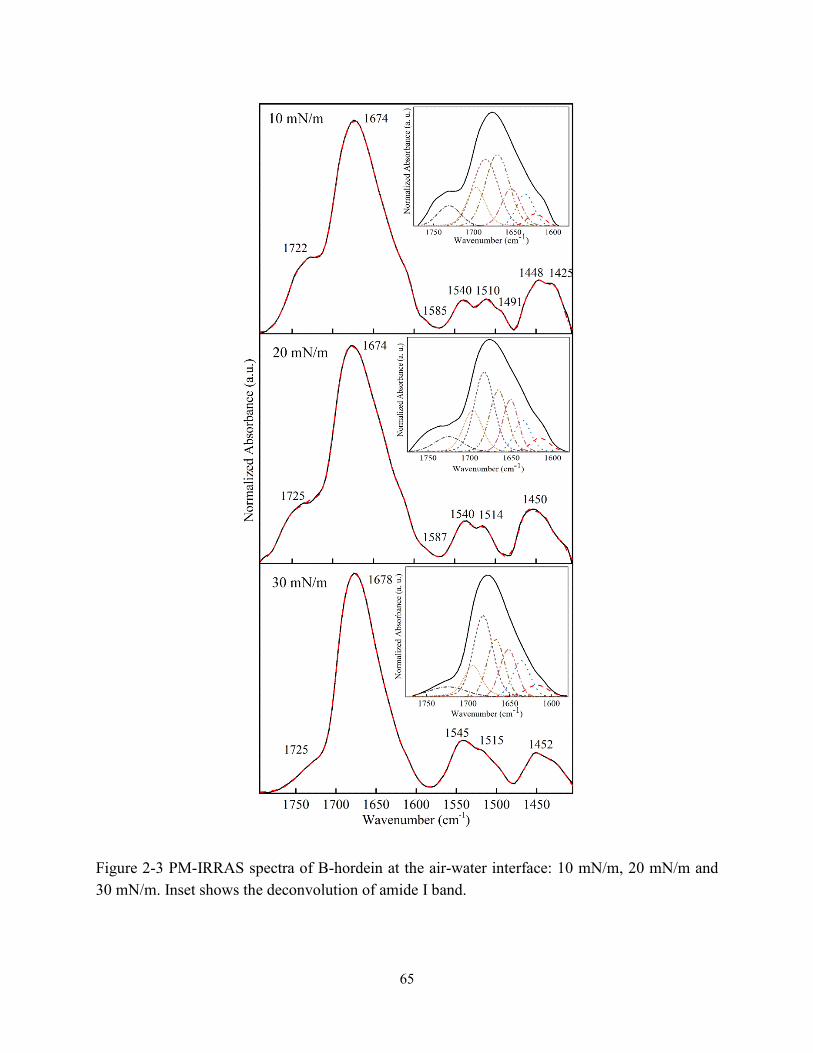
65
Figure 2-3 PM-IRRAS spectra of B-hordein at the air-water interface: 10 mN/m, 20 mN/m and
30 mN/m. Inset shows the deconvolution of amide I band.

66
Furthermore, the peak located at 1510 to 1514 cm-1
was assigned to the tyrosine (Tyr) ring
vibration, which continuously decreased as the surface pressure increased. A decrease in this
peak showed that the tyrosine ring might orient towards the normal of the air-water interface.
Also, the shoulder at around 1491 cm-1
, assigned to the tryptophan (Trp) residues (the C=C
stretching vibration coupled with C-H bending vibration), decreased under compression to 20
and 30 mN/m.78
As mentioned above, Tyr and Trp residues are located in the repetitive domain8
which is the major part of B-hordein. The movement of the Tyr and Trp may be an indicator of
the reorientation of the major repeated sequence. Due to the hydrophobic nature of the repetitive
domain,8 it is not likely to be exposed to the aqueous phase.
34 It might either be covered by the
hydrophilic amino acid region or tiled from the air-water interface to the air phase.78

67
Table 2-1 Percentage of the deconvoluted amide I band components and their corresponding
secondary structures of B-hordein at air-water interface. Data were presented as mean ± standard
deviation (n=3).
Peak assignment information was from references 77, 181, 185.
B-hordein 10 mN/m B-hordein 20 mN/m B-hordein 30mN/m Peak
assignments
Position/cm-1
Percentage/% Position
Percentage Position
Percentage
1620-1624 2.9 ±0.8 1617-1622 2.0±0.4 1616-1619 3.0 ±0.3 β-sheets
1635-1638 9.1 ±0.9 1635-1637 8.9±0.1 1634-1635 9.8±1.3 β-sheets
1652-1655 12.2±0.4 1651-1652 16.0 ± 1.0 1652 15.2 ±1.7 α-helix/
unordered
1666 26.5±2.1 1666-1667 19.9±3.3 1667-1668 21.2±0.3 β-turns
1681-1683 28.7±1.6 1682-1683 38.3±3.2 1682-1685 40.6±2.9 β-sheets/
β-turns
1692-1695 14.2±1.4 1689-1693 12.9±0.1 1693 6.2 ± 1.0 β-sheet/
β-turns
1734-1734 6.5 ±2.5 1723-1743 1.9±1.3 1724-1725 4.0±0.3 Glu side
chains
68
The deconvoluted amide I region of B-hordein gained from the air-water interface possessed 7
major bands: 1617 cm-1
(β-sheet), 1632 cm-1
(β-sheet), 1650 cm-1
(α-helix), 1666 cm-1
(β-turn),
1682 cm-1
(β-sheet), 1693 cm-1
(β-sheet/β-turn) and 1720 cm-1
(the Glu side chain).77, 181, 185
The
major bands for B hordein at the air-water interface were at 1682 and 1666 cm-1
, which were
assigned to β-sheets and β-turns, respectively. When surface pressure was changed from 10 to 20
mN/m, a significant decrease in β-turn (26.5 to 21.2%) was observed. High percentage of turn
structure indicates a low folded-status of protein molecules.77
Thus, this suggests that the protein
might refold progressively under compression. The slight increase in the α-helix structure (12.2
to 15.2%) also indicated that the B-hordein was re-organized upon adsorption at the interface.
Meanwhile, the peak assigned to β-sheet/β-turn at around 1680 cm-1
had a substantial increase
from 29% at 10 mN/m to 41% at 30 mN/m. Anti-parallel β-sheets contributed to the split peaks
at 1619 and 1680 cm-1
while the peak at 1630 cm-1
was due to the parallel β-sheets.186
Short
peptide segments of twisted or coiled β-sheet strands or small β-hairpin structures rather than
extended anti-parallel β-sheets contribute to the 1680 cm-1
peak.187
B-hordein with a large
amount of proline is likely to form turns rather than large extended β-sheets because the proline
side-chain is locked into a small ring that restricted flexibility, and it bent back again to the main
chain.188
However, short β-sheets could still be developed between turns and contribute to the
re-organization of protein molecules at the interface upon compression. The peak at 1680 cm-1
was also referred to intermolecular β-sheets as reported previously.77, 151
Development of such
interactions upon protein adsorption at the interface contributed to the growth of a homogenous

69
and elastic 2D protein film at the interface.151
The increase of β-sheets was also observed for
lysozyme when compressed from 1 to 20 mN/m, changing from liquid expanded phase to liquid
condensed phase.78, 189
The amount of β-sheets developed in lysozyme monolayer during
compression was less than that in B-hordein. The dilatational modulus and the shear modulus of
the lysozyme interfacial film was also less than those of B-hordein at the same concentration.53
From these two results, it was deduced that the interaction developed by intermolecular β-sheets
could be one of the most important factors contributing to the interfacial properties of the protein
monolayer. These conformational changes allowed interfacial B-hordein to develop
intermolecular interactions, which subsequently contributed to the formation of elastic ‗solid-like‘
B-hordein interfacial films.
2.3.3 The morphology of B-hordein at the air-water interface
2.3.3.1 The morphology
AFM was employed to observe the morphology of the B-hordein films formed and deposited at
different surface tensions (Figure 2-4). The protein film deposited at 10 mN/m showed
homogeneous morphology. B-hordein molecules showed disc-like structure and the average size
was 20.1 ± 4.5 nm (mean ± standard deviation). B-hordein molecules were apart from each other.
According to the result of π-A isotherm, the protein film at 10 mN/m was still at expanded liquid
region, so the film was not compact yet. At 20 mN/m, protein film started to become compact
and protein aggregates were observed due to a decrease in the surface area. The protein
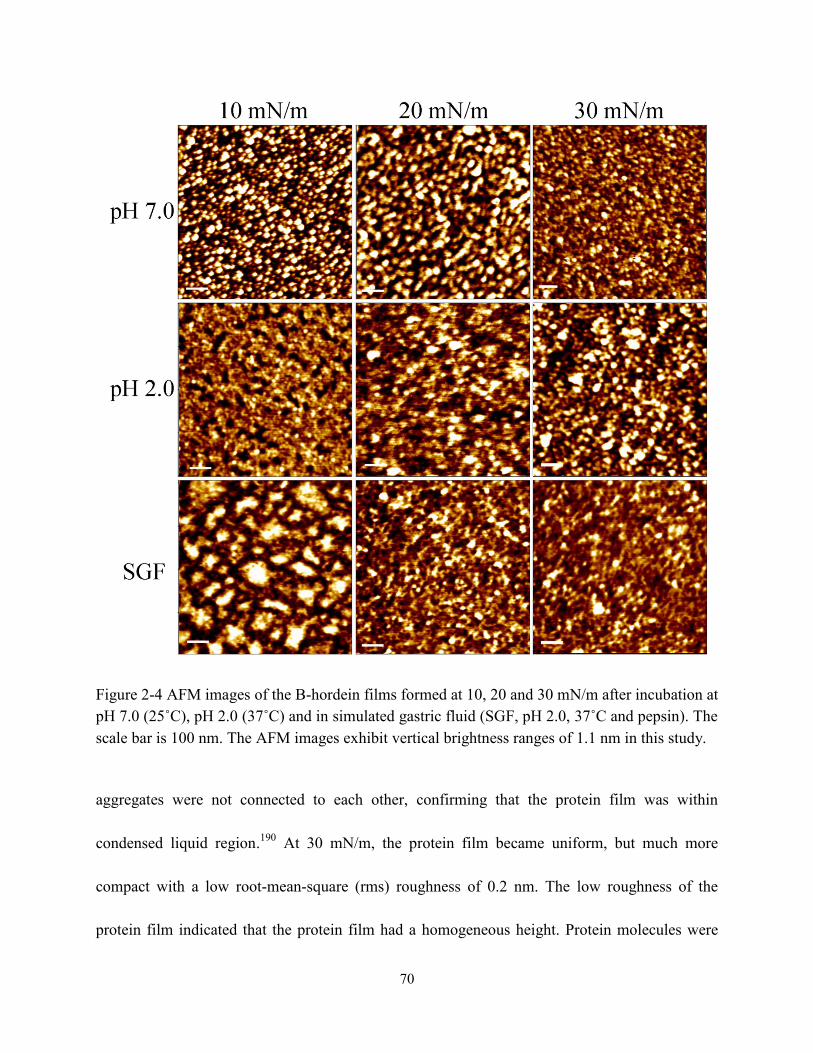
70
Figure 2-4 AFM images of the B-hordein films formed at 10, 20 and 30 mN/m after incubation at
pH 7.0 (25˚C), pH 2.0 (37˚C) and in simulated gastric fluid (SGF, pH 2.0, 37˚C and pepsin). The
scale bar is 100 nm. The AFM images exhibit vertical brightness ranges of 1.1 nm in this study.
aggregates were not connected to each other, confirming that the protein film was within
condensed liquid region.190
At 30 mN/m, the protein film became uniform, but much more
compact with a low root-mean-square (rms) roughness of 0.2 nm. The low roughness of the
protein film indicated that the protein film had a homogeneous height. Protein molecules were

71
more closed to each other. Collapse and wrinkle were not observed. The compact protein
network corresponded to the phase transition from condensed liquid to solid-like film as shown
in the π-A isotherm, which may also explain the high storage modulus showed by interfacial
dilatational and shear rheology properties.
2.3.3.2 In situ digestion of the B-hordein films
The gastric environment (acidic pH, body temperature and pepsin enzyme exposure) may
strongly modify the structure and integrity of the interfacial protein film. This may consequently
influence the stability of the emulsion.64
A major challenge to use protein stabilized emulsions as
oral delivery systems is that they are prematurely degraded by gastric enzymes before reaching
their absorption site. Firstly, the in situ digestion was conducted at pH 2.0 and 37oC without
pepsin. After 1 h incubation, morphology of the protein film prepared at 10 mN/m underwent
significant changes. Some areas lower in height as indicated by darker color appeared on the
AFM image. In AFM topographic images, the color corresponds to the vertical height. In this
study, the topographic images exhibited vertical brightness ranges of 1.1 nm. One of the possible
reasons for these phenomena may be the loss of protein molecules from the interface due to
increased B-hordein solubility when the pH of the subphase was 2.0, which was far from the
isoelectric point (pI) of hordein (pI is about 5.6).174
The height and roughness of the interfacial
protein film prepared at 20 mN/m remained similar as to those at pH 7.0. The particle size and
height of the protein film prepared at 30 mN/m did not change significantly. By comparing films
72
incubated at pH 2.0, the B-hordein films formed at higher surface pressure were more resistant to
gastric pH. As mentioned above, upon compression to 30 mN/m, the limited space between
adjacent adsorbed B-hordein molecules allowed the building up of intermolecular interactions,
which outstrip the electrical repulsion of charged amino acid residues at pH 2.0.187
Moreover, the
connections between molecules restricted the protein conformation and orientation change,
which made B-hordein hardly dissolved in low pH buffer.187
Samples were further tested in the simulated gastric fluid with pepsin. As shown by AFM,
protein film prepared at 10 mN/m changed after 1 h of incubation in SGF with pepsin. By
comparing the B-hordein film incubated at pH 2.0 and in SGF, the pepsin digestion likely
occurred. The rms roughness of the remaining protein film increased from 2.2 to 2.5 nm,
indicating that the protein molecules might have slightly rearranged and stacked together to
become more condensed. The protein films prepared at 30 mN/m remained uniform and compact
after being treated with SGF. This suggests that B-hordein films compressed at a higher surface
pressure were resistant to pepsin digestion even at relatively small thicknesses. As mentioned
above, the hydrophobic domain of B-hordein tended to avoid the water phase upon compression,
thus was ―locked‖ in the compact solid-like film networks, which limited the accessibility of
pepsin to the hydrophobic repetitive region.191
Since pepsin was reported to preferentially bind to
the hydrophobic site on the peptide before hydrolysis,192
the digestion activity of pepsin on the
protein film prepared at high surface pressure was inhibited.
73
2.4 Conclusions
In this work, the surface activities of B-hordein were systematically investigated for the first time.
A B-hordein suspension could reduce the air-water surface tension rapidly to ~45 mN/m and
form a solid-like coating at the interface. As compared to some other food proteins reported in
the literature (such as soy proteins and whey proteins), the interfacial B-hordein film had high
elasticity and compressibility. This made B-hordein a promising emulsion or foam stabilizer.
Also, it is the first example to reveal how compression impacts protein interfacial network
formation in relation to protein digestibility. When compressed from 10 to 30 mN/m, large
amount of intermolecular β-sheets was developed, which contributed to the formation of the
elastic B-hordein film at the interface, resulting in a low digestibility at stomach pH. Also, the
major hydrophobic repetitive section of B-hordein titled away from the aqueous phase, which
decreased its affinity to pepsin binding and reduce pepsin digestion. Thus, when compressed at
30 mN/m, a very strong elastic network was formed at the interface resistant to harsh gastric
environment. B-hordein has the potential to develop encapsulations of bioactive compounds
capable of bypassing the stomach intact and reaching small intestine for absorption. Generally
speaking, the findings of this study can be widely applied in various industries to better utilize
proteins as natural emulsifiers and micro/nano-encapsulation materials to obtain desired
properties.
74
Chapter 3
Elaboration and Characterization of Barley Protein Nanoparticles as an Oral
Delivery System for Lipophilic Bioactive Compounds
3.1 Introduction
Increasing scientific evidence has shown that bioactive compounds, such as polyunsaturated fatty
acids, phytosterols, carotenoids and vitamins, have the potential to reduce the risk of chronic
diseases and improve public health. Their efficacy depends on the dose, the preserved biological
activity and the bioavailability.193
However, many lipophilic bioactive compounds exhibit low
bioavailability due to insufficient residence time in the gut, or low permeability and/or low
solubility within the intestinal tract, which can limit their potential activity in vivo.148
For
example, of the total amount of carotenoids found in fruits and vegetables, only a small
proportion is bioavailable.194
These compounds exhibit antioxidant activities which can protect
cells against oxidation to reduce the risk of cardiovascular disease, cancer, and aging-related
diseases. Nanoencapsulation of nutraceuticals is emerging as a promising approach for delivering
health promoting substances to wide populations without harming the sensory quality of food,
while providing benefits of protection and improved bioavailability. Nanoparticles can
dramatically prolong the formulation residence time by decreasing the influence of intestinal
clearance mechanisms and by increasing the surface area to interact with the biological support.
In addition, some of them are small enough to cross the epithelial lining of the gut and are
75
readily taken up by cells, allowing efficient delivery of active compounds to target sites in the
body.195
However, the application of nanotechnology in the food industry is still limited due to
the lack of effective food grade materials along with safe and economic processing.196
Food grade proteins are interesting materials for nanoparticle preparation due to their excellent
biocompatibility and biodegradability, as well as unique properties in forming gels, emulsions,
and emulsion gels, thus offering the capacity of incorporating both hydrophilic and lipophilic
bioactive molecules until release at the functional site. In spite of the promising potential, there
are several formidable challenges which have to be overcome before they can be widely used as
nutraceutical delivery systems. Firstly, nanoparticles prepared using protein materials involve
processing such as emulsification-solvent evaporation, chemical or heat-induced crosslinking
and coacervation. These normally demand heating and/or organic solvents, which cannot be
applied to heat-labile bioactive compounds and may cause concerns about the potentially toxic
residuals.195
Secondly, feasible processing conditions for mass production of stable protein-based
nanoparticles are lacking. In many cases, small molecule surfactants are required to stabilize
food protein nanoparticles,197
which may result in controversies about their health risks.
Moreover, due to the digestibility of food proteins in gastric environments and the high
surface-to-volume ratio of nanoparticles, the incorporated nutraceuticals are normally released
rapidly in the stomach, resulting in a limited amount of nutraceutical compounds that can reach
small intestine where they need to be absorbed to exert health benefits. Therefore, new protein
materials and feasible processing conditions are required to address these challenges.
76
Barley proteins are one of the most abundant and inexpensive natural food protein sources. The
major fractions are hordein (about 45 wt%) and glutelin (4 to 45%). Due to their unique
molecular structures and high content of hydrophobic amino acid residues, barley proteins has
been demonstrated good foaming,21
emulsifying,21
and film forming23
capacities. Recently,
microparticles from barley protein have been developed in our group by a pre-emulsifying
process followed by microfluidizing without using organic solvent or cross-linking reagents. In
addition, these microparticles exhibited the ability to protect the encapsulated lipid phase in
simulated gastric fluid and release them under simulated intestinal conditions.27
Therefore, it
would be interesting to adapt this technology to create new nanoparticles from barley proteins for
new or improved properties. This work aims to elaborate on barley protein based nanoparticles
and study the impact of processing conditions on particle microscopic features including size,
size distribution, morphology and surface charge. Subsequently, the in vitro release properties of
the optimized barley protein nanoparticles were tested in the simulated gastro-intestinal tract
using β-carotene as a model bioactive compound. Cytotoxicity and cellular uptake were also
evaluated preliminarily by the Caco-2 cell model to study their biocompatibility and efficacy.
3.2 Materials and methods
3.2.1 Materials
Barley flour was milled from pearled barley grains (Falcon), which was kindly provided by Dr.
James Helm, Alberta Agriculturel and Rural Development, Lacombe, AB, Canada. Barley
77
protein was extracted from barley flour by alkaline solution according to methods previously
established 18
. Briefly, after pearling and milling, barley flour was passed through a sieve with
mesh size of 0.08 mm. The barley flour was extracted by alkaline solution (pH 11.5). Then, the
pH of supernatant from alkali extraction was adjusted to 5.4 to precipitate the barley protein. The
protein content was 90 wt% (dry basis) as measured by combustion with a nitrogen analyzer
(FP-428, Leco Corporation, St. Joseph, MI, USA). The canola oil used in the present work was
purchased from a local supermarket. β-Carotene, pepsin (from porcine gastric mucosa, 424
U/mg), pancreatin (from porcine pancreas),
3-(4,5-Dimethylthiazol-2-yl)-2,5-diphenyltetrazolium bromide (MTT), dimethyl sulfoxide
(DMSO) and Nile Red were purchased from Sigma-Aldrich Canada Ltd (Oakville, ON, Canada).
Alexa Fluor dyes, 4',6-diamidino-2-phenylindole (DAPI) and mounting medium were from Life
technologies (Burlington, ON, Canada). Other cell culture reagents including Dulbecco‘s
Modified Eagle Medium (DMEM), fetal bovine serum (FBS), non-essential amino acids
(NEAA), HEPES solution, trypsin-EDTA and Hank‘s balanced salt solution (HBSS) were
purchased from GIBCO (Burlington, ON, Canada). Human colorectal adenocarcinoma cell line
Caco-2 was purchased from the American Type Culture Collection (ATCC, Manassas, VA,
USA). All chemicals used in this work were of reagent grade.
78
3.2.2 Nanoparticle preparation
Nanoparticles were prepared with barley protein as a coating material and canola oil as lipid
phase. β-Carotene (0.05% w/v) was added in the lipid phase as a model lipophilic bioactive
compound. The oil phase was added to the aqueous protein suspension, followed by high speed
homogenization (30,000 rpm, PowderGen, Fisher Scientific International, Inc., CA, USA) to
prepare a coarse emulsion. Then, the pre-mixed emulsion was passed through a high pressure
homogenizer (NanoDeBee, Bee International, Inc., MA, USA) to form solid nanoparticles.
Different processing pressures (4, 8, 12, 16 and 20 kpsi), recirculation numbers (1 to 6), protein
concentrations (2, 3 and 5% w/v) and oil-to-protein ratios (0.2 to 5), respectively, were applied to
prepare nanoparticle of various properties as characterized in section 3.2.3. The prepared
nanoparticles were stored at 4°C with 0.025% (w/v) sodium azide until use.
3.2.3 Nanoparticle characterizations
The size, size distribution as indicated by polydispersity index (PDI), and zeta potential of the
nanoparticles were measured at room temperature (23°C) by dynamic light scattering and laser
Doppler velocimetry using a Zetasizer NanoS (model ZEN 1600, Malvern Instruments Ltd, UK).
The protein refractive index (RI) was set at 1.45 and dispersion medium RI was 1.33.27
The
nanoparticle samples were diluted to appropriate concentration by phosphate buffer (pH 7) to
avoid multiple scattering before analysis. The data were averaged from at least three batches.
The storage stability of the nanoparticles was investigated by measuring particle size at different
79
time intervals during storage at 4°C in dark. Samples were diluted one time with deionized water
before storage.
Methods used to quantitatively measure the surface oil percentage and encapsulation efficiency
were adapted from Beaulieu, et al. 27
with modifications. Pure ethanol (7 mL) was added into 3
mL nanoparticle suspension to break the particles as a major component of barley protein,
hordein, is soluble in 60-70% ethanol solution.27
Then 10 mL of hexane was added and the
mixture was shaken vigorously with a vortex mixer for another 1 min and allowed to stand for 1
min. These mixing and standing procedures were repeated twice. The final mixture was
centrifuged at 8,000 g for 15 min at 20°C. After centrifugation, 5 mL hexane was transferred to a
tube and evaporated under nitrogen to remove the solvent. The remaining oil was weighed to the
nearest 0.1 mg. The oil extracted in this method was the oil in the nanoparticle suspension,
including the surface oil and encapsulated oil. The surface oil amount was measured by a similar
method, but only hexane was added into the nanoparticle suspension. The amount of
encapsulated oil can be calculated by the amount of oil in the suspension subtracting the surface
oil amount. The amount of oil added into the system before processing was called total oil.
The surface oil percentage was calculated by the following equation:
Surface Oil%=𝑊𝑠𝑢𝑟𝑓𝑎𝑐𝑒 𝑜𝑖𝑙
𝑊surface oil+𝑊encapsulated oil×100% (1)
The encapsulation efficiency (EE) and loading capacity (LC) were calculated by the following
equations:
EE%=𝑊encapsulated oil
𝑊total oil×100% (2)
80
LC%=𝑊encapsulated oil
𝑊𝑝𝑎𝑟𝑡𝑖𝑐𝑙𝑒𝑠×100% (3)
where, Wsurface oil, Wencapsulated oil and Wtotal oil represent the weight of oil attached on the surface,
encapsulated in the protein matrix and the total oil added initially. Wparticles means the dry weight
of the particles encapsulating oil inside. Nanoparticle suspension (3 mL) was added to a weighed
tube and dried at 85°C. The remaining residues were weighed to the nearest 0.1 mg.
The morphology of the nanoparticles was observed by a transmission electron microscopy (TEM,
Morgagni 268, Philips-FEI, Hillsboro, USA) at an accelerating voltage of 80 kV. Nanoparticles
were negatively stained by 2% (w/v) sodium phosphotungstate (pH 7.4). One drop of
nanoparticle sample was added to a copper grid covered with nitrocellulose and kept still for 3
min. Then, a drop of sodium phosphotungstate (2%, w/v) was applied to top of the nanoparticle
droplet on the grid. Excess liquid was blotted from the grid, and then samples were air dried at
25°C.
3.2.4 In vitro protein matrix degradation
The in vitro protein matrix degradation assays were conducted in simulated gastric fluid (SGF,
pH 1.5 with 0.1% w/v pepsin) and simulated intestinal fluid (SIF, pH 7.4 with 1.0% w/v
pancreatin). Changes in nanoparticle morphology after incubating in SGF and SIF were observed
using the TEM and the samples were treated in the same way as above. The size change of the
nanoparticles in the SGF and SIF was also monitored using the Zetasizer NanoS instrument
under the same conditions as indicated above.
81
3.2.5 In vitro release properties of barley protein nanoparticles
The release properties of barley protein nanoparticles were also measured in the simulated
gastro-intestinal tract. Briefly, nanoparticles (containing 12 mg barley protein) were incubated in
SGF at 37°C for 1 h. The digestion was stopped by heating the sample to 95°C for 3 min to
inactivate enzymes. The released β-carotene was extracted with hexane and quantitatively
determined by reading the absorbance at 450 nm with a UV-visible spectrophotometer (model
V-530, Jasco, CA, USA).198
After incubation in SGF for 1 h, the pH of the mixture was adjusted to 7.5 with concentrated
NaOH. Then pancreatin suspension was added to initiate the digestion and final pancreatin
concentration was 1% (w/v). The mixture was incubated at 37°C and samples were taken at
different time intervals. The digestion was stopped after 8 h by heating the sample to 95°C for 3
min. The degradation of nanoparticle and release of β-carotene was assessed by a lipid digestion
model which was increasingly used to in vitro evaluate the lipid-based drug/nutraceutical
delivery system.199
The dynamic lipid digestion was measured through the methods described by
Li et al. with slight modification. The products of pancreatin lipase were mainly
2-monoglyceride and fatty acids.200
The released free fatty acid was titrated by 0.1 M NaOH to
maintain the pH value at 7.5. The volume of NaOH added was recorded and used to calculate the
concentration of free fatty acids generated during digestion. The cumulative released free fatty
acid percentage was calculated using the following equations200
:
82
𝑉𝑀𝐴𝑋=2×(𝑊𝑜𝑖𝑙
𝑀𝑊𝑜𝑖𝑙×
1000
𝐶𝑁𝑎𝑂𝐻) (4)
Free Fatty Acid Released%=𝑉𝐸𝑋𝑃
𝑉𝑀𝐴𝑋×100% (5)
where, Woil is the total weight of oil participated in the digestion (g) and MWoil is the molecular
weight of the oil (g per mol). For canola oil, MWoil is 882.1 g/mol.201
CNaOH is the concentration
of NaOH used (0.1 mol/L); VMax is the volume of NaOH used to neutralize all the free fatty acid
released from lipid when all the triglycerides were converted into two free fatty acids and one
monoglycerides; and VExp is the actual volume of NaOH titrated during measurement.
3.2.6 In vitro cytotoxicity and Caco-2 cell uptake
Caco-2 cells were grown in T-75 flasks at 37°C in a humidified atmosphere of 5% CO2. The
cells were cultured in DMEM supplemented with 20% FBS (v/v), 1% NEAA and 25 mM
HEPES. The medium was changed every other day until the cells reached 80% confluence, when
the cells were removed with 0.25% trypsin in 1 mM EDTA solution at 37°C for 4-6 min and
passaged with fresh medium.
The cytotoxicity of the nanoparticles was examined by MTT assay. Caco-2 cells were transferred
onto 96-well plates at a density of 8,000 cells per well in 100 µl culture medium. The cells were
grown for 24 h to allow attachment before the experiment. Nanoparticles were added into each
well to reach a final concentration of 0.5, 0.25 and 0.125 mg/mL respectively, and incubated
with the cells at 37°C for 6 h. 10 µl of MTT solvent (5 mg/mL in PBS) was then added to each
well and incubated for a further 4 h at 37°C followed by removal of the medium from each well.
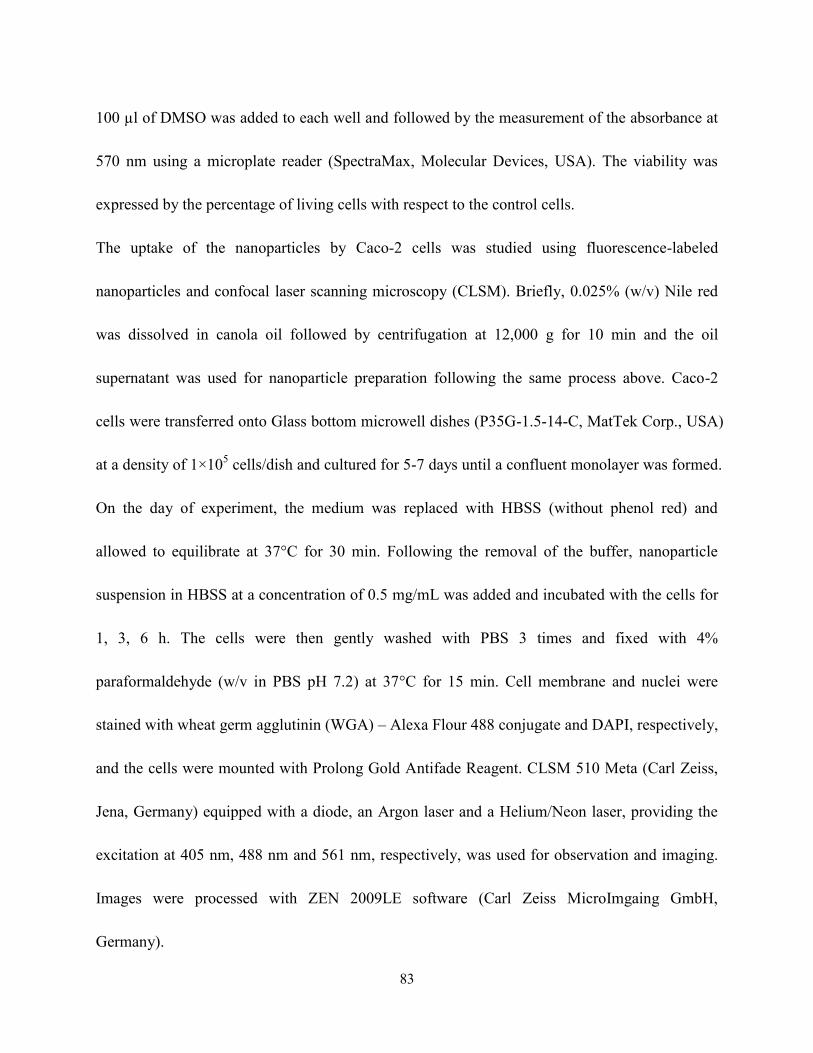
83
100 µl of DMSO was added to each well and followed by the measurement of the absorbance at
570 nm using a microplate reader (SpectraMax, Molecular Devices, USA). The viability was
expressed by the percentage of living cells with respect to the control cells.
The uptake of the nanoparticles by Caco-2 cells was studied using fluorescence-labeled
nanoparticles and confocal laser scanning microscopy (CLSM). Briefly, 0.025% (w/v) Nile red
was dissolved in canola oil followed by centrifugation at 12,000 g for 10 min and the oil
supernatant was used for nanoparticle preparation following the same process above. Caco-2
cells were transferred onto Glass bottom microwell dishes (P35G-1.5-14-C, MatTek Corp., USA)
at a density of 1×10⁵ cells/dish and cultured for 5-7 days until a confluent monolayer was formed.
On the day of experiment, the medium was replaced with HBSS (without phenol red) and
allowed to equilibrate at 37°C for 30 min. Following the removal of the buffer, nanoparticle
suspension in HBSS at a concentration of 0.5 mg/mL was added and incubated with the cells for
1, 3, 6 h. The cells were then gently washed with PBS 3 times and fixed with 4%
paraformaldehyde (w/v in PBS pH 7.2) at 37°C for 15 min. Cell membrane and nuclei were
stained with wheat germ agglutinin (WGA) – Alexa Flour 488 conjugate and DAPI, respectively,
and the cells were mounted with Prolong Gold Antifade Reagent. CLSM 510 Meta (Carl Zeiss,
Jena, Germany) equipped with a diode, an Argon laser and a Helium/Neon laser, providing the
excitation at 405 nm, 488 nm and 561 nm, respectively, was used for observation and imaging.
Images were processed with ZEN 2009LE software (Carl Zeiss MicroImgaing GmbH,
Germany).

84
3.2.7 Statistical analysis
All experiments were performed at least in three independent batches. Data were represented as
the mean of three batches ± standard deviation. For data in figures, error bars showed standard
deviations. Statistical evaluation was conducted by Student t-test and analysis of variance
(ANOVA) using SAS (SAS Institute, Inc., Cary, NC). The multiple comparisons of the means
was performed using Duncan‘s multiple-range test. Statistical differences between samples were
performed with a level of significance at p<0.05.
3.3 Results and discussion
3.3.1 Barley protein nanoparticle preparation
For globular proteins such as soy and whey proteins, emulsions are normally generated after high
pressure homogenization due to the fact that hydrophilic protein molecules usually form a
gel-like viscoelastic thin film outside an oil droplet to stabilize it in aqueous phase.202
Solid
nanoparticles can be derived from its corresponding nanoemulsion through solidifying and/or
hardening processes by adding a cross-linking reagent (e.g. glutaraldehyde, transglutaminase), or
coacervating with oppositely charged polymers.203
Interestingly, solid nanoparticles were
generated from barley protein stabilized coarse emulsion directly after high pressure
homogenization (Figure 3-1 A). Barley protein formed solid microparticles during the
micro-fluidization process due to the surface hydrophobic nature of their molecular structures
which enabled them to adhere and completely cover the oil droplets rapidly in the pre-emulsion
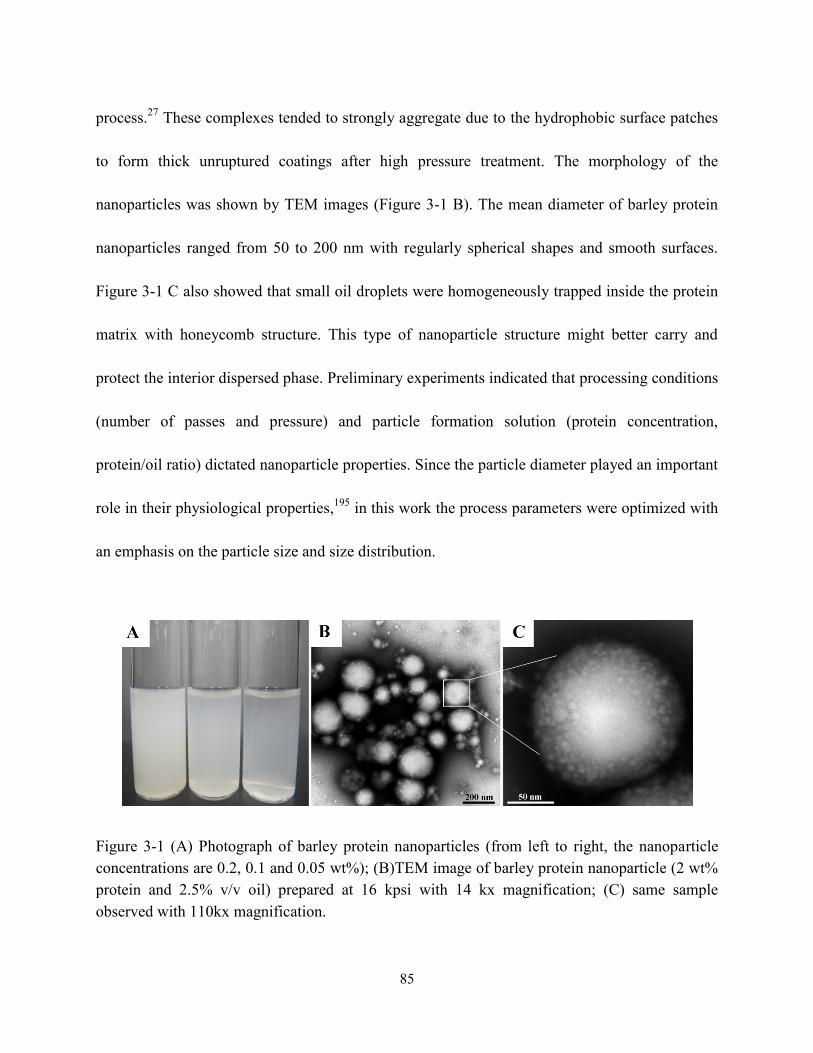
85
process.27
These complexes tended to strongly aggregate due to the hydrophobic surface patches
to form thick unruptured coatings after high pressure treatment. The morphology of the
nanoparticles was shown by TEM images (Figure 3-1 B). The mean diameter of barley protein
nanoparticles ranged from 50 to 200 nm with regularly spherical shapes and smooth surfaces.
Figure 3-1 C also showed that small oil droplets were homogeneously trapped inside the protein
matrix with honeycomb structure. This type of nanoparticle structure might better carry and
protect the interior dispersed phase. Preliminary experiments indicated that processing conditions
(number of passes and pressure) and particle formation solution (protein concentration,
protein/oil ratio) dictated nanoparticle properties. Since the particle diameter played an important
role in their physiological properties,195
in this work the process parameters were optimized with
an emphasis on the particle size and size distribution.
Figure 3-1 (A) Photograph of barley protein nanoparticles (from left to right, the nanoparticle
concentrations are 0.2, 0.1 and 0.05 wt%); (B)TEM image of barley protein nanoparticle (2 wt%
protein and 2.5% v/v oil) prepared at 16 kpsi with 14 kx magnification; (C) same sample
observed with 110kx magnification.
86
3.3.1.1 The influence of homogenization parameters on the particle size
High pressure homogenization is a kind of high energy input emulsification technique, whose
performance strongly depends on the amount of energy supplied to the reaction system.
Numerous researches have shown that the particle size could be controlled by changing the
pressure and recirculation number under a given set of emulsion compositions.204
Thus, the
effects of these two parameters on particle size were investigated.
Firstly, the particles were prepared with 2% (w/v) protein and 2.5% (v/v) oil under two selected
pressures (12 and 16 kpsi) which allowed formation of well-dispersed nanoparticles with
spherical shapes. Figure 3-2 demonstrates that with an increase of the recirculation number from
1 to 3, the diameter of particles prepared at 12 kpsi decreased from 494 to 246 nm, while
particles prepared at 16 kpsi decreased from 264 to 162 nm. This result is in agreement with
previous studies.205, 206
Increasing recirculation time led to prolonged exposure of nanoparticles
in the high pressure emulsification unit, which resulted in stronger energy input and higher
degree of oil droplet disruption.204
Even through a tendency to decrease particle size was
observed as the recirculation number further increased, the reductions became modest after 4
passes and leveled off gradually. The smallest mean particle size was 195 nm for 12 kpsi and 147
nm for 16 kpsi after 6 passes. Since the efficiency of particle size disruption was limited by the
emulsion composition and other emulsification conditions, it was no longer efficient to minimize
particle size by increasing the number of passes. On the other hand, increasing the number of
recirculation significantly narrowed the particle size distribution as indicated by decreased PDI
87
value (inset in Figure 3-2), which was reported to have important effects on nanoparticle
applications.207
PDI of the sample dropped from 0.55 to 0.33 and from 0.43 to 0.25 after 6 passes
of homogenization under 12 and 16 kpsi, respectively, indicating that the particle size
distribution was acceptably homogeneous after 6 passes, since a PDI value of less than 0.3
indicates a narrow size distribution.206
This result was expected because a longer energy input
duration and a stronger dispersive effect on the oil droplets could be achieved by increasing the
recirculation number.208
Thus, 6 times of recirculation was selected as the optimized condition
for further experiments.
Figure 3-2 Effect of number of recirculation on the mean particle size of samples produced with
2 wt% barley protein and 2.5% (v/v) oil. The inset showed the effect of number of recirculation
on particle size distribution as indicated by PDI. Different letters above or below the curve
indicate significant difference (p<0.05) due to processing pressure.
88
The influence of processing pressure on particle size was shown in Figure 3-3. Here the particles
were prepared with 2 and 3% (w/v) protein and 2.5% (v/v) oil. When particles were prepared
with 2% protein, the mean particle diameter dropped from 339 to 147 nm with increasing
homogenizing pressure from 4 to 16 kpsi. Higher pressure input could lead to higher degree of
protein unfolding and oil droplet disruption, resulting in smaller particle sizes.205, 206
On the
contrary, samples prepared with 3% protein had modest changes at the tested pressure range,
which indicated the emulsion formula significantly influence the particle size as well. An
obvious transition point at 16 kpsi was observed for both samples. With pressure rising above 16
kpsi, particle sizes increased significantly. This ‗over-processing‘ phenomenon was also
observed in several emulsion systems using biopolymers as emulsifier.209
During high pressure
homogenization, the particle size distribution was determined by the equilibrium between two
opposite actions happening at the same time: oil droplet disruption and re-coalescence. The
excessive energy input at 20 kpsi might not result in additional protein adsorption to the
disrupted oil surface. Inversely, shorter residence time of the emulsion in the emulsifying unit
along with other reasons led to a higher re-coalescence rate. Furthermore, higher pressures also
produced nanoparticles with more narrow size distributions due to the fact that higher energy
input could disrupt the large particles which survived under low pressure. The PDI values
decreased from 0.4-0.6 to 0.25 for the selected two samples when pressure increased from 4 to
16 kpsi as shown in insert of Figure 3-3. A further increase of the pressure to 20 kpsi resulted in
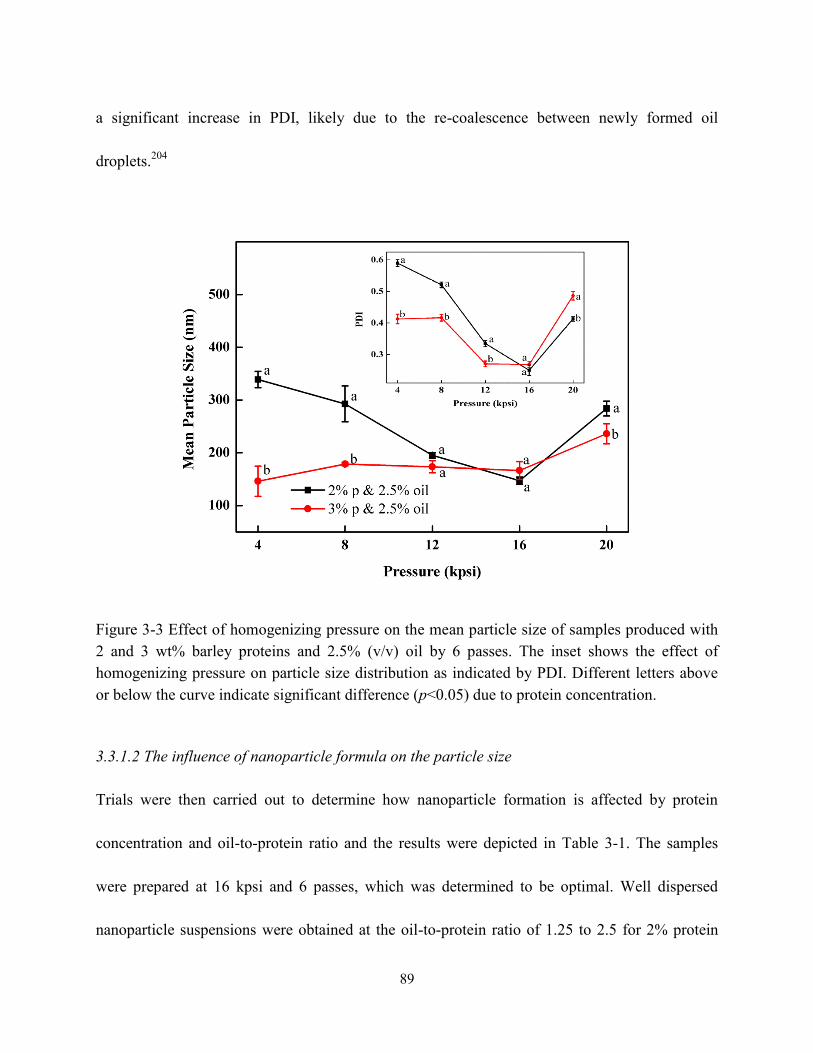
89
a significant increase in PDI, likely due to the re-coalescence between newly formed oil
droplets.204
Figure 3-3 Effect of homogenizing pressure on the mean particle size of samples produced with
2 and 3 wt% barley proteins and 2.5% (v/v) oil by 6 passes. The inset shows the effect of
homogenizing pressure on particle size distribution as indicated by PDI. Different letters above
or below the curve indicate significant difference (p<0.05) due to protein concentration.
3.3.1.2 The influence of nanoparticle formula on the particle size
Trials were then carried out to determine how nanoparticle formation is affected by protein
concentration and oil-to-protein ratio and the results were depicted in Table 3-1. The samples
were prepared at 16 kpsi and 6 passes, which was determined to be optimal. Well dispersed
nanoparticle suspensions were obtained at the oil-to-protein ratio of 1.25 to 2.5 for 2% protein
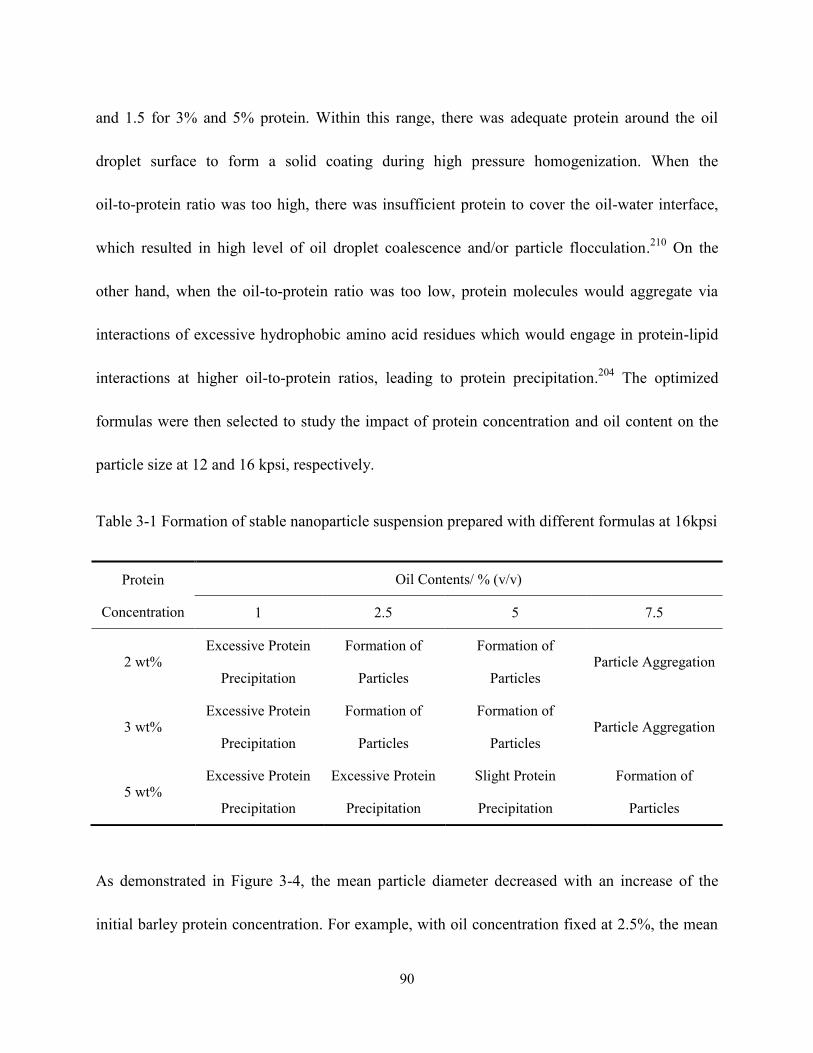
90
and 1.5 for 3% and 5% protein. Within this range, there was adequate protein around the oil
droplet surface to form a solid coating during high pressure homogenization. When the
oil-to-protein ratio was too high, there was insufficient protein to cover the oil-water interface,
which resulted in high level of oil droplet coalescence and/or particle flocculation.210
On the
other hand, when the oil-to-protein ratio was too low, protein molecules would aggregate via
interactions of excessive hydrophobic amino acid residues which would engage in protein-lipid
interactions at higher oil-to-protein ratios, leading to protein precipitation.204
The optimized
formulas were then selected to study the impact of protein concentration and oil content on the
particle size at 12 and 16 kpsi, respectively.
Table 3-1 Formation of stable nanoparticle suspension prepared with different formulas at 16kpsi
Protein
Concentration
Oil Contents/ % (v/v)
1 2.5 5 7.5
2 wt% Excessive Protein
Precipitation
Formation of
Particles
Formation of
Particles Particle Aggregation
3 wt% Excessive Protein
Precipitation
Formation of
Particles
Formation of
Particles Particle Aggregation
5 wt% Excessive Protein
Precipitation
Excessive Protein
Precipitation
Slight Protein
Precipitation
Formation of
Particles
As demonstrated in Figure 3-4, the mean particle diameter decreased with an increase of the
initial barley protein concentration. For example, with oil concentration fixed at 2.5%, the mean
91
particle diameters were 195, 174 and 127 nm when prepared at 12 kpsi with 2%, 3% and 5%
barley protein, respectively. This result was expected because higher protein concentrations led
to thicker coatings outside oil droplets during high pressure homogenization, which reduced the
surface tension and avoided the re-coalescence between disrupted oil droplets.204
For the same
reason, PDI of nanoparticle samples decreased as initial protein concentration increased.
Samples prepared with 5% protein had PDI of 0.29 and 0.27 at 12 and 16 kpsi, respectively even
when the oil concentration was as high as 7.5%. On the other hand, for the same protein
concentration, particle size increased significantly with the rising oil ratio at both 12 and 16 kpsi,
as shown in Figures 3-4 and 3-5. For example, at protein concentration of 5%, the particle size
increased from 92 to 179 and 202 nm when oil content was raised from 2.5 to 5 and 7.5%,
respectively. A higher ratio of the oil phase would increase the viscosity of the emulsion, and
thereby more energy input was required for droplet disruption. Meanwhile, it led to higher
frequency of oil droplet re-coalescence as there were not sufficient barley proteins to cover the
disrupted oil droplets. The PDI of samples prepared with 3% protein at 16 kpsi increased from
0.22 to 0.44 when the oil content increased from 1% to 7.5%.
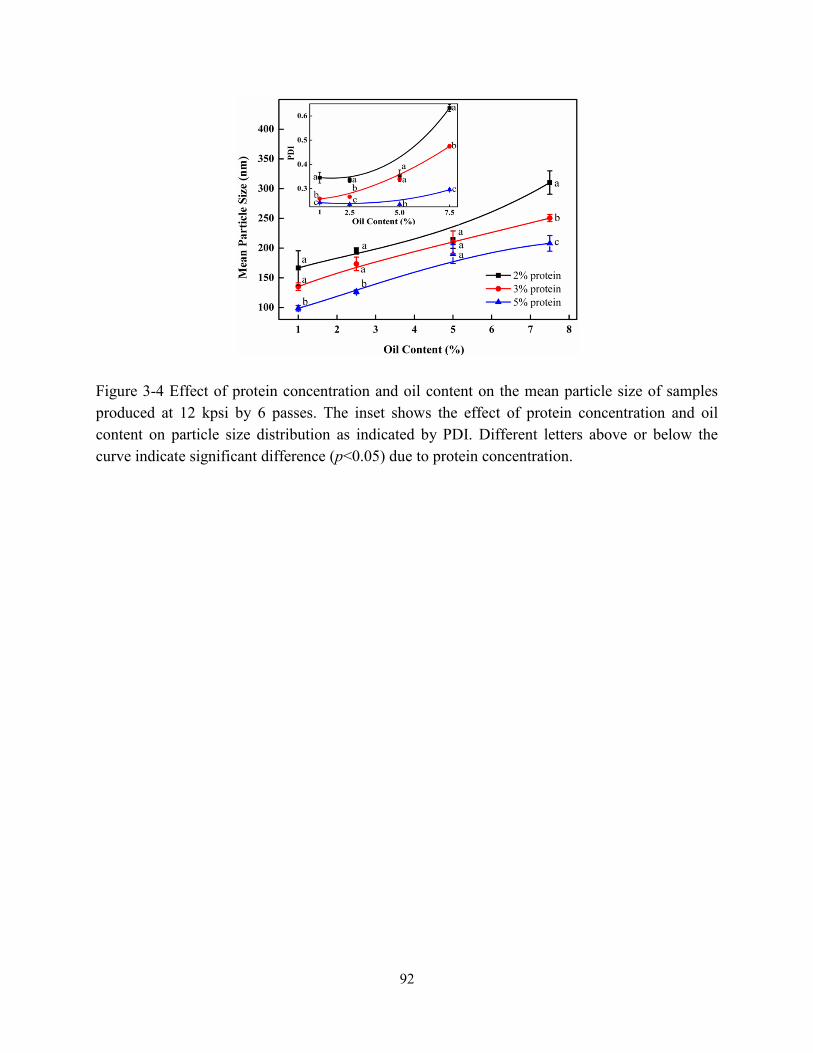
92
Figure 3-4 Effect of protein concentration and oil content on the mean particle size of samples
produced at 12 kpsi by 6 passes. The inset shows the effect of protein concentration and oil
content on particle size distribution as indicated by PDI. Different letters above or below the
curve indicate significant difference (p<0.05) due to protein concentration.

93
Figure 3-5 Effect of protein concentration and oil content on the mean particle size of samples
produced at 16 kpsi using 6 passes. The inset shows the effect of protein concentration and oil
content on particle size distribution as indicated by PDI. Different letters above or below the
curve indicate significant difference (p<0.05) due to protein concentration.
Notably, nanoparticles with small sizes (90-150 nm) and narrow size distributions (PDI<0.3) can
be achieved by up to 5 wt % protein concentration when the oil-to-protein ratio was maintained
within a range from 1 to 1.5. Zein211
, gliadin212
, soy proteins213
and milk proteins198
can only
form nanoparticles at protein concentrations of less than 2%. The more concentrated
nanoparticles achieved in this study were a significant improvement as mass production of
nanoparticles with narrow sizes in water is a challenge facing industry and academic researchers.
Samples prepared with 2% protein and 2.5-5.0% oil, 3% protein and 5% oil, as well as 5%
protein and 7.5% oil, prepared at 16 kpsi and 6 passes were selected for further study due to their
small size and narrow size distribution.
94
3.3.2 Nanoparticle characterization
The surface oil content, encapsulation efficiency (EE) and loading capacity (LC) of the
nanoparticle samples were demonstrated in Table 3-2. All samples demonstrated high EE
(89.2-93.5%) and LC value (51.4-54.4%) except for that prepared with 2% protein and 5% oil
which only showed an EE value of 83.3% and LC value of 56.1%. This is probably due to
insufficient amount of protein available to form a thick coating around the lipid droplets when
oil-to-protein ratio was high. The amount of surface oil is one important factor influencing the
shelf life of the encapsulated oil and lipophilic bioactive compounds as it is openly exposed to
the environment and has a high possibility of being oxidized or degraded. The oxidation and
degradation of surface oil not only forms undesired products, but also triggers the oxidation
reaction of bioactive compounds inside particles.214
It is noticed that samples prepared with
higher protein concentration exhibited significantly reduced surface oil. For example the
nanoparticles prepared with 5% protein and 7.5% oil had only 1.92% of total added oil attached
at the particle surface although the oil-to-protein ratio was relatively high. The surface charge is
another important characteristic of nanoparticles as it plays an important role in the physiological
properties and stability of nanoparticles.215
The surface charge of nanoparticles is determined by
the exposed side chains of the amino acid residues, the pH and the ionic strength of the
environment. Barley protein nanoparticles exhibited a strong negative charge of around -35 mV
in neutral aqueous solution as shown in Table 3-2. Negative charge is expected at neutral pH as
95
barley protein has an isoelectric point (pI) of around 5.18
Nevertheless, it is interesting to notice
that barley protein nanoparticles were much more negatively charged than many other protein
nanoparticles (such as zein, gliadin and soy protein nanoparticles) which exhibited relatively low
zeta-potential (-10 to -15 mV) at neutral pH.211, 213, 216
It could be deduced that during high
pressure homogenization, barley protein reoriented its conformation with the hydrophobic region
towards the oil phase and hydrophilic region towards the aqueous phase. Therefore, the
hydrophilic amino acid residues with negative charges, such as the carboxyl group from glutamic
acid were exposed outside, rendering nanoparticles highly negatively charged. It has been shown
that nanoparticles are more stable in suspension when their zeta-potential is above ± 30 mV due
to the fact that the electrostatic repulsion between particles prevents them from aggregation.217
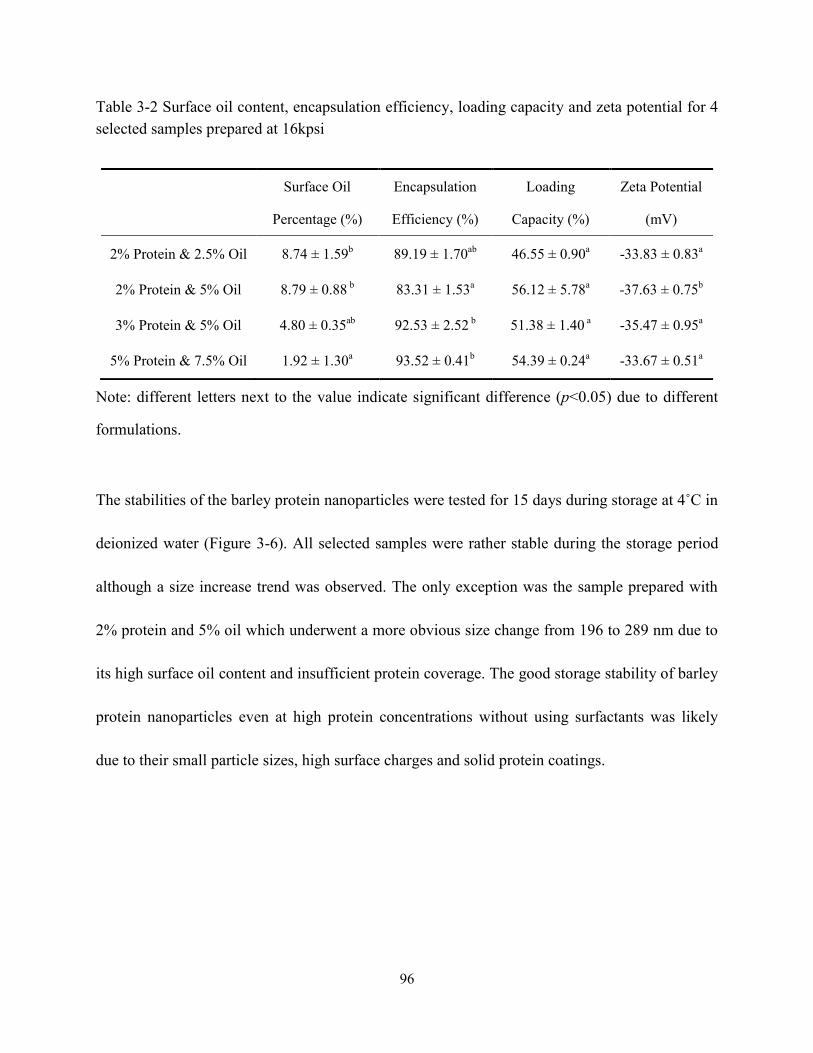
96
Table 3-2 Surface oil content, encapsulation efficiency, loading capacity and zeta potential for 4
selected samples prepared at 16kpsi
Surface Oil
Percentage (%)
Encapsulation
Efficiency (%)
Loading
Capacity (%)
Zeta Potential
(mV)
2% Protein & 2.5% Oil 8.74 ± 1.59b 89.19 ± 1.70
ab 46.55 ± 0.90
a -33.83 ± 0.83
a
2% Protein & 5% Oil 8.79 ± 0.88 b 83.31 ± 1.53
a 56.12 ± 5.78
a -37.63 ± 0.75
b
3% Protein & 5% Oil 4.80 ± 0.35ab
92.53 ± 2.52 b 51.38 ± 1.40
a -35.47 ± 0.95
a
5% Protein & 7.5% Oil 1.92 ± 1.30a 93.52 ± 0.41
b 54.39 ± 0.24
a -33.67 ± 0.51
a
Note: different letters next to the value indicate significant difference (p<0.05) due to different
formulations.
The stabilities of the barley protein nanoparticles were tested for 15 days during storage at 4˚C in
deionized water (Figure 3-6). All selected samples were rather stable during the storage period
although a size increase trend was observed. The only exception was the sample prepared with
2% protein and 5% oil which underwent a more obvious size change from 196 to 289 nm due to
its high surface oil content and insufficient protein coverage. The good storage stability of barley
protein nanoparticles even at high protein concentrations without using surfactants was likely
due to their small particle sizes, high surface charges and solid protein coatings.
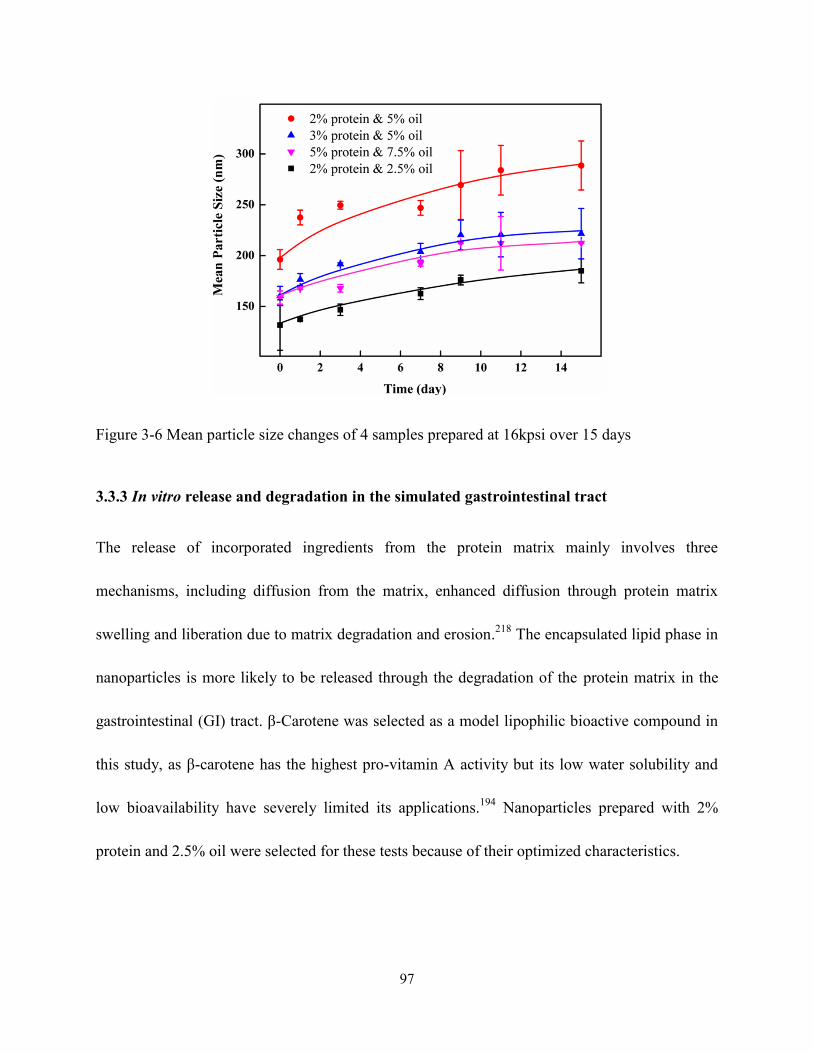
97
Figure 3-6 Mean particle size changes of 4 samples prepared at 16kpsi over 15 days
3.3.3 In vitro release and degradation in the simulated gastrointestinal tract
The release of incorporated ingredients from the protein matrix mainly involves three
mechanisms, including diffusion from the matrix, enhanced diffusion through protein matrix
swelling and liberation due to matrix degradation and erosion.218
The encapsulated lipid phase in
nanoparticles is more likely to be released through the degradation of the protein matrix in the
gastrointestinal (GI) tract. β-Carotene was selected as a model lipophilic bioactive compound in
this study, as β-carotene has the highest pro-vitamin A activity but its low water solubility and
low bioavailability have severely limited its applications.194
Nanoparticles prepared with 2%
protein and 2.5% oil were selected for these tests because of their optimized characteristics.
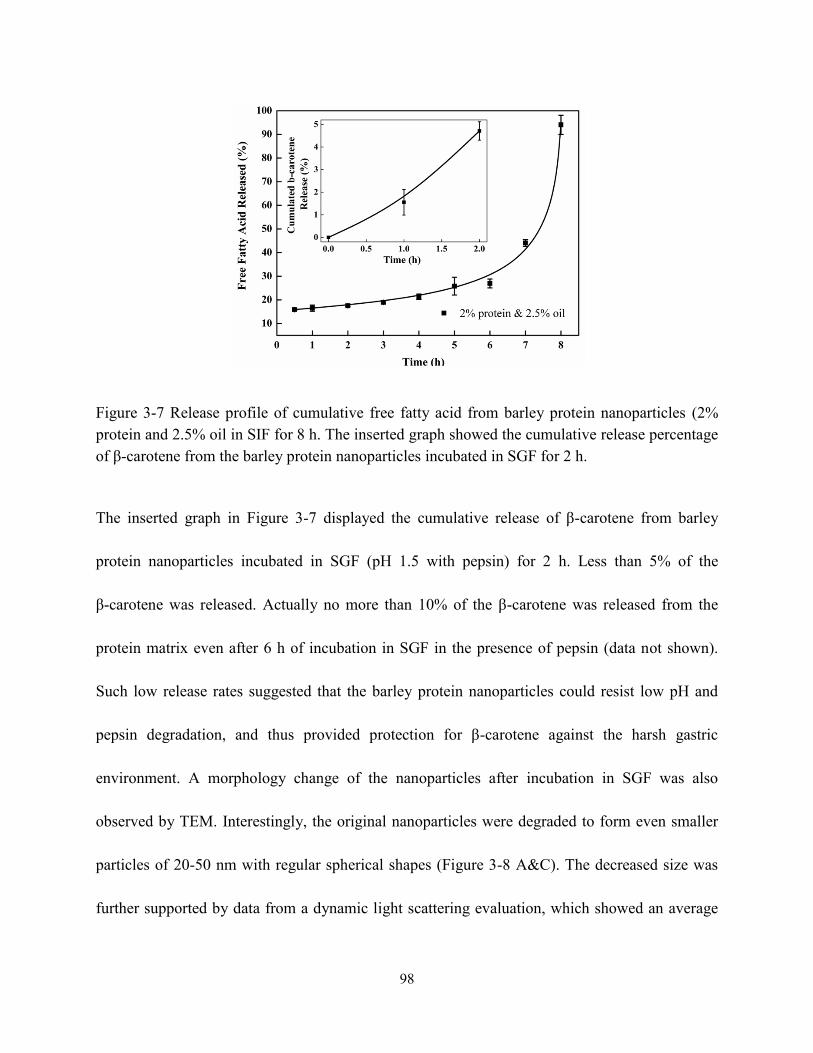
98
Figure 3-7 Release profile of cumulative free fatty acid from barley protein nanoparticles (2%
protein and 2.5% oil in SIF for 8 h. The inserted graph showed the cumulative release percentage
of β-carotene from the barley protein nanoparticles incubated in SGF for 2 h.
The inserted graph in Figure 3-7 displayed the cumulative release of β-carotene from barley
protein nanoparticles incubated in SGF (pH 1.5 with pepsin) for 2 h. Less than 5% of the
β-carotene was released. Actually no more than 10% of the β-carotene was released from the
protein matrix even after 6 h of incubation in SGF in the presence of pepsin (data not shown).
Such low release rates suggested that the barley protein nanoparticles could resist low pH and
pepsin degradation, and thus provided protection for β-carotene against the harsh gastric
environment. A morphology change of the nanoparticles after incubation in SGF was also
observed by TEM. Interestingly, the original nanoparticles were degraded to form even smaller
particles of 20-50 nm with regular spherical shapes (Figure 3-8 A&C). The decreased size was
further supported by data from a dynamic light scattering evaluation, which showed an average

99
particle size of 43±7 nm after 1 h of incubation in SGF. This result indicates that the barley
protein nanoparticle matrix was partially digested by pepsin to liberate the encapsulated oil
droplets covered by a thinner but solid coating of barley protein which was indigestible by
pepsin. This explained the low β-carotene release percentage in SGF. The majority of the
hydrophobic amino acids on the protein chains were likely oriented towards the lipid phase,
leaving the hydrophilic groups on the outside. As pepsin is most efficient in attacking peptide
bonds involving hydrophobic amino acids,219
the layer of barley protein coated on the lipid
surface represented a substrate that was less vulnerable to pepsin digestion. On the other hand,
barley protein has a high percentage of proline (16%)18
which made degradation of the coating
layer even slower as proteins with high proline content are generally more resistant to
degradation by digestive enzymes in the GI tract.220
β-Carotene was susceptible to the acid
environment because β-carotene can be dissociated to form carotenoid carbonations.221
Meanwhile, other common ingredients in the food matrix, such as iron, could also induce
oxidation of the released β-carotene molecules, which adversely affects the bioactivity of
β-carotene.222
This issue was also reported for other lipophilic bioactive compounds, such as
α-tocopherol.223
Thus, maintaining the bioactive form of β-carotene until absorption is important.
The resistance of barley protein nanoparticles to the stomach environment is a favourable
property to improve the bioavailability of β-carotene.
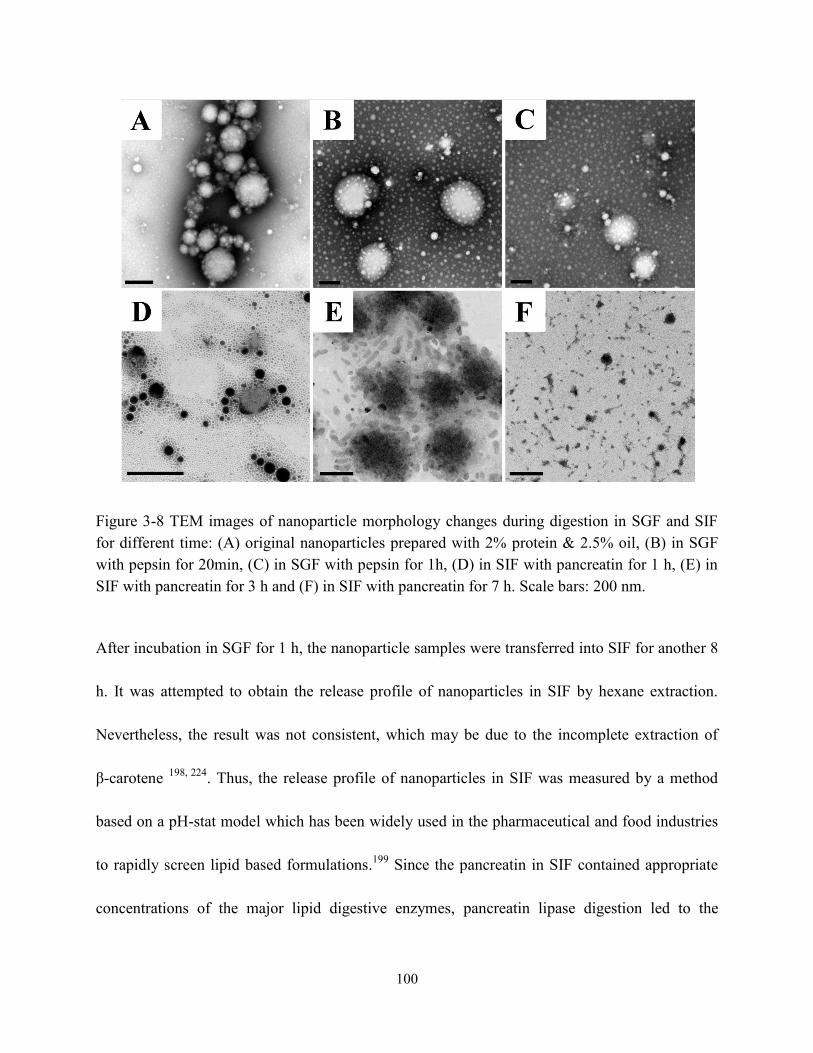
100
Figure 3-8 TEM images of nanoparticle morphology changes during digestion in SGF and SIF
for different time: (A) original nanoparticles prepared with 2% protein & 2.5% oil, (B) in SGF
with pepsin for 20min, (C) in SGF with pepsin for 1h, (D) in SIF with pancreatin for 1 h, (E) in
SIF with pancreatin for 3 h and (F) in SIF with pancreatin for 7 h. Scale bars: 200 nm.
After incubation in SGF for 1 h, the nanoparticle samples were transferred into SIF for another 8
h. It was attempted to obtain the release profile of nanoparticles in SIF by hexane extraction.
Nevertheless, the result was not consistent, which may be due to the incomplete extraction of
β-carotene 198, 224
. Thus, the release profile of nanoparticles in SIF was measured by a method
based on a pH-stat model which has been widely used in the pharmaceutical and food industries
to rapidly screen lipid based formulations.199
Since the pancreatin in SIF contained appropriate
concentrations of the major lipid digestive enzymes, pancreatin lipase digestion led to the

101
generation of free fatty acids and 2-monoglyceride from triglyceride molecules. Therefore, it was
reasonable to quantitatively measure the release of the lipids by analyzing liberated free fatty
acids in SIF media. Meanwhile, this result also indirectly demonstrated the degradation
behaviour of the protein coating, since the ability of lipase to come in close proximity to lipid
molecules governs the rate of lipid digestion. Although measuring the liberated free fatty acids
cannot directly show the release profile of the encapsulated lipophilic bioactive compounds, this
in vitro digestion result in combination with TEM (showing the morphology changes) and a
Caco-2 cell model (showing the nanoparticle uptake) can provide valuable information with
respect to the nanoparticle degradation and release behaviour in the simulated GI tract. As
indicated in Figure 3-7, over the first 7 h of incubation, the cumulative release increased from ~5
to 40% and then >90% of free fatty acids were detected in the release media at 8 h, indicating
that ~50% of the free fatty acids was liberated in the last hour of incubation. The degradation
behaviour of the above liberated smaller nanoparticles was also observed with TEM in SIF
(Figure 3-8 D-F). After 1 h of incubation in SIF, the liberated nanoparticles (mainly 20-50 nm)
were further digested into nano-sized lipid droplets, indicating that the barley protein solid
coating was further degraded in SIF. Meanwhile, there was no evidence of oil droplets
aggregating or coalescing at this stage, which was expected since they were covered by a thin
layer of protein or protein hydrolysates. The mean particle size of samples incubated in SIF for
another hour was 47±1 nm. Then, nano-scaled structures were observed when sample was
incubated in SIF for 3 h (Figure 3-8 E). These colloidal structures could be vesicles, mixed
102
micelles and micelles which were able to internalize the undigested lipid molecules and
β-carotene inside.199, 225
It was reported that β-carotene is likely to be absorbed through the small
intestine in the form of mixed micelles and/or vessels.194
Therefore, barley protein nanoparticles
have the potential to improve the adsorption of β-carotene in small intestine. After incubation in
SIF for 7 h, the nanoparticles were further degraded into small irregular fragments. Nanoparticles
with 3% protein & 5% oil and 5% protein & 7.5% oil had similar release profile as the one
shown above (data not shown).
3.3.4 Cytotoxicity and cell uptake
Both the cytotoxicity and the cell uptake of barley protein based nanoparticles were evaluated on
a Caco-2 intestinal cell line which was derived from a human adenocarcinoma cell line. When
grown on plastic dishes or filters, the confluent monolayer formed by Caco-2 cells exhibits tight
junction complexes and possesses similar morphological, functional and electrical properties to
human small intestinal cells. Thus, Caco-2 cells have been widely used as an in vitro model to
investigate the uptake and transportation of materials through the small intestinal epithelium.226
Nanoparticles prepared with 2% protein and 2.5% oil were used in these tests.
The viability of Caco-2 cells was measured by MTT assay after incubation with nanoparticles
and the digested nanoparticle samples. As shown in Figure 3-9, the cell viability was 88.4, 95.3
and 92.9% for samples incubated with 0.5, 0.25 and 0.125 mg/mL nanoparticles, respectively.
High cell viability (about 90%) was also observed for nanoparticle samples digested by SGF for
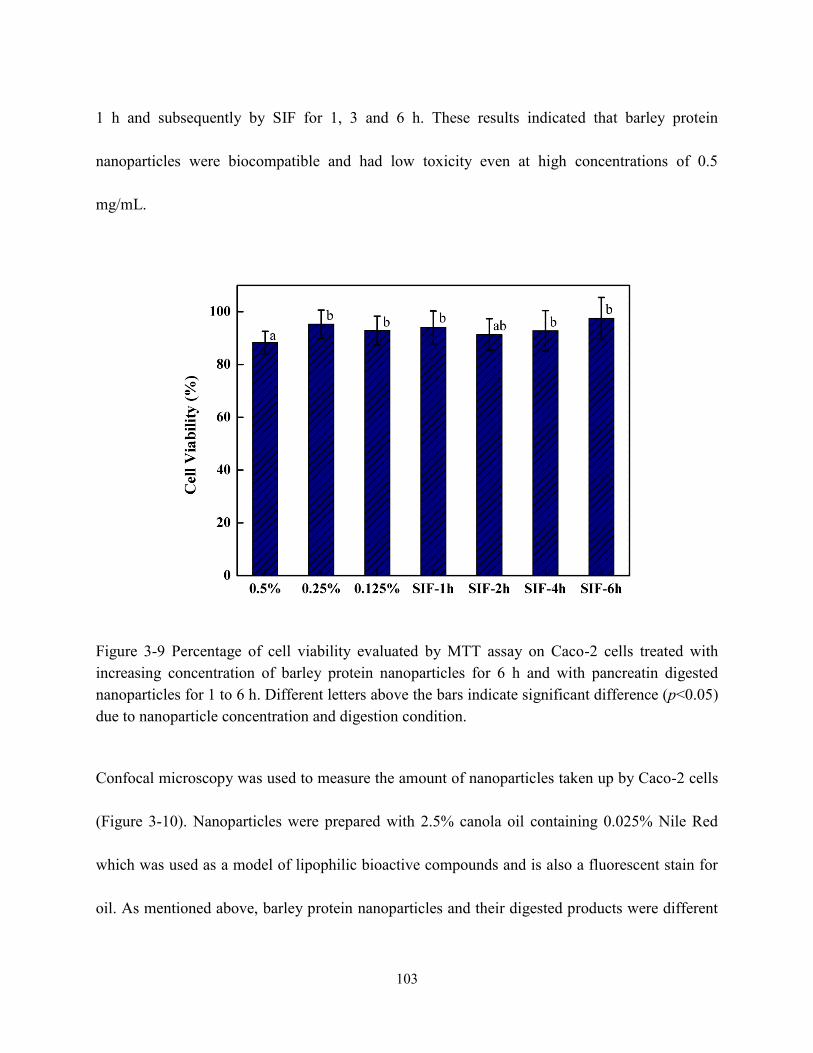
103
1 h and subsequently by SIF for 1, 3 and 6 h. These results indicated that barley protein
nanoparticles were biocompatible and had low toxicity even at high concentrations of 0.5
mg/mL.
Figure 3-9 Percentage of cell viability evaluated by MTT assay on Caco-2 cells treated with
increasing concentration of barley protein nanoparticles for 6 h and with pancreatin digested
nanoparticles for 1 to 6 h. Different letters above the bars indicate significant difference (p<0.05)
due to nanoparticle concentration and digestion condition.
Confocal microscopy was used to measure the amount of nanoparticles taken up by Caco-2 cells
(Figure 3-10). Nanoparticles were prepared with 2.5% canola oil containing 0.025% Nile Red
which was used as a model of lipophilic bioactive compounds and is also a fluorescent stain for
oil. As mentioned above, barley protein nanoparticles and their digested products were different
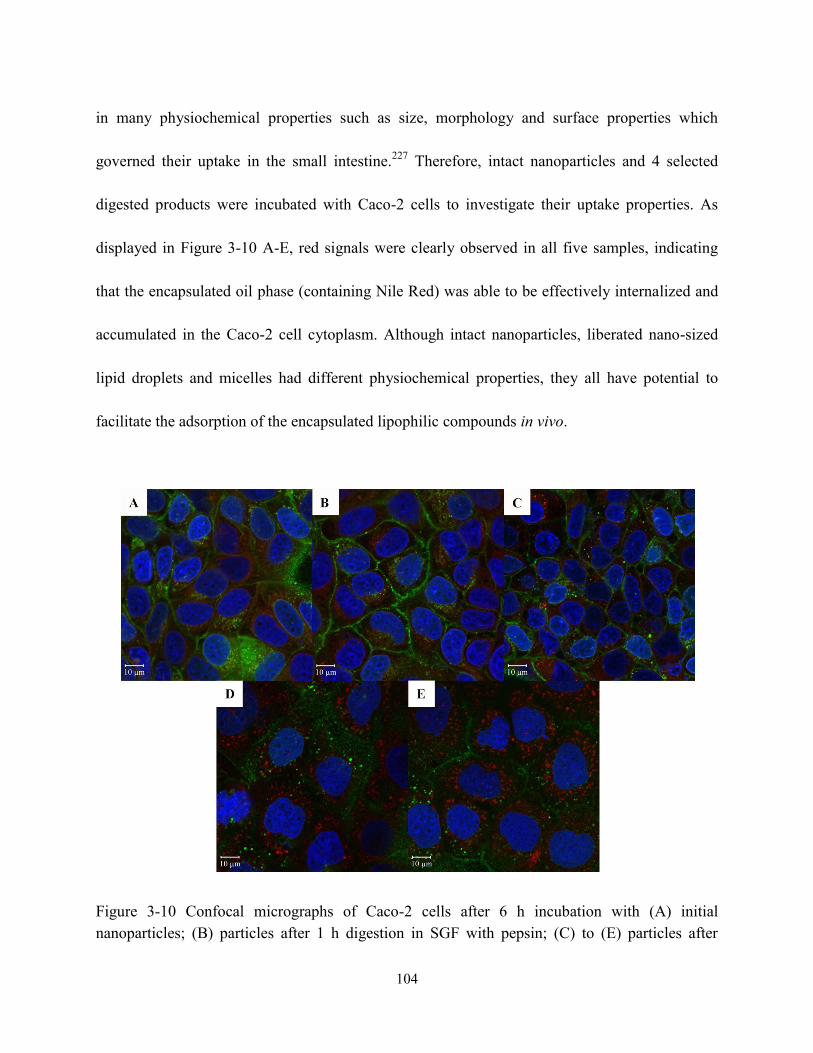
104
in many physiochemical properties such as size, morphology and surface properties which
governed their uptake in the small intestine.227
Therefore, intact nanoparticles and 4 selected
digested products were incubated with Caco-2 cells to investigate their uptake properties. As
displayed in Figure 3-10 A-E, red signals were clearly observed in all five samples, indicating
that the encapsulated oil phase (containing Nile Red) was able to be effectively internalized and
accumulated in the Caco-2 cell cytoplasm. Although intact nanoparticles, liberated nano-sized
lipid droplets and micelles had different physiochemical properties, they all have potential to
facilitate the adsorption of the encapsulated lipophilic compounds in vivo.
Figure 3-10 Confocal micrographs of Caco-2 cells after 6 h incubation with (A) initial
nanoparticles; (B) particles after 1 h digestion in SGF with pepsin; (C) to (E) particles after

105
another 1, 3 and 6 h digestion in SIF with pancreatin respectively. Blue and signals represents
cell nucleus and membrane, respectively.
3.4 Conclusions
Nanoparticles with small sizes (90-150 nm) and narrow size distributions were prepared from
barley protein without the use of any organic solvents or cross-linking reagents. These
nanoparticles demonstrated good storage stability in the absence of surfactants and contained a
high payload (51.4-54.4%) of lipophilic nutraceutical compounds with limited surface oil.
Interestingly, release experiments showed that even smaller particles (20-50 nm) were formed as
a result of pepsin degradation of barley protein nanoparticle matrices. These smaller
nanoparticles provided sufficient protection of the model nutrient in the SGF. Moreover,
sequential lipophilic micro-domains were formed within the simulated intestinal environment,
which helped stabilize water insoluble nutraceuticals in solution and may benefit their adsorption.
Complete release of the model nutrients occurred after 7 h of degradation by pancreatin. Both
original barley nanoparticles and the liberated smaller ones after pepsin digestion exhibited low
cytotoxicity through in vitro study using Caco-2 cell models and they could be accumulated in
the cytoplasm after being uptaken into Caco-2 cells. Meanwhile, nanoparticles have a unique
colloidal nature whereby their charge as well as their Brownian motion can cause the dispersion
to be stable, thus they can be administered by both parenteral and non-parenteral routes, enabling
wider applications. Thus, these barley protein nanoparticles have strong potential to be used as
delivery systems of bioactive compounds for food, pharmaceutical and cosmetic applications.

106
Moreover, this study provides meaningful justification for further in vivo studies to evaluate the
safety and efficacy of barley protein nanoparticles as a delivery system.
107
Chapter 4
Creation of 3D Hierarchical Porous Nitrogen-Doped Carbon Fibers for
Supercapacitors from Plant Protein and Lignin Electrospun Fibers
4.1 Introduction
Supercapacitors have attracted extensive attention in recent years due to their high power
densities, rapid charging time and long cyclic stability.122
They show promise to meet the
increasing power demand for energy storage systems in various applications, such as portable
electronics, mobile electric systems, hybrid electric vehicles and industrial power
management.100
Supercapacitors can be classified into two categories by different energy storage
mechanisms: electrical double-layer capacitors (EDLCs) and pseudocapacitors.113
EDLCs are
based on the adsorption of electrolyte ions on the surface area of conductive materials, while
pseudocapacitors store energy faradaically by electrosorption, reduction-oxidation reaction and
intercalation processes.102
EDLCs are favourable in commercial utilization currently due to their
superior cycle stability. Though the power density of supercapacitor is much higher than that of
battery, the capacitance and energy density of supercapacitor are needed to be improved.
Carbon materials are widely used to produce EDLCs because of their good electrical
conductivity and relatively low cost. The capacitance of EDLC is related to the specific area of
the electrodes. Therefore, to make high performance EDLCs from carbon materials they must
have a large specific surface area and a highly porous structure, fitting the size of electrolyte ion.

108
Extensive investigations are being conducted to develop nano-structured porous carbon materials,
such as active carbon, carbon particles, carbon areogel, graphene, carbon nanotube, carbon fibers,
carbide-derived carbons and template carbon. More recently, carbon materials with an
hierarchical porous structure, namely, macropores in combination with meso and micro pores,117
have been shown to have advantages as they not only provide large surface area to store energy,
but also possess a shortened ion transport time.228
Activated carbon fibers have attracted interest
due to their ability to build up hierarchical porous structures with a large length/diameter ratio,
large surface area and large pore volume.141
Activated carbon fibers show excellent electrical
conductivity along the fiber axis, but their contact resistance remains to be a problem due to the
large distance between fibers.100
Interconnected fiber networks that provide shorter and more
continuous electron transport pathways can favourably reduce the contact resistance of an
activated carbon fiber electrode.129
Currently, template casting, solvo-thermal synthesis and
chemical vapour deposition methods are applied to prepare carbon fiber precursors. However,
these methods have limitations such as material restrictions, high cost and process complexity.96
Electrospinning is a relatively new, simple and convenient method to directly fabricate fiber
networks where the electrospun fiber composition, diameter and alignment can be modulated to
achieve carbon materials of desirable structure and performance.229
Incorporating heteroatoms such as nitrogen and oxygen into the carbon framework is an effective
strategy to improve the EDLCs performance. For example, nitrogen doping has been shown to
induce pseudocapacitance to carbon materials by additional faradaic redox reaction and/or
109
chemisorption.126, 230, 231
Nitrogen functional groups are normally added into the carbon
nanostructures by in situ doping during carbon synthesis using nitrogen-rich synthetic polymers
such as polyaniline and polypyrrole, or nitrogen-containing ionic liquid. This can also be
achieved through post-treatment of carbon materials with nitrogen containing reagents such as
ammoniate.119, 232
Carbonizing nitrogen-rich biomass has provided an environmentally sensitive
and efficient alternative to prepare nitrogen-doped carbon materials since nitrogen-rich biomass
can be converted to N-doped carbon through one-step pyrolysis. Proteins, rich in N and O, are
one of the most abundant biomaterials on earth. Previous reports showed that the carbon samples
derived from biomass rich in proteins, such as hair122
, silk cocoon141
, gelatine142
and chicken
eggshell membranes138
, possess high capacitance of more than 200 F/g. However, to the best of
our knowledge, protein-based carbon fibers with a hierarchical porous structure have not been
reported as supercapacitor material.
Zein and hordein are the major alcohol soluble storage proteins (prolamins) in corn and barley,
respectively. Zein is the by-product of corn starch processing and the major coproduct of corn
fermentation to produce ethanol.233
Hordein is largely available as the by-product of barley
starch and β-glucan extraction industries.2 Development of a value-added product of zein and
hordein would commercially benefit cereal growers and processors as well as reduce the wastes.
Nano-fiber fabrics based on the mixture of zein and hordein have been developed already by
some previous work with electrospinning.28, 30, 93
Such fabrics contain a large amount of nitrogen
in the polypeptide chains and show good tensile strength, controllable diameter and continuous
110
fiber network.28, 30, 93
In this study, it was proposed that these were important attributes to create
interconnected 3D hierarchical porous nitrogen-doped carbon fibers with superior capacitive
performance.
This study aims to explore this new area of research to create energy storage materials with
electrospun zein/hordein protein nanofiber fabrics. The challenge is to maintain a fibrous protein
mat structure due to the thermoplastic nature of proteins. To overcome this challenge, lignin is
added to the plant protein spin dope since this common and abundant natural material has a large
content of aromatic components to maintain the fibrous structure. Under proper heating
conditions, lignin can be converted to a thermosetting material,234, 235
that would aid with the
development of a hierarchical porous structure.129
The objective of this study is to develop plant proteins-lignin based electrospun nanofibers fabric
and to convert them into N-doped carbon fibers with 3D interconnected hierarchical porous
structure as electrode materials for supercapacitor. In this study, the effects of protein/lignin ratio
and the carbonization temperature on carbon fiber morphology and electrochemical performance
were systematically evaluated and discussed. The surface N functionalities were studied by
X-ray photoelectron spectroscopy (XPS), and the morphology and the porous structure were
observed by scanning electron microscopy (SEM).
111
4.2 Materials and methods
4.2.1 Materials
Barley grains (Falcon) were kindly provided by Dr. James Helm, Alberta Agriculture and Rural
Development, Lacombe, AB, Canada. Hordeins were extracted from barley grains using an
ethanol solution according to a procedure reported in previous work.18
Zein (F4000, 92% protein
content) was kindly provided by Freeman Industries LLC (New York, NY, USA) and used
without further purification. Alkali lignin, polyvinylidene fluoride (PVDF), molecular weight
~275,000 by gel permeation chromatography), N-methyl-2-pyrrolidone (NMP), potassium
hydroxide and acetic acid were purchased from Sigma-Aldrich Canada Ltd (Oakville, ON,
Canada). Dimethylformamide (DMF) and Carbon black Super P was obtained from Fisher
Scientific (ON, Canada) and Alfa Aesar (Ward Hill, MA, US), respectively. All chemicals were
used as received unless otherwise specified. Ultrapure water treated with a Milli-Q Advantage
A10 system (EMD Millipore Corporation, MA, US) was used to prepare electrolyte solution.
4.2.2 Preparation of plant protein-lignin electrospun fibers
Lignin and plant protein (hordein:zein = 50:50, w/w) powders were dissolved in a mixed solution
of acetic acid and DMF (90 and 10%, v/v) and stirred for 12 h. The total content of polymers was
36% (w/v). The lignin and protein blending ratios were 20/80, 50/50 and 80/20 (w/w).
Correspondingly, their electrospun fiber samples were coded as L2P8, L5P5 and L8P2,
respectively. The electrospinning experiments were carried out on a customized digital

112
electrospinning apparatus EC-DIG (IME Technologies, Eindhoven, Netherlands) at 25°C.
Solutions were forced through a blunt needle with a diameter of 0.8 mm at the flow rate of 1
mL/h. The spinning voltage was fixed at 20 kV and the needle to collector distance was 20 cm.
The electrospun fiber fabrics were collected on a rotary collector with a rotating speed of 1 rpm.
4.2.3 Carbonization and activation
The carbon fibers were synthesized by carbonizing the protein and lignin electrospun fiber
fabrics in a tubular furnace (GSL-1100X-NT-UL, MTI Corporation, CA, US), followed by a
carbon dioxide activation step. In a typical experiment, the carbonization step was operated with
the following heating procedure under continuous purge of argon: (1) temperature raised from
25˚C to 200˚C at a rate of 5˚C/min; (2) temperature held at 200˚C for 2 h to stabilize the
protein-lignin electrospun fibers; (3) temperature increased from 200˚C to 300˚C at a rate of
1˚C/min to slow down the thermo decomposition of protein to maintain the fibrous structure; (4)
temperature continued to increase from 300˚C to a final carbonization temperature (750 or 900˚C)
at 5˚C/min; (5) carbonization temperature held for 2 h; (6) sample cooled down naturally under
argon flow. A number following the sample code was added for each carbon fiber sample to
indicate its carbonization temperature. For example, L2P8-750 represents carbon sample
prepared with 20% lignin and 80% protein, and carbonized at 750˚C. Then, the selected carbon
fibers were activated at 800˚C in a CO2 atmosphere for 3 h to generate porous structure on the

113
carbon fiber surface. The temperature increased from 25˚C to 200˚C at a rate of 5˚C/min and the
activated carbon fibers cooled down naturally under CO2 flow.
4.2.4 Fiber size and morphology observation
The size and morphology of both the original and carbonized fibers were observed by a Hitachi
X-650 scanning electron microscope (SEM, Hitachi, Japan) at 20 kV. The original fiber samples
were sputtered with gold for 2 min before observation. The surface pores of the activated carbon
fiber were observed by SEM equipped with a cold field emission gun at 15 kV (S-4800 FE-SEM,
Hitachi, Japan). High resolution transmission electron microscope (HRTEM, JEOL 2100, JEOL
Inc., US) was further employed to study the microstructure of carbon fiber samples. For this,
samples were ground into powders and then deposited onto the 300 mesh Cu/Pd grids.
4.2.5 Fiber textural characterization and chemical analysis
AutosorbiQ (Quantachrome Instruments, Boynton Beach, FL, US) was employed to measure the
nitrogen adsorption-desorption isotherm, specific surface area and the porous texture at 77 K.
The specific surface area and pore size distribution were calculated based on the
Brunauer-Emmett-Teller (BET) theory and nonlocal density functional theory, respectively. The
micropore and external pore surface area was calculated by t-plot method. These analyses were
done by the AutosorbiQ‘s associated software (ASiQWin). X-ray powder diffraction (XRD)
patterns were obtained to show the crystallinity of carbon by using a Bruker AXS D8 Discover
diffractometer (Bruker Coperation, East Milton, ON, CANADA) with the Cu Kα radiation ( =
114
1.541841 Å) at 40 kV and 44 mA (2 was from 10 to 80°). Raman spectra were obtained to
examine carbon sample structure by a Nicolet Omega XR Raman microscope (Thermo Fisher
Scientific, Waltham, MA, US). The excitation near infrared laser wavelength was set at 532 nm
and data points were recorded at 0.5 cm-1
intervals. The nitrogen and carbon contents of the
original fibers were measured by Leco nitrogen analyzer (FP-628, Leco, St. Joseph, MI, US).
X-ray photoelectron spectroscopy (XPS) was applied to analyze the chemical composition of
carbon surface using an Axis Ultra spectrometer (Kratos Analytical, Manchester, UK).
X-radiation Al Kα (hυ = 1486.6 eV) was used. The C 1s and N 1s core levels were fitted using
the CasaXPS software to reveal C and N configuration. The thermogravimetric analysis (TGA)
of the original protein fibers was conducted by a thermogravimetric analyzer (TA Instruments,
Q500, New Castle, DE, US) under argon at a heating rate of 2oC/min. The Fourier transform
infrared spectra (FTIR) of the original protein fibers and those after heating treatment to 200oC
for 2 h (under Argon) were obtained by a Nicolet 6700 spectrophotometer (Thermo Fisher
Scientific, Waltham, MA, US) to analyze protein conformations. An attenuated total reflectance
(ATR) accessory with a Ge crystal was used for measurement. Spectra were collected in the
range of 4000-800 cm-1
as an average of 256 scans at 4 cm-1
resolution.
4.2.6 Electrochemical performances
The activated carbon samples were ground and mixed with 10 wt % carbon black and 10%
PVDF binder (10 wt% in NMP) to form a paste. The paste with 8mg of carbon sample was cast

115
onto a piece of nickel foam in an area of 1.0 cm2 and dried under vacuum at 120
oC for 12 h, and
then pressed under 2000 psi by a benchtop laboratory press (model 3851, Carver Inc., Wabash,
IN, US) to fabricate an electrode. To assemble a three-electrode cell, the above prepared nickel
foam, a Pt wire and an Hg/HgO were used as working, counter and reference electrodes,
respectively. All the electrochemical properties were analyzed by a Solartron 1287
electrochemical interface (Solartron Analytical, Berwyn, PA, US). Cyclic voltammetry studies
were performed in the potential window of -1.0 to 0 V vs. reference electrode at various scan rate
from 5 to 100 mV/s. Galvanostatic charge-discharge curves were measured with current density
from 0.5 to 10 A/g. The specific capacitance of carbon materials was calculated by the following
equation:
𝐶 = 𝐼∆𝑡
𝑚∆𝑉
Where I (A) is the discharge current, ∆t stands for the discharging time, m (g) is the weight of
carbon sample loaded on the working electrode and ∆V represents the potential window.
Electrochemical impedance spectroscopy (EIS) was performed in a frequency range from 10-2
to
105 Hz with 5 mV amplitude.
4.2.7 Statistical analysis
All experiments were performed at least in three independent batches. For SEM and TEM results,
one typical image was presented respectively. For nitrogen adsorption-desorption isotherm, TGA,
116
FTIR, Raman spectroscopy, XRD, XPS and electrochemical analysis, one typical curve was
presented respectively.
4.3 Results and discussion
4.3.1 Morphology of carbon fibers
It was challenging to maintain the interconnected protein fiber networks during the carbonization
process up to 750°C. Proteins are thermoplastic materials and often melt and lose their original
structure at carbonization temperatures. The amorphous regions of protein molecule become
mobile above the glass transition temperatures. Crystalline regions then melt above the melting
temperature before decomposition at even higher temperatures.236
To overcome this problem,
lignin was added to sustain the fiber structure because it can transform from a thermoplastic to a
thermosetting character during a continuous heating process.235
Continuous fibers with smooth
surfaces and uniform diameters were successfully prepared from a protein-lignin mixture
formula as shown in Figure A1-1 in Appendix A1. The alkali lignin solution alone showed poor
electrospinning properties since alkali lignin molecules had insufficient chain structure,
intermolecular interactions and/or entanglements.131
Thus, the formation of continuous
electrospun fibers was attributed to the good electrospinnability of prolamin proteins.28
Previous
experiments showed that hordein/zein mixture at the ratio of 1:1 exhibited stable assembled
network structure and improved the tensile strength.28
Carbon fiber samples with different
protein-lignin ratios showed significantly different morphologies after heat treatments at 750 and
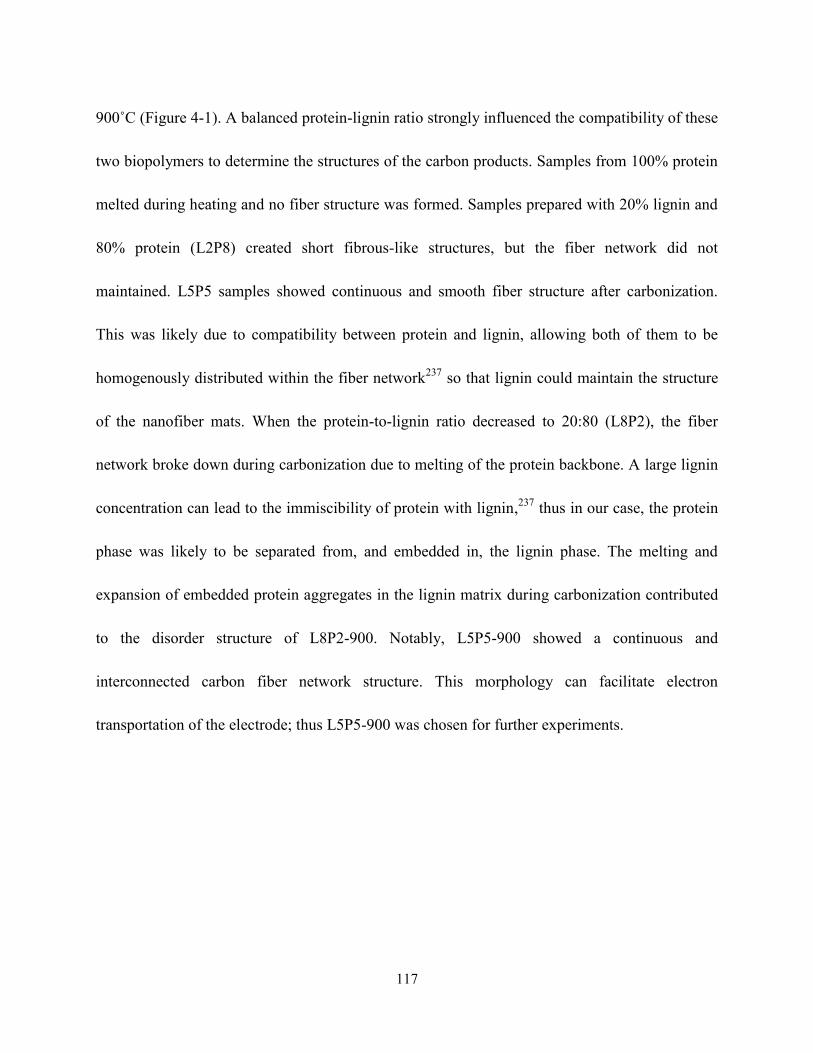
117
900˚C (Figure 4-1). A balanced protein-lignin ratio strongly influenced the compatibility of these
two biopolymers to determine the structures of the carbon products. Samples from 100% protein
melted during heating and no fiber structure was formed. Samples prepared with 20% lignin and
80% protein (L2P8) created short fibrous-like structures, but the fiber network did not
maintained. L5P5 samples showed continuous and smooth fiber structure after carbonization.
This was likely due to compatibility between protein and lignin, allowing both of them to be
homogenously distributed within the fiber network237
so that lignin could maintain the structure
of the nanofiber mats. When the protein-to-lignin ratio decreased to 20:80 (L8P2), the fiber
network broke down during carbonization due to melting of the protein backbone. A large lignin
concentration can lead to the immiscibility of protein with lignin,237
thus in our case, the protein
phase was likely to be separated from, and embedded in, the lignin phase. The melting and
expansion of embedded protein aggregates in the lignin matrix during carbonization contributed
to the disorder structure of L8P2-900. Notably, L5P5-900 showed a continuous and
interconnected carbon fiber network structure. This morphology can facilitate electron
transportation of the electrode; thus L5P5-900 was chosen for further experiments.
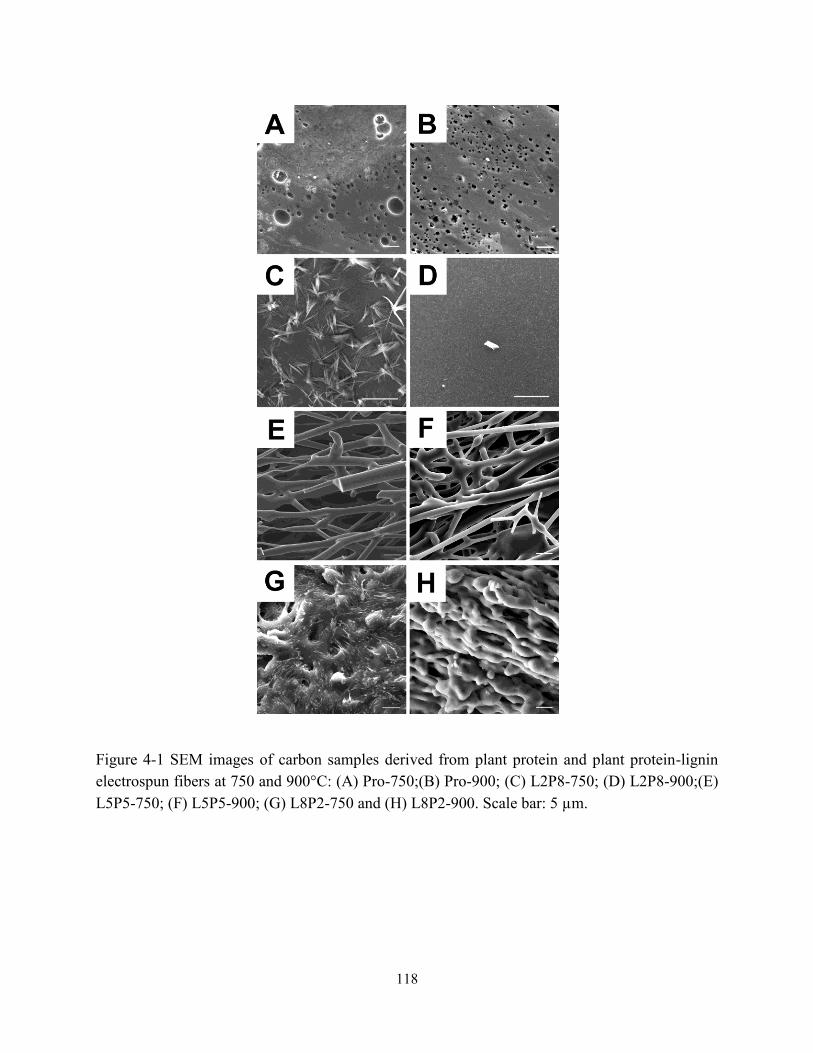
118
Figure 4-1 SEM images of carbon samples derived from plant protein and plant protein-lignin
electrospun fibers at 750 and 900°C: (A) Pro-750;(B) Pro-900; (C) L2P8-750; (D) L2P8-900;(E)
L5P5-750; (F) L5P5-900; (G) L8P2-750 and (H) L8P2-900. Scale bar: 5 µm.
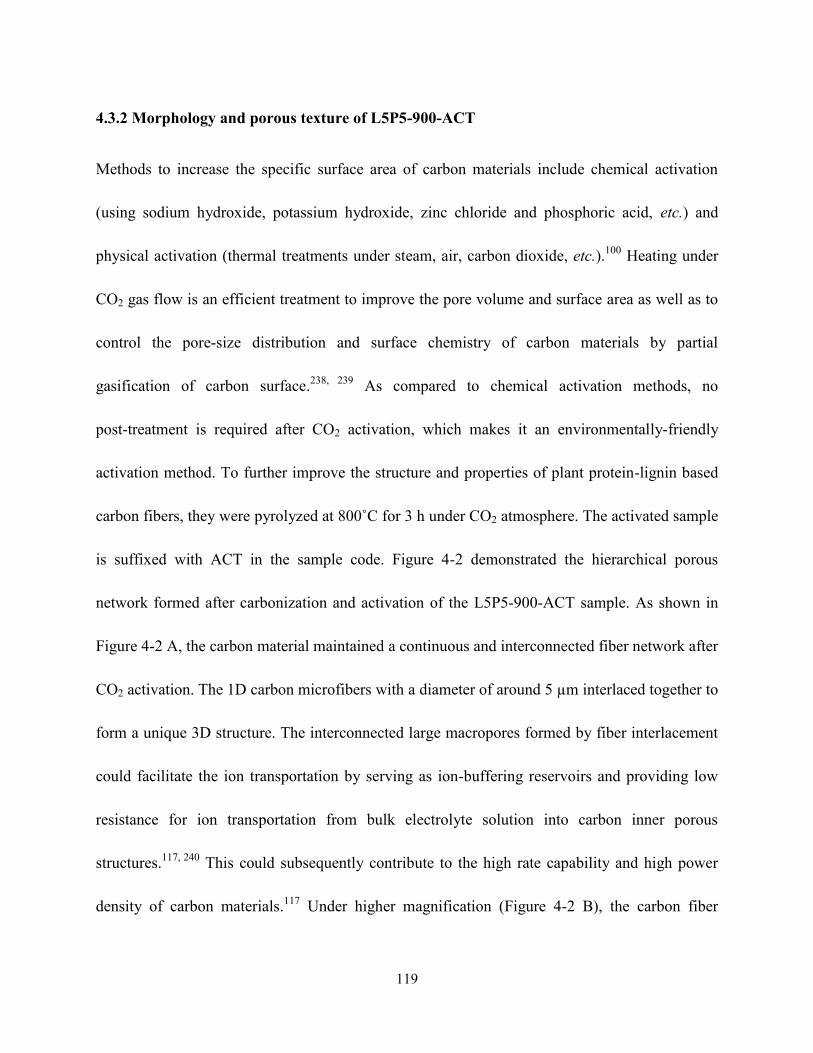
119
4.3.2 Morphology and porous texture of L5P5-900-ACT
Methods to increase the specific surface area of carbon materials include chemical activation
(using sodium hydroxide, potassium hydroxide, zinc chloride and phosphoric acid, etc.) and
physical activation (thermal treatments under steam, air, carbon dioxide, etc.).100
Heating under
CO2 gas flow is an efficient treatment to improve the pore volume and surface area as well as to
control the pore-size distribution and surface chemistry of carbon materials by partial
gasification of carbon surface.238, 239
As compared to chemical activation methods, no
post-treatment is required after CO2 activation, which makes it an environmentally-friendly
activation method. To further improve the structure and properties of plant protein-lignin based
carbon fibers, they were pyrolyzed at 800˚C for 3 h under CO2 atmosphere. The activated sample
is suffixed with ACT in the sample code. Figure 4-2 demonstrated the hierarchical porous
network formed after carbonization and activation of the L5P5-900-ACT sample. As shown in
Figure 4-2 A, the carbon material maintained a continuous and interconnected fiber network after
CO2 activation. The 1D carbon microfibers with a diameter of around 5 µm interlaced together to
form a unique 3D structure. The interconnected large macropores formed by fiber interlacement
could facilitate the ion transportation by serving as ion-buffering reservoirs and providing low
resistance for ion transportation from bulk electrolyte solution into carbon inner porous
structures.117, 240
This could subsequently contribute to the high rate capability and high power
density of carbon materials.117
Under higher magnification (Figure 4-2 B), the carbon fiber

120
surface was porous and composed of a large number of mesopores (around 10 nm), likely formed
during the CO2 activation step.241
These numerous open pores not only can greatly increase the
surface area, but also can improve the electrolyte ion accessibility by providing larger transport
pores for diffusion from surface to inner porous structures.100
It was interesting that the carbon
fiber was comprised of multiple layers of graphene-like nanosheets, as demonstrated in the high
resolution TEM (HR-TEM) images (Figures 4-2 C & D). Figure 4-2 D showed the graphene-like
nanosheets stacked and folded together with the layer-to-layer distance (d-spacing) between
sheets being 0.37 nm, similar to the spacing of the (002) distance of the graphitic carbon lattice
(0.34 nm).242
Due to the intrinsic properties of graphene, these nanosheets could improve the
electrode performance by speeding up the transport of electrons and by increasing the in-plane
conductivity.243
Traditionally, the production of graphene materials has been challenging,
including the high production cost and the demand for high energy input and the corrosive
reagents, which limited its application as a commercial material for supercapacitors.137, 244
This
study provided a convenient and environmentally sustainable method to prepare carbon materials.
It was demonstrated that porous graphene-like nanosheet structures can be created at a lower
temperature (<1000°C) without the use of a catalyst.
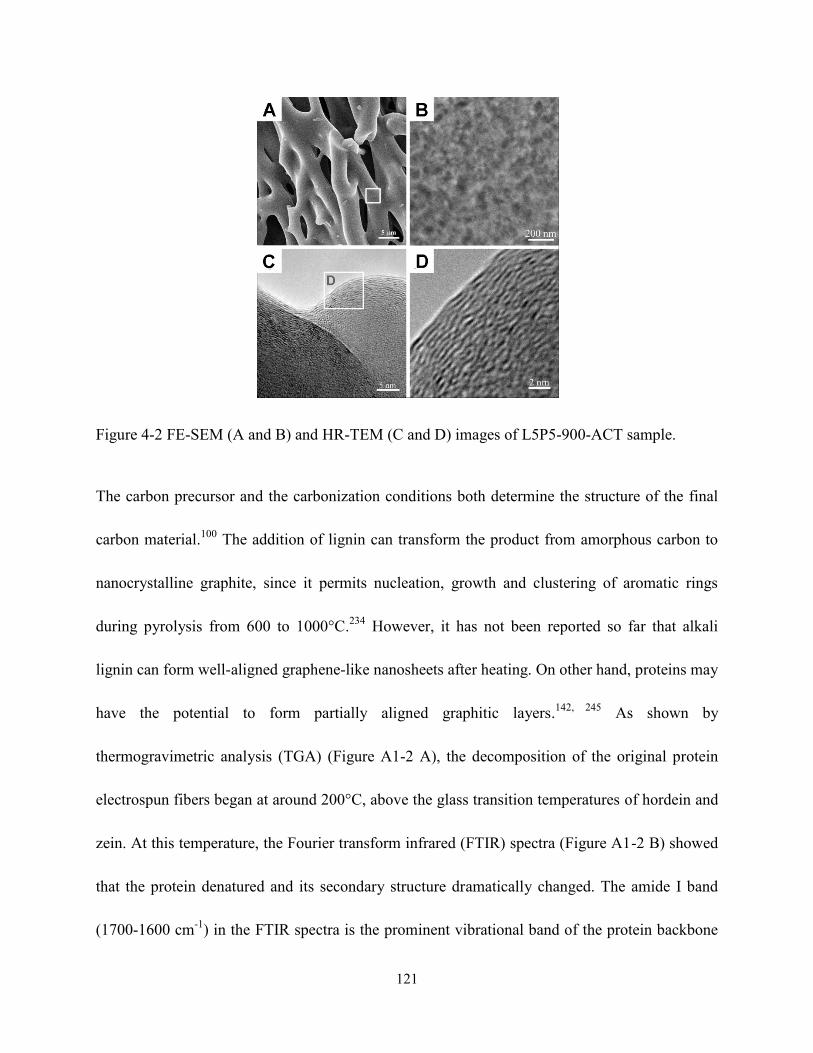
121
Figure 4-2 FE-SEM (A and B) and HR-TEM (C and D) images of L5P5-900-ACT sample.
The carbon precursor and the carbonization conditions both determine the structure of the final
carbon material.100
The addition of lignin can transform the product from amorphous carbon to
nanocrystalline graphite, since it permits nucleation, growth and clustering of aromatic rings
during pyrolysis from 600 to 1000°C.234
However, it has not been reported so far that alkali
lignin can form well-aligned graphene-like nanosheets after heating. On other hand, proteins may
have the potential to form partially aligned graphitic layers.142, 245
As shown by
thermogravimetric analysis (TGA) (Figure A1-2 A), the decomposition of the original protein
electrospun fibers began at around 200°C, above the glass transition temperatures of hordein and
zein. At this temperature, the Fourier transform infrared (FTIR) spectra (Figure A1-2 B) showed
that the protein denatured and its secondary structure dramatically changed. The amide I band
(1700-1600 cm-1
) in the FTIR spectra is the prominent vibrational band of the protein backbone
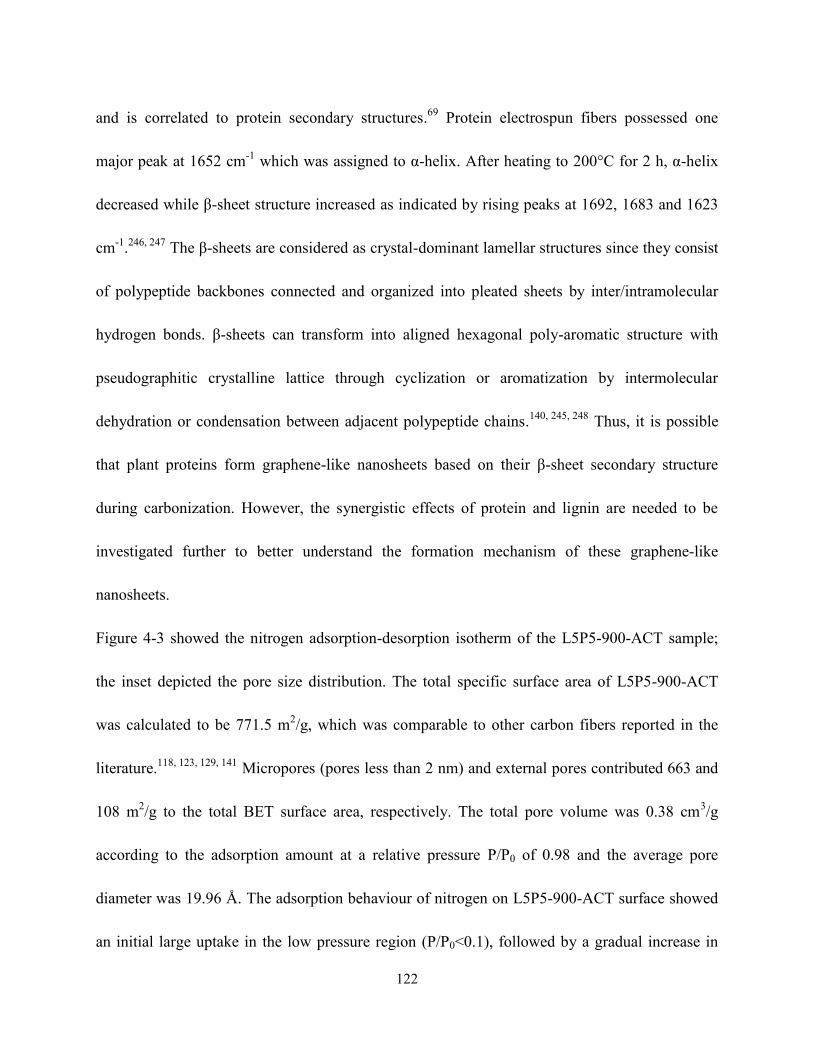
122
and is correlated to protein secondary structures.69
Protein electrospun fibers possessed one
major peak at 1652 cm-1
which was assigned to α-helix. After heating to 200°C for 2 h, α-helix
decreased while β-sheet structure increased as indicated by rising peaks at 1692, 1683 and 1623
cm-1
.246, 247
The β-sheets are considered as crystal-dominant lamellar structures since they consist
of polypeptide backbones connected and organized into pleated sheets by inter/intramolecular
hydrogen bonds. β-sheets can transform into aligned hexagonal poly-aromatic structure with
pseudographitic crystalline lattice through cyclization or aromatization by intermolecular
dehydration or condensation between adjacent polypeptide chains.140, 245, 248
Thus, it is possible
that plant proteins form graphene-like nanosheets based on their β-sheet secondary structure
during carbonization. However, the synergistic effects of protein and lignin are needed to be
investigated further to better understand the formation mechanism of these graphene-like
nanosheets.
Figure 4-3 showed the nitrogen adsorption-desorption isotherm of the L5P5-900-ACT sample;
the inset depicted the pore size distribution. The total specific surface area of L5P5-900-ACT
was calculated to be 771.5 m2/g, which was comparable to other carbon fibers reported in the
literature.118, 123, 129, 141
Micropores (pores less than 2 nm) and external pores contributed 663 and
108 m2/g to the total BET surface area, respectively. The total pore volume was 0.38 cm
3/g
according to the adsorption amount at a relative pressure P/P0 of 0.98 and the average pore
diameter was 19.96 Å. The adsorption behaviour of nitrogen on L5P5-900-ACT surface showed
an initial large uptake in the low pressure region (P/P0<0.1), followed by a gradual increase in
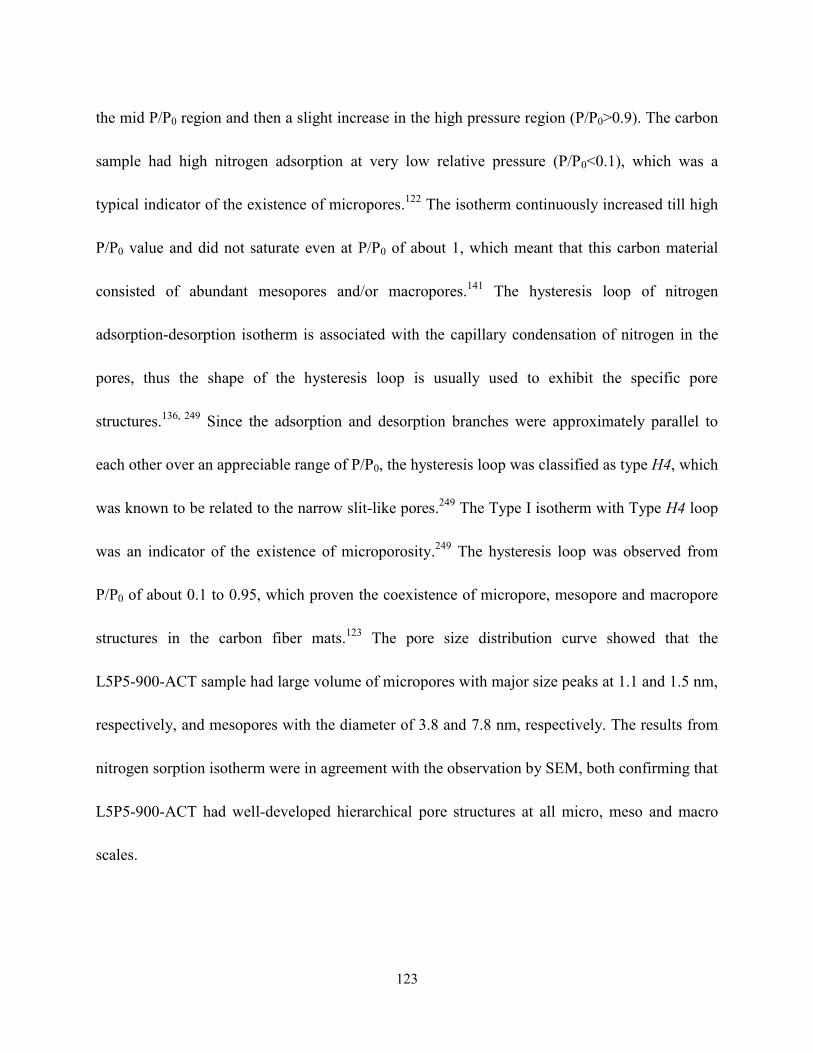
123
the mid P/P0 region and then a slight increase in the high pressure region (P/P0>0.9). The carbon
sample had high nitrogen adsorption at very low relative pressure (P/P0<0.1), which was a
typical indicator of the existence of micropores.122
The isotherm continuously increased till high
P/P0 value and did not saturate even at P/P0 of about 1, which meant that this carbon material
consisted of abundant mesopores and/or macropores.141
The hysteresis loop of nitrogen
adsorption-desorption isotherm is associated with the capillary condensation of nitrogen in the
pores, thus the shape of the hysteresis loop is usually used to exhibit the specific pore
structures.136, 249
Since the adsorption and desorption branches were approximately parallel to
each other over an appreciable range of P/P0, the hysteresis loop was classified as type H4, which
was known to be related to the narrow slit-like pores.249
The Type I isotherm with Type H4 loop
was an indicator of the existence of microporosity.249
The hysteresis loop was observed from
P/P0 of about 0.1 to 0.95, which proven the coexistence of micropore, mesopore and macropore
structures in the carbon fiber mats.123
The pore size distribution curve showed that the
L5P5-900-ACT sample had large volume of micropores with major size peaks at 1.1 and 1.5 nm,
respectively, and mesopores with the diameter of 3.8 and 7.8 nm, respectively. The results from
nitrogen sorption isotherm were in agreement with the observation by SEM, both confirming that
L5P5-900-ACT had well-developed hierarchical pore structures at all micro, meso and macro
scales.
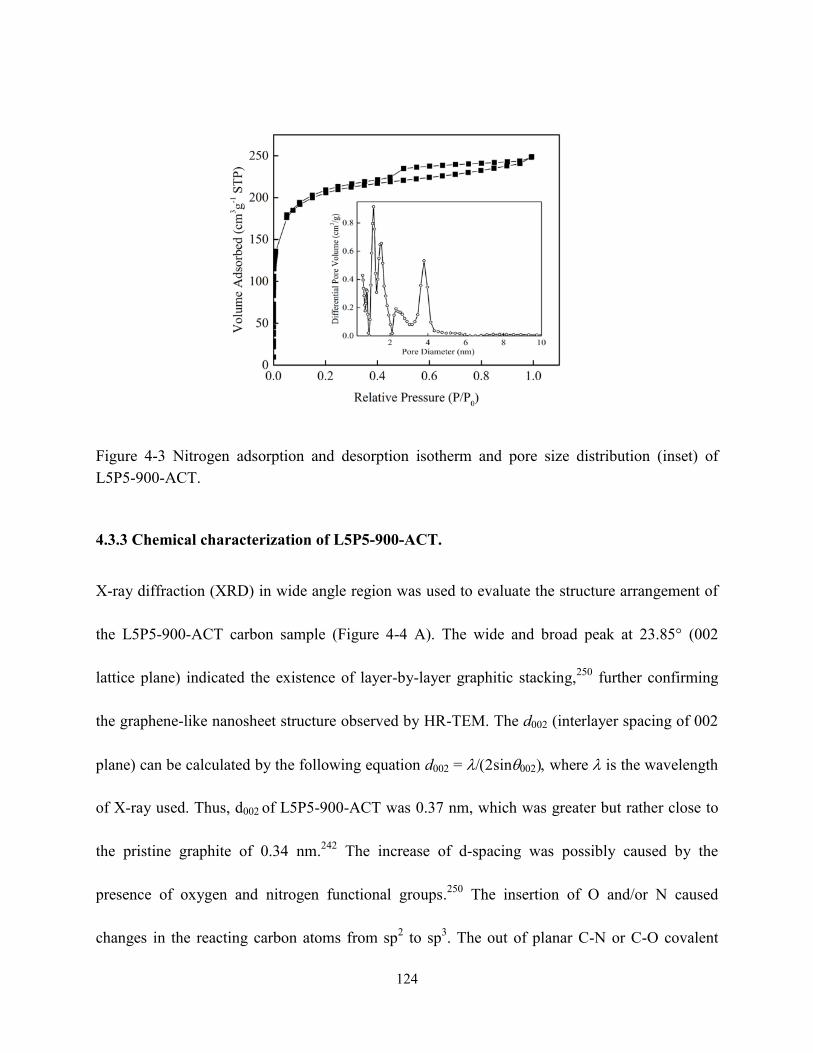
124
Figure 4-3 Nitrogen adsorption and desorption isotherm and pore size distribution (inset) of
L5P5-900-ACT.
4.3.3 Chemical characterization of L5P5-900-ACT.
X-ray diffraction (XRD) in wide angle region was used to evaluate the structure arrangement of
the L5P5-900-ACT carbon sample (Figure 4-4 A). The wide and broad peak at 23.85° (002
lattice plane) indicated the existence of layer-by-layer graphitic stacking,250
further confirming
the graphene-like nanosheet structure observed by HR-TEM. The d002 (interlayer spacing of 002
plane) can be calculated by the following equation d002 = sinwhere is the wavelength
of X-ray used. Thus, d002 of L5P5-900-ACT was 0.37 nm, which was greater but rather close to
the pristine graphite of 0.34 nm.242
The increase of d-spacing was possibly caused by the
presence of oxygen and nitrogen functional groups.250
The insertion of O and/or N caused
changes in the reacting carbon atoms from sp2 to sp
3. The out of planar C-N or C-O covalent
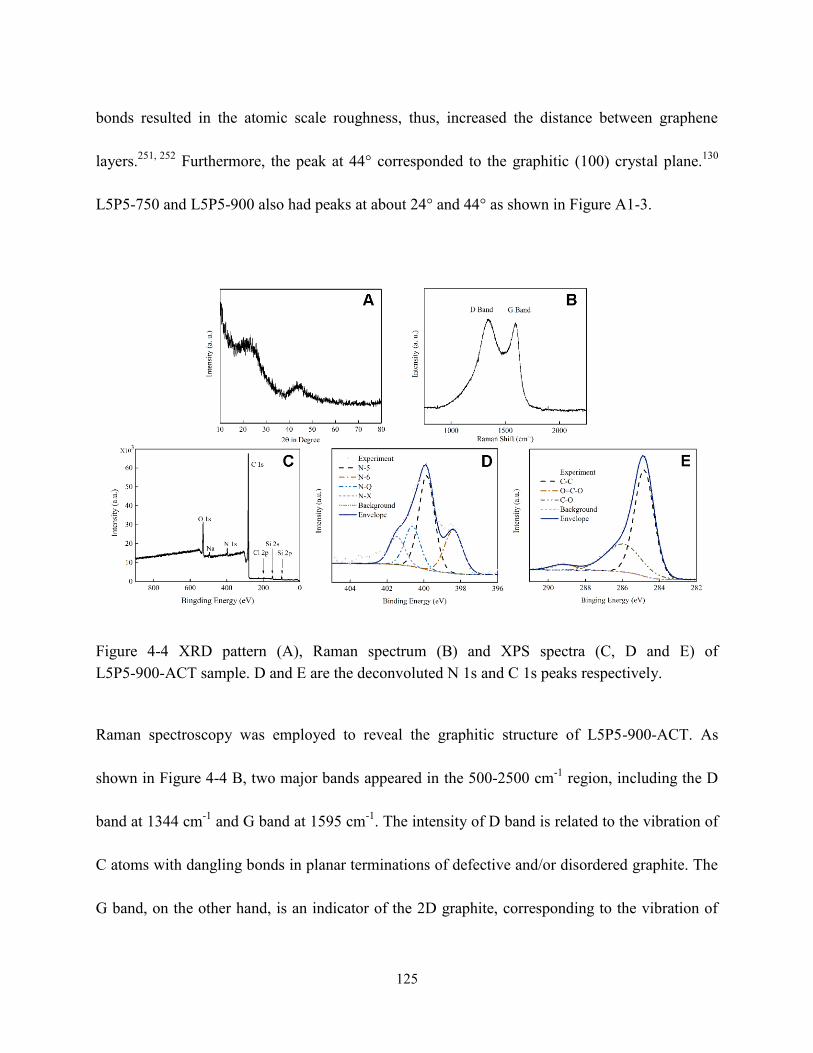
125
bonds resulted in the atomic scale roughness, thus, increased the distance between graphene
layers.251, 252
Furthermore, the peak at 44° corresponded to the graphitic (100) crystal plane.130
L5P5-750 and L5P5-900 also had peaks at about 24° and 44° as shown in Figure A1-3.
Figure 4-4 XRD pattern (A), Raman spectrum (B) and XPS spectra (C, D and E) of
L5P5-900-ACT sample. D and E are the deconvoluted N 1s and C 1s peaks respectively.
Raman spectroscopy was employed to reveal the graphitic structure of L5P5-900-ACT. As
shown in Figure 4-4 B, two major bands appeared in the 500-2500 cm-1
region, including the D
band at 1344 cm-1
and G band at 1595 cm-1
. The intensity of D band is related to the vibration of
C atoms with dangling bonds in planar terminations of defective and/or disordered graphite. The
G band, on the other hand, is an indicator of the 2D graphite, corresponding to the vibration of
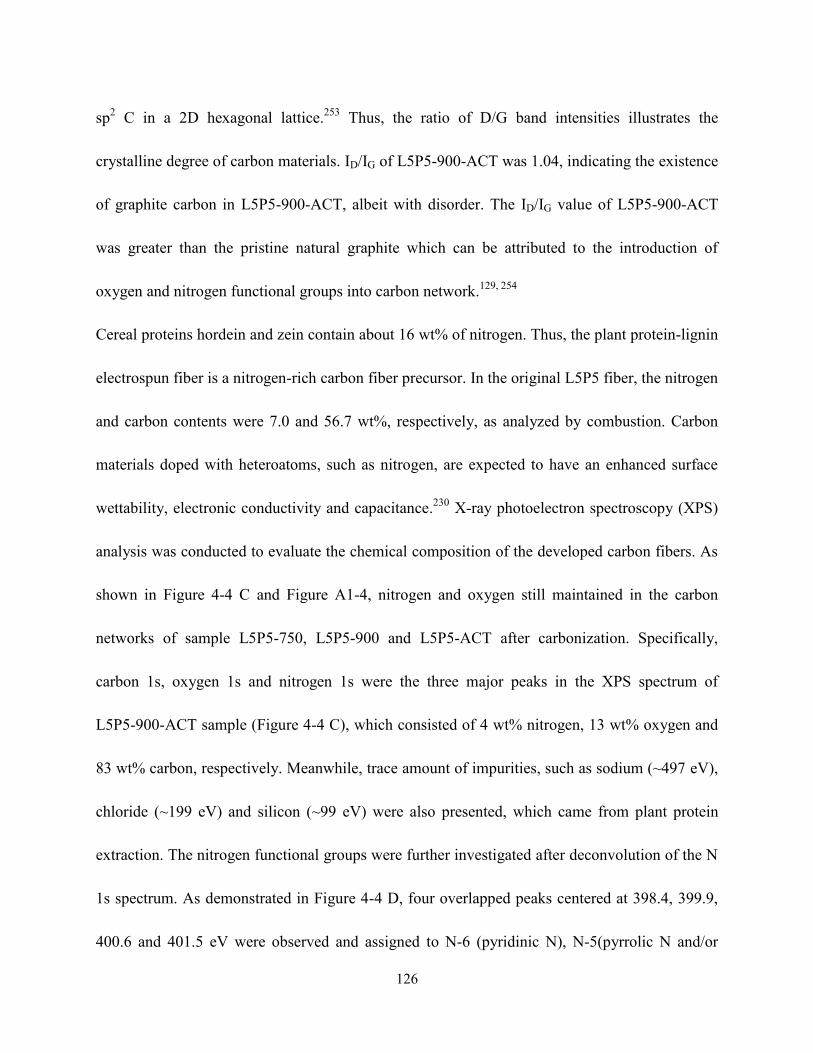
126
sp2 C in a 2D hexagonal lattice.
253 Thus, the ratio of D/G band intensities illustrates the
crystalline degree of carbon materials. ID/IG of L5P5-900-ACT was 1.04, indicating the existence
of graphite carbon in L5P5-900-ACT, albeit with disorder. The ID/IG value of L5P5-900-ACT
was greater than the pristine natural graphite which can be attributed to the introduction of
oxygen and nitrogen functional groups into carbon network.129, 254
Cereal proteins hordein and zein contain about 16 wt% of nitrogen. Thus, the plant protein-lignin
electrospun fiber is a nitrogen-rich carbon fiber precursor. In the original L5P5 fiber, the nitrogen
and carbon contents were 7.0 and 56.7 wt%, respectively, as analyzed by combustion. Carbon
materials doped with heteroatoms, such as nitrogen, are expected to have an enhanced surface
wettability, electronic conductivity and capacitance.230
X-ray photoelectron spectroscopy (XPS)
analysis was conducted to evaluate the chemical composition of the developed carbon fibers. As
shown in Figure 4-4 C and Figure A1-4, nitrogen and oxygen still maintained in the carbon
networks of sample L5P5-750, L5P5-900 and L5P5-ACT after carbonization. Specifically,
carbon 1s, oxygen 1s and nitrogen 1s were the three major peaks in the XPS spectrum of
L5P5-900-ACT sample (Figure 4-4 C), which consisted of 4 wt% nitrogen, 13 wt% oxygen and
83 wt% carbon, respectively. Meanwhile, trace amount of impurities, such as sodium (~497 eV),
chloride (~199 eV) and silicon (~99 eV) were also presented, which came from plant protein
extraction. The nitrogen functional groups were further investigated after deconvolution of the N
1s spectrum. As demonstrated in Figure 4-4 D, four overlapped peaks centered at 398.4, 399.9,
400.6 and 401.5 eV were observed and assigned to N-6 (pyridinic N), N-5(pyrrolic N and/or
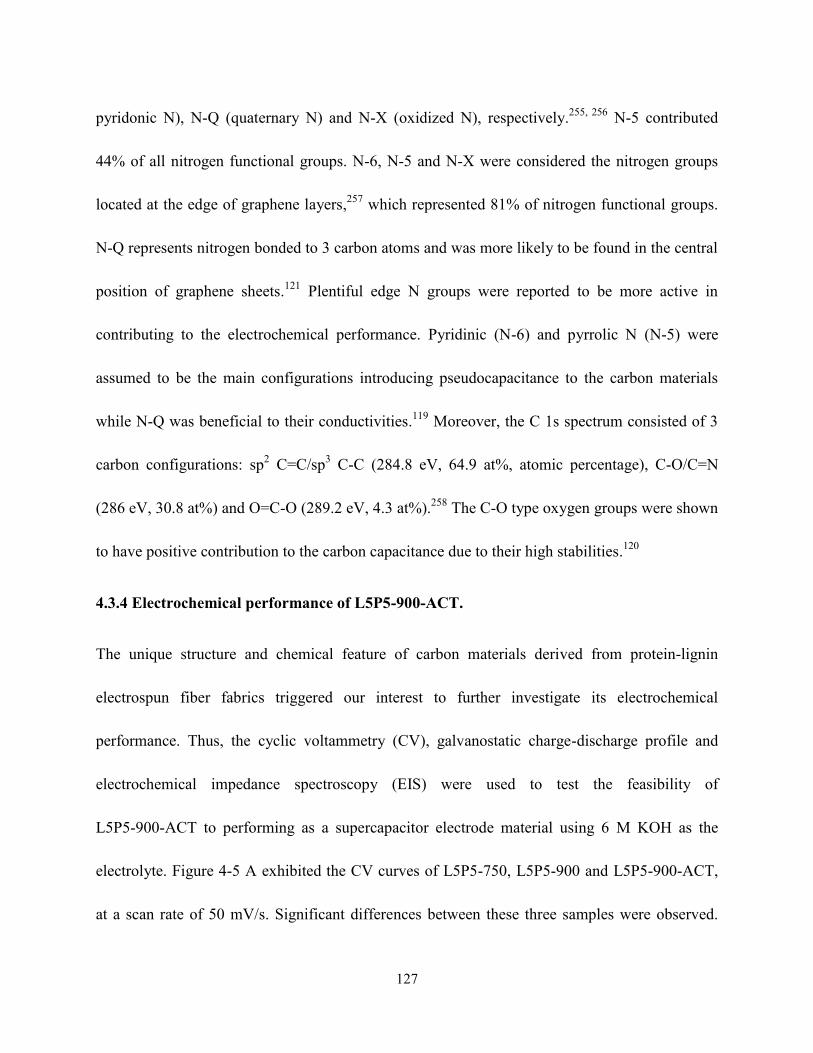
127
pyridonic N), N-Q (quaternary N) and N-X (oxidized N), respectively.255, 256
N-5 contributed
44% of all nitrogen functional groups. N-6, N-5 and N-X were considered the nitrogen groups
located at the edge of graphene layers,257
which represented 81% of nitrogen functional groups.
N-Q represents nitrogen bonded to 3 carbon atoms and was more likely to be found in the central
position of graphene sheets.121
Plentiful edge N groups were reported to be more active in
contributing to the electrochemical performance. Pyridinic (N-6) and pyrrolic N (N-5) were
assumed to be the main configurations introducing pseudocapacitance to the carbon materials
while N-Q was beneficial to their conductivities.119
Moreover, the C 1s spectrum consisted of 3
carbon configurations: sp2 C=C/sp
3 C-C (284.8 eV, 64.9 at%, atomic percentage), C-O/C=N
(286 eV, 30.8 at%) and O=C-O (289.2 eV, 4.3 at%).258
The C-O type oxygen groups were shown
to have positive contribution to the carbon capacitance due to their high stabilities.120
4.3.4 Electrochemical performance of L5P5-900-ACT.
The unique structure and chemical feature of carbon materials derived from protein-lignin
electrospun fiber fabrics triggered our interest to further investigate its electrochemical
performance. Thus, the cyclic voltammetry (CV), galvanostatic charge-discharge profile and
electrochemical impedance spectroscopy (EIS) were used to test the feasibility of
L5P5-900-ACT to performing as a supercapacitor electrode material using 6 M KOH as the
electrolyte. Figure 4-5 A exhibited the CV curves of L5P5-750, L5P5-900 and L5P5-900-ACT,
at a scan rate of 50 mV/s. Significant differences between these three samples were observed.

128
The CV curves of carbon materials without activation had a triangle shape, with greater specific
current observed for L5P5-900 than L5P5-750. The triangle shape indicated that pronounced ion
sieving effect occurred in these two samples.259
In such a case, the micro range pores were too
small and excluded out the electrolyte ions during scanning. After activation, the CV curve was
turned into rectangular shape and had significantly increased specific current, demonstrating
good capacitive behaviour. This showed that CO2 activation opened up pores that were closed,
clogged or obstructed and created meso and macropores at the surface of the carbon fibers. As
shown in Figure 4-3, the major micropore diameters of L5P5-900-ACT were 1.1 and 1.5 nm,
which were larger than that generally required for the accommodation of aqueous electrolytes
(0.4 – 0.8 nm).259, 260
Moreover, the mesopores and macropores at the fiber surface facilitated the
transport of electrolyte and increased the accessibility of electrolyte to pores in the fiber. The
small humps in the CV curve of L5P5-900-ACT were attributed to the pseudocapacitance
induced by the heteroatom functional groups such as nitrogen and oxygen. Figure 4-5 B showed
that the current density continuously increased as a function of scan rate for L5P5-900-ACT. The
CV curve still maintained a quasi-rectangular shape even at a scan rate as high as 100 mV/s,
exhibiting excellent ion transport behaviour and rapid charge propagation capability. This
favourable characteristic was likely to be related to its interconnected pore structure and partial
graphitization. The interconnected pore structure provided a rapid ion transport pathway.117
Graphene-like nanosheets endowed carbon fibers with high electron mobility due to its zero-gap
semiconductor nature.261
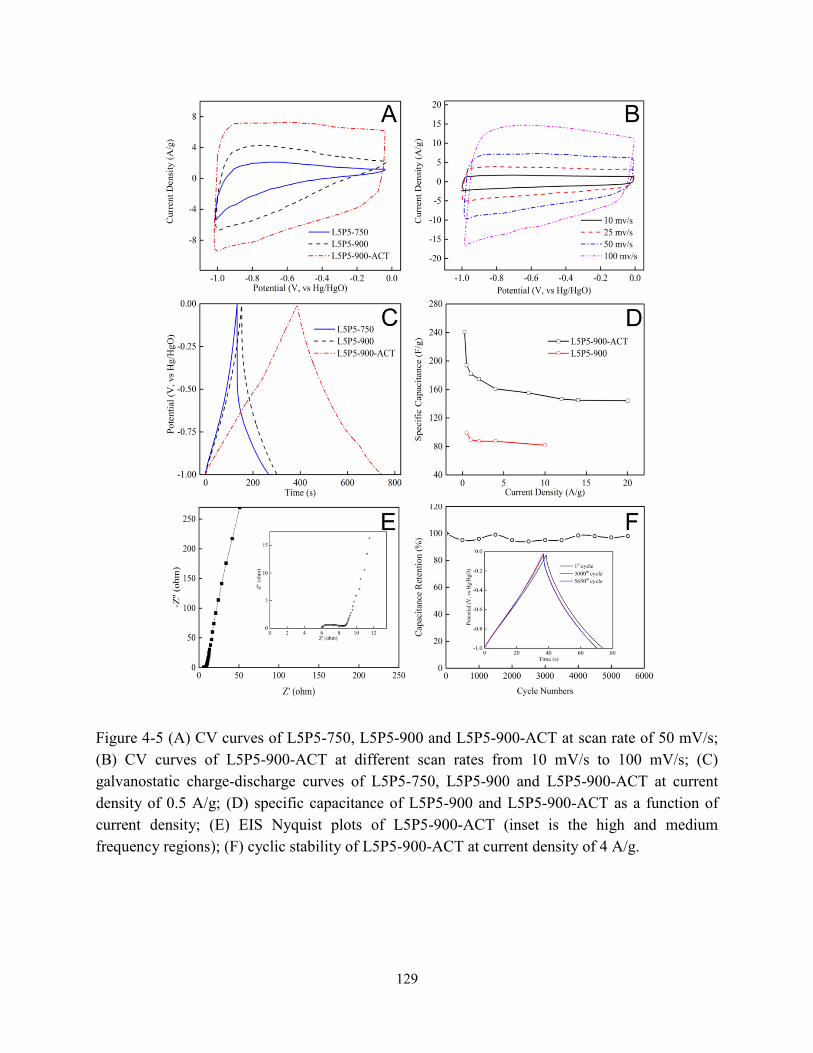
129
Figure 4-5 (A) CV curves of L5P5-750, L5P5-900 and L5P5-900-ACT at scan rate of 50 mV/s;
(B) CV curves of L5P5-900-ACT at different scan rates from 10 mV/s to 100 mV/s; (C)
galvanostatic charge-discharge curves of L5P5-750, L5P5-900 and L5P5-900-ACT at current
density of 0.5 A/g; (D) specific capacitance of L5P5-900 and L5P5-900-ACT as a function of
current density; (E) EIS Nyquist plots of L5P5-900-ACT (inset is the high and medium
frequency regions); (F) cyclic stability of L5P5-900-ACT at current density of 4 A/g.
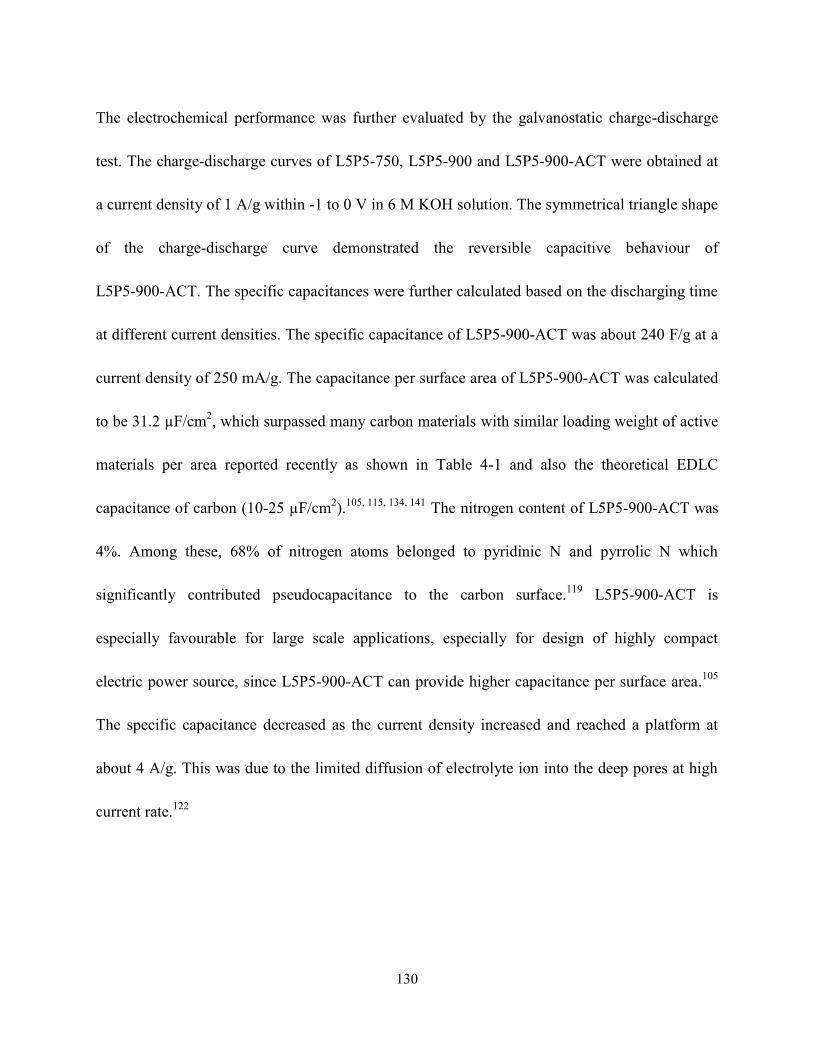
130
The electrochemical performance was further evaluated by the galvanostatic charge-discharge
test. The charge-discharge curves of L5P5-750, L5P5-900 and L5P5-900-ACT were obtained at
a current density of 1 A/g within -1 to 0 V in 6 M KOH solution. The symmetrical triangle shape
of the charge-discharge curve demonstrated the reversible capacitive behaviour of
L5P5-900-ACT. The specific capacitances were further calculated based on the discharging time
at different current densities. The specific capacitance of L5P5-900-ACT was about 240 F/g at a
current density of 250 mA/g. The capacitance per surface area of L5P5-900-ACT was calculated
to be 31.2 µF/cm2, which surpassed many carbon materials with similar loading weight of active
materials per area reported recently as shown in Table 4-1 and also the theoretical EDLC
capacitance of carbon (10-25 µF/cm2).
105, 115, 134, 141 The nitrogen content of L5P5-900-ACT was
4%. Among these, 68% of nitrogen atoms belonged to pyridinic N and pyrrolic N which
significantly contributed pseudocapacitance to the carbon surface.119
L5P5-900-ACT is
especially favourable for large scale applications, especially for design of highly compact
electric power source, since L5P5-900-ACT can provide higher capacitance per surface area.105
The specific capacitance decreased as the current density increased and reached a platform at
about 4 A/g. This was due to the limited diffusion of electrolyte ion into the deep pores at high
current rate.122

131
Table 4-1 Comparison of the specific capacitances of some carbon fibers materials reported
previously
Samples Electrolytes Specific capacitance
KOH activated graphene 262
BMIM BF4 /AN 6.9 µF/cm2 at 1.4 A/g
Carbon from pistachio nutshell 263
1 M TEABF4 EC-DEC 20.1 µF/cm2 at 2 mV/s
N-doped hollow carbon nanofibers 264
6 M KOH 28.1 µF/cm2 at 0.2 A/g
N-doped carbon fibers from protein-lignin
(This work) 6 M KOH 31.2 µF/cm
2 at 0.5 A/g
Electrochemical impedance spectroscopy (EIS) is a powerful technique for characterizing the
properties of electrode-electrolyte interfaces of supercapacitors and provides information about
the internal resistance of the electrode materials and the resistance between electrode and
electrolyte.123
The EIS of L5P5-900-ACT was tested from 10-2
to 105 Hz and the resulting
Nyquist plots of L5P5-900-ACT were shown in Figure 4-5 E. In the low frequency region, a
straight vertical line was obtained, indicating a capacitive behaviour of L5P5-900-ACT carbon
sample. The projected length of Warburg-type line (the slope of the 45° portion of the Nyquist
plots) on Z‘ axis was widely accepted to demonstrate the characterization of ion diffusion
process in the electrode. The Warburg-type line of L5P5-900-ACT was rather short, directly
proving that the carbon material had a short electrolyte diffusion pathway due to its hierarchical
porous structure, which is important for a low ion-transport resistance, high rate capability and
power density.117
132
To explore the potential of L5P5-900-ACT as supercapacitor material, the charge-discharge
cyclic stability of L5P5-900-ACT was tested at a current density of 4 A/g. As exhibited by
Figure 4-5 F, 95% of the initial capacitance was maintained after over 5,500 charge and
discharge cycles and the shapes of the galvanostatic charge-discharge curves varied only slightly.
This result indicated that L5P5-900-ACT carbon material had excellent long term
charge-discharge cyclic stability, which would make it feasible for use in many industrial and
personal applications.
4.4 Conclusions
This is the first time that a convenient method has been developed to prepare nitrogen-doped
carbon fibers from plant proteins (hordein and zein) and lignin with a high energy storage
capacity. These carbon fibers possessed a specific capacitance of 31.2 µF/cm2 in 6 M KOH and
95% capacitance retention after 5,500 charge-discharge cycles. These excellent electrochemical
properties were due to the well-engineered characteristics of the materials, including a
hierarchical porous texture, an interconnected fiber network, a large amount of heteroatomes
(nitrogen and oxygen), and the graphene-like nanosheet structure. Carbon fibers derived from
plant protein and lignin electrospun fabrics have the potential to be used as new and effective
energy storage devices. Environmentally sustainable industrial applications could be developed
from this technology, such as portable electronic devices, hybrid electric vehicles and the
management of large scale power systems.
133
Chapter 5
Plant proteins - nitrogen-doped porous graphitic carbon fibers for
supercapacitor
5.1 Introduction
Rapidly growing markets for portable electronic devices and hybrid electric vehicles are
demanding components be made from renewable and recyclable materials. High performance
energy storage systems made from natural materials have attracted attention accordingly, in both
academic and industrial fields. A supercapacitor is an electrochemical energy storage device with
high power density and rapid charge-discharge rate, and has the potential to fill the gap between
the battery and the conventional capacitor. However, the energy density of supercapacitor still
needed to be improved.100, 122
Among supercapacitors, the electrochemical double layer capacitor
(EDLC) is popular and commercially available, and stores energy by reversible electrostatic
accumulation of ions on the surface of porous electrodes.104
Carbon is widely used as a supercapacitor material, especially the EDLC, due to its high cyclic
stability, good electronic conductivity, low cost, and wide operating temperature range.105
Versatile carbon structures, such as carbon fibers, aerogels, tubes, sheets and particles,105
have
been developed to adapt to various applications and achieve better energy storage
performance.123
Porous graphitic carbons possess excellent features for both porous carbon and
graphene, and show promise for use as supercapacitor electrode materials. The porous structure

134
provides a high specific surface area and increases the accessibility of electrolytes to the
micropores, whereas the graphitic structure endows excellent intrinsic in-plane electrical
conductivity and low resistance ion transport pathways.262, 265, 266
Porous graphitic carbons are
normally prepared by ‗top-down‘ methods, which usually require several steps of exfoliation and
activation. These processes may result in high cost, low yields and contamination of strong acid
and/or alkaline reagents in the final products.137, 262
More recently ‗bottom-up‘ methods have
been applied to generate porous graphitic carbons from graphitizable precursors through a high
temperature treatment (>2500°C) or from graphitizable/non-graphitizable materials with
moderate thermal treatments and catalysts, such as Fe, Ni, Co.133, 244, 266
Raw materials include
various biomass and synthetic precursors, such as coconut shell137
, corn stalk267
and resin244
that
can all form graphitic structures after carbonization.
Besides a well-tailored architecture, surface chemistry also plays an important role in
determining the capacitance of carbon-based EDLCs.102
Introducing heteroatoms, such as
nitrogen, oxygen, boron and sulfur, to the carbon matrix has proven effective to enhance the
specific power density and energy density of EDLCs. Here, the heteroatomic functional groups
serve to provide pseudocapacitance by Faradic redox reactions and/or chemisorptions, as well as
to increase the wettability of the carbon surface.102, 122, 123
Nitrogen - one of the most popularly
studied heteroatoms - can be incorporated by in situ synthesis using N-rich precursors and/or by
chemically treating carbonaceous materials with N-reagents.119

135
Proteins are one of the most abundant biomaterials around the world, and the N and O on the
polypeptide chains can be preserved and embedded in the carbon matrix during the carbonization
procedure. Thus, proteins are interesting materials to prepare heteroatom-doped carbon by facile
and eco-friendly methods.122, 138
Cho et al. 245
recently revealed that silk proteins can form a
sp2-hybridized carbon hexagonal structure at 350°C with a highly ordered graphitic structure
after high temperature treatments, such as 2800°C. This phenomenon may be attributed to the
secondary structure of protein. For example, intermolecular β-sheets are formed by two or more
polypeptide chains through hydrogen bonds between the amide proton and carbonyl oxygen on
adjacent chains. During carbonization, chains in β-sheet structures may achieve aromatization
through intermolecular dehydration and/or condensation between adjacent chains.140, 245
In spite
of their theoretical potential, practical attempts to develop carbon materials with porous graphitic
structure from proteins have been unsuccessful.
Zein and hordein are two of the most abundant and affordable cereal proteins, and are stored in
corn and barley grains, respectively. Zein is a by-product of corn starch processing and a major
co-product of corn fermentation.233
Hordein is a by-product of barley starch and β-glucan
extraction.2 Both of these proteins are hydrophobic and can be dissolved in acetic acid. Their
mixture can form electrospun nanofibers with good tensile strength without the addition of
synthetic polymers - a feature conferring these proteins an advantage compared to most other
plant proteins.28
One challenge using proteins as a carbon precursor is to be able to maintain the
nanofiber structure during carbonization without unfolding and melting the structure during
136
pyrolysis.245
In the leather manufacturing industry dating back to ancient times, metal ions were
added to ‗fix‘ the leather. This process is now known to involve a metal-collagen protein
interaction that gave the product better mechanical strength and thermal stability.268-270
As
inspired by metal stabilization concept of leather processing, this study proposed to add calcium
salt to the plant protein electrospinning dope. During electrospinning, hordein molecules have an
extended and flexible conformation and interact with each other to form nanofibers.93
Ca2+
may
modify the protein nanofiber bundles to increase their thermal stability during carbonization, as
metal ions do in leather preparation. Also, the addition of Ca2+
may influence the conductivity
and viscosity of the protein electrospinning dope and consequently modulate the diameter of the
protein fibers.271, 272
Calcium acetate can serve as a template to generate pores on carbon samples
and is easily washed away after carbonization. For these reasons, calcium acetate was selected to
facilitate the conversion of protein nanofibers into carbon nanofibers in this research.
The objective of this study is to convert barley proteins based electrospun nanofibers fabric into
N-doped carbon fibers with 3D interconnected hierarchical porous structure as electrode
materials for supercapacitor. The influence of Ca2+
on protein nanofiber diameter and
morphology was investigated, and X-ray photoelectron spectroscopy (XPS) was used to study N
and O functional groups on the carbon surface. The feasibility of using these carbon samples as
supercapacitor electrode materials is evaluated and discussed.
137
5.2 Materials and methods
5.2.1 Materials
Barley grains (Falcon) were kindly provided by Dr. James Helm of Alberta Agriculture and
Rural Development, Lacombe, AB, Canada. Hordeins were extracted from barley grains using an
ethanol solution according to a procedure reported in our previous work.18
Zein (F4000, 92%
protein content) was kindly provided by Freeman Industries LLC (New York, NY, USA) and
used without further purification. Calcium hydroxide, polyvinylidene fluoride (PVDF, molecular
weight ~275,000 by gel permeation chromatography), N-methyl-2-pyrrolidone (NMP) and acetic
acid were purchased from Sigma-Aldrich Canada Ltd (Oakville, ON, Canada). Glutaradehyde
solution (50%) and carbon black Super P was obtained from Fisher Scientific (ON, Canada) and
Alfa Aesar (Ward Hill, MA, US), respectively. All chemicals were used as received unless
otherwise specified. Ultrapure water purified using a Milli-Q Advantage A10 system (EMD
Millipore Corporation, MA, USA) was used to prepare electrolyte solution.
5.2.2 Preparation of plant protein-calcium electrospun fabrics
To prepare the protein-calcium acetate mixture for electrospinning, a desired amount (2 to 12%,
w/v) of calcium hydroxide was slowly added to 2 mL acetic acid solution (90%, v/v) and stirred
for 2 h to form calcium acetate. Plant protein solutions (18%, w/v) were then prepared by
dissolving protein powders (hordein:zein=50:50, w/w) in the acetic acid solution with calcium
acetate, and stirred for 12 h at 25°C. The electrospinning experiments were carried out by a
138
customized digital electrospinning apparatus EC-DIG (IME Technologies, Eindhoven,
Netherlands) at 25°C. Solutions were forced through a blunt needle with a diameter of 0.8 mm at
the flow rate of 1 mL/h. The spinning voltage was fixed at 20 kV and the needle to collector
distance was 20 cm. The electrospun fiber fabrics were collected on a rotary collector with a
rotating speed of 1 rpm. The electrospun protein-calcium fibers were cross-linked by placing on
a pan flowing above 200 mL of 25% (v/v) glutaraldehyde solution in a sealed glass container for
6 h at room temperature.273
5.2.3 Carbonization
The carbon fibers were synthesized by one-step carbonization of the protein and calcium acetate
electrospun fiber fabrics by heating in a tubular furnace (GSL-1100X-NT-UL, MTI Corporation,
CA, US). In a typical experiment, the carbonization step was operated under continuous argon
flow with the following heating procedure: (1) the temperature was raised from 25 to 200˚C at a
rate of 5˚C/min; (2) the temperature was held at 200˚C for 2 h to stabilize the protein-Ca2+
electrospun fibers; (3) the temperature increased from 200 to 300˚C at a rate of 1˚C/min to have
a slow thermo decomposition of proteins and calcium acetate; (4) the temperature continued to
increase from 300 to 850˚C at 5˚C/min; (5) the carbonization temperature was held for 2 h; (6)
the sample was cooled down naturally under argon flow. Finally, the carbon sample was
immersed in 2 mol/L hydrochloride solution to remove the calcium oxide and other soluble
substrates, and then rinsed with water and dried at 100˚C under vacuum. The carbon samples
139
derived from electrospun fiber fabrics with varied amounts of calcium hydroxide were coded as
P-4%Ca, P-8%Ca, P-10%Ca and P-12%Ca, respectively. The cross-linked sample was suffixed
with CL. For example, the carbon fiber sample derived from cross-linked electrospun fabric
made with 10% Ca(OH)2 was named P-10%Ca-CL.
5.2.4 Fiber size and morphology observation
The exterior morphology of the original fiber and the carbon fiber samples were observed by a
Hitachi X-650 scanning electron microscope (SEM, Hitachi, Japan) at 20 kV. The original fiber
samples were sputtered with gold before observation. High resolution transmission electron
microscope (HRTEM, JEOL 2100, JEOL Inc., US) was used to study the inner microstructure of
carbon fiber samples. For this, samples were ground into powder before deposition onto the 300
mesh Cu/Pd grids for observation.
5.2.5 Fiber textural characterization and chemical analysis
Thermogravimetric analysis (TGA) of the original protein fibers was conducted by a
thermogravimetric analyzer (TA Instruments, Q500, New Castle, DE, US) under argon with a
heating rate of 2oC/min. For analysis of chemistry composition of the carbon surface, X-ray
photoelectron spectroscopy (XPS) was obtained by an Axis Ultra spectrometer (Kratos
Analytical, Manchester, UK) with X-radiation Al Kα (hv = 1486.6 eV). The C 1s, O 1s and N 1s
core levels were fitted using the CasaXPS software. The N and C contents of the original fibers
were measured by the Leco nitrogen analyzer (FP-628, Leco, St. Joseph, MI, US). AutosorbiQ
140
(Quantachrome Instruments, Boynton Beach, FL, US) was employed to measure the N
adsorption-desorption isotherm, specific surface area and the porous texture at 77 K. The specific
surface area and pore size distribution was calculated based on the Brunauer-Emmett-Teller
(BET) theory and the Barrett-Joyner-Halenda (BJH) model, respectively with the AutosorbiQ‘s
associated software (ASiQWin). To analyze the crystallinity of carbon sample, X-ray powder
diffraction (XRD) patterns were obtained using a Bruker AXS D8 Discover diffractometer
(Bruker Coperation, East Milton, ON, CANADA) with the Cu Kα radiation ( = 1.541841 Å) at
40 kV and 44 mA (2 was from 10 to 80°). Raman spectra were obtained to analyze the carbon
structure by a Nicolet Omega XR Raman microscope (Thermo Fisher Scientific, Waltham, MA,
US). The excitation wavelength of the near infrared laser was set at 532 nm and data points were
recorded at 0.5 cm-1
interval.
5.2.6 Electrochemical performance in 6 M KOH
To measure the electrochemical properties, each activated carbon sample derived from plant
protein electrospun fiber fabrics was ground and mixed with a 10 wt% carbon black and 10%
PVDF binder (10 wt% in NMP) to form a paste. The paste with 8mg active carbon sample was
cast onto a 1.0 cm2
piece of nickel foam. Then, the carbon sample was dried under vacuum at
120oC for 12 h and pressed under 2,000 psi by a bench top laboratory press (model 3851, Carver
Inc., Wabash, IN, US) to fabricate an electrode. To assemble a three-electrode cell, the above
nickel foam, a Pt wire, and an Hg/HgO were used as working, counter and reference electrodes,

141
respectively. All electrochemical properties were analyzed by a Solartron 1287 electrochemical
interface (Solartron Analytical, Berwyn, PA, US). Cyclic voltammetry studies were performed in
the potential window of -1.0 to 0 V vs. reference electrode at various scan rate from 5 to 100
mV/s. Galvanostatic charge-discharge curves were measured with current density from 0.5 to 10
A/g. The specific capacitance of carbon materials were calculated by the following equation:
𝐶 = 𝐼∆𝑡
𝑚∆𝑉
Where I(A)is the discharge current, ∆t stands for the discharging time, m (g) is the weight of
carbon sample loaded on the working electrode, and ∆V represents the potential window.
Electrochemical impedance spectroscopy (EIS) was performed in a frequency range from 10-2
to
105 Hz with 5 mV amplitude.
5.2.7 Statistical analysis
All experiments were performed at least in three independent batches. For SEM and TEM results,
one typical image was presented respectively. For nitrogen adsorption-desorption isotherm, TGA,
Raman spectroscopy, XRD, XPS and electrochemical analysis, one typical curve was presented
respectively. For data in figures, error bars represents the standard deviation (n = 100). Statistical
evaluation was conducted by analysis of variance (ANOVA) using SAS (SAS Institute, Inc.,
Cary, NC). Statistical differences between samples were performed with a level of significance
of p<0.05.
142
5.3 Results and discussion
5.3.1 Morphologies of the plant protein-calcium fibers
Figures 5-1 A-D show the morphologies of the plant protein-calcium nanofibers and the mean
diameter of the fibers were summarized in Figure 5-1 F. Plant proteins can be fabricated into
nanofibers with a smooth surface and controllable diameter by electrospinning in the presence of
4-10% of Ca2+
, although some tiny flocculent fibers appeared as the calcium concentration
increased to 8 and 10%. Increasing Ca2+
to 12% resulted in a conspicuous irregular
beads-on-string structure in the nanofiber fabrics. The mean diameters of fibers decreased from
992 to 413 nm as Ca2+
increased from 4 to 10% and then leveled off from 10 to 12%. Similar to
some synthetic polymers, such as poly(acrylic acid) and poly(lactic acid) the addition of ions can
lead to an increase of the charge density in the spinning dope causing the electrospinning jet to
carry more electric charge. Thus, in the strong electric field, the spinning jet may bear stronger
elongation forces and produce fibers with smaller diameters.272, 274
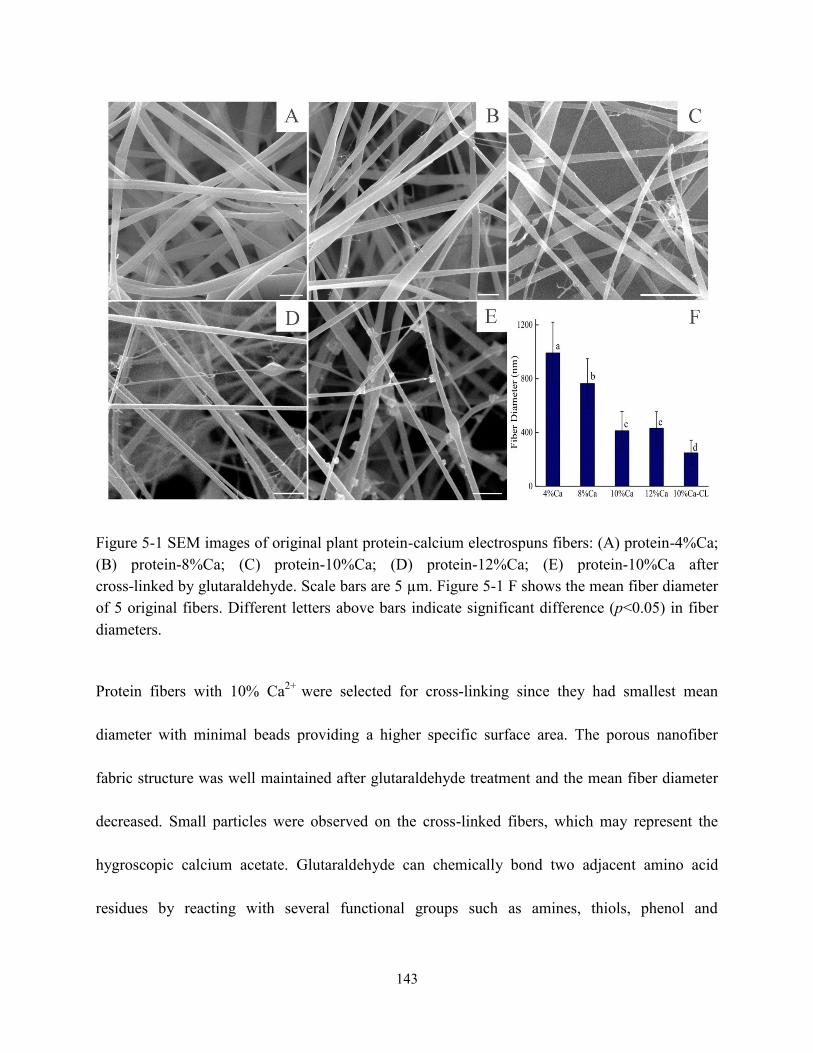
143
Figure 5-1 SEM images of original plant protein-calcium electrospuns fibers: (A) protein-4%Ca;
(B) protein-8%Ca; (C) protein-10%Ca; (D) protein-12%Ca; (E) protein-10%Ca after
cross-linked by glutaraldehyde. Scale bars are 5 µm. Figure 5-1 F shows the mean fiber diameter
of 5 original fibers. Different letters above bars indicate significant difference (p<0.05) in fiber
diameters.
Protein fibers with 10% Ca2+
were selected for cross-linking since they had smallest mean
diameter with minimal beads providing a higher specific surface area. The porous nanofiber
fabric structure was well maintained after glutaraldehyde treatment and the mean fiber diameter
decreased. Small particles were observed on the cross-linked fibers, which may represent the
hygroscopic calcium acetate. Glutaraldehyde can chemically bond two adjacent amino acid
residues by reacting with several functional groups such as amines, thiols, phenol and
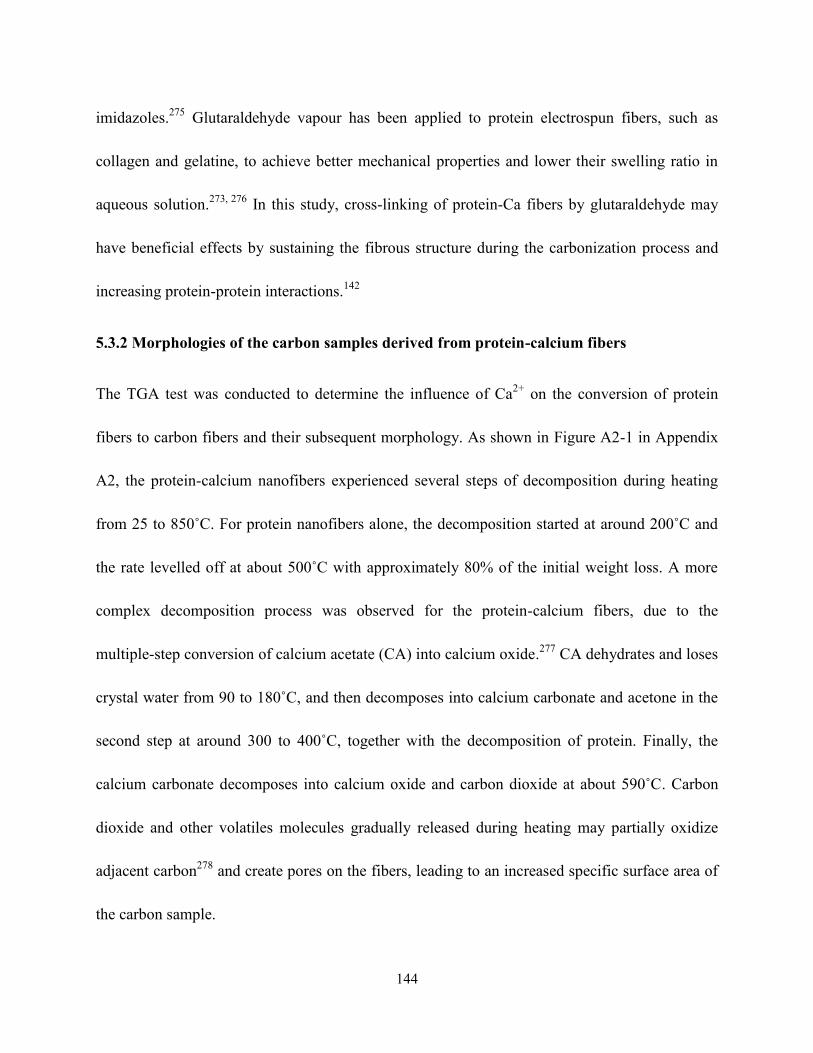
144
imidazoles.275
Glutaraldehyde vapour has been applied to protein electrospun fibers, such as
collagen and gelatine, to achieve better mechanical properties and lower their swelling ratio in
aqueous solution.273, 276
In this study, cross-linking of protein-Ca fibers by glutaraldehyde may
have beneficial effects by sustaining the fibrous structure during the carbonization process and
increasing protein-protein interactions.142
5.3.2 Morphologies of the carbon samples derived from protein-calcium fibers
The TGA test was conducted to determine the influence of Ca2+
on the conversion of protein
fibers to carbon fibers and their subsequent morphology. As shown in Figure A2-1 in Appendix
A2, the protein-calcium nanofibers experienced several steps of decomposition during heating
from 25 to 850˚C. For protein nanofibers alone, the decomposition started at around 200˚C and
the rate levelled off at about 500˚C with approximately 80% of the initial weight loss. A more
complex decomposition process was observed for the protein-calcium fibers, due to the
multiple-step conversion of calcium acetate (CA) into calcium oxide.277
CA dehydrates and loses
crystal water from 90 to 180˚C, and then decomposes into calcium carbonate and acetone in the
second step at around 300 to 400˚C, together with the decomposition of protein. Finally, the
calcium carbonate decomposes into calcium oxide and carbon dioxide at about 590˚C. Carbon
dioxide and other volatiles molecules gradually released during heating may partially oxidize
adjacent carbon278
and create pores on the fibers, leading to an increased specific surface area of
the carbon sample.
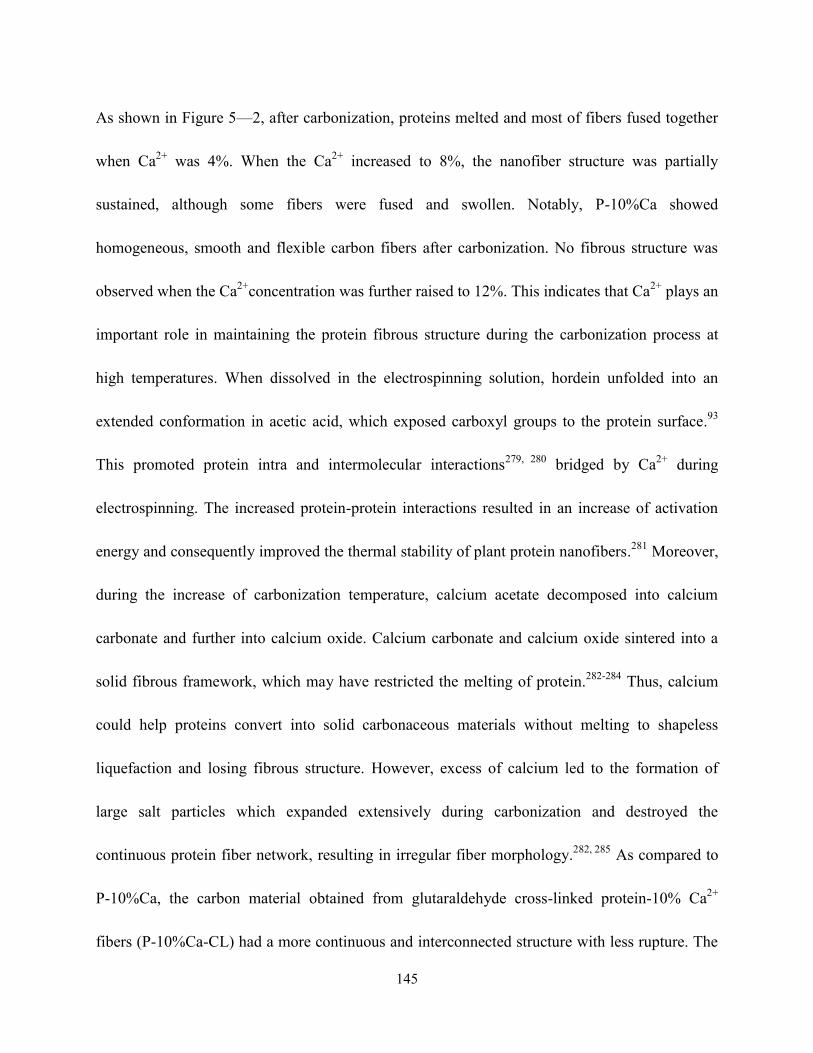
145
As shown in Figure 5—2, after carbonization, proteins melted and most of fibers fused together
when Ca2+
was 4%. When the Ca2+
increased to 8%, the nanofiber structure was partially
sustained, although some fibers were fused and swollen. Notably, P-10%Ca showed
homogeneous, smooth and flexible carbon fibers after carbonization. No fibrous structure was
observed when the Ca2+
concentration was further raised to 12%. This indicates that Ca2+
plays an
important role in maintaining the protein fibrous structure during the carbonization process at
high temperatures. When dissolved in the electrospinning solution, hordein unfolded into an
extended conformation in acetic acid, which exposed carboxyl groups to the protein surface.93
This promoted protein intra and intermolecular interactions279, 280
bridged by Ca2+
during
electrospinning. The increased protein-protein interactions resulted in an increase of activation
energy and consequently improved the thermal stability of plant protein nanofibers.281
Moreover,
during the increase of carbonization temperature, calcium acetate decomposed into calcium
carbonate and further into calcium oxide. Calcium carbonate and calcium oxide sintered into a
solid fibrous framework, which may have restricted the melting of protein.282-284
Thus, calcium
could help proteins convert into solid carbonaceous materials without melting to shapeless
liquefaction and losing fibrous structure. However, excess of calcium led to the formation of
large salt particles which expanded extensively during carbonization and destroyed the
continuous protein fiber network, resulting in irregular fiber morphology.282, 285
As compared to
P-10%Ca, the carbon material obtained from glutaraldehyde cross-linked protein-10% Ca2+
fibers (P-10%Ca-CL) had a more continuous and interconnected structure with less rupture. The
146
3D interconnected fibrous network of P-10%Ca-CL is more favourable than the separated fiber
network of P-10%Ca since a continuous network facilitates the electron transportation and
reduces the contact resistance. Usually, carbon fibers have excellent electronic conductivity
along the fiber axis. However, due to the large distance among fibers, carbon fibers have contact
resistance, which can limit their performance.100
Meanwhile, the macropores formed by
interlaced carbon fibers can serve as ion-buffering reservoirs and can minimize the diffusion
distances of ions to the interior surfaces.240
This then contributes to a lower diffusive resistance,
higher rate capacitance and power density of the carbon materials.117
For these reasons, the
structure of P-10%Ca-CL was superior to P-10%Ca and was selected for the further experiments.
Figure 5-2 SEM images of carbon samples derived from plant protein-calcium electrospun fibers
at 850°C: (A) P-4%Ca; (B) P-8%Ca; (C) P-10%Ca; (D) P-12%Ca and (E) P-10%Ca-CL. Scale
bars: 2.5 µm.
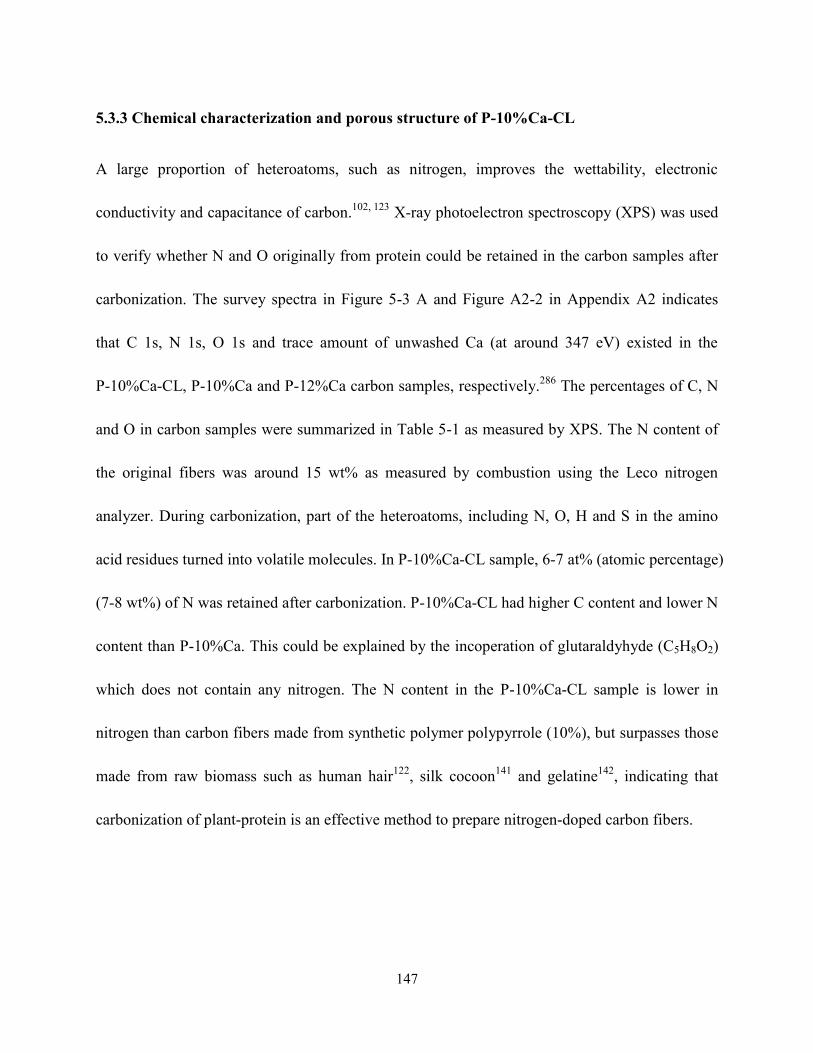
147
5.3.3 Chemical characterization and porous structure of P-10%Ca-CL
A large proportion of heteroatoms, such as nitrogen, improves the wettability, electronic
conductivity and capacitance of carbon.102, 123
X-ray photoelectron spectroscopy (XPS) was used
to verify whether N and O originally from protein could be retained in the carbon samples after
carbonization. The survey spectra in Figure 5-3 A and Figure A2-2 in Appendix A2 indicates
that C 1s, N 1s, O 1s and trace amount of unwashed Ca (at around 347 eV) existed in the
P-10%Ca-CL, P-10%Ca and P-12%Ca carbon samples, respectively.286
The percentages of C, N
and O in carbon samples were summarized in Table 5-1 as measured by XPS. The N content of
the original fibers was around 15 wt% as measured by combustion using the Leco nitrogen
analyzer. During carbonization, part of the heteroatoms, including N, O, H and S in the amino
acid residues turned into volatile molecules. In P-10%Ca-CL sample, 6-7 at% (atomic percentage)
(7-8 wt%) of N was retained after carbonization. P-10%Ca-CL had higher C content and lower N
content than P-10%Ca. This could be explained by the incoperation of glutaraldyhyde (C5H8O2)
which does not contain any nitrogen. The N content in the P-10%Ca-CL sample is lower in
nitrogen than carbon fibers made from synthetic polymer polypyrrole (10%), but surpasses those
made from raw biomass such as human hair122
, silk cocoon141
and gelatine142
, indicating that
carbonization of plant-protein is an effective method to prepare nitrogen-doped carbon fibers.
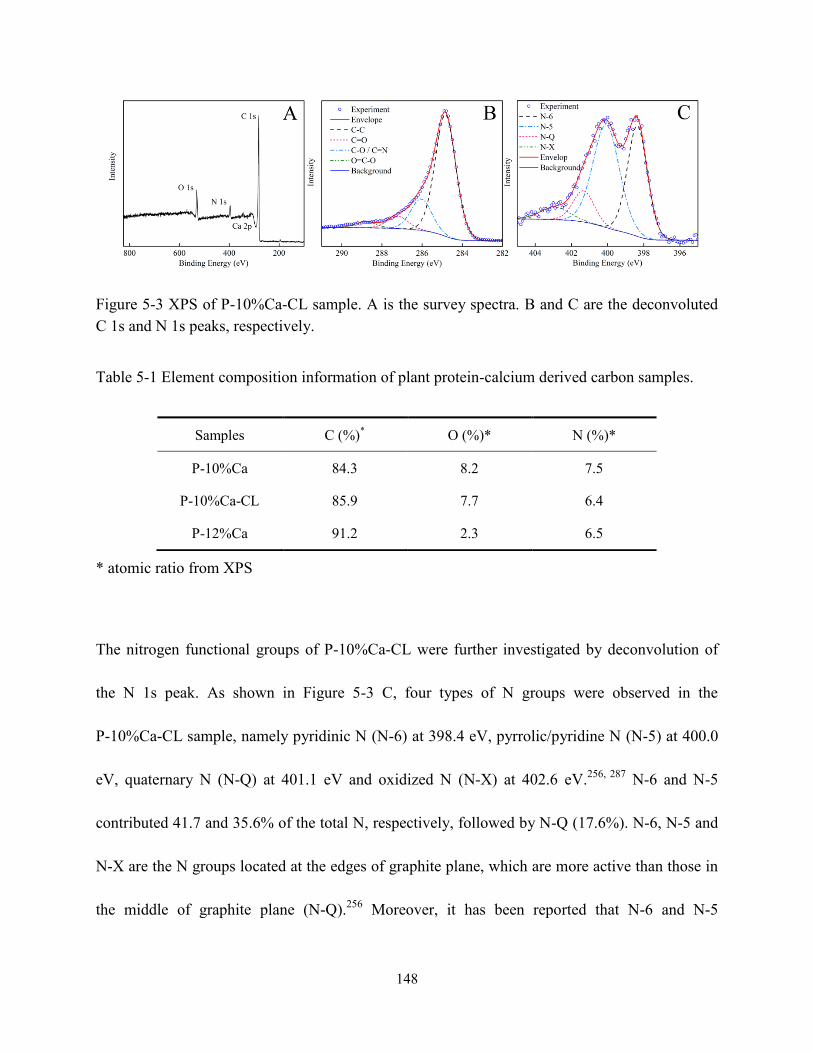
148
Figure 5-3 XPS of P-10%Ca-CL sample. A is the survey spectra. B and C are the deconvoluted
C 1s and N 1s peaks, respectively.
Table 5-1 Element composition information of plant protein-calcium derived carbon samples.
* atomic ratio from XPS
The nitrogen functional groups of P-10%Ca-CL were further investigated by deconvolution of
the N 1s peak. As shown in Figure 5-3 C, four types of N groups were observed in the
P-10%Ca-CL sample, namely pyridinic N (N-6) at 398.4 eV, pyrrolic/pyridine N (N-5) at 400.0
eV, quaternary N (N-Q) at 401.1 eV and oxidized N (N-X) at 402.6 eV.256, 287
N-6 and N-5
contributed 41.7 and 35.6% of the total N, respectively, followed by N-Q (17.6%). N-6, N-5 and
N-X are the N groups located at the edges of graphite plane, which are more active than those in
the middle of graphite plane (N-Q).256
Moreover, it has been reported that N-6 and N-5
Samples C (%)*
O (%)* N (%)*
P-10%Ca 84.3 8.2 7.5
P-10%Ca-CL 85.9 7.7 6.4
P-12%Ca 91.2 2.3 6.5
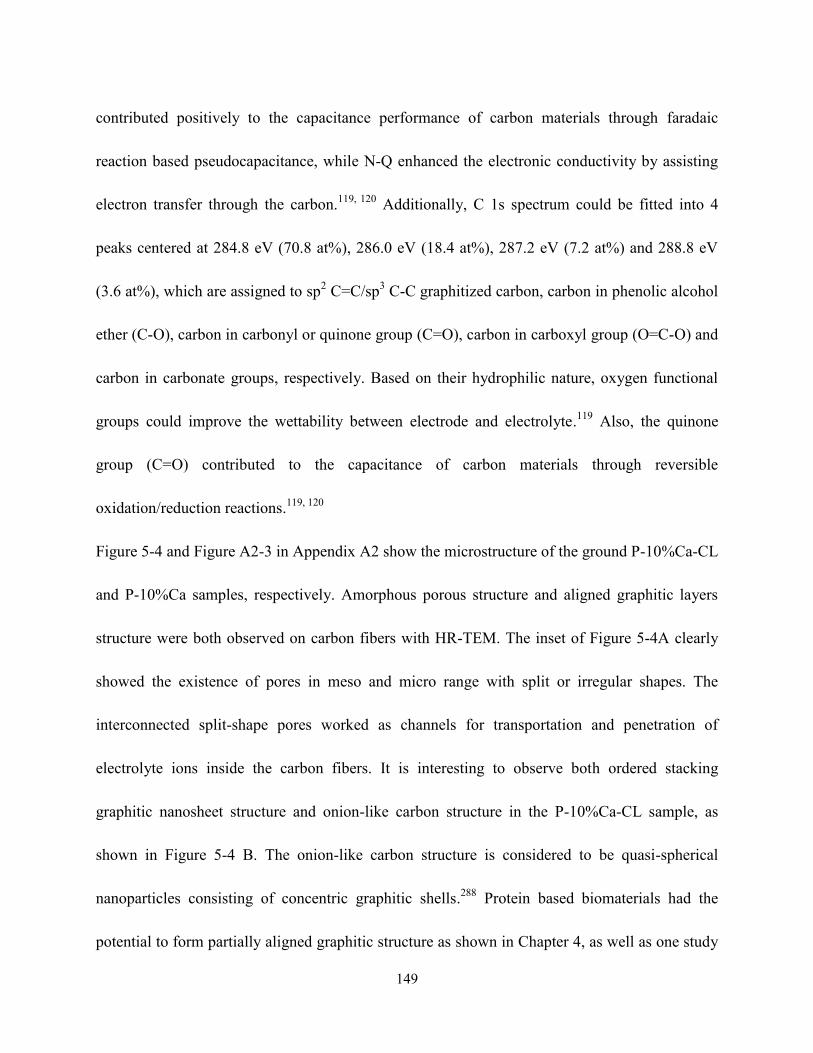
149
contributed positively to the capacitance performance of carbon materials through faradaic
reaction based pseudocapacitance, while N-Q enhanced the electronic conductivity by assisting
electron transfer through the carbon.119, 120
Additionally, C 1s spectrum could be fitted into 4
peaks centered at 284.8 eV (70.8 at%), 286.0 eV (18.4 at%), 287.2 eV (7.2 at%) and 288.8 eV
(3.6 at%), which are assigned to sp2 C=C/sp
3 C-C graphitized carbon, carbon in phenolic alcohol
ether (C-O), carbon in carbonyl or quinone group (C=O), carbon in carboxyl group (O=C-O) and
carbon in carbonate groups, respectively. Based on their hydrophilic nature, oxygen functional
groups could improve the wettability between electrode and electrolyte.119
Also, the quinone
group (C=O) contributed to the capacitance of carbon materials through reversible
oxidation/reduction reactions.119, 120
Figure 5-4 and Figure A2-3 in Appendix A2 show the microstructure of the ground P-10%Ca-CL
and P-10%Ca samples, respectively. Amorphous porous structure and aligned graphitic layers
structure were both observed on carbon fibers with HR-TEM. The inset of Figure 5-4A clearly
showed the existence of pores in meso and micro range with split or irregular shapes. The
interconnected split-shape pores worked as channels for transportation and penetration of
electrolyte ions inside the carbon fibers. It is interesting to observe both ordered stacking
graphitic nanosheet structure and onion-like carbon structure in the P-10%Ca-CL sample, as
shown in Figure 5-4 B. The onion-like carbon structure is considered to be quasi-spherical
nanoparticles consisting of concentric graphitic shells.288
Protein based biomaterials had the
potential to form partially aligned graphitic structure as shown in Chapter 4, as well as one study
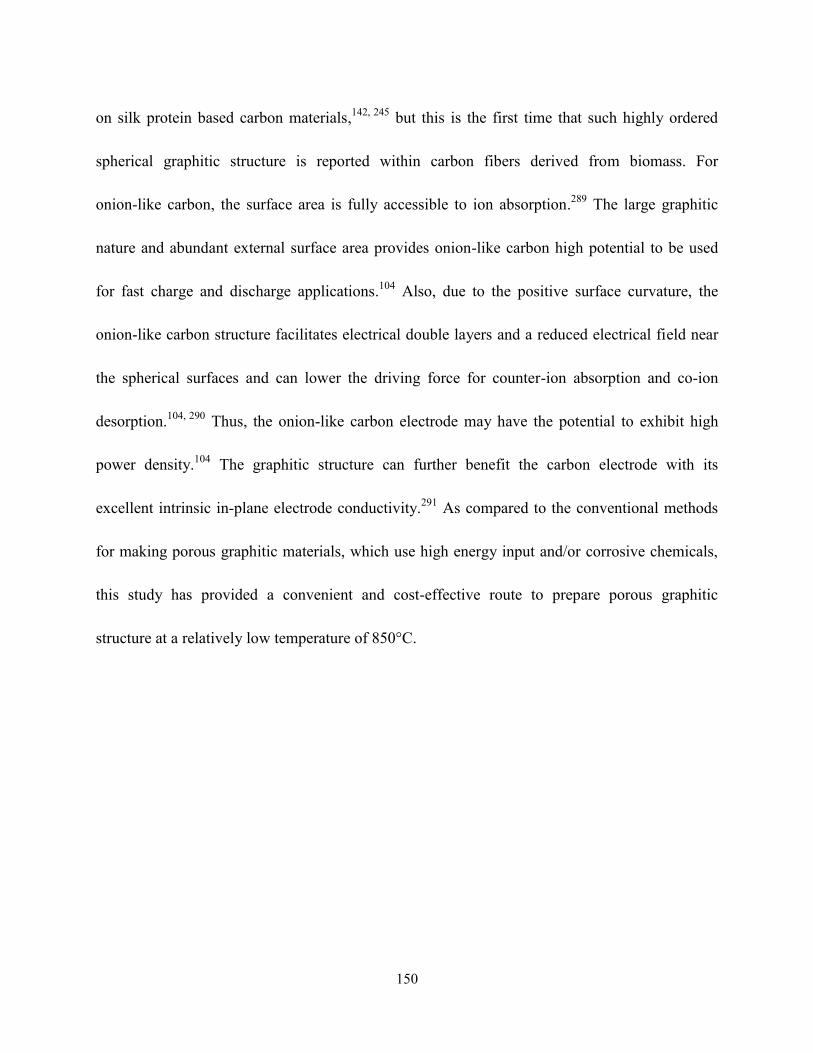
150
on silk protein based carbon materials,142, 245
but this is the first time that such highly ordered
spherical graphitic structure is reported within carbon fibers derived from biomass. For
onion-like carbon, the surface area is fully accessible to ion absorption.289
The large graphitic
nature and abundant external surface area provides onion-like carbon high potential to be used
for fast charge and discharge applications.104
Also, due to the positive surface curvature, the
onion-like carbon structure facilitates electrical double layers and a reduced electrical field near
the spherical surfaces and can lower the driving force for counter-ion absorption and co-ion
desorption.104, 290
Thus, the onion-like carbon electrode may have the potential to exhibit high
power density.104
The graphitic structure can further benefit the carbon electrode with its
excellent intrinsic in-plane electrode conductivity.291
As compared to the conventional methods
for making porous graphitic materials, which use high energy input and/or corrosive chemicals,
this study has provided a convenient and cost-effective route to prepare porous graphitic
structure at a relatively low temperature of 850°C.

151
Figure 5-4 TEM images of ground P-10%Ca-CL carbon nanofibers of different magnifications.
Inset of Figure 5-4 A is the magnified image of the selected area.
Figure 5-5 shows the X-ray powder diffraction (XRD) patterns and Raman spectra of the
P-10%Ca-CL carbon sample. Both results provided support to the conclusion that the graphitic
structure existed in the P-10%Ca-CL sample. Two major peaks were observed on the XRD
pattern (Figure 5-5 A). The peak centered at a 2 of 24.3° was assigned to the (002) plane of
graphite, while the peak at about 44.0° corresponded to the (100) crystal plane.130, 292
Based on
the of (002) plane, the layer-to-layer distance (d-spacing) between bent graphitic layers was
calculated by the following equation:
d002 = sin
ere, is the wavelength of X-ray used in experiments. Thus, the d002 of the graphitic layers in
P-10%Ca-CL is 0.37 nm, which is slightly higher than that of natural graphitic carbon lattice at
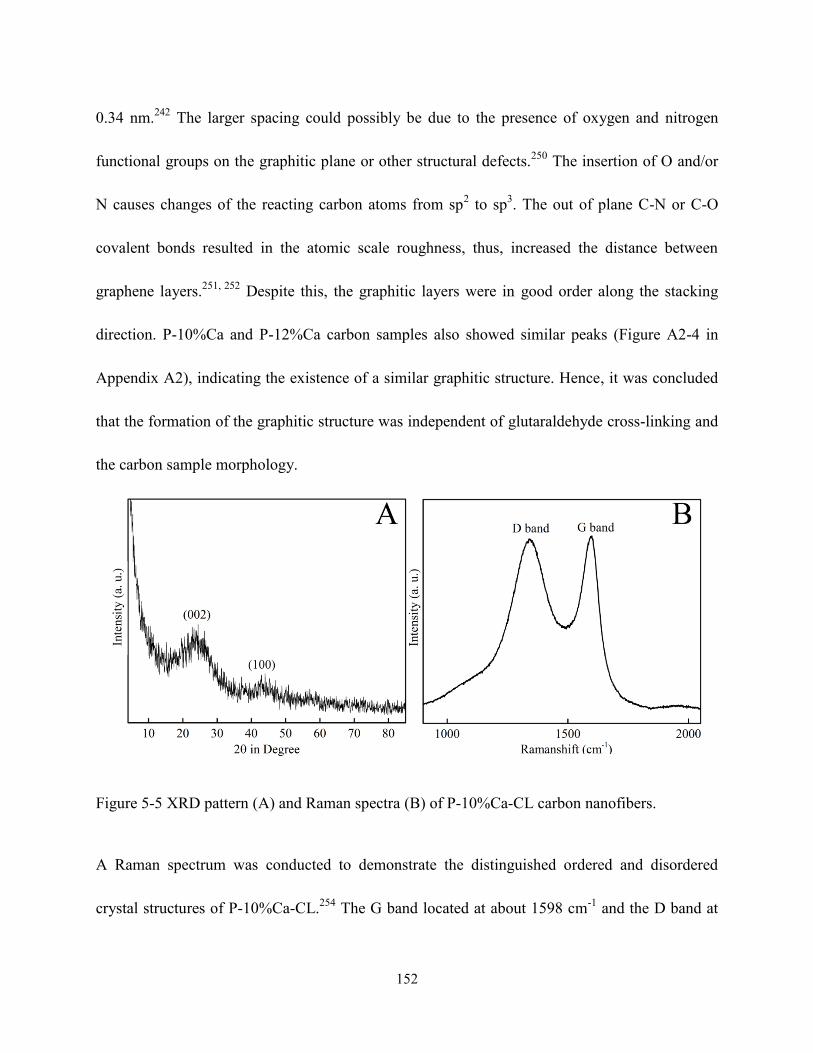
152
0.34 nm.242
The larger spacing could possibly be due to the presence of oxygen and nitrogen
functional groups on the graphitic plane or other structural defects.250
The insertion of O and/or
N causes changes of the reacting carbon atoms from sp2 to sp
3. The out of plane C-N or C-O
covalent bonds resulted in the atomic scale roughness, thus, increased the distance between
graphene layers.251, 252
Despite this, the graphitic layers were in good order along the stacking
direction. P-10%Ca and P-12%Ca carbon samples also showed similar peaks (Figure A2-4 in
Appendix A2), indicating the existence of a similar graphitic structure. Hence, it was concluded
that the formation of the graphitic structure was independent of glutaraldehyde cross-linking and
the carbon sample morphology.
Figure 5-5 XRD pattern (A) and Raman spectra (B) of P-10%Ca-CL carbon nanofibers.
A Raman spectrum was conducted to demonstrate the distinguished ordered and disordered
crystal structures of P-10%Ca-CL.254
The G band located at about 1598 cm-1
and the D band at
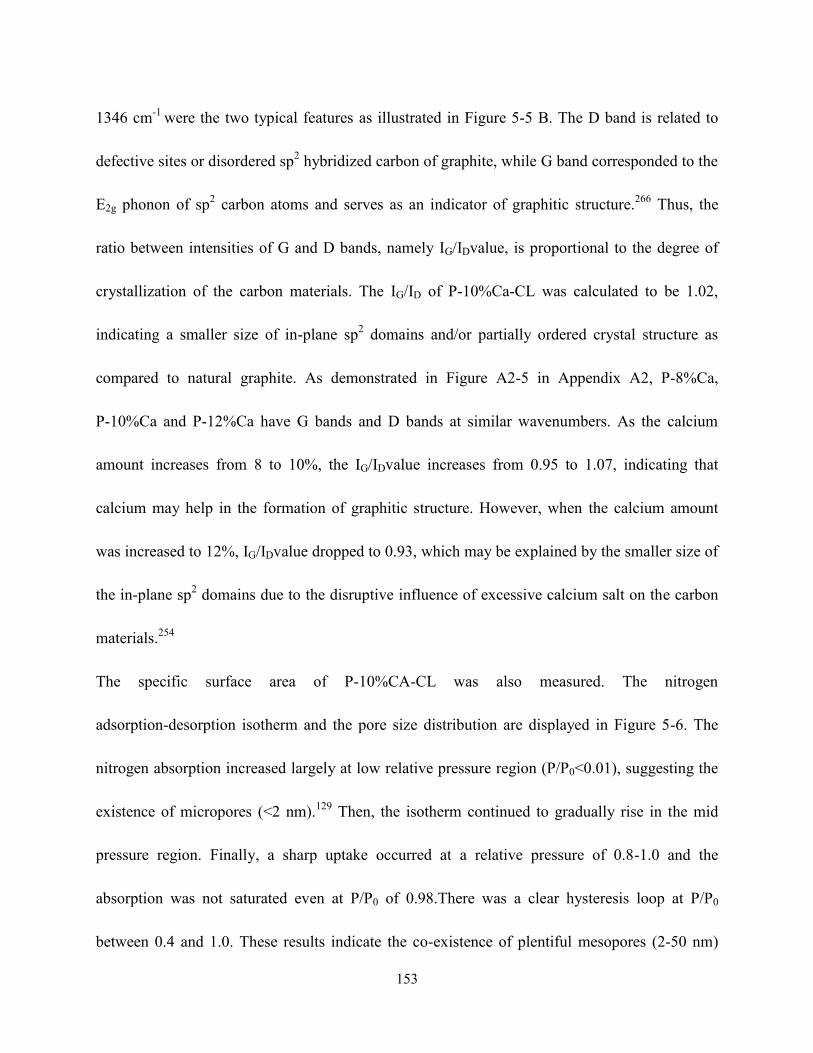
153
1346 cm-1
were the two typical features as illustrated in Figure 5-5 B. The D band is related to
defective sites or disordered sp2 hybridized carbon of graphite, while G band corresponded to the
E2g phonon of sp2 carbon atoms and serves as an indicator of graphitic structure.
266 Thus, the
ratio between intensities of G and D bands, namely IG/IDvalue, is proportional to the degree of
crystallization of the carbon materials. The IG/ID of P-10%Ca-CL was calculated to be 1.02,
indicating a smaller size of in-plane sp2 domains and/or partially ordered crystal structure as
compared to natural graphite. As demonstrated in Figure A2-5 in Appendix A2, P-8%Ca,
P-10%Ca and P-12%Ca have G bands and D bands at similar wavenumbers. As the calcium
amount increases from 8 to 10%, the IG/IDvalue increases from 0.95 to 1.07, indicating that
calcium may help in the formation of graphitic structure. However, when the calcium amount
was increased to 12%, IG/IDvalue dropped to 0.93, which may be explained by the smaller size of
the in-plane sp2 domains due to the disruptive influence of excessive calcium salt on the carbon
materials.254
The specific surface area of P-10%CA-CL was also measured. The nitrogen
adsorption-desorption isotherm and the pore size distribution are displayed in Figure 5-6. The
nitrogen absorption increased largely at low relative pressure region (P/P0<0.01), suggesting the
existence of micropores (<2 nm).129
Then, the isotherm continued to gradually rise in the mid
pressure region. Finally, a sharp uptake occurred at a relative pressure of 0.8-1.0 and the
absorption was not saturated even at P/P0 of 0.98.There was a clear hysteresis loop at P/P0
between 0.4 and 1.0. These results indicate the co-existence of plentiful mesopores (2-50 nm)
154
and macropores (>50 nm) in the fiber matrices.141
The hysteresis loop is correlated to the
capillary condensation in the mesopore structures136, 249
and the shape of the hysteresis loop is
associated with the specific pore structures.249
Since the adsorption and desorption branches were
parallel to each other from 0.4 to 0.8, the hysteresis loop of P-10%Ca-CL was considered to be
Type H3, which is usually observed for samples with slit-shaped pores based on aggregates of
plate-like particles.249
The specific surface area of P-10%Ca-CL was 348.4 m2/g as calculated by
the Brunauer-Emmett-Teller (BET) method. The total volume was about 1.73 cm3/g according to
the maximum amount absorbed at P/P0 of 0.98. The average pore diameter was around 9.9 nm.
The specific surface area of P-10%Ca-CL nanofibers is comparable to some carbon nanofibers
such as the carbon fibers made from lignin131
and carbon fibers made from polyacrylonitrile271
,
but smaller than those of active carbons (on the order of 1000 m2/g).
102 This may be due to the
formation of granular like graphitic structure. It is known that graphitization could reduce the
specific surface area of carbon materials dramatically.289, 293
The pore size distribution was
analyzed based on the desorption branch of the isotherm by the Barrett-Joyner-Halenda (BJH)
method. In the micropore region, a sharp peak is located at round 1.9 nm followed by a smaller
peak at 8.7 nm in the mesopore region. The macropores formed by the interlaced fibers was too
large to be calculated by this model. This result is in agreement with the observations based on
SEM and TEM images, confirming that P-10%Ca-CL has well developed hierarchical pore
structures at micro, meso and macro range. This hierarchical pore structure can enhance the
supercapacitance performance since micro and mesopores provide high accessible surface area
155
for larger capacitance, while interconnected meso and micropores facilitate ion transport to
ensure high rate capability and power density.117
Figure 5-6 Nitrogen adsorption and desorption isotherm and pore size distribution (inset) of
P-10%Ca-CL.
5.3.4 Electrochemical properties
The electrochemical properties of the carbon samples were evaluated in 6 M KOH to test their
performance as supercapacitor electrode materials. Figure 5-7A shows the cyclic voltammetry
(CV) curves of carbon samples prepared with different amounts of calcium. CV curves of all five
samples at a scan rate of 50 mV/s are in quasi-rectangular shape, indicating a double-layer
capacitor nature of the charge-discharge process.122
Also, broadened humps were observed on
the CV curves of all the samples, which are considered to be caused by the redox reactions of
various oxygen and nitrogen functional groups.294
When the Ca2+
was increased from 4 to 10%,
the specific current increased. This phenomenon could be explained in two ways: firstly, a larger
amount of calcium salt led to a greater degree of activation during carbonization; secondly,

156
P-4%Ca did not maintain fibrous structures after carbonization, while P-10%Ca possessed a
well-developed nano-fibrous structure, which permitted a greater specific surface area and
hierarchical porous structure. The interconnected macropores and 3D fibrous structure of
P-10%Ca facilitated the penetration and transport of electrolyte ions. On the other hand, the
capacitance of P-4%Ca was limited by the poor accessibility of electrolyte ions to the pores
inside the carbon. At a scan rate of 50 mV/s, P-10%Ca-CL showed the greatest specific current
among all 5 carbon samples, attributed to a large ion-accessible specific surface area, a large
amount of heteroatoms and interconnected nanofiber network. The CV curves of P-10%Ca-CL
obtained at different scan rates are shown in Figure 5-7 B. The current density increased with the
scan rate. The quasi-rectangular shape of the CV curve was maintained even at scan rates as high
as 150 mV/s without distortion, which is associated to the rapid ion transport pathway formed by
plentiful meso and macropores.
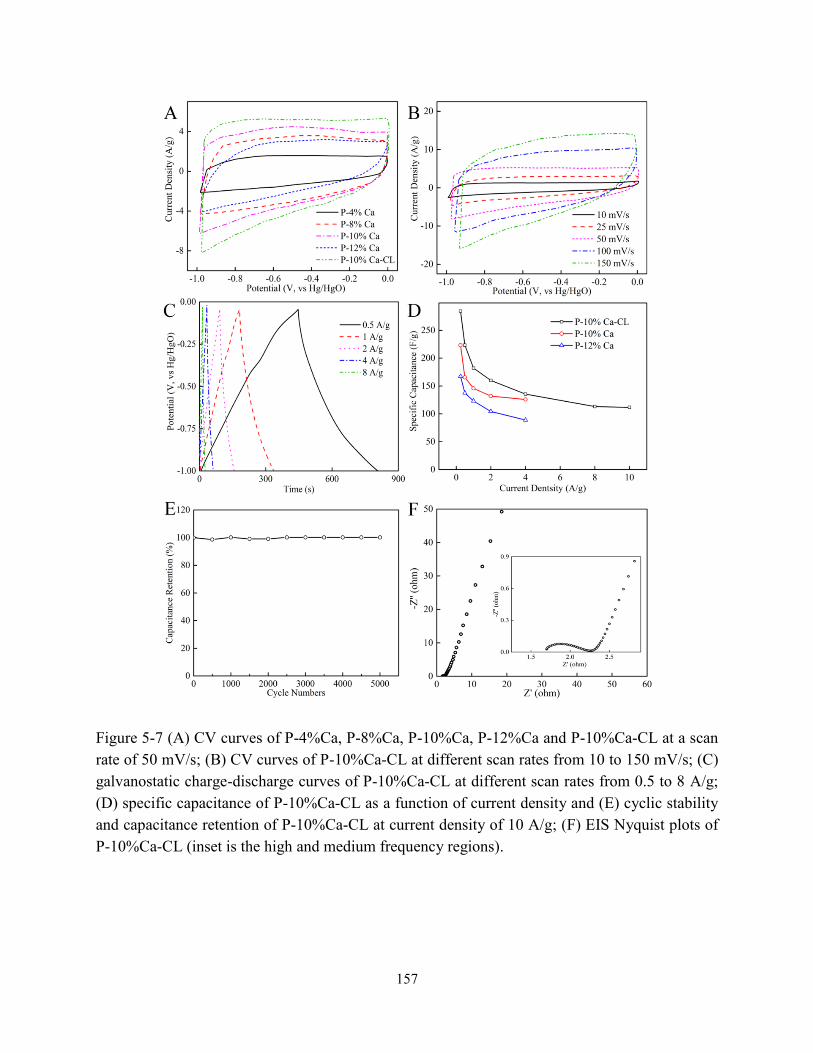
157
Figure 5-7 (A) CV curves of P-4%Ca, P-8%Ca, P-10%Ca, P-12%Ca and P-10%Ca-CL at a scan
rate of 50 mV/s; (B) CV curves of P-10%Ca-CL at different scan rates from 10 to 150 mV/s; (C)
galvanostatic charge-discharge curves of P-10%Ca-CL at different scan rates from 0.5 to 8 A/g;
(D) specific capacitance of P-10%Ca-CL as a function of current density and (E) cyclic stability
and capacitance retention of P-10%Ca-CL at current density of 10 A/g; (F) EIS Nyquist plots of
P-10%Ca-CL (inset is the high and medium frequency regions).
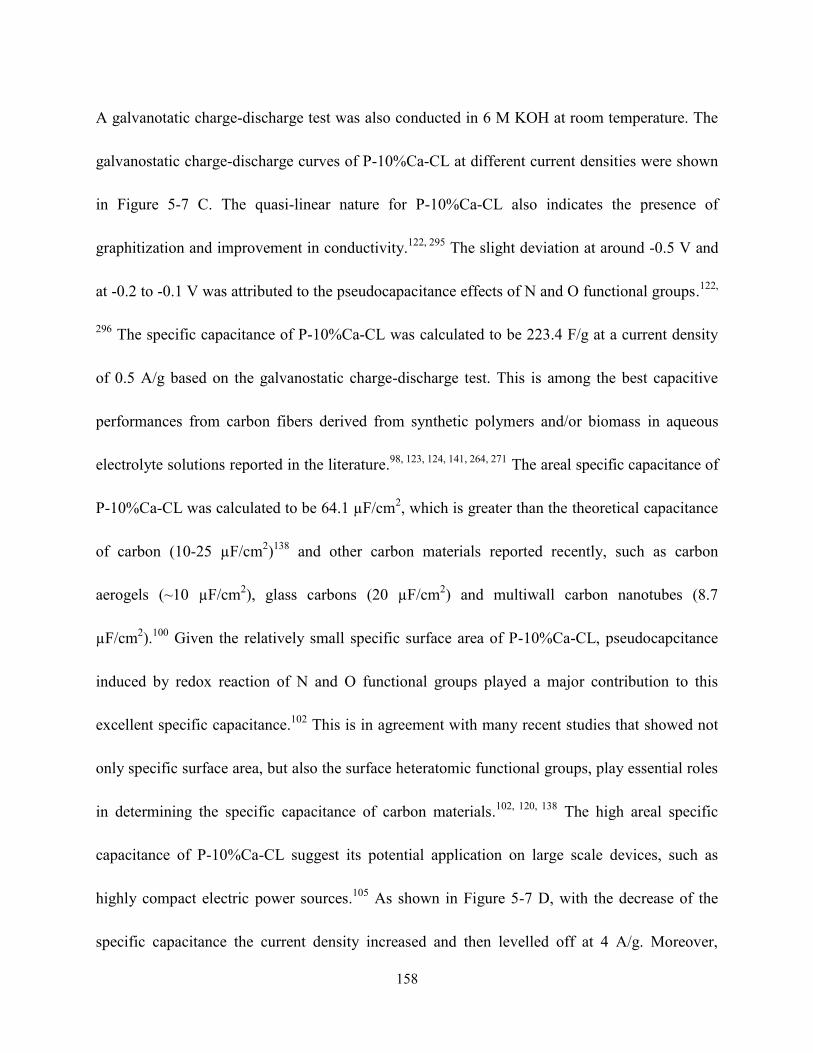
158
A galvanotatic charge-discharge test was also conducted in 6 M KOH at room temperature. The
galvanostatic charge-discharge curves of P-10%Ca-CL at different current densities were shown
in Figure 5-7 C. The quasi-linear nature for P-10%Ca-CL also indicates the presence of
graphitization and improvement in conductivity.122, 295
The slight deviation at around -0.5 V and
at -0.2 to -0.1 V was attributed to the pseudocapacitance effects of N and O functional groups.122,
296 The specific capacitance of P-10%Ca-CL was calculated to be 223.4 F/g at a current density
of 0.5 A/g based on the galvanostatic charge-discharge test. This is among the best capacitive
performances from carbon fibers derived from synthetic polymers and/or biomass in aqueous
electrolyte solutions reported in the literature.98, 123, 124, 141, 264, 271
The areal specific capacitance of
P-10%Ca-CL was calculated to be 64.1 µF/cm2, which is greater than the theoretical capacitance
of carbon (10-25 µF/cm2)138
and other carbon materials reported recently, such as carbon
aerogels (~10 µF/cm2), glass carbons (20 µF/cm
2) and multiwall carbon nanotubes (8.7
µF/cm2).
100 Given the relatively small specific surface area of P-10%Ca-CL, pseudocapcitance
induced by redox reaction of N and O functional groups played a major contribution to this
excellent specific capacitance.102
This is in agreement with many recent studies that showed not
only specific surface area, but also the surface heteratomic functional groups, play essential roles
in determining the specific capacitance of carbon materials.102, 120, 138
The high areal specific
capacitance of P-10%Ca-CL suggest its potential application on large scale devices, such as
highly compact electric power sources.105
As shown in Figure 5-7 D, with the decrease of the
specific capacitance the current density increased and then levelled off at 4 A/g. Moreover,
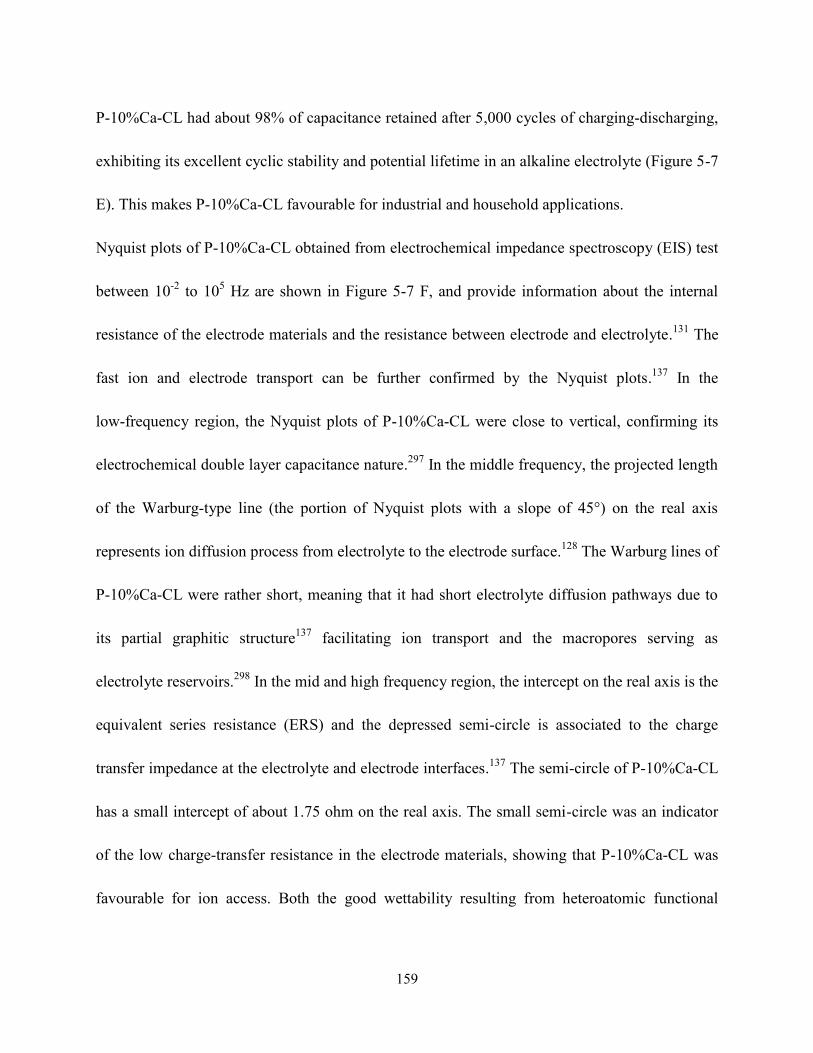
159
P-10%Ca-CL had about 98% of capacitance retained after 5,000 cycles of charging-discharging,
exhibiting its excellent cyclic stability and potential lifetime in an alkaline electrolyte (Figure 5-7
E). This makes P-10%Ca-CL favourable for industrial and household applications.
Nyquist plots of P-10%Ca-CL obtained from electrochemical impedance spectroscopy (EIS) test
between 10-2
to 105 Hz are shown in Figure 5-7 F, and provide information about the internal
resistance of the electrode materials and the resistance between electrode and electrolyte.131
The
fast ion and electrode transport can be further confirmed by the Nyquist plots.137
In the
low-frequency region, the Nyquist plots of P-10%Ca-CL were close to vertical, confirming its
electrochemical double layer capacitance nature.297
In the middle frequency, the projected length
of the Warburg-type line (the portion of Nyquist plots with a slope of 45°) on the real axis
represents ion diffusion process from electrolyte to the electrode surface.128
The Warburg lines of
P-10%Ca-CL were rather short, meaning that it had short electrolyte diffusion pathways due to
its partial graphitic structure137
facilitating ion transport and the macropores serving as
electrolyte reservoirs.298
In the mid and high frequency region, the intercept on the real axis is the
equivalent series resistance (ERS) and the depressed semi-circle is associated to the charge
transfer impedance at the electrolyte and electrode interfaces.137
The semi-circle of P-10%Ca-CL
has a small intercept of about 1.75 ohm on the real axis. The small semi-circle was an indicator
of the low charge-transfer resistance in the electrode materials, showing that P-10%Ca-CL was
favourable for ion access. Both the good wettability resulting from heteroatomic functional
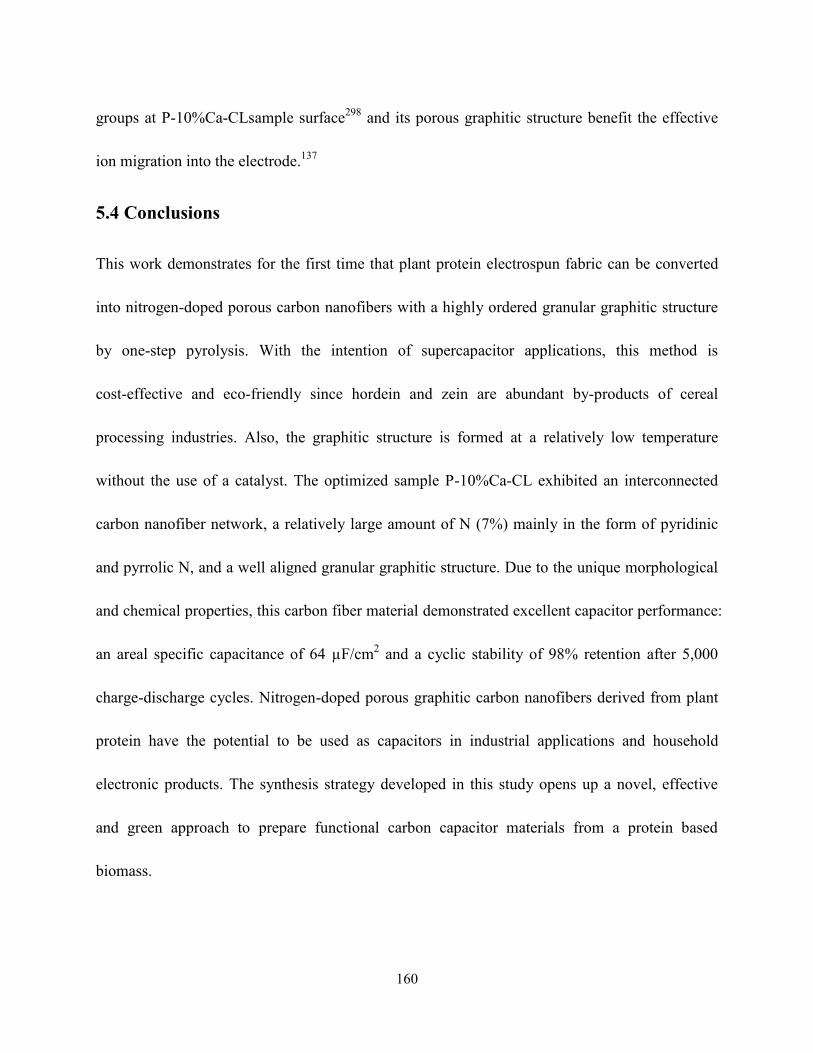
160
groups at P-10%Ca-CLsample surface298
and its porous graphitic structure benefit the effective
ion migration into the electrode.137
5.4 Conclusions
This work demonstrates for the first time that plant protein electrospun fabric can be converted
into nitrogen-doped porous carbon nanofibers with a highly ordered granular graphitic structure
by one-step pyrolysis. With the intention of supercapacitor applications, this method is
cost-effective and eco-friendly since hordein and zein are abundant by-products of cereal
processing industries. Also, the graphitic structure is formed at a relatively low temperature
without the use of a catalyst. The optimized sample P-10%Ca-CL exhibited an interconnected
carbon nanofiber network, a relatively large amount of N (7%) mainly in the form of pyridinic
and pyrrolic N, and a well aligned granular graphitic structure. Due to the unique morphological
and chemical properties, this carbon fiber material demonstrated excellent capacitor performance:
an areal specific capacitance of 64 µF/cm2 and a cyclic stability of 98% retention after 5,000
charge-discharge cycles. Nitrogen-doped porous graphitic carbon nanofibers derived from plant
protein have the potential to be used as capacitors in industrial applications and household
electronic products. The synthesis strategy developed in this study opens up a novel, effective
and green approach to prepare functional carbon capacitor materials from a protein based
biomass.

161
Chapter 6
Final Remarks
6.1 Summary and conclusions
Barley is the fourth most important crop around the world and contains 8-15% protein in the
dried grain. However, the utilization of barley is limited to feed and malt industries. Studies on
barley protein applications are far from sufficient. In this PhD research program, the interfacial
behaviour of barley proteins was systematically investigated (Objective 1, Chapter 2). Grounded
on the generated knowledge, barley protein based nanoparticles were successfully developed
(Objective 2, Chapter 3). To further explore value-added application opportunities, barley
protein based electrospun fibers were converted to carbon fiber network as energy storage
materials for the first time (Objectives 3&4, Chapters 4&5). This section highlights the findings
and conclusions made in each study.
6.1.1 Conclusions of study 1
Interfacial property is one of the most important functionalities of food proteins. Though the
foaming, emulsifying and encapsulating capabilities of barley proteins were presented in some
previous studies, interfacial properties of barley proteins were not clear yet. Thus, study 1
investigated the behaviour of barley proteins at the interface. B-hordein was selected to be a
representative of barley proteins in this fundamental work since hordein was the largest
component of barley proteins and B-hordein was the major fraction of hordein. The results
162
revealed that B-hordein adsorbed to the air-water interface rapidly and 1 mg/mL B-hordein
solution was able to reduce the surface tension to ~45 mN/m within 2 h. As shown by the
interfacial dilatation and shear rheology, B-hordein molecules formed a solid-like film at the
interface. With longer aging time, the B-hordein interfacial network became stiffer and more
elastic. The result obtained from Longmuir-Blodgett trough revealed that B-hordein molecules
changed from expanded liquid to solid-like phase without collapse when the surface pressure
was increased to 30 mN/s, which was interesting as compared to many other hydrophilic food
proteins reported in the literature. Also, polarization modulation-infrared reflection absorption
spectroscopy (PM-IRRAS) showed that B-hordein molecules tilted their hydrophobic repetitive
region away from the aqueous phase toward air phase upon continuous compression. The
intermolecular β-sheets developed upon compression might contribute to the formation of the
highly elastic B-hordein film at the interface. Finally, the in situ pepsin digestion test showed
that the B-hordein film formed at 30 mN/s was resistant to gastric environment degradation,
which might be attributed to the hydrophobic region being hidden from the aqueous phase
through protein conformation and orientation changes as mentioned above. Overall, the
fundamental knowledge of study 1 demonstrated that B-hordein had excellent interfacial
properties and had potential to be used to stabilize emulsions and encapsulations with
controllable gastric digestibility. Thus, barley proteins can be utilized in many applications such
as small intestine targeted delivery system of bioactive compounds.
163
6.1.2 Conclusions of study 2
Based on the interfacial properties of B-hordein and its resistance to the gastric environment,
barley protein based nanoparticles were successfully developed at ambient temperature without
the addition of organic solvent and surfactant in study 2 as a delivery system for lipophilic
bioactive compounds. Canola oil with 0.05% (w/v) β-carotene was used as the lipid phase to be
encapsulated in the coating of barley proteins. The lipid phase was mixed with aqueous protein
suspension to prepare a coarse emulsion, followed by passing it through high pressure
homogenization to form solid nanoparticles. The optimized nanoparticles had regular spherical
shape, smooth surface, small size of 90-150 nm, narrow size distribution (PDI<0.3) and high
zeta-potential of -35 mV. The influences of processing pressure, number of recirculation and
formulation on particle size and size distribution were investigated. With increasing circulation
times and pressure, particle size decreased and size distribution became narrow. Increasing the
pressure above 16,000 psi, particle size increased significantly due to ‗over-processing‘
phenomenon. When oil-to-protein ratio was increased, mean particle size increased. Stable
nanoparticle suspension could be obtained at a protein concentration of up to 5% when the
oil-to-protein ratio was maintained within 1 to 1.5. Release test showed that the bulk protein
coating was degraded in SGF, but a thin layer of barley protein covering the oil-droplet surface
was resistant to pepsin digestion. Complete release of the oil phase occurred in SIF. In vitro test
164
exhibited that barley protein based nanoparticles had low cytotoxicity and could be internalized
by Caco-2 cells.
6.1.3 Conclusions of study 3
Electrospinnability is another important functionality of hordein. In study 3, hordein/zein based
electrospun nanofibers were prepared in the presence of lignin, which were then converted into
carbon fibers by carbonization and CO2 activation. The influences of protein-lignin ratio and
carbonization temperature on the morphology of carbon products were investigated. The optimal
carbon sample (L5P5-900-ACT) with hierarchical pores and interconnected carbon fiber network
was prepared with protein-lignin ratio of 50:50 at 900 °C, followed by CO2 activation at 800°C
for 3 h. Nitrogen adsorption-desorption isotherm showed that the specific surface area of
L5P5-900-ACT was 771.5 m2/g. Macro, meso and micropores coexisted on the fiber. The
interconnected large macropores formed by interlaced fiber as well as the macro and mesopores
on the fiber surface facilitated the transport of electrolyte ions. The meso and micropores
endowed fibers high specific surface area and high capacitance. L5P5-900-ACT had 4% nitrogen
atoms, which are mainly pyridinic and pyrrolic nitrogen. Nitrogen functional groups can enhance
carbon fiber capacitance through faradaic reactions. TEM, XRD pattern and Raman spectrum
confirmed the existence of graphene-like nanosheet structure on the L5P5-900-ACT carbon fiber.
Electrochemical tests demonstrated that L5P5-900-ACT had excellent capacitance of 240 F/g
and 31.2 µF/cm2 in 6 M KOH at 0.25 A/g. L5P5-900-ACT also showed good conductivity and
165
high cyclic stability with 95% retention after 5,500 charge-discharge cycle. L5P5-900-ACT had
potential to be used as electrode material for supercapacitors.
6.1.4 Conclusions of study 4
In study 4, a facile and green one-step pyrolysis method was developed to prepare
nitrogen-doped porous graphitic carbon nanofibers from plant protein (hordein and zein)
electrospun fabrics. Calcium acetate was added to the electrospinning dope to modulate the
diameter of electrospun fibers. When Ca2+
was increased from 4 to 10%, the fiber diameter
decreased from 992 to 413 nm. The carbon sample prepared with 18% protein and 10% Ca2+
exhibited a homogeneous, smooth and flexible fiber structure. The optimized sample
P-10%Ca-CL had 6.4% of nitrogen, which was higher than the nitrogen content of carbon
materials made from other biomass reported in the literature. Well aligned stacking graphitic
nanosheet structure and onion-like carbon structure were observed in the P-10%Ca-CL carbon
sample. This is the first time that such highly ordered granule-like graphitic structure was found
within carbon fibers derived from biomaterials. Due to these morphological and chemical
features, the carbon fiber sample demonstrated ultrahigh areal specific capacitance of 64 µF/cm2
and excellent cyclic stability of 98% retention after 5,000 charge-discharge cycles. The approach
developed in this study provided a convenient and environmentally friendly way to prepare
porous graphitic carbon fibers from renewable biomaterials.

166
6.2 Significance of this work
There is a growing market demand on products made from biomaterials which are renewable,
biocompatible and biodegradable. Based on the large production of barley, barley proteins are
abundant and affordable biomaterials. However, the value of barley proteins has been
underestimated and their utilization is still not fully explored, which might be due to the
insufficient fundamental knowledge available on barley protein.
This PhD research is the first to investigate the interfacial properties of barley proteins
systematically at molecular level. By employing B-hordein as a model protein, this study
demonstrated how conformation and orientation changes of protein molecules at the interface
upon compression influenced the digestibility of the protein network. Fundamental knowledge
gained from this study helps the rational design of barley protein based functional food and
delivery systems for bioactive compounds. Grounded on this, barley protein based nanoparticles
were successfully prepared through high pressure homogenization as delivery systems to
improve the bioavailability of lipophilic nutraceuticals, which significantly extended the
applications of barley protein to food and pharmaceutical area. Also, this finding deepened our
understanding on protein-based emulsion digestion, guiding us towards improved control of
dietary intake.
Moreover, this work is the first to report that protein based electrospun fibers can be successfully
converted into carbon nanofibers. Carbon fibers either derived from protein-lignin or
167
protein-Ca2+
fibers showed excellent capacitance and cyclic stability, which made them
promising to be used as electrode materials. These findings opened up new applications of barley
proteins in high technology area, such as energy storage systems and power management. It is
also a part of the research effort to develop electrical devices from renewable and green
biomaterials.
Overall, results obtained in this work provide brand new applications of barley proteins, which
can broaden the application of barley and commercially benefit the Canadian barley producers
and processors.
6.3 Recommendations for future work
This PhD research brings up some interesting ideas which may be valuable for future studies.
Here, a few possible points are listed.
(1) This study systematically investigated the interfacial properties of barley proteins at model
air-water interface. It is also necessary to confirm these finding at an oil-water interface. The in
situ digestion test was conducted in a simulated gastric environment. The influences of intestinal
conditions, such as bile salts, pH and enzymes, on the protein interfacial network are still not
clear yet. This gap should be filled in the near future to direct us for rational design of
protein-based emulsion with desired digestibility.
(2) Barley protein based nanoparticles have been successfully prepared in this work at lab scale.
The potential of using barley protein nanoparticles as delivery system has been preliminarily
168
proven. However, pilot scale experiments are needed to optimize the processing conditions
before barley protein nanoparticles can be used at industrial scale. Also, barley protein
nanoparticles showed good storage stability in this study. It is interesting to test the compatibility
of barley protein nanoparticles with various real food systems, such as milk, juice, snacks etc.
Also, the influence of the addition of barley protein nanoparticles on the food sensory properties
are necessary to be explored. Sequential in vivo tests are needed to evaluate the bioavailability of
the encapsulated nutraceuticals and confirm the safety of the barley protein nanoparticles.
(3)Carbon fibers derived from plant proteins (hordein and zein) were observed to have highly
ordered graphene-like nanosheet or granule-like graphitic structure. This finding is very valuable
since graphene endows carbon materials some useful features, such as good electrical
conductivity. This graphitic structure was formed at a relatively low temperature (<1000°C)
without catalysis. This may be related to the secondary structures of protein. However, the
detailed mechanism is far from clear.
(4) It was exciting to find that Ca2+
can facilitate the conversion of protein fibers to carbon fibers.
More efforts are needed to fabricate this flexible carbon fiber mat into novel devices, such as
supercapacitor, sensors, electronic devices, artificial scaffolds and smart textiles.

169
References
1. Mohamed, A.; Hojilla-Evangelista, M. P.; Peterson, S. C.; Biresaw, G. Barley protein
isolate: Thermal, functional, rheological, and surface properties. J. Am. Oil Chem. Soc.
2007, 84, 281-288.
2. Jadhav, S. J.; Lutz, S. E.; Ghorpade, V. M.; Salunkhe, D. K. Barley: Chemistry and
value-added processing. Crit. Rev. Food Sci. Nutr. 1998, 38, 123-171.
3. Izydorczyk, M. S.; Dexter, J. E. Barley beta-glucans and arabinoxylans: Molecular
structure, physicochemical properties, and uses in food products-a review. Food Res. Int.
2008, 41, 850-868.
4. Wood, P. J. Cereal beta-glucans in diet and health. J. Cereal Sci. 2007, 46, 230-238.
5. Finnie, C.; Svensson, B. Barley seed proteomics from spots to structures. J. Proteomics
2009, 72, 315-324.
6. Fukushima, D. Structures of plant storage proteins and their functions. Food Rev. Int.
1991, 7, 353-381.
7. Celus, I.; Brijs, K.; Delcour, J. A. The effects of malting and mashing on barley protein
extractability. J. Cereal Sci. 2006, 44, 203-211.
8. Anderson, O. D.; Scoles, G. J. The B-hordein prolamin family of barley. Genome 2013,
56, 179-185.
9. Linko, R.; Lapveteläinen, A.; Laakso, P.; Kallio, H. Protein composition of a high-protein
barley flour and barley grain. Cereal Chem. 1989, 66, 478-482.
10. Lange, M.; Vincze, E.; Wieser, H.; Schjoerring, J. K.; Holm, P. B. Suppression of
C-hordein synthesis in barley by antisense constructs results in a more balanced amino
acid composition. J. Agric. Food Chem. 2007, 55, 6074-6081.
11. Williamson, M. P. The structure and function of proline-rich regions in proteins. Biochem.
J. 1994, 297, 249.
12. Burley, S. K.; Petsko, G. A. Aromatic-aromatic interaction: a mechanism of protein
structure stabilization. Science 1985, 229, 23-28.
13. Tatham, A. S.; Drake, A. F.; Shewry, P. R. A conformational study of a glutamine-and
proline-rich cereal seed protein, C hordein. Biochem. J. 1985, 226, 557.
170
14. Tatham, A. S.; Shewry, P. R. The S-poor prolamins of wheat, barley and rye: Revisited. J.
Cereal Sci. 2012, 55, 79-99.
15. Field, J. M.; Tatham, A. S.; Baker, A. M.; Shewry, P. R. The structure of C hordein.
FEBS Lett. 1986, 200, 76-80.
16. Baik, B. K.; Ullrich, S. E. Barley for food: Characteristics, improvement, and renewed
interest. J. Cereal Sci. 2008, 48, 233-242.
17. Wilde, P.; Mackie, A.; Husband, F.; Gunning, P.; Morris, V. Proteins and emulsifiers at
liquid interfaces. Adv. Colloid Interface Sci. 2004, 108, 63-71.
18. Wang, C.; Tian, Z.; Chen, L.; Temelli, F.; Liu, H.; Wang, Y. Functionality of barley
proteins extracted and fractionated by alkaline and alcohol methods. Cereal Chem. 2010,
87, 597-606.
19. Bilgi, B.; celik, S. Solubility and emulsifying properties of barley protein concentrate. Eur.
Food Res. Technol. 2004, 218, 437-441.
20. Zhao, J.; Tian, Z.; Chen, L. Effects of deamidation on aggregation and emulsifying
properties of barley glutelin. Food Chem. 2011, 128, 1029-1036.
21. Zhao, J.; Tian, Z.; Chen, L. Effects of deamidation on structure and functional properties
of barley hordein. J. Agric. Food Chem. 2010, 58, 11448-11455.
22. Kapp, G. R.; Bamforth, C. W. The foaming properties of proteins isolated from barley. J.
Sci. Food Agric. 2002, 82, 1276-1281.
23. Xia, Y.; Wang, Y.; Chen, L. Molecular structure, physicochemical characterization, and
in vitro degradation of barley protein films. J. Agric. Food Chem. 2011, 59, 13221-13229.
24. Gibbs, F. B.; Kermasha, S.; Alli, I.; Mulligan, C. N. Encapsulation in the food industry: a
review. Int. J. Food Sci. Nutr. 1999, 50, 213-224.
25. Chen, L.; Remondetto, G. E.; Subirade, M. Food protein-based materials as nutraceutical
delivery systems. Trends Food Sci. Technol. 2006, 17, 272-283.
26. Wang, R.; Tian, Z.; Chen, L. A novel process for microencapsulation of fish oil with
barley protein. Food Res. Int. 2011, 44, 2735-2741.
27. Wang, R. X.; Tian, Z. G.; Chen, L. Y. Nano-encapsulations liberated from barley protein
microparticles for oral delivery of bioactive compounds. Int. J. Pharm. 2011, 406,
153-162.
171
28. Wang, Y. X.; Chen, L. Y. Fabrication and characterization of novel assembled prolamin
protein nanofabrics with improved stability, mechanical property and release profiles. J.
Mater. Chem. 2012, 22, 21592-21601.
29. Wang, Y.; Chen, L. Cellulose nanowhiskers and fiber alignment greatly improve
mechanical properties of electrospun prolamin protein fibers. ACS Appl. Mater. Interfaces
2014, 6, 1709-1718.
30. Wang, Y.; Yang, J.; Chen, L. Convenient fabrication of electrospun prolamin protein
delivery system with three-dimensional shapeability and resistance to fouling. ACS Appl.
Mater. Interfaces 2015, 7, 13422-13430.
31. Li, D.; Xia, Y. Electrospinning of nanofibers: reinventing the wheel? Adv. Mater. 2004,
16, 1151-1170.
32. Bos, M. A.; van Vliet, T. Interfacial rheological properties of adsorbed protein layers and
surfactants: a review. Adv. Colloid Interface Sci. 2001, 91, 437-471.
33. Dalgleish, D. G. Adsorption of protein and the stability of emulsions. Trends Food Sci.
Technol. 1997, 8, 1-6.
34. Mitropoulos, V.; Mütze, A.; Fischer, P. Mechanical properties of protein adsorption
layers at the air/water and oil/water interface: A comparison in light of the
thermodynamical stability of proteins. Adv. Colloid Interface Sci. 2014, 206, 195-206.
35. Wang, R.; Tian, Z.; Chen, L. A novel process for microencapsulation of fish oil with
barley protein. Food Res. Int. 2011, 44, 2735-2741.
36. MacRitchie, F. Protein adsorption/desorption at fluid interfaces. Colloids and Surf. 1989,
41, 25-34.
37. Haynes, C. A.; Norde, W. Globular proteins at solid/liquid interfaces. Colloids Surf., B
1994, 2, 517-566.
38. Fowkes, F. M. Additivity of intermolecular forces at interfaces. i. determination of the
contribution to surface and interfacial tensions of dispersion forces in various liquids1. J
Phys Chem 1963, 67, 2538-2541.
39. Eastoe, J.; Dalton, J. S. Dynamic surface tension and adsorption mechanisms of
surfactants at the air-water interface. Adv. Colloid Interface Sci. 2000, 85, 103-144.

172
40. Absolom, D. R.; Van Oss, C. J.; Zingg, W.; Neumann, A. W. Determination of surface
tensions of proteins II. surface tension of serum albumin, altered at the protein-air
interface. Biochim. Biophys. Acta, Protein Struct. 1981, 670, 74-78.
41. Srisankar, E. V.; Shah, J. P.; Narayan, K. S. A simple apparatus for measuring dynamic
surface tension. J. Chem. Educ. 1987, 64, 378.
42. Chen, P.; Prokop, R. M.; Susnar, S. S.; Neumann, A. W. Interfacial tensions or protein
solutions using axisymmetric drop shape analysis. In Proteins at liquid interfaces; D.
Möbius, R. Miller, Eds.; Elseview: Philadelphia, 1998; pp 303-309.
43. Beverung, C. J.; Radke, C. J.; Blanch, H. W. Protein adsorption at the oil/water interface:
characterization of adsorption kinetics by dynamic interfacial tension measurements.
Biophys. Chem. 1999, 81, 59-80.
44. Tripp, B. C.; Magda, J. J.; Andrade, J. D. Adsorption of globular proteins at the air/water
interface as measured via dynamic surface tension: concentration dependence,
mass-transfer considerations, and adsorption kinetics. J. Colloid and Interface Sci.1995,
173, 16-27.
45. Langevin, D. Influence of interfacial rheology on foam and emulsion properties. Adv.
Colloid Interface Sci. 2000, 88, 209-222.
46. Fainerman, V. B.; Miller, R. Equilibrium and dynamic characteristics of protein
adsorption layers at gas-liquid interfaces: theoretical and experimental data. Colloid J.
2005, 67, 393-404.
47. Di Lollo, A. B. Thermal and surface properties of crystalline and non-crystallinen legume
seed proteins (Doctoral dissertation). Macdonald College of McGill University Canada
1990. Retrieved from http://digitool.library.mcgill.ca/.
48. Suttiprasit, P.; Krisdhasima, V.; McGuire, J. The surface activity of α-lactalbumin,
β-lactoglobulin, and bovine serum albumin: I. Surface tension measurements with
single-component and mixed solutions. J. Colloid and Interface Sci. 1992, 154, 316-326.
49. Damodaran, S. Water activity at interfaces and its role in regulation of interfacial
enzymes: a hypothesis. Colloids Surf., B 1998, 11, 231-237.
50. Franses, E. I.; Basaran, O. A.; Chang, C. H. Techniques to measure dynamic surface
tension. Curr. Opin. Colloid Interface Sci. 1996, 1, 296-303.
173
51. Murray, B. S. Interfacial rheology of food emulsifiers and proteins. Curr. Opin. Colloid
Interface Sci. 2002, 7, 426-431.
52. Freer, E. M.; Yim, K. S.; Fuller, G. G.; Radke, C. J. Shear and dilatational relaxation
mechanisms of globular and flexible proteins at the hexadecane/water interface. Langmuir
2004, 20, 10159-10167.
53. Baldursdottir, S. G.; Fullerton, M. S.; Nielsen, S. H.; Jorgensen, L. Adsorption of proteins
at the oil/water interface - observation of protein adsorption by interfacial shear stress
measurements. Colloids Surf., B 2010, 79, 41-46.
54. Freer, E. M.; Yim, K. S.; Fuller, G. G.; Radke, C. J. Interfacial rheology of globular and
flexible proteins at the hexadecane/water interface: Comparison of shear and dilatation
deformation. J. Phys. Chem. B 2004, 108, 3835-3844.
55. Cascão Pereira, L. G.; Théodoly, O.; Blanch, H. W.; Radke, C. J. Dilatational rheology of
BSA conformers at the air/water interface. Langmuir 2003, 19, 2349-2356.
56. Kim, D. A.; Cornec, M.; Narsimhan, G. Effect of thermal treatment on interfacial
properties of beta-lactoglobulin. J. Colloid and Interface Sci. 2005, 285, 100-109.
57. Maldonado-Valderrama, J.; Gunning, A. P.; Ridout, M. J.; Wilde, P. J.; Morris, V. J. The
effect of physiological conditions on the surface structure of proteins: Setting the scene
for human digestion of emulsions. Eur. Phys. J. E: Soft Matter Biol. Phys. 2009, 30,
165-174.
58. Maldonado-Valderrama, J.; Gunning, A. P.; Wilde, P. J.; Morris, V. J. In vitro gastric
digestion of interfacial protein structures: Visualisation by AFM. Soft Matter 2010, 6,
4908-4915.
59. Maldonado-Valderrama, J.; Miller, R.; Fainerman, V. B.; Wilde, P. J.; Morris, V. J. Effect
of gastric conditions on beta-lactoglobulin interfacial networks: Influence of the oil phase
on protein structure. Langmuir 2010, 26, 15901-15908.
60. Murray, B. S. Rheological properties of protein films. Curr. Opin. Colloid Interface Sci.
2011, 16, 27-35.
61. Reis, P.; Watzke, H.; Leser, M.; Holmberg, K.; Miller, R. Interfacial mechanism of
lipolysis as self-regulated process. Biophys Chem. 2010, 147, 93-103.
174
62. Maldonado-Valderrama, J.; Woodward, N. C.; Gunning, A. P.; Ridout, M. J.; Husband, F.
A.; Mackie, A. R.; Morris, V. J.; Wilde, P. J. Interfacial characterization of
beta-lactoglobulin networks: Displacement by bile salts. Langmuir 2008, 24, 6759-6767.
63. Lefèvre, T.; Subirade, M. Molecular structure and interaction of biopolymers as viewed
by Fourier transform infrared spectroscopy: model studies on β-lactoglobulin. Food
Hydrocoll. 2001, 15, 365-376.
64. McClements, D. J. Protein-stabilized emulsions. Curr. Opin. Colloid Interface Sci. 2004,
9, 305-313.
65. Graham, D. E.; Phillips, M. C. Proteins at liquid interfaces: I. Kinetics of adsorption and
surface denaturation. J. Colloid and Interface Sci. 1979, 70, 403-414.
66. Mezzenga, R.; Fischer, P. The self-assembly, aggregation and phase transitions of food
protein systems in one, two and three dimensions. Rep. Prog. Phys. 2013, 76, 046601.
67. Anderson, R. E.; Pande, V. S.; Radke, C. J. Dynamic lattice Monte Carlo simulation of a
model protein at an oil/water interface. J. Chem. Phys. 2000, 112, 9167-9185.
68. Lefevre, T.; Subirade, M. Formation of intermolecular beta-sheet structures: a
phenomenon relevant to protein film structure at oil-water interfaces of emulsions. J.
Colloid and Interface Sci. 2003, 263, 59-67.
69. Kong, J.; Yu, S. Fourier transform infrared spectroscopic analysis of protein secondary
structures. Acta Biochim. Biophys. Sin. 2007, 39, 549-559.
70. Bandekar, J. Amide modes and protein conformation. Biochim. Biophys. Acta, Protein
Struct. Mol. Enzymol. 1992, 1120, 123-143.
71. Lefevre, T.; Subirade, M. Structural and interaction properties of beta-lactoglobulin as
studied by FTIR spectroscopy. Int. J. Food Sci. Technol. 1999, 34, 419-428.
72. Meinders, M. B. J.; van den Bosch, G. G. M.; de Jongh, H. H. J. IRRAS, a new tool in
food science. Trends Food Sci. Technol. 2000, 11, 218-225.
73. Gallant, J.; Desbat, B.; Vaknin, D.; Salesse, C. Polarization-modulated infrared
spectroscopy and X-ray reflectivity of photosystem II core complex at the gas-water
interface. Biophys J. 1998, 75, 2888-2899.
175
74. Desroches, M. J.; Chaudhary, N.; Omanovic, S. PM-IRRAS investigation of the
interaction of serum albumin and fibrinogen with a biomedical-grade stainless steel
316LVM surface. Biomacromolecules 2007, 8, 2836-2844.
75. Boncheva, M.; Vogel, H. Formation of stable polypeptide monolayers at interfaces:
controlling molecular conformation and orientation. Biophys J. 1997, 73, 1056-1072.
76. Fang, Y.; Dalgleish, D. G. Conformation of beta-lactoglobulin studied by FTIR: effect of
pH, temperature, and adsorption to the oil in water interface. J. Colloid and Interface Sci.
1997, 196, 292-298.
77. Banc, A.; Desbat, B.; Renard, D.; Popineau, Y.; Mangavel, C.; Navailles, L. Structure and
orientation changes of omega- and gama-gliadins at the air-water interface: a PM-IRRAS
spectroscopy and Brewster angle microscopy study. Langmuir 2007, 23, 13066-13075.
78. Thakur, G.; Leblanc, R. M. Conformation of lysozyme Langmuir monolayer studied by
infrared reflection absorption spectroscopy. Langmuir 2009, 25, 2842-2849.
79. Doshi, J.; Reneker, D. H. In Electrospinning process and applications of electrospun
fibers, Industry Applications Society Annual Meeting, 1993., Conference Record of the
1993 IEEE, IEEE: 1993; pp 1698-1703.
80. Huang, Z. M.; Zhang, Y. Z.; Kotaki, M.; Ramakrishna, S. A review on polymer
nanofibers by electrospinning and their applications in nanocomposites. Compos. Sci.
Technol. 2003, 63, 2223-2253.
81. Bhardwaj, N.; Kundu, S. C. Electrospinning: a fascinating fiber fabrication technique.
Biotechnol. Adv. 2010, 28, 325-347.
82. Sill, T. J.; von Recum, H. A. Electrospinning: applications in drug delivery and tissue
engineering. Biomaterials 2008, 29, 1989-2006.
83. Schiffman, J. D.; Schauer, C. L. A review: electrospinning of biopolymer nanofibers and
their applications. Polym. Rev. 2008, 48, 317-352.
84. Frenot, A.; Chronakis, I. S. Polymer nanofibers assembled by electrospinning. Curr. Opin.
Colloid Interface Sci. 2003, 8, 64-75.
85. Ko, F. K. Nanofiber technology: Bridging the gap between nano and macro world. In
Nanoengineered Nanofibrous Materials; Selcuk Guceri, Yuri G. Gogotsi, and Vladimir
Kuznetsov, Eds.; Kluwer Academic Publishers: Dordrecht, 2004; pp: 1-18.
176
86. Fong, H.; Chun, I.; Reneker, D. H. Beaded nanofibers formed during electrospinning.
Polymer 1999, 40, 4585-4592.
87. Liu, H.; Hsieh, Y. L. Ultrafine fibrous cellulose membranes from electrospinning of
cellulose acetate. J. Polym. Sci., Part B: Polym. Phys. 2002, 40, 2119-2129.
88. Deitzel, J. M.; Kleinmeyer, J.; Harris, D.; Tan, N. The effect of processing variables on
the morphology of electrospun nanofibers and textiles. Polymer 2001, 42, 261-272.
89. Kongkhlang, T.; Kotaki, M.; Kousaka, Y.; Umemura, T.; Nakaya, D.; Chirachanchai, S.
Electrospun polyoxymethylene: Spinning conditions and its consequent nanoporous
nanofiber. Macromolecules 2008, 41, 4746-4752.
90. Son, W. K.; Youk, J. H.; Lee, T. S.; Park, W. H. The effects of solution properties and
polyelectrolyte on electrospinning of ultrafine poly (ethylene oxide) fibers. Polymer 2004,
45, 2959-2966.
91. Scheibel, T. Protein fibers as performance proteins: new technologies and applications.
Curr. Opin. Biotechnol. 2005, 16, 427-433.
92. Jiang, Q.; Reddy, N.; Yang, Y. Cytocompatible cross-linking of electrospun zein fibers
for the development of water-stable tissue engineering scaffolds. Acta Biomater. 2010, 6,
4042-4051.
93. Wang, Y.; Chen, L. Electrospinning of prolamin proteins in acetic acid: the effects of
protein conformation and aggregation in solution. Macromol. Mater. Eng. 2012, 297,
902-913.
94. Tatham, A. S.; Shewry, P. R. Elastomeric proteins: biological roles, structures and
mechanisms. Trends Biochem. Sci. 2000, 25, 567-571.
95. Wang, Y.; Chen, L. Impacts of nanowhisker on formation kinetics and properties of
all-cellulose composite gels. Carbohydr. Polym. 2011, 83, 1937-1946.
96. Dong, Z.; Kennedy, S. J.; Wu, Y. Electrospinning materials for energy-related
applications and devices. J. Power Sources 2011, 196, 4886-4904.
97. Lallave, M.; Bedia, J.; Ruiz-Rosas, R.; Rodríguez-Mirasol, J.; Cordero, T.; Otero, J. C.;
Marquez, M.; Barrero, A.; Loscertales, I. Filled and hollow carbon nanofibers by coaxial
electrospinning of alcell lignin without binder polymers. Adv. Mater. 2007, 19,
4292-4296.
177
98. Deng, L.; Young, R. J.; Kinloch, I. A.; Abdelkader, A. M.; Holmes, S. M.; De Haro-Del
Rio, D. A.; Eichhorn, S. J. Supercapacitance from cellulose and carbon nanotube
nanocomposite fibers. ACS Appl. Mater. Interfaces 2013, 5, 9983-9990.
99. Kötz, R.; Carlen, M. Principles and applications of electrochemical capacitors.
Electrochim. Acta 2000, 45, 2483-2498.
100. Pandolfo, A. G.; Hollenkamp, A. F. Carbon properties and their role in supercapacitors. J.
Power Sources 2006, 157, 11-27.
101. Frackowiak, E.; Beguin, F. Carbon materials for the electrochemical storage of energy in
capacitors. Carbon 2001, 39, 937-950.
102. Wang, G.; Zhang, L.; Zhang, J. A review of electrode materials for electrochemical
supercapacitors. Chem. Soc. Rev. 2012, 41, 797-828.
103. Chuang, C. M.; Huang, C. W.; Teng, H.; Ting, J. M. Effects of carbon nanotube grafting
on the performance of electric double layer capacitors. Energy Fuels 2010, 24,
6476-6482.
104. Béguin, F.; Presser, V.; Balducci, A.; Frackowiak, E. Carbons and electrolytes for
advanced supercapacitors. Adv. Mater. 2014, 26, 2219-2251.
105. Frackowiak, E. Carbon materials for supercapacitor application. Phys. Chem. Chem. Phys.
2007, 9, 1774-1785.
106. Naoi, K.; Simon, P. New materials and new configurations for advanced electrochemical
capacitors. J. Electrochem. Soc. 2008, 17, 34-37.
107. Ryu, K. S.; Kim, K. M.; Park, N. G.; Park, Y. J.; Chang, S. H. Symmetric redox
supercapacitor with conducting polyaniline electrodes. J. Power Sources 2002, 103,
305-309.
108. Fan, L. Z.; Maier, J. High-performance polypyrrole electrode materials for redox
supercapacitors. Electrochem. Commun. 2006, 8, 937-940.
109. Xu, Y.; Wang, J.; Sun, W.; Wang, S. Capacitance properties of poly (3,
4-ethylenedioxythiophene)/polypyrrole composites. J. Power Sources 2006, 159,
370-373.
110. Sharma, P.; Bhatti, T. S. A review on electrochemical double-layer capacitors. Energy
Convers. Manage. 2010, 51, 2901-2912.
178
111. Gupta, V.; Miura, N. High performance electrochemical supercapacitor from
electrochemically synthesized nanostructured polyaniline. Mater. Lett. 2006, 60,
1466-1469.
112. Wu, Q.; Xu, Y.; Yao, Z.; Liu, A.; Shi, G. Supercapacitors based on flexible
graphene/polyaniline nanofiber composite films. ACS nano 2010, 4, 1963-1970.
113. Simon, P.; Gogotsi, Y. Materials for electrochemical capacitors. Nat. Mater. 2008, 7,
845-854.
114. Gamby, J.; Taberna, P. L.; Simon, P.; Fauvarque, J. F.; Chesneau, M. Studies and
characterisations of various activated carbons used for carbon/carbon supercapacitors. J.
Power Sources 2001, 101, 109-116.
115. Li, Z.; Xu, Z.; Tan, X.; Wang, H.; Holt, C. M. B.; Stephenson, T.; Olsen, B. C.; Mitlin, D.
Mesoporous nitrogen-rich carbons derived from protein for ultra-high capacity battery
anodes and supercapacitors. Energy Environ. Sci. 2013, 6, 871-878.
116. Avraham, E.; Yaniv, B.; Soffer, A.; Aurbach, D. Developing ion electroadsorption
stereoselectivity, by pore size adjustment with chemical vapor deposition onto active
carbon fiber electrodes. Case of Ca2+
/Na+ separation in water capacitive desalination. J.
Phys. Chem. C 2008, 112, 7385-7389.
117. Dutta, S.; Bhaumik, A.; Wu, K. C. W. Hierarchically porous carbon derived from
polymers and biomass: effect of interconnected pores on energy applications. Energy
Environ. Sci. 2014, 7, 3574-3592.
118. Chen, L. F.; Huang, Z. H.; Liang, H. W.; Guan, Q. F.; Yu, S. H. Bacterial-cellulose
derived carbon nanofiber@MnO2 and nitrogen-doped carbon nanofiber electrode
materials: an asymmetric supercapacitor with high energy and power density. Adv. Mater.
2013, 25, 4746-4752.
119. Hao, L.; Li, X.; Zhi, L. Carbonaceous electrode materials for supercapacitors. Adv. Mater.
2013, 25, 3899-3904.
120. Hulicova-Jurcakova, D.; Seredych, M.; Lu, G. Q.; Bandosz, T. J. Combined effect of
nitrogen•and oxygen•containing functional groups of microporous activated carbon on
its electrochemical performance in supercapacitors. Adv. Funct. Mater. 2009, 19,
438-447.
179
121. Lota, G.; Grzyb, B.; Machnikowska, H.; Machnikowski, J.; Frackowiak, E. Effect of
nitrogen in carbon electrode on the supercapacitor performance. Chem. Phys. Lett. 2005,
404, 53-58.
122. Qian, W.; Sun, F.; Xu, Y.; Qiu, L.; Liu, C.; Wang, S.; Yan, F. Human hair-derived carbon
flakes for electrochemical supercapacitors. Energy Environ. Sci. 2014, 7, 379-386.
123. Chen, L. F.; Zhang, X. D.; Liang, H. W.; Kong, M.; Guan, Q. F.; Chen, P.; Wu, Z. Y.; Yu,
S. H. Synthesis of nitrogen-doped porous carbon nanofibers as an efficient electrode
material for supercapacitors. ACS nano 2012, 6, 7092-7102.
124. Chen, L. F.; Huang, Z. H.; Liang, H. W.; Yao, W. T.; Yu, Z. Y.; Yu, S. H. Flexible
all-solid-state high-power supercapacitor fabricated with nitrogen-doped carbon nanofiber
electrode material derived from bacterial cellulose. Energy Environ. Sci. 2013, 6,
3331-3338.
125. Jeong, H. M.; Lee, J. W.; Shin, W. H.; Choi, Y. J.; Shin, H. J.; Kang, J. K.; Choi, J. W.
Nitrogen-doped graphene for high-performance ultracapacitors and the importance of
nitrogen-doped sites at basal planes. Nano Lett. 2011, 11, 2472-2477.
126. Jurewicz, K.; Babeł, K.; Źiółkowski, A.; Wachowska, H. Ammoxidation of active
carbons for improvement of supercapacitor characteristics. Electrochim. Acta 2003, 48,
1491-1498.
127. Kalyani, P.; Anitha, A. Biomass carbon & its prospects in electrochemical energy systems.
Int. J. Hydrogen Energy 2013, 38, 4034-4045.
128. Wu, X. L.; Wen, T.; Guo, H. L.; Yang, S.; Wang, X.; Xu, A. W. Biomass-derived
sponge-like carbonaceous hydrogels and aerogels for supercapacitors. ACS nano 2013, 7,
3589-3597.
129. Wang, S.-X.; Yang, L.; Stubbs, L. P.; Li, X.; He, C. Lignin-derived fused electrospun
carbon fibrous mats as high performance anode materials for lithium ion batteries. ACS
Appl. Mater. Interfaces 2013, 5, 12275-12282.
130. Zhu, B.; Deng, Z.; Yang, W.; Wang, H.; Gao, L. Pyrolyzed polyaniline and graphene
nano sheet composite with improved rate and cycle performance for lithium storage.
Carbon 2015, 92, 354-361.
131. Lai, C.; Zhou, Z.; Zhang, L.; Wang, X.; Zhou, Q.; Zhao, Y.; Wang, Y.; Wu, X. F.; Zhu, Z.;
Fong, H. Free-standing and mechanically flexible mats consisting of electrospun carbon
180
nanofibers made from a natural product of alkali lignin as binder-free electrodes for
high-performance supercapacitors. J. Power Sources 2014, 247, 134-141.
132. Fitzer, E.; Kochling, K. H.; Boehm, H. P.; Marsh, H. Recommended terminology for the
description of carbon as a solid (IUPAC Recommendations 1995). Pure Appl. Chem.
1995, 67, 473-506.
133. Zhai, D.; Du, H.; Li, B.; Zhu, Y.; Kang, F. Porous graphitic carbons prepared by
combining chemical activation with catalytic graphitization. Carbon 2011, 49, 725-729.
134. Huang, C. H.; Zhang, Q.; Chou, T. C.; Chen, C. M.; Su, D. S.; Doong, R. A.
Three-dimensional hierarchically ordered porous carbons with partially graphitic
nanostructures for electrochemical capacitive energy storage. ChemSusChem 2012, 5,
563-571.
135. Wang, H.; Li, Z.; Mitlin, D. Tailoring biomass-derived carbon nanoarchitectures for
high-performance supercapacitors. ChemElectroChem 2014, 1, 332-337.
136. Biswal, M.; Banerjee, A.; Deo, M.; Ogale, S. From dead leaves to high energy density
supercapacitors. Energy Environ. Sci. 2013, 6, 1249-1259.
137. Sun, L.; Tian, C.; Li, M.; Meng, X.; Wang, L.; Wang, R.; Yin, J.; Fu, H. From coconut
shell to porous graphene-like nanosheets for high-power supercapacitors. J. Mater. Chem.
A 2013, 1, 6462-6470.
138. Li, Z.; Zhang, L.; Amirkhiz, B. S.; Tan, X.; Xu, Z.; Wang, H.; Olsen, B. C.; Holt, C.;
Mitlin, D. Carbonized chicken eggshell membranes with 3D architectures as
high-performance electrode materials for supercapacitors. Adv. Energy Mater. 2012, 2,
431-437.
139. Lee, Y. H.; Lee, Y. F.; Chang, K. H.; Hu, C. C. Synthesis of N-doped carbon nanosheets
from collagen for electrochemical energy storage/conversion systems. Electrochem.
Commun. 2011, 13, 50-53.
140. Yun, Y. S.; Cho, S. Y.; Shim, J.; Kim, B. H.; Chang, S.; Baek, S. J.; Huh, Y. S.; Tak, Y.;
Park, Y. W.; Park, S. Microporous carbon nanoplates from regenerated silk proteins for
supercapacitors. Adv. Mater. 2013, 25, 1993-1998.
141. Liang, Y.; Wu, D.; Fu, R. Carbon microfibers with hierarchical porous structure from
electrospun fiber-like natural biopolymer. Sci. Rep. 2012, 3.
181
142. Xu, B.; Hou, S.; Cao, G.; Wu, F.; Yang, Y. Sustainable nitrogen-doped porous carbon
with high surface areas prepared from gelatin for supercapacitors. J. Mater. Chem. 2012,
22, 19088-19093.
143. Gupta, M.; Bawa, A. S.; Semwal, A. D. Effect of barley flour incorporation on the
instrumental texture of sponge cake. Int. J. Food Prop. 2009, 12, 243-251.
144. Newman, R. K.; Lewis, S. E.; Newman, C. W.; Boik, R. J.; Ramage, R. T.
Hypocholesterolemic effect of barley foods on healthy men. Nutr. Rep. Int. 1989, 39,
749-760..
145. Hur, S. J.; Decker, E. A.; McClements, D. J. Influence of initial emulsifier type on
microstructural changes occurring in emulsified lipids during in vitro digestion. Food
Chem. 2009, 114, 253-262.
146. Qian, C.; McClements, D. J. Formation of nanoemulsions stabilized by model food-grade
emulsifiers using high pressure homogenization: Factors affecting particle size. Food
Hydrocoll. 2010, 25, 1000-1008.
147. McClements, D. J.; Li, Y. Structured emulsion-based delivery systems: Controlling the
digestion and release of lipophilic food components. Adv. Colloid Interface Sci. 2010, 159,
213-228.
148. Chen, L.; Remondetto, G. E.; Subirade, M. Food protein-based materials as nutraceutical
delivery systems. Trends Food Sci. Technol. 2006, 17, 272-283.
149. Zhai, J.; Hoffmann, S. V.; Day, L.; Lee, T. H.; Augustin, M. A.; Aguilar, M. I.; Wooster,
T. J. Conformational changes of alpha-lactalbumin adsorbed at oil-water interfaces:
interplay between protein structure and emulsion stability. Langmuir 2012, 28,
2357-2367.
150. Li, Y.; Zheng, J. K.; Xiao, H.; McClements, D. J. Nanoemulsion-based delivery systems
for poorly water-soluble bioactive compounds: Influence of formulation parameters on
polymethoxyflavone crystallization. Food Hydrocoll. 2012, 27, 517-528.
151. Lee, S. H.; Lefѐvre, T.; Subirade, M.; Paquin, P. Changes and roles of secondary
structures of whey protein for the formation of protein membrane at soy oil/water
interface under high-pressure homogenization. J. Agric. Food Chem. 2007, 55,
10924-10931.
152. Kim, J.; Swager, T. M. Control of conformational and interpolymer effects in conjugated
polymers. Nature 2001, 411, 1030-1034.

182
153. López-Montero, I.; Arriaga, L. R.; Rivas, G.; Vélez , M.; Monroy, F. Lipid domains and
mechanical plasticity of Escherichia coli lipid monolayers. Chem Phys Lipids 2010, 163,
56-63.
154. Yalcin, E.; Celik, S.; Ibanoglu, E. Foaming properties of barley protein isolates and
hydrolysates. Eur. Food Res. Technol. 2008, 226, 967-974.
155. Yang, J.; Zhou, Y.; Chen, L. Elaboration and characterization of barley protein
nanoparticles as an oral delivery system for lipophilic bioactive compounds. Food Funct.
2014, 5, 92-101.
156. Marchylo, B. A.; Kruger, J. E. Identification of Canadian barley cultivars by
reversed-phase high-performance liquid chromatography. Cereal Chem. 1984, 61,
295-301.
157. Shewry, P. R.; Ellis, J. R. S.; Pratt, H. M.; Miflin, B. J. A comparison of methods for the
extraction and separation of hordein fractions from 29 barley varieties. J. Sci. Food Agric.
1978, 29, 433-441.
158. Bos, M. A.; Dunnewind, B.; van Vliet, T. Foams and surface rheological properties of
bata-casein, gliadin and glycinin. Colloids Surf., B 2003, 31, 95-105.
159. Langmuir, I.; Schaefer, V. J. Properties and structure of protein monolayers. Chem Rev
1939, 24, 181-202.
160. Banc, A.; Desbat, B.; Renard, D.; Popineau, Y.; Mangavel, C.; Navailles, L. Exploring
the interactions of gliadins with model membranes: effect of confined geometry and
interfaces. Biopolymers 2009, 91, 610-622.
161. Lenk, T. J.; Horbett, T. A.; Ratner, B. D.; Chittur, K. K. Infrared spectroscopic studies of
time-dependent changes in fibrinogen adsorbed to polyurethanes. Langmuir 1991, 7,
1755-1764.
162. Bantchev, G. B.; Schwartz, D. K. Surface shear rheology of beta-casein layers at the
air/solution interface: Formation of a two-dimensional physical gel. Langmuir 2003, 19,
2673-2682.
163. Graham, D. E.; Phillips, M. C. Proteins at liquid interfaces: II. Adsorption isotherms. J.
Colloid Interface Sci. 1979, 70, 415-426.

183
164. Croguennec, T.; Renault, A.; Bouhallab, S.; Pezennec, S. Interfacial and foaming
properties of sulfydryl-modified bovine beta-lactoglobulin. J. Colloid Interface Sci. 2006,
302, 32-39.
165. Ipsen, R.; Otte, J. The relation between protein structure, interfacial rheology and foam
formation for various milk proteins. Annu. Trans. Nord. Rheol. Soc. 2004, 12, 143-148.
166. Mahmoudi, N.; Axelos, M. A. V.; Riaublanc, A. Interfacial properties of fractal and
spherical whey protein aggregates. Soft Matter 2011, 7, 7643-7654.
167. Erni, P.; Windhab, E. J.; Gunde, R.; Graber, M.; Pfister, B.; Parker, A.; Fischer, P.
Interfacial rheology of surface-active biopolymers: Acacia senegal gum versus
hydrophobically modifed starch. Biomacromolecules 2007, 8, 3458-3466.
168. Humblet-Hua, N.-P. K.; van der Linden, E.; Sagis, L. M. C. Surface rheological
properties of liquid-liquid interfaces stabilized by protein fibrillar aggregates and
protein-polysaccharide complexes. Soft Matter 2013, 9, 2154-2165.
169. Rodrı́guez Patino, J. M.; Molina Ortiz, S. E.; Carrera Sánchez, C.; Rodrı́guez Niño, M. R.;
Añón, M. C. Dynamic properties of soy globulin adsorbed films at the air-water interface.
J. Colloid Interface Sci. 2003, 268, 50-57.
170. Medrano, A.; Abirached, C.; Araujo, A. C.; Panizzolo, L. A.; Moyna, P.; Añón, M. C.
Correlation of average hydrophobicity, water/air interface surface rheological properties
and foaming properties of proteins. Food Sci. Technol. Int. 2012, 18, 187-193.
171. Rossetti, D.; Yakubov, G. E.; Stokes, J. R.; Williamson, A. M.; Fuller, G. G. Interaction
of human whole saliva and astringent dietary compounds investigated by interfacial shear
rheology. Food Hydrocoll. 2008, 22, 1068-1078.
172. Vessely, C. R.; Carpenter, J. F.; Schwartz, D. K. Calcium-induced changes to the
molecular conformation and aggregate structure of beta-casein at the air-water interface.
Biomacromolecules 2005, 6, 3334-3344.
173. Murray, B. S.; Nelson, P. V. A novel Langmuir trough for equilibrium and dynamic
measurements on air-water and oil-water monolayers. Langmuir 1996, 12, 5973-5976.
174. Örnebro, J.; Nylander, T.; Eliasson, A. C.; Shewry, P. R.; Tatham, A. S.; Gilbert, S. M.
The behaviour of the high molecular-weight glutenin subunit 1Dx5, the 58 kDa central
repetitive domain and alpha-gliadins at the air-aqueous interface. J. Cereal Sci. 2003, 38,
147-156.
184
175. Kamilya, T.; Pal, P.; Talapatra, G. B. Interaction of ovalbumin with phospholipids
Langmuir-Blodgett film. J. Phys. Chem. B 2007, 111, 1199-1205.
176. Graham, D. E.; Phillips, M. C. Proteins at liquid interfaces: III. Molecular structures of
adsorbed films. J. Colloid Interface Sci. 1979, 70, 427-439.
177. Kaganer, V. M.; Möhwald, H.; Dutta, P. Structure and phase transitions in Langmuir
monolayers. Rev. Mod. Phys. 1999, 71, 779-820.
178. Dervichian, D. G. Changes of phase and transformations of higher order in monolayers. J.
Chem. Phys. 1939, 7, 931-948.
179. Murray, B. S. Equilibrium and dynamic surface pressure-area measurements on protein
films at air-water and oil-water interfaces. Colloids Surf., A 1997, 125, 73-83.
180. Caswell, D. S.; Spiro, T. G. Proline signals in ultraviolet resonance Raman spectra of
proteins: cis-trans isomerism in polyproline and ribonuclease A. J. Am. Chem. Soc. 1987,
109, 2796-2800.
181. Roach, P.; Farrar, D.; Perry, C. C. Interpretation of protein adsorption: surface-induced
conformational changes. J. Am. Chem. Soc. 2005, 127, 8168-8173.
182. Cornut, I.; Desbat, B.; Turlet, J. M.; Dufourcq, J. In situ study by polarization modulated
Fourier transform infrared spectroscopy of the structure and orientation of lipids and
amphipathic peptides at the air-water interface. Biophys. J. 1996, 70, 305-312.
183. Buffeteau, T.; Le Calvez, E.; Castano, S.; Desbat, B.; Blaudez, D.; Dufourcq, J.
Anisotropic optical constants of α-helix and β-sheet secondary structures in the infrared. J.
Phys.Chem. 2000, 104, 4537-4544.
184. Chirgadze, Y. N.; Fedorov, O. V.; Trushina, N. P. Estimation of amino acid residue
side-chain absorption in the infrared spectra of protein solutions in heavy water.
Biopolymers 1975, 14, 679-694.
185. Barth, A. The infrared absorption of amino acid side chains. Prog. Biophys. Mol. Bio.l
2000, 74, 141-173.
186. Castano, S.; Desbat, B.; Dufourcq, J. Ideally amphipathic beta-sheeted peptides at
interfaces: structure, orientation, affinities for lipids and hemolytic activity of (KL)mK
peptides. Biochim. Biophys. Acta, Biomembr. 2000, 1463, 65-80.
185
187. Dluhy, R. A.; Shanmukh, S.; Brian Leapard, J.; Krüger, P.; Baatz, J. E. Deacylated
pulmonary surfactant protein SP-C transforms from alpha-helical to amyloid fibril
structure via a pH-dependent mechanism: an infrared structural investigation. Biophys. J.
2003, 85, 2417-2429.
188. Chou, P. Y.; Fasman, G. D. Empirical predictions of protein conformation. Annu. Rev.
Biochem. 1978, 47, 251-276.
189. Thakur, G.; Wang, C.; Leblanc, R. M. Surface chemistry and in situ spectroscopy of a
lysozyme Langmuir monolayer. Langmuir 2008, 24, 4888-4893.
190. Kim, F.; Cote, L. J.; Huang, J. Graphene oxide: Surface activity and two-dimensional
assembly. Adv. Mater. 2010, 22, 1954-1958.
191. Mackie, A.; Macierzanka, A. Colloidal aspects of protein digestion. Curr. Opin. Colloid
Interface Sci. 2010, 15, 102-108.
192. Tang, J. Specificity of pepsin and its dependence on a possible "hydrophobic binding site".
Nature 1963, 199, 1094 - 1095.
193. Kaya-Celiker, H.; Mallikarjunan, K. Better nutrients and therapeutics delivery in food
through nanotechnology. Food Eng. Rev. 2012, 4, 114-123.
194. Erdman Jr, J. W.; Bierer, T. L.; Gugger, E. T. Absorption and transport of carotenoids.
Ann. N Y Acad. Sci. 1993, 691, 76-85.
195. Acosta, E. Bioavailability of nanoparticles in nutrient and nutraceutical delivery. Curr.
Opin. Colloid Interface Sci. 2009, 14, 3-15.
196. Weiss, J.; Takhistov, P.; McClements, D. J. Functional materials in food nanotechnology.
J. Food Sci. 2006, 71, R107-R116.
197. Ezpeleta, I.; Irache, J. M.; Stainmesse, S.; Chabenat, C.; Gueguen, J.; Popineau, Y.;
Orecchioni, A. M. Gliadin nanoparticles for the controlled release of all-trans-retinoic
acid. Int. J. Pharm. 1996, 131, 191-200.
198. Pan, X.; Yao, P.; Jiang, M. Simultaneous nanoparticle formation and encapsulation driven
by hydrophobic interaction of casein-graft-dextran and β-carotene. J. Colloid Interface Sci.
2007, 315, 456-463.
199. Porter, C. J. H.; Trevaskis, N. L.; Charman, W. N. Lipids and lipid-based formulations:
optimizing the oral delivery of lipophilic drugs. Nat. Rev. Drug Discov. 2007, 6, 231-248.

186
200. Li, Y.; Hu, M.; McClements, D. J. Factors affecting lipase digestibility of emulsified
lipids using an in vitro digestion model: Proposal for a standardised pH-stat method. Food
Chem. 2011, 126, 498-505.
201. Singh, A.; He, B.; Thompson, J.; Van Gerpen, J. Process optimization of biodiesel
production using alkaline catalysts. Appl. Eng. Agric. 2006, 22, 597-600.
202. Dickinson, E. Proteins at interfaces and in emulsions - Stability, rheology and interactions.
J. Chem. Soc., Faraday Trans. 1998, 94, 1657-1669.
203. Anton, N.; Benoit, J. P.; Saulnier, P. Design and production of nanoparticles formulated
from nano-emulsion templates - A review. J. Controlled Release 2008, 128, 185-199.
204. Jafari, S. M.; Assadpoor, E.; He, Y.; Bhandari, B. Re-coalescence of emulsion droplets
during high-energy emulsification. Food Hydrocoll. 2008, 22, 1191-1202.
205. Tan, C. P.; Nakajima, M. beta-Carotene nanodispersions: preparation, characterization
and stability evaluation. Food Chem. 2005, 92, 661-671.
206. Yuan, Y.; Gao, Y. X.; Zhao, J.; Mao, L. Characterization and stability evaluation of
beta-carotene nanoemulsions prepared by high pressure homogenization under various
emulsifying conditions. Food Res. Int. 2008, 41, 61-68.
207. Guimaraes, C. A.; Menaa, F.; Menaa, B.; Quenca-Guillen, J. S.; Matos, J. D.; Mercuri, L.
P.; Braz, A. B.; Rossetti, F. C.; Kedor-Hackmann, E. R. M.; Santoro, M. Comparative
physical-chemical characterization of encapsulated lipid-based isotretinoin products
assessed by particle size distribution and thermal behavior analyses. Thermochim. Acta
2010, 505, 73-78.
208. Muller, R. H.; Harden, D.; Keck, C. M. Development of industrially feasible concentrated
30% and 40% nanoemulsions for intravenous drug delivery. Drug Dev. Ind. Pharm. 2012,
38, 420-430.
209. Jafari, S. M.; He, Y.; Bhandari, B. Optimization of nano-emulsions production by
microfluidization. Eur. Food Res. Technol. 2007, 225, 733-741.
210. Dickinson, E.; van Vliet, T. Colloidal aggregation: Mechanisms and implications. In Food
colloids, biopolymers and materials Dickinson, E.; van Vliet, T., Eds. Royal Society of
Chemistry: Cambridge, 2003; Vol. 284, pp 68-83.
187
211. Luo, Y. C.; Teng, Z.; Wang, Q. Development of zein nanoparticles coated with
carboxymethyl chitosn for encapsulation and controlled release of vitamin D3. J. Agric.
Food Chem. 2012, 60, 836-843.
212. Arangoa, M. A.; Campanero, M. A.; Renedo, M. J.; Ponchel, G.; Irache, J. M. Gliadin
nanoparticles as carriers for the oral administration of lipophilic drugs. Relationships
between bioadhesion and pharmacokinetics. Pharm. Res. 2001, 18, 1521-1527.
213. Zhang, J.; Liang, L.; Tian, Z.; Chen, L.; Subirade, M. Preparation and in vitro evaluation
of calcium-induced soy protein isolate nanoparticles and their formation mechanism study.
Food Chem. 2012, 133, 390-399.
214. Kim, Y. D.; Morr, C. V. Microencapsulation properties of gum Arabic and several food
proteins: Spray-dried orange oil emulsion particles. J. Agric. Food Chem. 1996, 44,
1314-1320.
215. McClements, D. J.; Rao, J. Food-grade nanoemulsions: formulation, fabrication,
properties, performance, biological fate, and potential toxicity. Crit. Rev. Food Sci. Nutr.
2011, 51, 285-330.
216. Arangoa, M. A.; Ponchel, G.; Orecchioni, A. M.; Renedo, M. J.; Duchene, D.; Irache, J.
M. Bioadhesive potential of gliadin nanoparticulate systems. Eur. J. Pharm. Sci. 2000, 11,
333-341.
217. Lai, L. F.; Guo, H. X. Preparation new 5-fluorouracil-loaded zein nanoparticles for liver
targeting. Int. J. Pharm. 2011, 404, 317-323.
218. Chen, L. Protein micro/nanoparticles for controlled nutraceutical delivery in functional
foods. In Designing functional foods: measuring and controlling food structure
breakdown and nutrient absorption; McClements, D. J., Decker, E. A., Eds.; CRC Press:
Oxford, 2009; pp 572-600.
219. Chen, L. Y.; Subirade, M. Chitosan/β-lactoglobulin core-shell nanoparticles as
nutraceutical carriers. Biomaterials 2005, 26, 6041-6053.
220. Simpson, D. J. Proteolytic degradation of cereal prolamins-the problem with proline.
Plant Sci. 2001, 161, 825-838.
221. Konovalov, V. V.; Kispert, L. D. AM1, INDO/S and optical studies of carbocations of
carotenoid molecules. Acid induced isomerization. J. Chem. Soc., Perkin Trans. 2 1999,
901-910.
188
222. Boon, C. S.; McClements, D. J.; Weiss, J.; Decker, E. A. Factors influencing the chemical
stability of carotenoids in foods. Crit. Rev. Food Sci. Nutr. 2010, 50, 515-532.
223. Liang, L.; Line, V. L. S.; Remondetto, G. E.; Subirade, M. In vitro release of
alpha-tocopherol from emulsion-loaded beta-lactoglobulin gels. Int. Dairy J. 2010, 20,
176-181.
224. Beaulieu, L.; Savoie, L.; Paquin, P.; Subirade, M. Elaboration and characterization of
whey protein beads by an emulsification/cold gelation process: application for the
protection of retinol. Biomacromolecules 2002, 3, 239-248.
225. Hernell, O.; Staggers, J. E.; Carey, M. C. Physical-chemical behavior of dietary and
biliary lipids during intestinal digestion and absorption. 2. Phase analysis and aggregation
states of luminal lipids during duodenal fat digestion in healthy adult human beings.
Biochemistry 1990, 29, 2041-2056.
226. Hidalgo, I. J.; Raub, T. J.; Borchardt, R. T. Characterization of the human colon
carcinoma cell line (Caco-2) as a model system for intestinal epithelial permeability.
Gastroenterology 1989, 96, 736-749.
227. Jung, T.; Kamm, W.; Breitenbach, A.; Kaiserling, E.; Xiao, J. X.; Kissel, T.
Biodegradable nanoparticles for oral delivery of peptides: is there a role for polymers to
affect mucosal uptake? Eur. J. Pharm. Biopharm. 2000, 50, 147-160.
228. Qie, L.; Chen, W.; Xu, H.; Xiong, X.; Jiang, Y.; Zou, F.; Hu, X.; Xin, Y.; Zhang, Z.;
Huang, Y. Synthesis of functionalized 3D hierarchical porous carbon for
high-performance supercapacitors. Energy & Environ. Sci. 2013, 6, 2497-2504.
229. Qian, H.; Diao, H.; Shirshova, N.; Greenhalgh, E. S.; Steinke, J. G. H.; Shaffer, M. S. P.;
Bismarck, A. Activation of structural carbon fibres for potential applications in
multifunctional structural supercapacitors. J. Colloid Interface Sci. 2013, 395, 241-248.
230. Qiu, B.; Pan, C.; Qian, W.; Peng, Y.; Qiu, L.; Yan, F. Nitrogen-doped mesoporous
carbons originated from ionic liquids as electrode materials for supercapacitors. J. Mater.
Chem. A 2013, 1, 6373-6378.
231. Zhang, Y.; Feng, H.; Wu, X.; Wang, L.; Zhang, A.; Xia, T.; Dong, H.; Li, X.; Zhang, L.
Progress of electrochemical capacitor electrode materials: A review. Int. J. Hydrogen
Energy 2009, 34, 4889-4899.
232. Shanmugam, S.; Osaka, T. Efficient electrocatalytic oxygen reduction over metal
free-nitrogen doped carbon nanocapsules. Chem. Commun. 2011, 47, 4463-4465.
189
233. Anderson, T. J.; Lamsal, B. P. Review: Zein extraction from corn, corn products, and
coproducts and modifications for various applications: A review. Cereal Chem. 2011, 88,
159-173.
234. Dallmeyer, I.; Lin, L. T.; Li, Y.; Ko, F.; Kadla, J. F. Preparation and characterization of
interconnected, kraft lignin-based carbon fibrous materials by electrospinning. Macromol.
Mater. Eng. 2014, 299, 540-551.
235. Braun, J. L.; Holtman, K. M.; Kadla, J. F. Lignin-based carbon fibers: Oxidative
thermostabilization of kraft lignin. Carbon 2005, 43, 385-394.
236. Bier, J. M.; Verbeek, C. J. R.; Lay, M. C. Thermal transitions and structural relaxations in
protein-based thermoplastics. Macromol. Mater. Eng. 2014, 299, 524-539.
237. Salas, C.; Ago, M.; Lucia, L. A.; Rojas, O. J. Synthesis of soy protein-lignin nanofibers
by solution electrospinning. React. Funct. Polym. 2015, 85, 221-227.
238. Zhai, Y.; Dou, Y.; Zhao, D.; Fulvio, P. F.; Mayes, R. T.; Dai, S. Carbon materials for
chemical capacitive energy storage. Adv. Mater. 2011, 23, 4828-4850.
239. Bleda-Martínez, M. J.; Maciá-Agulló, J. A.; Lozano-Castelló, D.; Morallón, E.;
Cazorla-Amorós, D.; Linares-Solano, A. Role of surface chemistry on electric double
layer capacitance of carbon materials. Carbon 2005, 43, 2677-2684.
240. Wang, D. W.; Li, F.; Liu, M.; Lu, G. Q.; Cheng, H. M. 3D aperiodic hierarchical porous
graphitic carbon material for high-rate electrochemical capacitive energy storage. Angew.
Chem. 2008, 120, 379-382.
241. Rodriguez-Reinoso, F.; Molina-Sabio, M. Activated carbons from lignocellulosic
materials by chemical and/or physical activation: an overview. Carbon 1992, 30,
1111-1118.
242. Lambert, T. N.; Luhrs, C. C.; Chavez, C. A.; Wakeland, S.; Brumbach, M. T.; Alam, T. M.
Graphite oxide as a precursor for the synthesis of disordered graphenes using the
aerosol-through-plasma method. Carbon 2010, 48, 4081-4089.
243. Pumera, M. Graphene-based nanomaterials for energy storage. Energy Environ. Sci. 2011,
4, 668-674.
244. Li, Y.; Li, Z.; Shen, P. K. Simultaneous formation of ultrahigh surface area and
three-dimensional hierarchical porous graphene-like networks for fast and highly stable
supercapacitors. Adv. Mater. 2013, 25, 2474-2480.

190
245. Cho, S. Y.; Yun, Y. S.; Lee, S.; Jang, D.; Park, K. Y.; Kim, J. K.; Kim, B. H.; Kang, K.;
Kaplan, D. L.; Jin, H. J. Carbonization of a stable β-sheet-rich silk protein into a
pseudographitic pyroprotein. Nat. Commun. 2015, 6, 1-7.
246. Castano, S.; Desbat, B.; Laguerre, M.; Dufourcq, J. Structure, orientation and affinity for
interfaces and lipids of ideally amphipathic lytic LiKj(i=2j) peptides. Biochim. Biophys.
Acta, Biomembr. 1999, 1416, 176-194.
247. Barth, A. Infrared spectroscopy of proteins. Biochim. Biophys. Acta, Bioenerg. 2007,
1767, 1073-1101.
248. Bailey, J. E.; Clarke, A. J. Carbon fibre formation-the oxidation treatment. Nature 1971,
529-531.
249. Sing, K. S. W. Reporting physisorption data for gas/solid systems with special reference
to the determination of surface area and porosity (Recommendations 1984). Pure Appl.
Chem. 1985, 57, 603-619.
250. Chen, H.; Müller, M. B.; Gilmore, K. J.; Wallace, G. G.; Li, D. Mechanically strong,
electrically conductive, and biocompatible graphene paper. Adv. Mater. 2008, 20,
3557-3561.
251. Spyrou, K.; Rudolf, P. An introduction to graphene. In Functionalization of graphene;
Vasilios G., Eds.; Wiley-VCH: Germany, 2014; pp 1-20.
252. Shen, J.; Hu, Y.; Shi, M.; Lu, X.; Qin, C.; Li, C.; Ye, M. Fast and facile preparation of
graphene oxide and reduced graphene oxide nanoplatelets. Chem. Mater. 2009, 21,
3514-3520.
253. Dresselhaus, M. S.; Dresselhaus, G.; Saito, R.; Jorio, A. Raman spectroscopy of carbon
nanotubes. Phys. Rep. 2005, 409, 47-99.
254. Wang, G.; Yang, J.; Park, J.; Gou, X.; Wang, B.; Liu, H.; Yao, J. Facile synthesis and
characterization of graphene nanosheets. J. Phys. Chem. C 2008, 112, 8192-8195.
255. Lee, W. H.; Lee, J. G.; Reucroft, P. J. XPS study of carbon fiber surfaces treated by
thermal oxidation in a gas mixture of O2/(O2+N2). Appl. Surf. Sci. 2001, 171, 136-142.
256. Ania, C. O.; Khomenko, V.; Raymundo-Piñero, E.; Parra, J. B.; Beguin, F. The large
electrochemical capacitance of microporous doped carbon obtained by using a zeolite
template. Adv. Func. Mater. 2007, 17, 1828-1836.
191
257. Qu, D. Studies of the activated carbons used in double-layer supercapacitors. J. Power
Sources 2002, 109, 403-411.
258. Zhou, J. H.; Sui, Z. J.; Zhu, J.; Li, P.; Chen, D.; Dai, Y. C.; Yuan, W. K. Characterization
of surface oxygen complexes on carbon nanofibers by TPD, XPS and FT-IR. Carbon
2007, 45, 785-796.
259. Eliad, L.; Salitra, G.; Soffer, A.; Aurbach, D. Ion sieving effects in the electrical double
layer of porous carbon electrodes: estimating effective ion size in electrolytic solutions. J.
Phys. Chem. B 2001, 105, 6880-6887.
260. Salitra, G.; Soffer, A.; Eliad, L.; Cohen, Y.; Aurbach, D. Carbon electrodes for
double-layer capacitors I. Relations between ion and pore dimensions. J. Electrochem.
Soc. 2000, 147, 2486-2493.
261. Xufeng, Z.; Wei, W.; Zhaoping, L. Graphene Overview. In Graphene: energy storage
and conversion applications; Liu Z., Eds.; CRC Press: Boca Raton, 2014; pp 1-20.
262. Zhu, Y.; Murali, S.; Stoller, M. D.; Ganesh, K. J.; Cai, W.; Ferreira, P. J.; Pirkle, A.;
Wallace, R. M.; Cychosz, K. A.; Thommes, M. Carbon-based supercapacitors produced
by activation of graphene. Science 2011, 332, 1537-1541.
263. Xu, J.; Gao, Q.; Zhang, Y.; Tan, Y.; Tian, W.; Zhu, L.; Jiang, L. Preparing
two-dimensional microporous carbon from Pistachio nutshell with high areal capacitance
as supercapacitor materials. Sci. Rep. 2014, 4.
264. Xu, Q.; Yu, X.; Liang, Q.; Bai, Y.; Huang, Z.-H.; Kang, F. Nitrogen-doped hollow
activated carbon nanofibers as high performance supercapacitor electrodes. J. Electroanal.
Chem. 2015, 739, 84-88.
265. Chen, L.; Wang, Z.; He, C.; Zhao, N.; Shi, C.; Liu, E.; Li, J. Porous graphitic carbon
nanosheets as a high-rate anode material for lithium-ion batteries. ACS Appl. Mater.
Interfaces 2013, 5, 9537-9545.
266. Sun, L.; Fu, Y.; Tian, C.; Yang, Y.; Wang, L.; Yin, J.; Ma, J.; Wang, R.; Fu, H. Isolated
boron and nitrogen sites on porous graphitic carbon synthesized from nitrogen-containing
chitosan for supercapacitors. ChemSusChem 2014, 7, 1637-1646.
267. Wang, L.; Mu, G.; Tian, C.; Sun, L.; Zhou, W.; Yu, P.; Yin, J.; Fu, H. Porous graphitic
carbon nanosheets derived from cornstalk biomass for advanced supercapacitors.
ChemSusChem 2013, 6, 880-889.
192
268. Deng, D.; Liao, X.; Shi, B. Synthesis of porous carbon fibers from collagen fiber.
ChemSusChem 2008, 1, 298-301.
269. Evans, N. A.; Milligan, B.; Montgomery, K. C. Collagen crosslinking: new binding sites
for mineral tannage. J. Am. Leather Chem. Assoc. 1987, 82, 86-95.
270. Liao, X. P; Shi, B. I. Adsorption of fluoride on zirconium (IV)-impregnated collagen fiber.
Environ. Sci. Technol. 2005, 39, 4628-4632.
271. Kim, C.; Ngoc, B. T. N.; Yang, K. S.; Kojima, M.; Kim, Y. A.; Kim, Y. J.; Endo, M.;
Yang, S. C. Self-sustained thin webs consisting of porous carbon nanofibers for
supercapacitors via the electrospinning of polyacrylonitrile solutions containing xinc
chloride. Adv. Mater. 2007, 19, 2341-2346.
272. Zong, X.; Kim, K.; Fang, D.; Ran, S.; Hsiao, B. S.; Chu, B. Structure and process
relationship of electrospun bioabsorbable nanofiber membranes. Polymer 2002, 43,
4403-4412.
273. Yang, L.; Fitie, C. F. C.; van der Werf, K. O.; Bennink, M. L.; Dijkstra, P. J.; Feijen, J.
Mechanical properties of single electrospun collagen type I fibers. Biomaterials 2008, 29,
955-962.
274. Kim, B.; Park, H.; Lee, S. H.; Sigmund, W. M. Poly (acrylic acid) nanofibers by
electrospinning. Mater. Lett. 2005, 59, 829-832.
275. Wine, Y.; Cohen-Hadar, N.; Freeman, A.; Frolow, F. Elucidation of the mechanism and
end products of glutaraldehyde crosslinking reaction by X-ray structure analysis.
Biotechnol. Bioeng. 2007, 98, 711-718.
276. Sisson, K.; Zhang, C.; Farach-Carson, M. C.; Chase, D. B.; Rabolt, J. F. Evaluation of
cross-linking methods for electrospun gelatin on cell growth and viability.
Biomacromolecules 2009, 10, 1675-1680.
277. Niu, S.; Han, K.; Lu, C.; Sun, R. Thermogravimetric analysis of the relationship among
calcium magnesium acetate, calcium acetate and magnesium acetate. Appl. Energy 2010,
87, 2237-2242.
278. Chen, X. Y.; Zhou, Q. Q. The production of porous carbon from calcium lignosulfonate
without activation process and the capacitive performance. Electrochim. Acta 2012, 71,
92-99.

193
279. Schwierz, N.; Horinek, D.; Netz, R. R. Specific ion binding to carboxylic surface groups
and the pH dependence of the Hofmeister series. Langmuir 2014, 31, 215-225.
280. Bryant, C. M.; McClements, D. J. Influence of NaCl and CaCl2 on cold-set gelation of
heat-denatured whey protein. J. Food Sci. 2000, 65, 801-804.
281. Barreto, P. L. M.; Pires, A. T. N.; Soldi, V. Thermal degradation of edible films based on
milk proteins and gelatin in inert atmosphere. Polym. Degrad. Stab. 2003, 79, 147-152.
282. Lemos, A. F.; Ferreira, J. M. F. Porous bioactive calcium carbonate implants processed by
starch consolidation. Mater. Sci. Eng. 2000, 11, 35-40.
283. Yamasaki, N.; Tang, W.; Ke, J. Low-temperature sintering of calcium carbonate by a
hydrothermal hot-pressing technique. J. Mater. Sci. Lett. 1992, 11, 934-936.
284. Lyckfeldt, O.; Brandt, J.; Lesca, S. Protein forming-a novel shaping technique for
ceramics. J. Eur. Ceram. Soc. 2000, 20, 2551-2559.
285. Yu, H.-D.; Tee, S. Y.; Han, M.-Y. Preparation of porosity-controlled calcium carbonate
by thermal decomposition of volume content-variable calcium carboxylate derivatives.
Chem. Commun. 2013, 49, 4229-4231.
286. Demri, B.; Muster, D. XPS study of some calcium compounds. J. Mater. Process.
Technol. 1995, 55, 311-314.
287. Seredych, M.; Hulicova-Jurcakova, D.; Lu, G. Q.; Bandosz, T. J. Surface functional
groups of carbons and the effects of their chemical character, density and accessibility to
ions on electrochemical performance. Carbon 2008, 46, 1475-1488.
288. Ugarte, D. Curling and closure of graphitic networks under electron-beam irradiation.
Nature 1992, 359, 707-709.
289. Pech, D.; Brunet, M.; Durou, H.; Huang, P.; Mochalin, V.; Gogotsi, Y.; Taberna, P.-L.;
Simon, P. Ultrahigh-power micrometre-sized supercapacitors based on onion-like carbon.
Nat. Nanotechnol. 2010, 5, 651-654.
290. Feng, G.; Qiao, R.; Huang, J.; Dai, S.; Sumpter, B. G.; Meunier, V. The importance of ion
size and electrode curvature on electrical double layers in ionic liquids. Phys. Chem.
Chem. Phys. 2011, 13, 1152-1161.
291. Zhu, Y.; Murali, S.; Cai, W.; Li, X.; Suk, J. W.; Potts, J. R.; Ruoff, R. S. Graphene and
graphene oxide: synthesis, properties, and applications. Adv. Mater. 2010, 22, 3906-3924.
194
292. Du, X.; Guo, P.; Song, H.; Chen, X. Graphene nanosheets as electrode material for
electric double-layer capacitors. Electrochim. Acta 2010, 55, 4812-4819.
293. Sun, L.; Tian, C.; Wang, L.; Zou, J.; Mu, G.; Fu, H. Magnetically separable porous
graphitic carbon with large surface area as excellent adsorbents for metal ions and dye. J.
Mater. Chem. 2011, 21, 7232-7239.
294. Kim, W.; Kang, M. Y.; Joo, J. B.; Kim, N. D.; Song, I. K.; Kim, P.; Yoon, J. R.; Yi, J.
Preparation of ordered mesoporous carbon nanopipes with controlled nitrogen species for
application in electrical double-layer capacitors. J. Power Sources 2010, 195, 2125-2129.
295. Zhu, H.; Wang, X.; Liu, X.; Yang, X. Integrated synthesis of poly
(o-phenylenediamine)-derived carbon materials for high performance supercapacitors.
Adv. Mater. 2012, 24, 6524-6529.
296. Xu, B.; Yue, S.; Sui, Z.; Zhang, X.; Hou, S.; Cao, G.; Yang, Y. What is the choice for
supercapacitors: graphene or graphene oxide? Energy Environ. Sci. 2011, 4, 2826-2830.
297. Wang, Y.; Shi, Z.; Huang, Y.; Ma, Y.; Wang, C.; Chen, M.; Chen, Y. Supercapacitor
devices based on graphene materials. J. Phys. Chem. C 2009, 113, 13103-13107.
298. Weng, Z.; Su, Y.; Wang, D. W.; Li, F.; Du, J.; Cheng, H. M. Graphene-cellulose paper
flexible supercapacitors. Adv. Energy Mater. 2011, 1, 917-922.
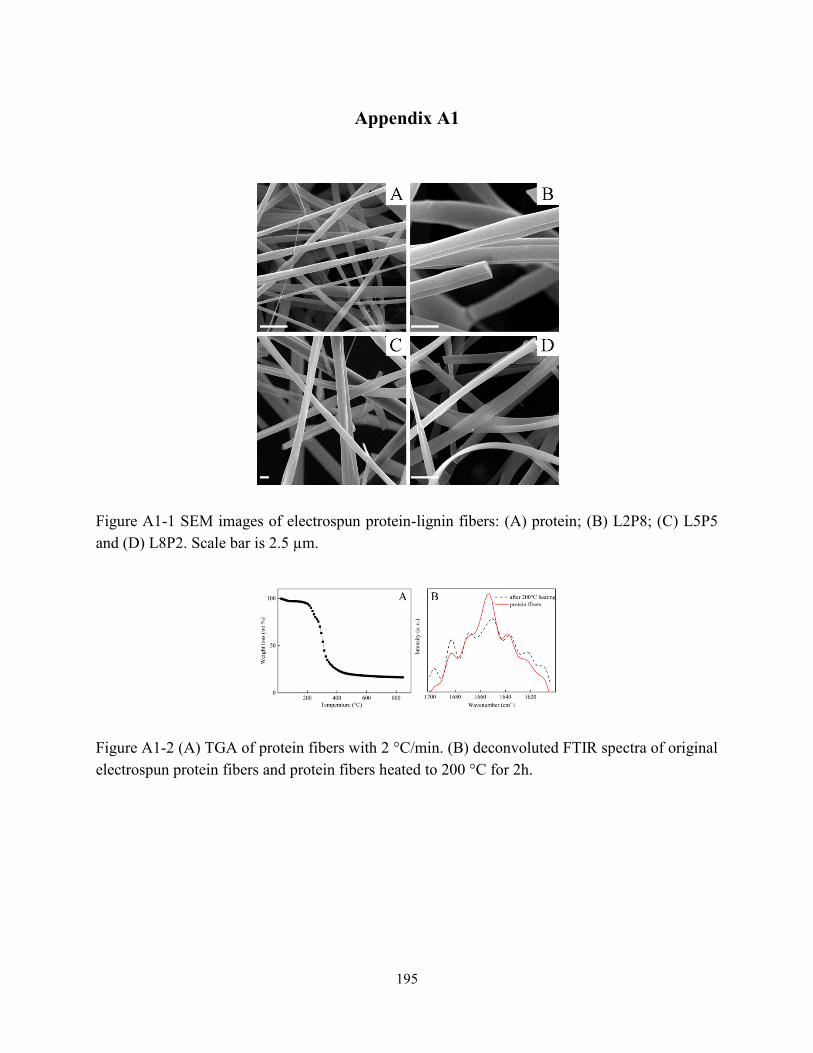
195
Appendix A1
Figure A1-1 SEM images of electrospun protein-lignin fibers: (A) protein; (B) L2P8; (C) L5P5
and (D) L8P2. Scale bar is 2.5 µm.
Figure A1-2 (A) TGA of protein fibers with 2 °C/min. (B) deconvoluted FTIR spectra of original
electrospun protein fibers and protein fibers heated to 200 °C for 2h.
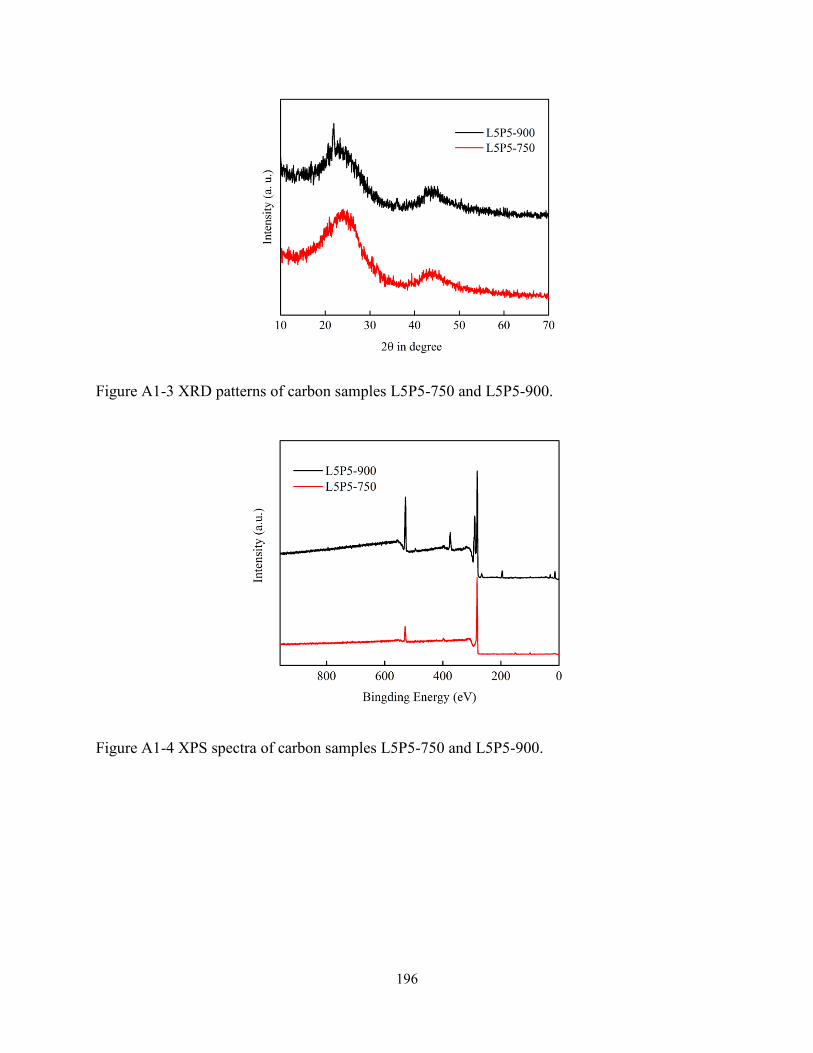
196
Figure A1-3 XRD patterns of carbon samples L5P5-750 and L5P5-900.
Figure A1-4 XPS spectra of carbon samples L5P5-750 and L5P5-900.

197
Appendix A2
Figure A2-1 TGA of protein original fibers and protein and 10% calcium original electropun
fibers with 2 °C/min.
Figure A2-12 XPS survey spectra of P-10%Ca and P-12%Ca.

198
Figure A2-3 HR-TEM images of P-10%Ca.
Figure A2-4 XRD patterns of P-10%Ca and P-12%Ca.

199
Figure A2-5 Raman spectra of P-8%Ca, P-10%Ca and P-12%Ca.