investigation and comparison of production in vertical, horizontal, slanted and hydraulically fractu
DESCRIPTION
http://www.jpsr.org/paperInfo.aspx?ID=14758 Different well types (Vertical, Slanted, Horizontal and Hydraulically Fractured Wells) have different effect on production profile. Each well type would have had effects on final recovery. Besides, finding the best production scenario in gas condensate reservoirs were so challenging and utilizing the best scenario need to be done smartly. So to get higher recovery from these kinds of reservoirs and due to sensitivity of them -especially fluids to pressure gradient- exploiting the best well type in each reservoir is more important. This paper focuses on investigation and comparison of production in vertical, slanted, horizontal and hydraulically fractured wells in a semi-real model of a gas condensate reservoir. Here different well type scenarios were investigated in a gas condensate model that has been customized for this goal. Comparison of the results shows practical facts that would be so helpful in selecting well type in Gas condeTRANSCRIPT
Journal of Petroleum Science Research (JPSR) Volume 3 Issue 3, July 2014 www.jpsr.org
doi: 10.14355/jpsr.2014.0303.06
145
Investigation and Comparison of Production
in Vertical, Horizontal, Slanted and
Hydraulically Fractured Wells in a Gas
Condensate Field Babak Moradi1, 2Amin Tahami3, Hosein Dehghani4, Mosayeb Alishir5, Amir Dehghan6
1,4 Department of Petroleum Engineering, Science and Research Branch, Islamic Azad University, Fars, Iran
2 Iranian Central Oil Fields Co.
3 Mad Daneshgostar Tabnak Co.(MDT),Tehran, Iran
4 Petro Pajohesh Ahoura Co. (PPA), Shiraz, Iran
5Academic Center for Education, Culture & Research (ACECR) on TMU, Tehran, Iran
6 Global Petro Tech Co. (GPT), Tehran, Iran
Received 1 February 2014; Accepted 3 March 2014; Published 26 June 2014
© 2014 Science and Engineering Publishing Company Abstract
Different well types (Vertical, Slanted, Horizontal and
Hydraulically Fractured Wells) have different effect on
production profile. Each well type would have had effects
on final recovery. Besides, finding the best production
scenario in gas condensate reservoirs were so challenging
and utilizing the best scenario need to be done smartly. So to
get higher recovery from these kinds of reservoirs and due
to sensitivity of them ‐especially fluids to pressure gradient‐
exploiting the best well type in each reservoir is more
important.
This paper focuses on investigation and comparison of
production in vertical, slanted, horizontal and hydraulically
fractured wells in a semi‐real model of a gas condensate
reservoir. Here different well type scenarios were
investigated in a gas condensate model that has been
customized for this goal. Comparison of the results shows
practical facts that would be so helpful in selecting well type
in Gas condensate reservoirs.
Keywords
Gas Condensate Reservoirs; Horizontal Well; Slanted Well;
Hydraulically Fractured Well
Introduction
Near Wellbore Effects in Gas Condensate Reservoirs
Well deliverability is an important issue in the
development of many gas condensate reservoirs.
When the well bottom hole flowing pressure falls
below the dew point, condensate liquid builds up
around the well bore, causing a reduction in gas
permeability and well productivity. The liquid
saturation may reach values as high as 50 or 60 per
cent, and the well deliverability may be reduced by up
to an order of magnitude [Mott et al., 2000].
The loss in productivity due to this ‘condensate
banking’ effect may be significant, even in very lean
gas condensate reservoirs [Mott et al., 1997]. In the
Arun reservoir [Afidik et al., 1994], the productivity
reduced by a factor of about two as the pressure fell
below the dew point, even though the reservoir fluid
was very lean with a maximum liquid drop out of
only 1%.
Most of the pressure drop from condensate blockage
occurs within a few feet of the well bore, where flow
rates are very high. The condensate bank around the
wellbore contains two phases, reservoir gas and liquid
condensate. This bank grows as the reservoir pressure
declines and progressively impedes the flow of gas to
the well, causing a loss of well productivity [Fussel,
1973]. Laboratory studies [Danesh et al.,
1994;Hendersen et al., 1995; Mott et al.,1999], however,
have shown that the oil saturation actually decreases
www.jpsr.org Journal of Petroleum Science Research (JPSR) Volume 3 Issue 3, July 2014
146
at high production rate in the immediate vicinity of
the well, due to capillary number effects (representing
the ratio of viscous to capillary forces). Consequently,
the relative permeability to gas increases, resulting in a
recovery of much of the gas mobility lost from
condensate blockage. Ignoring this phenomenon leads
to pessimistic recovery predictions. Gringarten [2000]
confirmed the existence of this increased mobility zone
near the wellbore from well test data by showing that
it often creates a three‐zone radial composite well test
behavior, yielding three stabilizations on the pressure
derivative.
The most important parameter for determining the
impact of condensate blockage is the effective gas
permeability in the near‐well region. In the flow of gas
condensate fluids through porous media at high
velocities, there appear to be two competing
phenomena which may cause the effective gas
permeability to be rate dependent, First is an increase
in relative permeability with velocity that is sometimes
termed ‘velocity stripping’ or ‘positive coupling’ and
second is Inertial (non‐Darcy) flow effects, which
reduce the effective gas permeability at high velocity
[Mott et al., 2000].
Horizontal Wells in Gas Condensate Reservoirs
In last few years, many horizontal wells have been
drilled around the world. The major purpose of
horizontal well is to enhance reservoir contact and
thereby enhance well productivity [Joshi, 1991].
Numerous studies have been done to investigate the
performance of horizontal well in oil and gas reservoir
but there are a few studies on the application of
horizontal well in gas condensate reservoir. For gas
condensate reservoir when the pressure falls below the
dew point, a region of condensation is formed around
the well, which impairs the well deliverability. The
condensate bank may be minimized using a horizontal
well due to less pressure draw down of a horizontal
well compared to that for a vertical well. The
application of horizontal wells instead of vertical wells
was reported in Dejel Bissa [Dehane et al., 2000] and
Hassi R Mel [Muladi et al., 1999].
Hashemi and Gringranten [2005] have compared the
well productivity between vertical, horizontal and
hydraulically fractured wells in a gas condensate
reservoir using a single well compositional model.
They examined the impact of the length of the
horizontal well on the pressure draw down and
condensate blockage around the well. Their results
showed that the pressure draw‐down and condensate
blockage is smaller for a horizontal well compared to
that of a vertical well. They accounted for the coupling
and inertial effect by choosing a fine grid near the well
bore and calculating the core specific constant that
simulator needs for expressing these two effects from
well test data.
The performance of a horizontal (Highly slanted) well
or a slanted well (SW), is mostly believed to be better
than that of a vertical well (VW) due to its greater
contact to the reservoir. However, the budgets of
drilling and completion are extra and the choices for
monitoring, control and interference often restricted.
Gas‐Condensate reservoirs are increasingly considered
as proper candidates for drilling SWs or HWs. These
reservoirs attitude special challenges selecting one
type or the other due to the complex nature of fluid
flow in porous media. These challenges are exhibited
by these low interfacial tension systems, which are
different from those of conventional gas‐oil systems.
In another side of view, condensate banking near well
bore due to pressure reduction cause condensates
production loss that are so valuable. In order to
prevent or decrease condensate banking near wellbore
many methods such as using Horizontal or Slanted
wells and Hydraulic fracturing have been proposed.
In this study we are trying to investigate the
performances of SW, HW and VW as well as
Hydraulic Fracturing in a layered gas‐condensate
reservoir.
Model and Scenarios Description
Model Description:
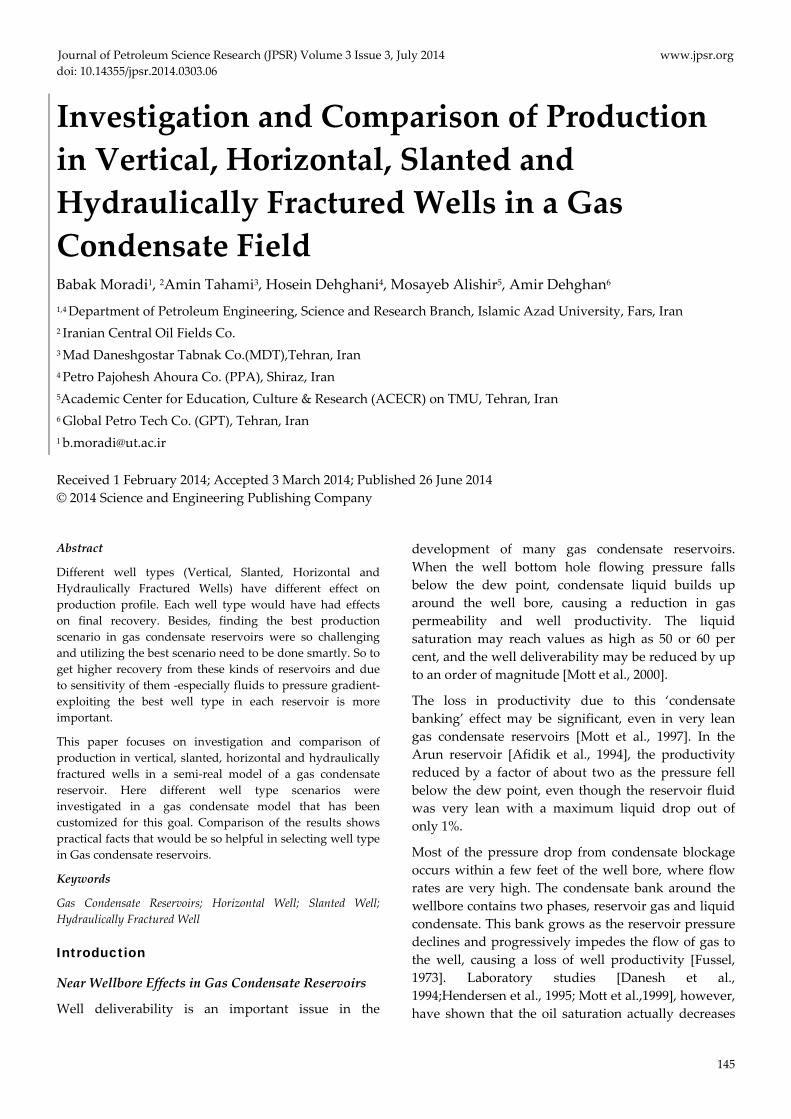
The model that has been selected for this study is
extracted from one of Iranian Gas condensate
reservoirs and been customized for this goal. This
reservoir has 4 main layers and the model has been
divided into 16 sub layers. The sector that been
selected for this study have 43 blocks in length and 14
FIG. 1 CROSS SECTION OF RESERVOIR SECTOR MODEL
Journal of Petroleum Science Research (JPSR) Volume 3 Issue 3, July 2014 www.jpsr.org
147
blocks in width. Each block has 1600*1600 feet
dimension. And the height of the reservoir is around
1445 feet. Figure 1 shows the cross section of the
reservoir sector model.
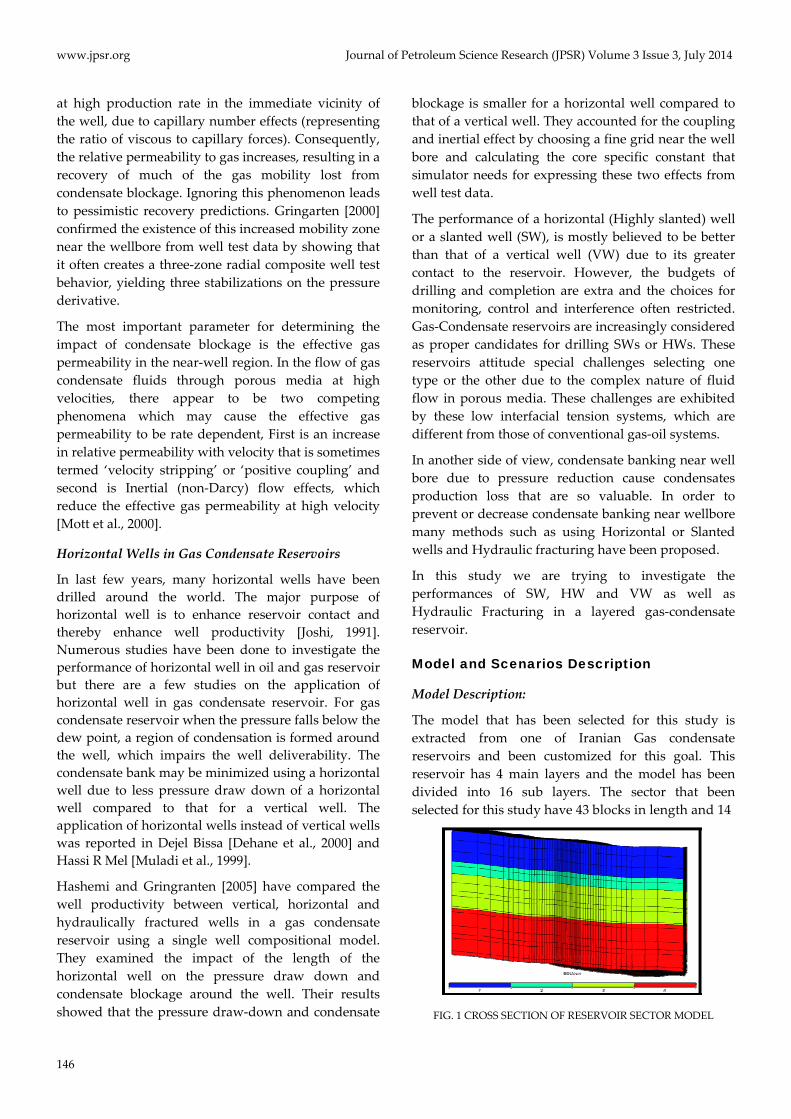
As the sector blocks are so large (1600*1600 feet), due
to investigate the change in dynamic properties of
reservoir around the well, near well bore blocks (a 9*9
block dimension square around the well’s top block)
refined (Figure 2)
FIG. 2 REFINED BLOCKS AROUND THE WELL
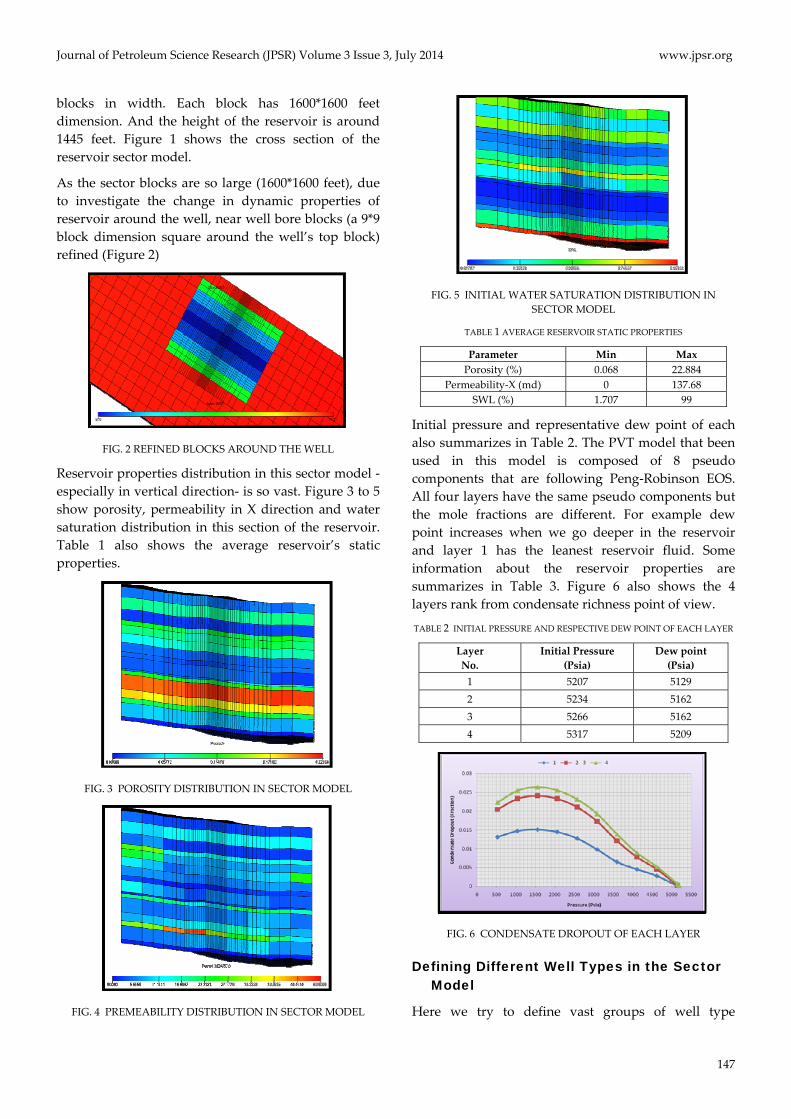
Reservoir properties distribution in this sector model ‐
especially in vertical direction‐ is so vast. Figure 3 to 5
show porosity, permeability in X direction and water
saturation distribution in this section of the reservoir.
Table 1 also shows the average reservoir’s static
properties.
FIG. 3 POROSITY DISTRIBUTION IN SECTOR MODEL
FIG. 4 PREMEABILITY DISTRIBUTION IN SECTOR MODEL
FIG. 5 INITIAL WATER SATURATION DISTRIBUTION IN
SECTOR MODEL
TABLE 1 AVERAGE RESERVOIR STATIC PROPERTIES
Parameter Min Max
Porosity (%) 0.068 22.884
Permeability‐X (md) 0 137.68
SWL (%) 1.707 99
Initial pressure and representative dew point of each
also summarizes in Table 2. The PVT model that been
used in this model is composed of 8 pseudo
components that are following Peng‐Robinson EOS.
All four layers have the same pseudo components but
the mole fractions are different. For example dew
point increases when we go deeper in the reservoir
and layer 1 has the leanest reservoir fluid. Some
information about the reservoir properties are
summarizes in Table 3. Figure 6 also shows the 4
layers rank from condensate richness point of view.
TABLE 2 INITIAL PRESSURE AND RESPECTIVE DEW POINT OF EACH LAYER
Layer
No.
Initial Pressure
(Psia)
Dew point
(Psia)
1 5207 5129
2 5234 5162
3 5266 5162
4 5317 5209
FIG. 6 CONDENSATE DROPOUT OF EACH LAYER
Defining Different Well Types in the Sector Model
Here we try to define vast groups of well type
www.jpsr.org Journal of Petroleum Science Research (JPSR) Volume 3 Issue 3, July 2014
148
scenarios in this sector model, due to do sensitivity
and get the best technical scenarios.
Vertical Well:
Cases Definitions:
Vertical wells are defined in the center of
refined blocks.
Production scenarios are defined in 5 years
period with the maximum rate of 120
MMscf/Day
Three scenarios has been defined as below:
a. One well that is completed in layers 1 to 3
b. One well that is completed in layers 3 and 4
c. One well that is completed in all 4 layers.
Result Comparison:
Low reservoir quality (Low porosity and high
initial water in layers 1 and 3) caused high
bottom‐hole pressure drop.
Due to different fluid properties in all layers, the
maximum condensate production has been
resulted from the well that is completed in
layers 3 and 4.
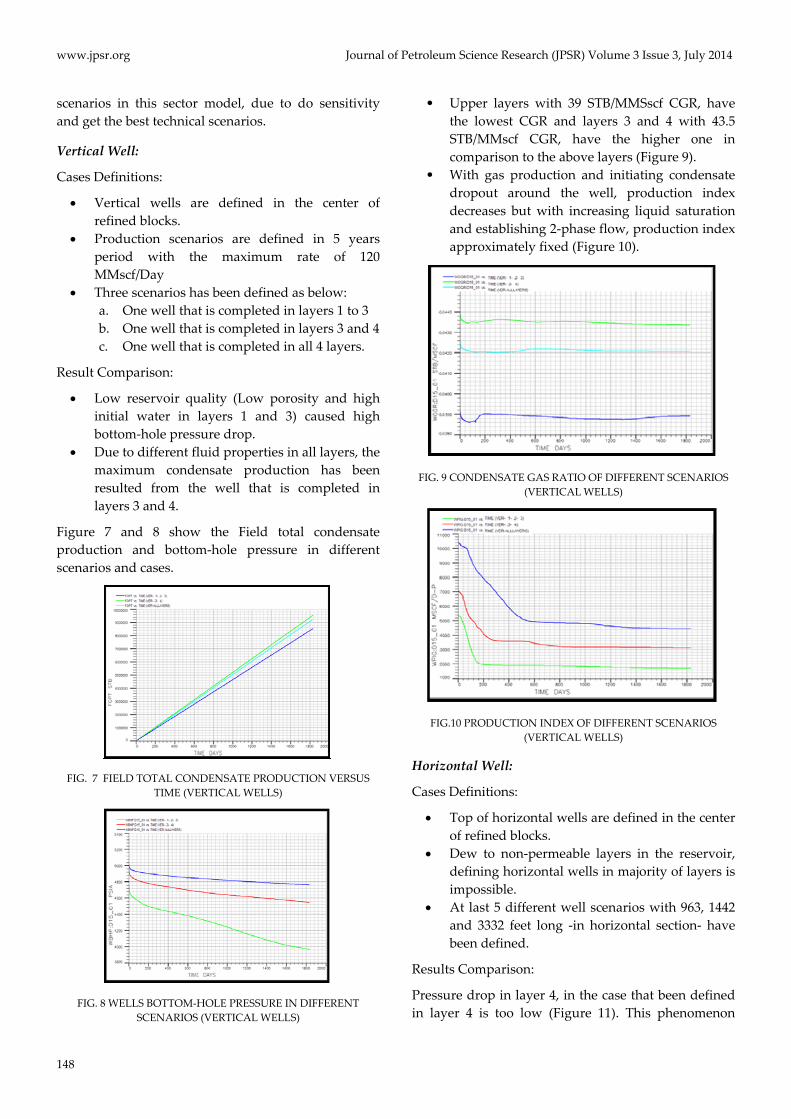
Figure 7 and 8 show the Field total condensate
production and bottom‐hole pressure in different
scenarios and cases.
FIG. 7 FIELD TOTAL CONDENSATE PRODUCTION VERSUS
TIME (VERTICAL WELLS)
FIG. 8 WELLS BOTTOM‐HOLE PRESSURE IN DIFFERENT
SCENARIOS (VERTICAL WELLS)
• Upper layers with 39 STB/MMSscf CGR, have
the lowest CGR and layers 3 and 4 with 43.5
STB/MMscf CGR, have the higher one in
comparison to the above layers (Figure 9).
• With gas production and initiating condensate
dropout around the well, production index
decreases but with increasing liquid saturation
and establishing 2‐phase flow, production index
approximately fixed (Figure 10).
FIG. 9 CONDENSATE GAS RATIO OF DIFFERENT SCENARIOS
(VERTICAL WELLS)
FIG.10 PRODUCTION INDEX OF DIFFERENT SCENARIOS
(VERTICAL WELLS)
Horizontal Well:
Cases Definitions:
Top of horizontal wells are defined in the center
of refined blocks.
Dew to non‐permeable layers in the reservoir,
defining horizontal wells in majority of layers is
impossible.
At last 5 different well scenarios with 963, 1442
and 3332 feet long ‐in horizontal section‐ have
been defined.
Results Comparison:
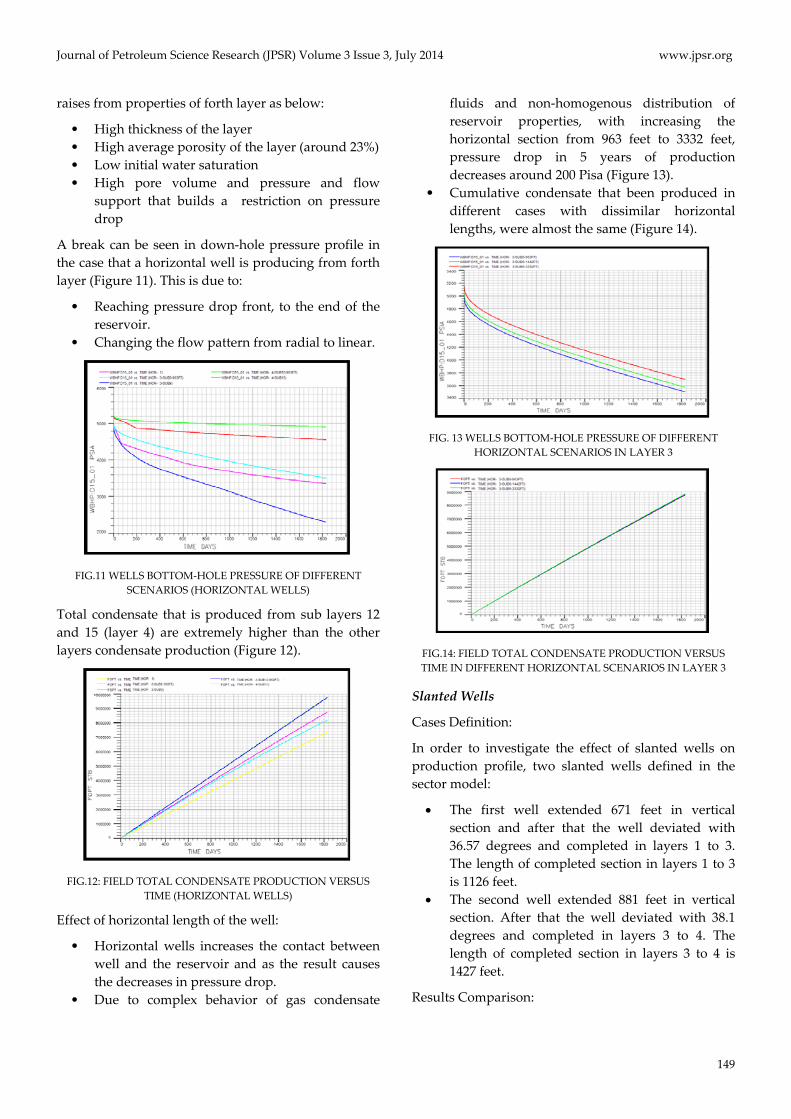
Pressure drop in layer 4, in the case that been defined
in layer 4 is too low (Figure 11). This phenomenon
Journal of Petroleum Science Research (JPSR) Volume 3 Issue 3, July 2014 www.jpsr.org
149
raises from properties of forth layer as below:
• High thickness of the layer
• High average porosity of the layer (around 23%)
• Low initial water saturation
• High pore volume and pressure and flow
support that builds a restriction on pressure
drop
A break can be seen in down‐hole pressure profile in
the case that a horizontal well is producing from forth
layer (Figure 11). This is due to:
• Reaching pressure drop front, to the end of the
reservoir.
• Changing the flow pattern from radial to linear.
FIG.11 WELLS BOTTOM‐HOLE PRESSURE OF DIFFERENT
SCENARIOS (HORIZONTAL WELLS)
Total condensate that is produced from sub layers 12
and 15 (layer 4) are extremely higher than the other
layers condensate production (Figure 12).
FIG.12: FIELD TOTAL CONDENSATE PRODUCTION VERSUS
TIME (HORIZONTAL WELLS)
Effect of horizontal length of the well:
• Horizontal wells increases the contact between
well and the reservoir and as the result causes
the decreases in pressure drop.
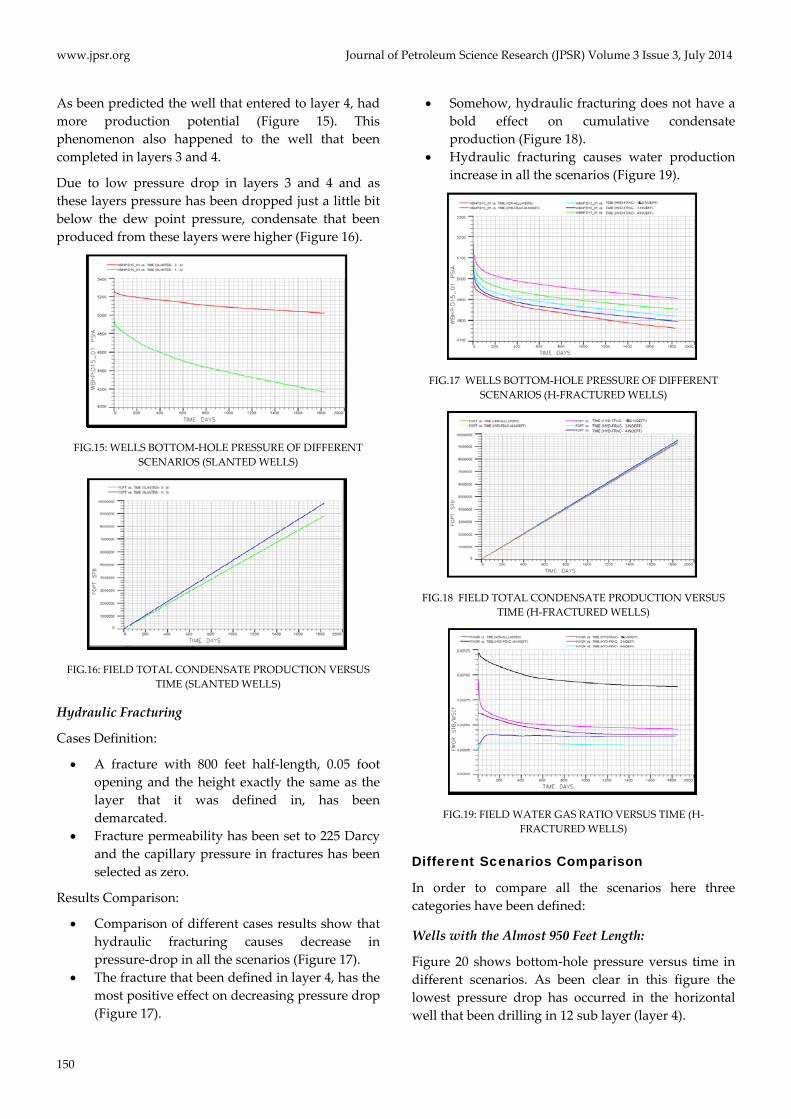
• Due to complex behavior of gas condensate
fluids and non‐homogenous distribution of
reservoir properties, with increasing the
horizontal section from 963 feet to 3332 feet,
pressure drop in 5 years of production
decreases around 200 Pisa (Figure 13).
• Cumulative condensate that been produced in
different cases with dissimilar horizontal
lengths, were almost the same (Figure 14).
FIG. 13 WELLS BOTTOM‐HOLE PRESSURE OF DIFFERENT
HORIZONTAL SCENARIOS IN LAYER 3
FIG.14: FIELD TOTAL CONDENSATE PRODUCTION VERSUS
TIME IN DIFFERENT HORIZONTAL SCENARIOS IN LAYER 3
Slanted Wells
Cases Definition:
In order to investigate the effect of slanted wells on
production profile, two slanted wells defined in the
sector model:
The first well extended 671 feet in vertical
section and after that the well deviated with
36.57 degrees and completed in layers 1 to 3.
The length of completed section in layers 1 to 3
is 1126 feet.
The second well extended 881 feet in vertical
section. After that the well deviated with 38.1
degrees and completed in layers 3 to 4. The
length of completed section in layers 3 to 4 is
1427 feet.
Results Comparison:
www.jpsr.org Journal of Petroleum Science Research (JPSR) Volume 3 Issue 3, July 2014
150
As been predicted the well that entered to layer 4, had
more production potential (Figure 15). This
phenomenon also happened to the well that been
completed in layers 3 and 4.
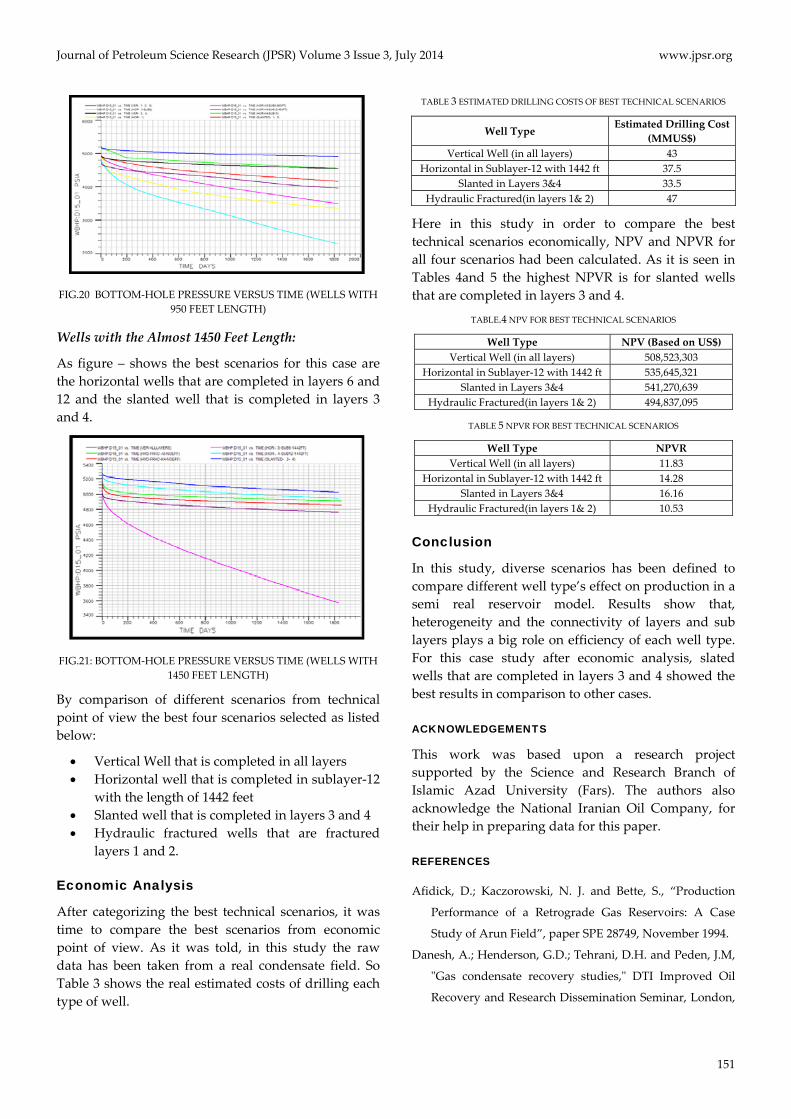
Due to low pressure drop in layers 3 and 4 and as
these layers pressure has been dropped just a little bit
below the dew point pressure, condensate that been
produced from these layers were higher (Figure 16).
FIG.15: WELLS BOTTOM‐HOLE PRESSURE OF DIFFERENT
SCENARIOS (SLANTED WELLS)
FIG.16: FIELD TOTAL CONDENSATE PRODUCTION VERSUS
TIME (SLANTED WELLS)
Hydraulic Fracturing
Cases Definition:
A fracture with 800 feet half‐length, 0.05 foot
opening and the height exactly the same as the
layer that it was defined in, has been
demarcated.
Fracture permeability has been set to 225 Darcy
and the capillary pressure in fractures has been
selected as zero.
Results Comparison:
Comparison of different cases results show that
hydraulic fracturing causes decrease in
pressure‐drop in all the scenarios (Figure 17).
The fracture that been defined in layer 4, has the
most positive effect on decreasing pressure drop
(Figure 17).
Somehow, hydraulic fracturing does not have a
bold effect on cumulative condensate
production (Figure 18).
Hydraulic fracturing causes water production
increase in all the scenarios (Figure 19).
FIG.17 WELLS BOTTOM‐HOLE PRESSURE OF DIFFERENT
SCENARIOS (H‐FRACTURED WELLS)
FIG.18 FIELD TOTAL CONDENSATE PRODUCTION VERSUS
TIME (H‐FRACTURED WELLS)
FIG.19: FIELD WATER GAS RATIO VERSUS TIME (H‐
FRACTURED WELLS)
Different Scenarios Comparison
In order to compare all the scenarios here three
categories have been defined:
Wells with the Almost 950 Feet Length:
Figure 20 shows bottom‐hole pressure versus time in
different scenarios. As been clear in this figure the
lowest pressure drop has occurred in the horizontal
well that been drilling in 12 sub layer (layer 4).
Journal of Petroleum Science Research (JPSR) Volume 3 Issue 3, July 2014 www.jpsr.org
151
FIG.20 BOTTOM‐HOLE PRESSURE VERSUS TIME (WELLS WITH
950 FEET LENGTH)
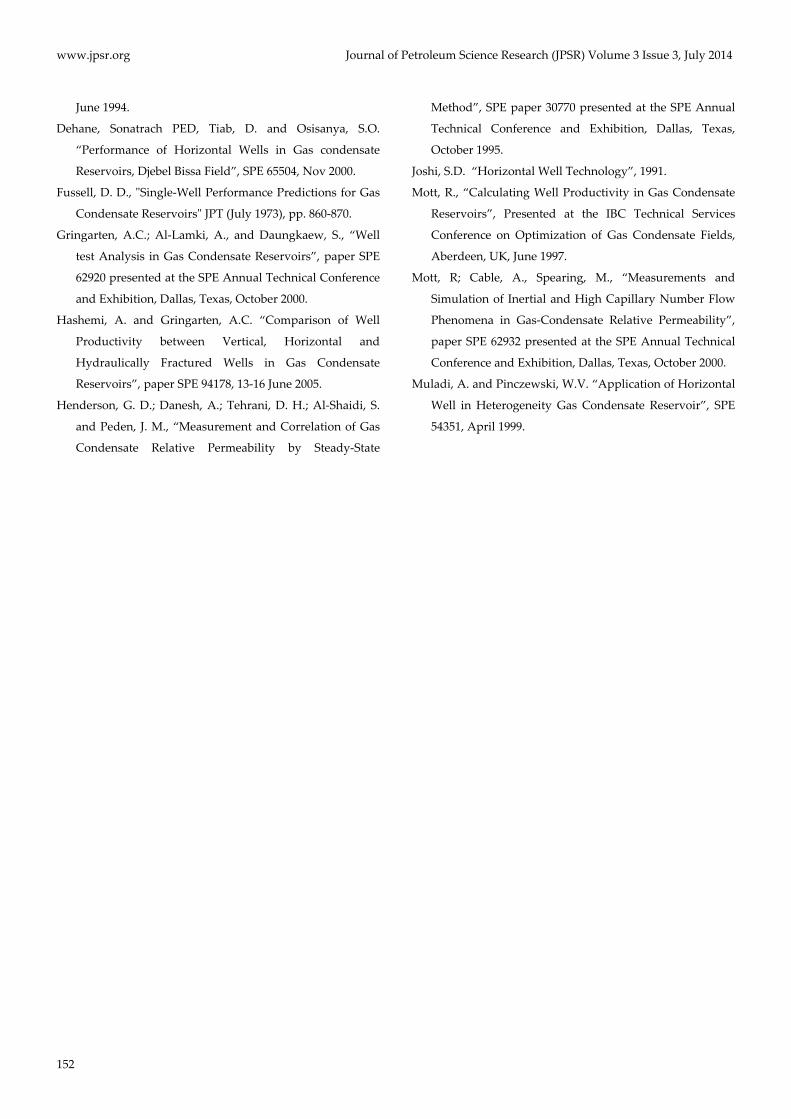
Wells with the Almost 1450 Feet Length:
As figure – shows the best scenarios for this case are
the horizontal wells that are completed in layers 6 and
12 and the slanted well that is completed in layers 3
and 4.
FIG.21: BOTTOM‐HOLE PRESSURE VERSUS TIME (WELLS WITH
1450 FEET LENGTH)
By comparison of different scenarios from technical
point of view the best four scenarios selected as listed
below:
Vertical Well that is completed in all layers
Horizontal well that is completed in sublayer‐12
with the length of 1442 feet
Slanted well that is completed in layers 3 and 4
Hydraulic fractured wells that are fractured
layers 1 and 2.
Economic Analysis
After categorizing the best technical scenarios, it was
time to compare the best scenarios from economic
point of view. As it was told, in this study the raw
data has been taken from a real condensate field. So
Table 3 shows the real estimated costs of drilling each
type of well.
TABLE 3 ESTIMATED DRILLING COSTS OF BEST TECHNICAL SCENARIOS
Well Type Estimated Drilling Cost
(MMUS$)
Vertical Well (in all layers) 43
Horizontal in Sublayer‐12 with 1442 ft 37.5
Slanted in Layers 3&4 33.5
Hydraulic Fractured(in layers 1& 2) 47
Here in this study in order to compare the best
technical scenarios economically, NPV and NPVR for
all four scenarios had been calculated. As it is seen in
Tables 4and 5 the highest NPVR is for slanted wells
that are completed in layers 3 and 4.
TABLE.4 NPV FOR BEST TECHNICAL SCENARIOS
Well Type NPV (Based on US$)
Vertical Well (in all layers) 508,523,303
Horizontal in Sublayer‐12 with 1442 ft 535,645,321
Slanted in Layers 3&4 541,270,639
Hydraulic Fractured(in layers 1& 2) 494,837,095
TABLE 5 NPVR FOR BEST TECHNICAL SCENARIOS
Well Type NPVR
Vertical Well (in all layers) 11.83
Horizontal in Sublayer‐12 with 1442 ft 14.28
Slanted in Layers 3&4 16.16
Hydraulic Fractured(in layers 1& 2) 10.53
Conclusion
In this study, diverse scenarios has been defined to
compare different well type’s effect on production in a
semi real reservoir model. Results show that,
heterogeneity and the connectivity of layers and sub
layers plays a big role on efficiency of each well type.
For this case study after economic analysis, slated
wells that are completed in layers 3 and 4 showed the
best results in comparison to other cases.
ACKNOWLEDGEMENTS
This work was based upon a research project
supported by the Science and Research Branch of
Islamic Azad University (Fars). The authors also
acknowledge the National Iranian Oil Company, for
their help in preparing data for this paper.
REFERENCES
Afidick, D.; Kaczorowski, N. J. and Bette, S., “Production
Performance of a Retrograde Gas Reservoirs: A Case
Study of Arun Field”, paper SPE 28749, November 1994.
Danesh, A.; Henderson, G.D.; Tehrani, D.H. and Peden, J.M,
ʺGas condensate recovery studies,ʺ DTI Improved Oil
Recovery and Research Dissemination Seminar, London,
www.jpsr.org Journal of Petroleum Science Research (JPSR) Volume 3 Issue 3, July 2014
152
June 1994.
Dehane, Sonatrach PED, Tiab, D. and Osisanya, S.O.
“Performance of Horizontal Wells in Gas condensate
Reservoirs, Djebel Bissa Field”, SPE 65504, Nov 2000.
Fussell, D. D., ʺSingle‐Well Performance Predictions for Gas
Condensate Reservoirsʺ JPT (July 1973), pp. 860‐870.
Gringarten, A.C.; Al‐Lamki, A., and Daungkaew, S., “Well
test Analysis in Gas Condensate Reservoirs”, paper SPE
62920 presented at the SPE Annual Technical Conference
and Exhibition, Dallas, Texas, October 2000.
Hashemi, A. and Gringarten, A.C. “Comparison of Well
Productivity between Vertical, Horizontal and
Hydraulically Fractured Wells in Gas Condensate
Reservoirs”, paper SPE 94178, 13‐16 June 2005.
Henderson, G. D.; Danesh, A.; Tehrani, D. H.; Al‐Shaidi, S.
and Peden, J. M., “Measurement and Correlation of Gas
Condensate Relative Permeability by Steady‐State
Method”, SPE paper 30770 presented at the SPE Annual
Technical Conference and Exhibition, Dallas, Texas,
October 1995.
Joshi, S.D. “Horizontal Well Technology”, 1991.
Mott, R., “Calculating Well Productivity in Gas Condensate
Reservoirs”, Presented at the IBC Technical Services
Conference on Optimization of Gas Condensate Fields,
Aberdeen, UK, June 1997.
Mott, R; Cable, A., Spearing, M., “Measurements and
Simulation of Inertial and High Capillary Number Flow
Phenomena in Gas‐Condensate Relative Permeability”,
paper SPE 62932 presented at the SPE Annual Technical
Conference and Exhibition, Dallas, Texas, October 2000.
Muladi, A. and Pinczewski, W.V. “Application of Horizontal
Well in Heterogeneity Gas Condensate Reservoir”, SPE
54351, April 1999.