investigating the use of printed circuit board leach
TRANSCRIPT

Investigating the use of printed circuit
board leach residue as reductant in
pyrometallurgical operations
by
Desmond Attah-Kyei
Thesis presented in partial fulfilment
of the requirements for the Degree
of
MASTER OF ENGINEERING
(EXTRACTIVE METALLURGICAL ENGINEERING)
in the Faculty of Engineering
at Stellenbosch University
Supervisor
Prof. G. Akdogan
Co-Supervisor
Prof. C. Dorfling
April 2019

i
Declaration
By submitting this thesis electronically, I declare that the entirety of the work contained therein
is my own, original work, that I am the sole author thereof (save to the extent explicitly
otherwise stated), that reproduction and publication thereof by Stellenbosch University will not
infringe any third party rights and that I have not previously in its entirety or in part submitted
it for obtaining any qualification.
Date: April 2019
Copyright © 2019 Stellenbosch University
All rights reserved
Stellenbosch University https://scholar.sun.ac.za
ii
Plagiarism Declaration
1. Plagiarism is the use of ideas, material and other intellectual property of another’s work and to
present is as my own.
2. I agree that plagiarism is a punishable offence because it constitutes theft.
3. I also understand that direct translations are plagiarism.
4. Accordingly all quotations and contributions from any source whatsoever (including the
internet) have been cited fully. I understand that the reproduction of text without quotation
marks (even when the source is cited) is plagiarism.
5. I declare that the work contained in this assignment, except where otherwise stated, is my
original work and that I have not previously (in its entirety or in part) submitted it for grading
in this module/assignment or another module/assignment.
Student number: 21537992
Initials and surname: D. Attah-Kyei
Signature:
Date: April 2019
Stellenbosch University https://scholar.sun.ac.za
iii
Abstract
In recent years, there has been an increase in the generation of waste electrical and electronic
equipment (WEEE) due to the advancement of technology. In addition to the environmental
benefits of recycling electronic waste (e-waste), it also provides certain economic value. Printed
circuit board (PCB) is the main focus of electronic waste because of the inherently high value
of contained metals such as gold, silver and copper. Hydrometallurgical processes, consisting
of several leaching stages, are often the most preferred option for the recovery of metals from
PCB waste. However, hydrometallurgy does not address the issue of non-metallic PCB
fractions that may end up being dumped at landfill sites or incinerated. It is important to reduce
the environmental impact and gain value from both the metallic and non-metallic fractions of
PCB waste.
Several options for treatment of the non-metallic fraction including material recycling, where
the residue may be used as inclusions in concrete or asphalt materials with minimal processing
or chemical recycling, where chemicals and fuels are produced from the residue using
techniques such as pyrolysis exist. Due to the complex composition of PCB leach residue,
recovery by thermal treatment is likely to be the most feasible process route from technical and
economical perspectives.
In this study, the utilisation of the non-metallic PCB waste fraction as reductant in primary
metal smelting operations and solid state reduction was investigated. The organic component
as well as the ash composition of the PCB were characterised using Fourier transform infrared
spectroscopy (FTIR) and X-ray fluorescence spectroscopy (XRF) respectively. Proximate
analysis on the PCB revealed the ash and volatile matter contents being 40.1% and 44.8%,
which is higher than coal used in reductive smelting operations. The elemental analysis showed
carbon and oxygen content of 30.43% and 20.72% respectively.
Thermodynamic modelling of chromite and iron smelting were performed using various blends
of PCB and coal. The models showed that PCB residue might be used to partially replace the
conventional reductants. The study revealed that in chromite smelting the optimal blend
contains around 20 wt% PCB residue, with energy savings of 200 kWh/t of ore to achieve the
same metal recovery.
Laboratory-scale experiments simulating solid state reduction of hematite (Fe2O3) was also
performed using various blends of PCB and graphitic carbon. The tests were carried out in a
Differential Scanning Calorimeter (DSC) from ambient temperature to 1200℃ as well as in
Stellenbosch University https://scholar.sun.ac.za

iv
Single particle reactor (SPR) at 900℃ and 1000℃. The product of each test was analysed using
scanning electron microscope (SEM) and X-ray powder diffraction (XRD). The degree of
reduction calculated from the mass lost during the test showed that PCB acts as better reductant
at lower temperatures. However, at higher temperatures the advantage shift towards carbon.
Stellenbosch University https://scholar.sun.ac.za

v
Abstrak
In die laaste jare is daar ’n verhoging in die generasie van elektriese afval en elektroniese
toerusting (WEEE) as gevolg van die verbetering van tegnologie. Buiten die
omgewingsvoordele van die herwinning van elektroniese afval (e-afval), bied dit ook sekere
ekonomiese waarde. Gedrukte stroombaanbord (PCB) is die hooffokus van elektroniese afval
as gevolg van die inherente hoë waarde metale, soos goud, silwer en koper, wat daarin bevat
word. Hidrometallurgiese prosesse, wat uit verskeie uitlogingfases bestaan, is dikwels die mees
gewenste opsie vir die herwinning van metale uit PCB-afval. Hidrometallurgie spreek egter nie
die probleem van nie-metaal PCB-fraksies wat op die ashoop kan beland, of veras kan word,
aan nie. Dit is belangrik om die omgewingsimpak te verminder en waarde te kry uit beide die
metaal en nie-metaalfraksies van PCB-afval.
Verskeie opsies bestaan vir die behandeling van die nie-metaalfraksies, insluitend materiaal
herwinning waar die residu gebruik kan word as deel van beton of asfaltmateriaal met minimale
prosessering of chemiese herwinning, of waar chemikalieë en brandstowwe vervaardig word
uit die residu deur tegnieke soos piroliese te gebruik. As gevolg van die komplekse samestelling
van PCB loogresidu, is herwinning deur termobehandeling waarskynlik die mees uitvoerbare
prosesroete vanuit tegniese en ekonomiese oogpunte.
In hierdie studie is die gebruik van die nie-metaal PCB-afvalfraksies as reduseermiddel in
primêre metaal smelting bedrywighede en vaste toestand reduksie ondersoek. Die organiese
komponente sowel as die as-samestelling van die PCB is gekarakteriseer deur Fourier transform
infrarooi spektroskopie (FTIR) en X-straal-fluoressensiespektroskopie (XRF), onderskeidelik,
te gebruik. Kort analise op die PCB het gewys dat die as en vlugtige materie-inhoud 40.1% en
44.8% is, wat hoër is as die steenkool wat gebruik word in reduserende smelting bedrywighede.
Die elementanalise het koolstof- en suurstofinhoud van 30.43% en 20.72%, onderskeidelik,
gewys.
Termodinamiese modellering van chromiet en yster smelting is gedoen deur verskeie
vermengings van PCB en steenkool te gebruik. Die modelle het gewys dat PCB-residu gebruik
kan word om die konvensionele reduseermiddels gedeeltelik te vervang. Die studie het gewys
dat in chromiet smelting, die optimale vermenging rondom 20 wt.% PCB-residu bevat, met
energiebesparings van 200 kWh/t van erts om dieselfde metaalherwinning te bereik.
Eksperimente is op laboratoriumskaal uitgevoer wat vaste toestand reduksie van hematiet
(Fe2O3) simuleer deur verskillende vermengings van PCB en grafitiese koolstof. Die toetse is
Stellenbosch University https://scholar.sun.ac.za
vi
uitgevoer in ’n Differensiaal Skandeerder Kalorimeter (DSC) van omgewingstemperatuur tot
1200 °C sowel as in Enkel partikel reaktor (SPR) by 900 °C en 1000 °C. Die produk van elke
toets is geanaliseer deur ’n skandeerder elektron mikroskoop (SEM) en X-straal-
poeierdiffraksie (XRD) te gebruik. Die grade van reduksie wat bereken is uit die massa wat
verlore gegaan het gedurende die toets het gewys dat PCB as ’n beter reduseermiddel optree by
laer temperature. By hoër temperature skuif die voordeel egter na koolstof.
Stellenbosch University https://scholar.sun.ac.za

vii
Acknowledgement
I would like to express my gratitude and appreciation to the following:
Almighty God for His grace and protection
My supervisors, Prof Akdogan and Prof Dorfling for their technical advice, guidance
and support
Staff at Pyromet division at Mintek especially Marcus and Quinn for their support
Students and Staff at Ex Mente Technologies especially Johan, Marinda, Nigel and
Zane
Students and staff at Åbo Akademi especially Prof Lindberg
My family, colleagues and friends especially Prince and Pat.
Stellenbosch University https://scholar.sun.ac.za
viii
Table of Contents
Declaration .............................................................................................................................. i
Plagiarism Declaration ........................................................................................................... ii
Abstract ................................................................................................................................. iii
Abstrak ................................................................................................................................... v
Acknowledgement ................................................................................................................ vii
Table of Contents ................................................................................................................ viii
List of Figures ...................................................................................................................... xii
List of Tables ....................................................................................................................... xvi
List of Abbreviations ......................................................................................................... xviii
1 Introduction ............................................................................................................................. 1
1.1 Statement of Research Problem ....................................................................................... 1
1.2 Background ...................................................................................................................... 1
1.3 Aims and Objectives ........................................................................................................ 2
1.4 Thesis Outline .................................................................................................................. 2
2 Literature Review .................................................................................................................... 3
2.1 Introduction ...................................................................................................................... 3
2.2 Composition of PCB ........................................................................................................ 5
2.3 Disposal of PCB ............................................................................................................... 6
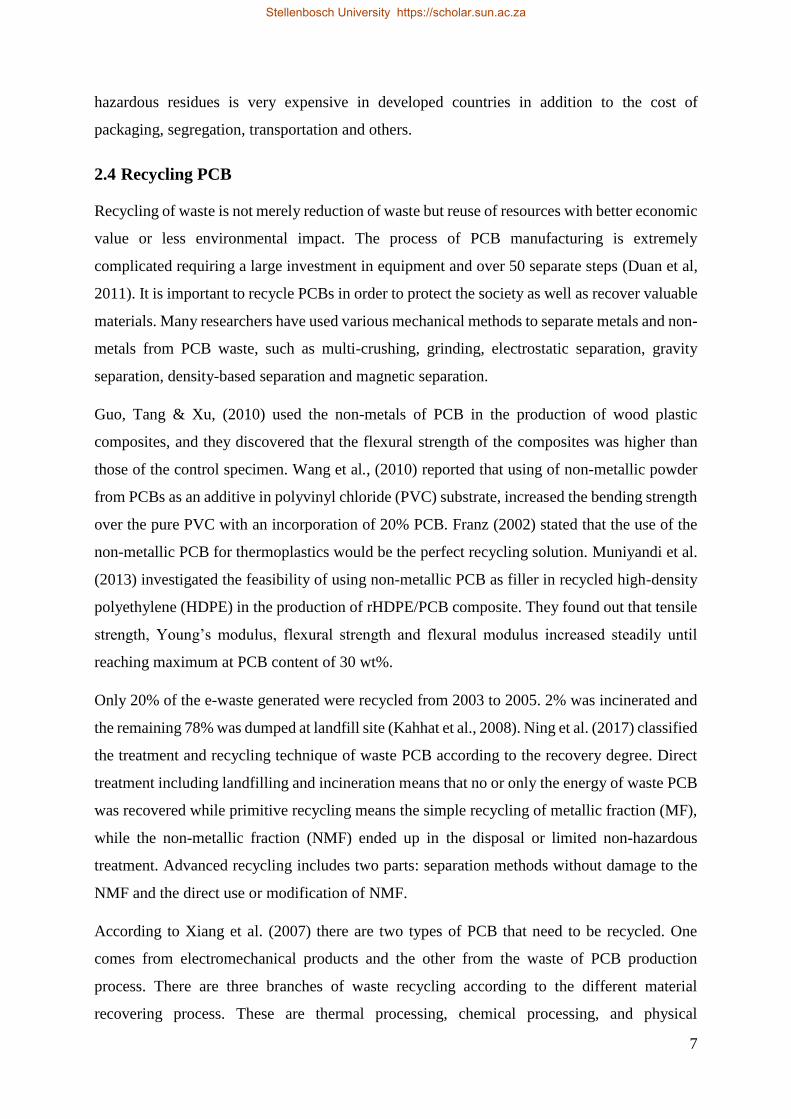
2.4 Recycling PCB ................................................................................................................. 7
2.4.1 Physical Recycling .................................................................................................... 8
2.4.2 Chemical Recycling .................................................................................................. 9
2.4.3 Thermal Recycling .................................................................................................. 11
2.4.4 Thermal Behaviour of PCB ..................................................................................... 12
2.5 Polymer Waste as a Reductant in Pyrometallurgy ......................................................... 13
3 Experimental Methods .......................................................................................................... 17
3.1 Treatment of PCB ........................................................................................................... 17
Stellenbosch University https://scholar.sun.ac.za
ix
3.1.1 Dismantling ............................................................................................................. 17
3.1.2 Size Reduction ......................................................................................................... 17
3.1.3 Leaching of PCB ..................................................................................................... 18
3.1.3.1 Equipment ........................................................................................................ 19
3.1.3.2 Procedure .......................................................................................................... 20
3.2 Characterization of the PCB residue .............................................................................. 20
3.2.1 Proximate Analysis ................................................................................................. 20
3.2.2 Ultimate Analysis .................................................................................................... 21
3.2.3 Scanning Electron Microscope ................................................................................ 21
3.2.4 X-ray Diffraction ..................................................................................................... 22
3.2.5 X-ray Fluorescence ................................................................................................. 22
3.2.6 Fourier transform infrared spectroscopy ................................................................. 23
3.3 Thermal Treatment and Analysis ................................................................................... 24
3.3.1 Differential Scanning Calorimetry .......................................................................... 24
3.3.2 Thermogravimetric Analysis ................................................................................... 24
3.3.3 Mass Spectrometry .................................................................................................. 25
3.3.4 Reduction Tests ....................................................................................................... 25
3.3.4.1 Materials ........................................................................................................... 25
3.3.4.2 Procedure .......................................................................................................... 25
3.3.4.3 DSC-TGA ......................................................................................................... 26
3.3.4.4 Single Particle Reactor ..................................................................................... 27
3.4 Thermodynamic Simulations ......................................................................................... 29
3.4.1 EMSIM .................................................................................................................... 29
3.4.2 FactSage .................................................................................................................. 30
4 Results and Discussion .......................................................................................................... 32
4.1 PCB Leach Residue Characterization ............................................................................ 32
4.2 Thermal Behaviour of Reagents ..................................................................................... 37
Stellenbosch University https://scholar.sun.ac.za
x
4.3 Hematite reduction in DSC-TGA under Non-Isothermal Conditions ............................ 40
4.3.1 Hematite Reduction with Graphite .......................................................................... 40
4.3.2 Hematite Reduction with PCB only ........................................................................ 41
4.3.3 Hematite Reduction with PCB-Graphite Blends ..................................................... 43
4.3.4 Reduction Degree .................................................................................................... 45
4.3.5 SEM Analysis on the Products ................................................................................ 46
4.4 Hematite Reduction under Isothermal Conditions ......................................................... 48
4.4.1 Reduction in DSC-TGA .......................................................................................... 48
4.4.2 Reduction Tests in SPR ........................................................................................... 50
4.4.2.1 Reduction in SPR at 900℃ .............................................................................. 50
4.4.2.2 Reduction in SPR at 1000℃ ............................................................................ 53
4.5 FactSage Simulations of Hematite Reduction ................................................................ 56
4.6 EMSIM Simulations ....................................................................................................... 59
4.6.1 Chromite Smelting .................................................................................................. 59
4.6.2 Iron Smelting ........................................................................................................... 61
4.6.3 Smelting with Equivalent Total Mass of Carbon Content in PCB and Coal .......... 63
4.6.3.1 Chromite Smelting ........................................................................................... 64
4.6.3.2 Iron Smelting .................................................................................................... 65
4.6.4 Effect of Temperature ............................................................................................. 67
4.6.5 Effect of Oxygen Present in PCB ............................................................................ 68
5 Conclusions and Recommendations ...................................................................................... 71
Contribution ......................................................................................................................... 73
6 List of References .................................................................................................................. 74
Appendices ............................................................................................................................... 84
Appendix A. EMSIM Simulations ........................................................................................... 84
Appendix A.1 Creating EMSIM Models ............................................................................. 84
Appendix A.2 EMSIM Simulations for Iron Smelting ........................................................ 88
Stellenbosch University https://scholar.sun.ac.za

xi
Appendix B. Reduction of Hematite ...................................................................................... 100
Appendix B.1 Mechanism of Solid State Reduction of Hematite at High Temperatures .. 100
Appendix B.2 Repeatability of Reduction Tests ................................................................ 102
Appendix B.3 Calculation of Reduction Degree ................................................................ 107
Appendix C. XRF full Scan of PCB ...................................................................................... 109
Appendix D. XRD Patterns from products of hematite reduction in SPR ............................. 111
Stellenbosch University https://scholar.sun.ac.za
xii
List of Figures
Figure 2.1: Global e-waste generation from 2010 to 2018 (data source (Baldé et al., 2015)) ... 4
Figure 2.2: A block diagram showing the physical recycling of PCB (Sohaili, Muniyandi &
Mohamad, 2012; Khaliq et al., 2014) ......................................................................................... 9
Figure 2.3: Thermogravimetric profile during the pyrolysis and combustion of PCB (Quan, Li,
& Gao, 2013) ............................................................................................................................ 13
Figure 3.1: Schematic representation of procedure used for size reduction (Albertyn, 2017) 17
Figure 3.2: (a) printed circuit board (PCB); (b) Desoldered PCB; (c) crushed PCB ............... 18
Figure 3.3: Schematic representation of procedure for metal leaching .................................... 18
Figure 3.4: Equipment used for leaching ................................................................................. 19
Figure 3.5: Schematic diagram of DSC-TGA coupled with QMS used for the reduction of
hematite .................................................................................................................................... 26
Figure 3.6: Schematic diagram of SPR used for the reduction of hematite ............................. 28
Figure 3.7: 6 basic steps for setting up and simulating a thermodynamic model in FactSage 31
Figure 4.1: XRD pattern of PCB leach residue ........................................................................ 35
Figure 4.2: SEM images of PCB leach residue (a) with spectrum labels; (b) without spectrum
label .......................................................................................................................................... 35
Figure 4.3: FTIR of PCB leach residue .................................................................................... 36
Figure 4.4: Thermal analysis Hematite only ............................................................................ 37
Figure 4.5: Thermal analysis of graphite only ......................................................................... 37
Figure 4.6: Thermal analysis of PCB only ............................................................................... 38
Figure 4.7: Composition of off-gas during thermal analysis of PCB....................................... 39
Figure 4.8: Off-gases produced with lower ion current ........................................................... 39
Figure 4.9: Thermal analysis of graphite and 20%PCB ........................................................... 40
Figure 4.10: Reduction of Hematite with Graphite .................................................................. 41
Figure 4.11: Reduction of Hematite with 100%PCB ............................................................... 42
Figure 4.12: Hydrocarbons present in off-gas during hematite reduction with 100%PCB ..... 42
Figure 4.13: Reduction of Hematite with 20% PCB ................................................................ 43
Figure 4.14: Reduction of Hematite with 40% PCB ................................................................ 44
Figure 4.15: Reduction of Hematite with 80% PCB ................................................................ 44
Figure 4.16: Reduction degree ................................................................................................. 45
Figure 4.17: SEM images of (A) Hematite-Graphite; (B):Hematite-100%PCB; (C) Hematite-
20PCB; (D) Hematite-40PCB .................................................................................................. 47
Stellenbosch University https://scholar.sun.ac.za
xiii
Figure 4.18: Reduction of hematite with graphite under isothermal conditions at 900℃ ....... 48
Figure 4.19: Reduction of hematite with 100%PCB with isothermal conditions at 900℃ ..... 48
Figure 4.20: Reduction of hematite with graphite with isothermal conditions at 1000℃ ....... 49
Figure 4.21: Reduction of hematite with 100%PCB with isothermal conditions at 1000℃ ... 49
Figure 4.22: Volume percent of CO and CO2 in off-gas during reduction of hematite with
Graphite at 900℃ ..................................................................................................................... 50
Figure 4.23: Volume percent of CO and CO2 in off-gas during reduction of hematite with 20%
PCB at 900℃ ........................................................................................................................... 51
Figure 4.24: Volume percent of CO and CO2 in off-gas during reduction of hematite with 40%
PCB at 900℃ ........................................................................................................................... 52
Figure 4.25: Volume percent of CO and CO2 in off-gas during reduction of hematite with 80%
PCB at 900℃ ........................................................................................................................... 52
Figure 4.26: Volume percent of CO and CO2 in off-gas during reduction of hematite with
100%PCB at 900℃ .................................................................................................................. 52
Figure 4.27: Volume percent of CO and CO2 in off-gas during reduction of hematite with
Graphite at 1000℃ ................................................................................................................... 53
Figure 4.28: Volume percent of CO and CO2 in off-gas during reduction of hematite with
20%PCB at 1000℃ .................................................................................................................. 54
Figure 4.29: Volume percent of CO and CO2 in off-gas during reduction of hematite with
40%PCB at 1000℃ .................................................................................................................. 54
Figure 4.30: Volume percent of CO and CO2 in off-gas during reduction of hematite with
80%PCB at 1000℃ .................................................................................................................. 55
Figure 4.31: Volume percent of CO and CO2 in off-gas during reduction of hematite with
100%PCB at 1000℃ ................................................................................................................ 55
Figure 4.32: Mass fraction of products obtained from FactSage calculation during the reduction
of hematite with graphite. ........................................................................................................ 56
Figure 4.33: Mass fraction of products obtained from FactSage calculation during the reduction
of hematite with 20%PCB ....................................................................................................... 57
Figure 4.34: Mass fraction of products obtained from FactSage calculation during the reduction
of hematite with 40%PCB ....................................................................................................... 57
Figure 4.35: Mass fraction of products obtained from FactSage calculation during the reduction
of hematite with 80%PCB ....................................................................................................... 58
Figure 4.36: Mass fraction of products obtained from FactSage calculation during the reduction
of hematite with 100%PCB ..................................................................................................... 58
Stellenbosch University https://scholar.sun.ac.za

xiv
Figure 4.37: Metal recovery and energy required for chromite smelting ................................ 59
Figure 4.38: Products of chromite smelting ............................................................................. 60
Figure 4.39: Mass flowrate of gases during chromite smelting ............................................... 60
Figure 4.40: Metal recovery and energy required for iron smelting ........................................ 62
Figure 4.41: Products of iron smelting ..................................................................................... 62
Figure 4.42: Mass flowrate of gases during Iron smelting ....................................................... 63
Figure 4.43: Metal recovery and energy required for chromite smelting ................................ 64
Figure 4.44: Products of chromite smelting ............................................................................. 65
Figure 4.45: Mass flowrate of gases during chromite smelting ............................................... 65
Figure 4.46: Metal recovery and energy required for iron smelting ........................................ 66
Figure 4.47: Products of iron smelting ..................................................................................... 66
Figure 4.48: Mass flowrate of gases in off-gas during iron smelting ...................................... 67
Figure 4.49: Iron recovery at different temperatures ............................................................... 68
Figure 4.50: Energy required at different temperatures ........................................................... 68
Figure 4.51: Effect of oxygen in PCB on the metal recovery .................................................. 69
Figure 4.52: Effect of oxygen in PCB on the slag produced .................................................... 70
Figure 4.53: Effect of oxygen in PCB on the CO2 present in off-gas ...................................... 70
Figure A.1: Creating a new model ........................................................................................... 84
Figure A.2: Composition of Iron ore ........................................................................................ 84
Figure A.3: Composition of Reducing agents .......................................................................... 85
Figure A.4: Ambient parameters .............................................................................................. 85
Figure A.5: Smelting conditions .............................................................................................. 86
Figure A.6: Flowsheet for smelting operation ......................................................................... 86
Figure A.7: Metal recovery and energy required for iron reduction at 1200℃ ....................... 88
Figure A.8: Metal recovery and energy required for iron reduction at 1100℃ ....................... 88
Figure A.9: Metal recovery and energy required for iron reduction at 1000℃ ....................... 88
Figure A.10: Metal recovery and energy required for iron reduction at 900℃ ....................... 89
Figure A.11: Products of iron reduction at 1200℃ .................................................................. 89
Figure A.12: Products of iron reduction at 1100℃ .................................................................. 89
Figure A.13: Products of iron reduction at 1000℃ .................................................................. 90
Figure A.14: Products of iron reduction at 900℃ .................................................................... 90
Figure A.15: Mass flowrate of gases during iron reduction at 1200℃ .................................... 91
Figure A.16: Mass flowrate of gases during iron reduction at 1100℃ .................................... 91
Figure A.17: Mass flowrate of gases during iron reduction at 1000℃ .................................... 91
Stellenbosch University https://scholar.sun.ac.za

xv
Figure A.18: Mass flowrate of gases during iron reduction at 900℃ ...................................... 92
Figure B.1: Mechanism for the reduction hematite to iron reported by Chen et al., (2017) .. 100
Figure B.2: Mass of sample during hematite-graphite reduction ........................................... 102
Figure B.3: Mass of sample during hematite-20%PCB reduction ......................................... 102
Figure B.4: Mass of sample during hematite-40%PCB reduction ......................................... 103
Figure B.5: Mass of sample during hematite-80%PCB reduction ......................................... 103
Figure B.6: Mass of sample during hematite-100%PCB reduction ....................................... 103
Figure C.1: XRF scan from angle 16 (2θ) to 110 (2θ), using LiF 220 crystal ....................... 109
Figure C.2: XRF scan from angle 56 (2θ) to 140 (2θ), using LiF 200 crystal ....................... 109
Figure C.3: XRF scan from angle 0 (2θ) to 160 (2θ), using Ge crystal ................................. 109
Figure C.4: XRF scan from angle 105 (2θ) to 146 (2θ), using PE crystal ............................. 110
Figure C.5: XRF scan from angle 17 (2θ) to 60 (2θ), using PX1 crystal. .............................. 110
Figure D.1: XRD pattern from hematite-graphite reduction at 900℃ ................................... 111
Figure D.2: XRD pattern from hematite-40%PCB reduction at 900℃ ................................. 111
Figure D.3: XRD pattern from hematite-80%PCB reduction at 900℃ ................................. 111
Figure D.4: XRD pattern from hematite-100%PCB reduction at 900℃ ............................... 112
Figure D.5: XRD pattern from hematite-graphite reduction at 1000℃ ................................. 112
Figure D.6: XRD pattern from hematite-40%PCB reduction at 1000℃ ............................... 112
Figure D.7: XRD pattern from hematite-80%PCB reduction at 1000℃ ............................... 113
Figure D.8: XRD pattern from hematite-100%PCB reduction at 1000℃ ............................. 113
Stellenbosch University https://scholar.sun.ac.za
xvi
List of Tables
Table 2.1: Composition of PCB ................................................................................................. 6
Table 3.1: Experimental parameters for leaching .................................................................... 18
Table 3.2: Components of Leaching set-up ............................................................................ 19
Table 3.3: Information of chemicals used for reduction .......................................................... 25
Table 3.4: Mass of chemicals used in each blend .................................................................... 26
Table 3.5: Composition of Chromite ore used for smelting (Ex Mente, 2018) ....................... 29
Table 3.6: Composition of Iron ore used for smelting (Sohn & Fruehan, 2005) ..................... 29
Table 3.7: Properties of Coal (Kleynhans et al., 2017) ............................................................ 29
Table 4.1: Ultimate analysis of PCB leach residue (wt%) ....................................................... 32
Table 4.2: Proximate analysis of PCB leach residue (wt%) .................................................... 32
Table 4.3: Ash content of PCB leach residue using ICP-OES (wt%) ...................................... 34
Table 4.4: Halide Content and calorific value of PCB leach residue ....................................... 34
Table 4.5: XRF results of PCB leach residue (wt%) ................................................................ 35
Table 4.6: Composition and weight percent of elements in the PCB grains ............................ 36
Table 4.7: XRD results of products from reduction of hematite in SPR at 900℃ .................. 53
Table 4.8: XRD results of products from reduction of hematite in SPR at 1000℃ ................ 55
Table 4.9: Blends containing 300kg/h of equivalent carbon used in smelting simulation ....... 63
Table 4.10: Representations used in studying the effect of oxygen ......................................... 69
Table A.1: Energy Nodes for EMSIM flow sheet components ............................................... 87
Table A.2: Material Nodes for EMSIM flow sheet components ............................................ 87
Table A.3: Mass balance for chromite smelting ...................................................................... 93
Table A.4: Mass balance for Iron smelting at 1700℃ ............................................................. 93
Table A.5: Mass balance iron reduction at 1200℃ .................................................................. 94
Table A.6: Mass balance iron reduction at 1100℃ .................................................................. 94
Table A.7: Mass balance iron reduction at 1000℃ .................................................................. 95
Table A.8: Mass balance iron reduction at 900℃ .................................................................... 95
Table A.9: Energy balance for chromite smelting ................................................................... 96
Table A.10: Energy balance for iron smelting at 1700℃ ........................................................ 97
Table A.11: Energy balance iron reduction at 1200℃ ............................................................ 97
Table A.12: Energy balance iron reduction at 1100℃ ............................................................ 98
Table A.13: Energy balance iron reduction at 1000℃ ............................................................ 98
Table A.14: Energy balance iron reduction at 900℃ .............................................................. 99
Stellenbosch University https://scholar.sun.ac.za

xvii
Table B.1: Standard deviation at selected temperatures during Hematite-Graphite Reduction
................................................................................................................................................ 104
Table B.2: Standard deviation at selected temperatures during Hematite-20%PCB Reduction
................................................................................................................................................ 104
Table B.3: Standard deviation at selected temperatures during Hematite- 40%PCB Reduction
................................................................................................................................................ 105
Table B.4: Standard deviation at selected temperatures during Hematite- 80%PCB Reduction
................................................................................................................................................ 105
Table B.5: Standard deviation at selected temperatures during Hematite-100%PCB Reduction
................................................................................................................................................ 106
Table B.6: Average standard deviation of mass loss during hematite reduction ................... 107
Table D.1: Reference codes representing each compound in XRD patterns ......................... 113
Stellenbosch University https://scholar.sun.ac.za
xviii
List of Abbreviations
BFR Brominated flame retardant
DSC Differential Scanning Calorimetry
DTA Differential Thermal Analysis
EDS Energy Dispersive X-Ray Spectrometer
E- waste Electronic waste
EEE Electrical and Electronic Equipment
FTIR Fourier transform infrared spectroscopy
HDPE High Density Polyethylene
ICP-OES Inductively coupled plasma optical emission spectroscopy
LOI Loss on Ignition
MF Metallic fraction
NMF Non-metallic fraction
PBDE Polybrominated diphenyl ethers
PCB Printed Circuit Board
PE Polyethylene
PET Polyethylene terephthalate
PP Polypropylene
PS Polystyrene
PVC Polyvinyl chloride
PU Polyurethane
SEM Scanning Electron Microscopy
SPR Single Particle reactor
TBBPA Tetrabromobisphenol-A
Stellenbosch University https://scholar.sun.ac.za

xix
TCD Thermal conductivity detector
TGA Thermogravimetric Analysis
WEEE Waste from electrical and electronic equipment
XRD X-ray powder diffraction spectroscopy
XRF X-ray fluorescence spectroscopy
Stellenbosch University https://scholar.sun.ac.za
1
1 Introduction
1.1 Statement of Research Problem
Printed circuit boards (PCBs) are often the focus of electronic waste recycling operations
because of the inherently high value contained in metals such as gold and copper that are present
in the PCBs. Hydrometallurgical processes, which typically consist of multiple leaching stages
to selectively dissolve metals from the PCBs, are the preferred processing method for small
scale recycling operations where the expected waste treatment rate would not justify the high
capital and operating costs associated with a dedicated smelter. However, these
hydrometallurgical processes do not consider the non-metallic fractions of the circuit boards,
and often resort to disposal of these waste fractions by landfilling or combustion. Landfilling
of the non-metallic fractions could lead to pollution due to leaching of heavy metals and flame
retardants, while combustion could lead to the formation of dioxins and furans (Huang, Guo, &
Xu, 2009). From an environmental management perspective, a zero-waste approach for PCB
recycling should be developed to gain value from and reduce the environmental impact of both
the metallic and non-metallic fractions of the PCB waste. This project focusses on the treatment
of the solids residue recovered after the majority of metals had been leached from the PCBs.
1.2 Background
The non-metallic fractions of PCBs consist of a mixture of primarily woven glass fibre,
thermosetting resins, and flame retardants (Guo, Guo, & Xu, 2009). Recycling of polymeric
compounds are generally classified as material recycling, chemicals recycling, or energy
recycling (i.e. combustion) (Fink, 1999; Fisher, 2006). Material recycling approaches refer to
applications where the non-metallic fractions of the PCBs are used as inclusions or fillers in
concrete, asphalt materials, or thermoplastic, resin, or similar matrix composites with minimal
processing. Chemical recycling, on the other hand, refers to processes in which chemicals and
fuels are produced from PCB leach residue using techniques such as pyrolysis, supercritical
fluids depolymerisation or hydrogenolytic degradation. While material recycling is promising,
it has found only limited industrial applications due to the diverse composition of circuit boards,
poor compatibility between the non-metallic fractions and matrix materials, potential leaching
of residual hazardous metals, and generally low public acceptance of products containing
recycled PCBs. The high costs associated with chemical recycling methods, on the other hand,
Stellenbosch University https://scholar.sun.ac.za
2
often deter the adoption of these processes even though it is the most effective method to
manage hazardous components and to fully utilise all elements (Guo, Guo, & Xu, 2009).
1.3 Aims and Objectives
The research project aims to determine the technical feasibility of using the non-metallic
fraction of PCBs recovered after hydrometallurgical removal of metals as a reducing agent in
ferroalloy production. The following objectives are set in order to achieve the project aim:
Perform lab-scale experiments on specific pyrometallurgical operations to understand
the behaviour of PCB as a reducing agent
Perform thermodynamic modelling to investigate the effect of operating conditions (e.g.
reducing agent blending ratios, furnace temperature, circuit board composition) on the
alloy composition, off-gas composition, and energy balances for different
pyrometallurgical operations and interpret.
Compare thermodynamic modelling results with lab scale tests to prepare a suitable
strategy for utilization of PCB residue in ferroalloy and iron making operations.
1.4 Thesis Outline
The thesis sets out as follows: Chapter 1 introduces the study by giving the research problem,
background and objectives of this research. Chapter 2 forms the literature review which
explores the composition of PCB, effect of disposing waste PCBs as well as methods of
recycling. The use of polymer waste as pyrometallurgical operations as well as techniques used
for characterising PCB leached residue are also included in Chapter 2. Chapter 3 highlights the
experimental procedure, equipment and materials used in the leaching of PCB as well as the
step-by-step procedure for reduction tests and thermodynamic simulations. The discussion of
experimental results is included in Chapter 4, while Chapter 5 consists of the conclusions and
recommendations.
Stellenbosch University https://scholar.sun.ac.za
3
2 Literature Review
2.1 Introduction
The world is currently faced with issues of environmental preservation. The growth of
population and demand for wealth have caused the depletion of natural resources and the
pollution of the environment. In order to solve this challenge and cause a sustainable society,
secondary resources which lower the impact of pollution on the environment should be
exploited. Recycling of waste should be given special attention instead of disposing of it. Apart
from the shortage of landfill sites, there are other impacts of disposal of waste such as toxicity
issue, global warming, effects on the external environment, etc (Legarth, Alting & Baldo,
1995).
One of the fastest growing sectors of the manufacturing industry in the world is the production
of electrical and electronic equipment (EEE). Any product that relies on electricity to function
is categorized as EEE. Due to technological innovation and intense marketing, these equipment
are being replaced rapidly forcing consumers to dispose electronic waste at the same rate.
Khaliq et al., 2014 defines electronic waste (E-waste) as a broad and growing range of
electronic devices such as cell phones, computers, refrigerators, air conditioners and so on
which have been discarded by users. This proliferation of technology has shortened the lifespan
of EEE from about 5 years to 2-3 years (Yamane et al., 2011; Ning et al., 2017). Considering
that the lifespan of a mobile phone is approximately one year and that of a computer is 2-5
years, it is estimated that about 100 million mobile phones and 17 million computers are
discarded annually as a result of malfunctioning equipment or due to technologies becoming
obsolete (Yamane et al., 2011). According to Cui & Anderson (2016), there were
approximately 41.8 million tonnes of electronic waste generated through the world in 2014 and
it is expected that the amount of electronic waste will reach 49.8 million tonnes in 2018, with
an annual growth rate of four to five percent.
The UN Environmental Programme estimates that the world generates 20-50 million tonnes of
waste from electrical and electronic equipment (WEEE) each year and the amounts are rising
three times faster than other forms of municipal waste (Huang et al., 2009). Zhao et al., (2016)
predicted based on the gray model that, by 2031, WEEE generation in China which represents
about 14% of the world total weight will reach 13 million tonnes. Legarth, Alting & Baldo
(1995) grouped the sources of environmental problems associated with the disposal of WEEE
into three, namely the cathode ray tubes containing heavy metals, the technical thermoplastics
Stellenbosch University https://scholar.sun.ac.za
4
containing various problematic additives and the printed circuit board (PCB) with their complex
mixture of chemicals. PCB, ubiquitous in modern EEE, constitutes a significant proportion of
WEEE and it represents about 8% by weight of WEEE collected from small appliances and 3%
of the mass of global WEEE (Luda, 2011). Recycling of e-waste through appropriate
technologies is considered to be a profitable business as the PCBs contain the precious metals
(including gold, silver etc.). PCBs, the most valuable part of electronic waste contain more
abundant base and precious metal than their ores, normally ten times or higher than rich
renewable sources. According to Cui & Anderson (2016), the gold content in PCBs is 35-50
times higher than gold ore. As a result of its high concentration, e-waste recycling and metal
recovery is an appealing prospect from economic, technical, and environmental points of view
(Cayumil et al., 2014). Printed circuit boards (PCBs) are among the most complex e-waste,
containing significant quantities of hazardous and toxic materials leading to high levels of
pollution if landfilled or processed inappropriately (Sohaili, Muniyandi & Mohamad, 2012). It
is reported that 70% of the heavy metal in the landfill site come from WEEE disposal. The
presence of precious metals, in addition to strict environmental regulation, has made the
recovery methodologies very suitable (Widmer et al., 2005; Ning et al., 2017)
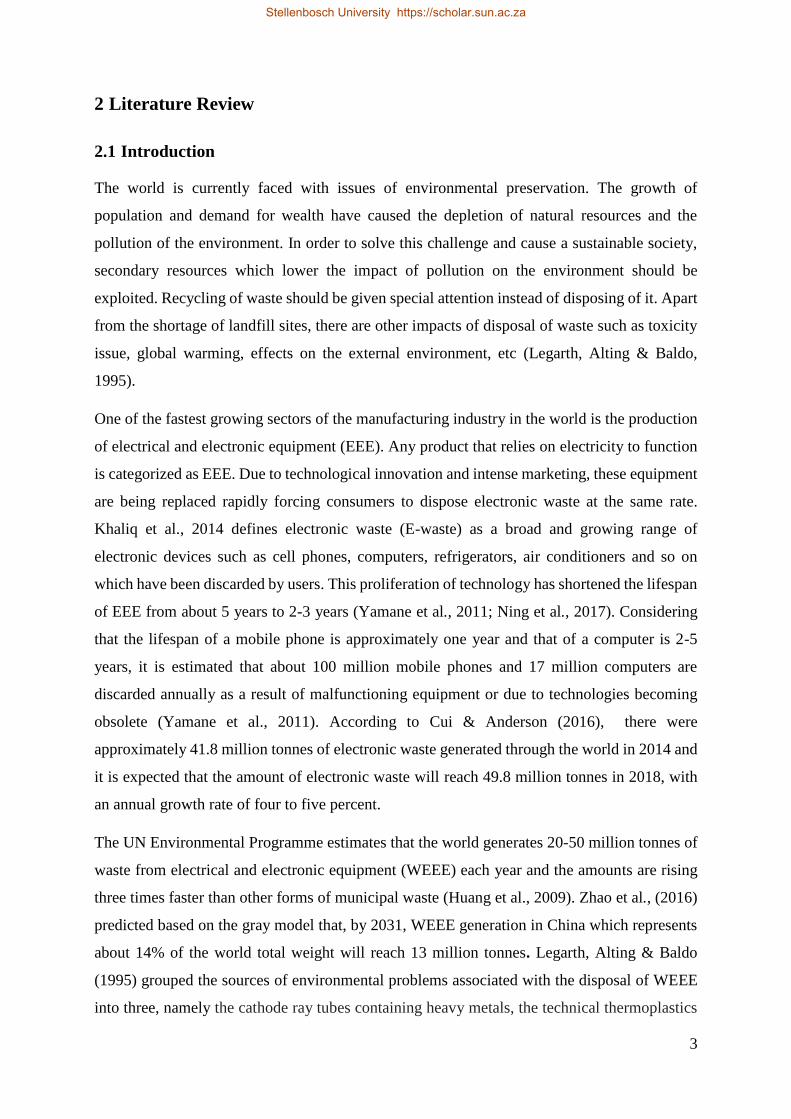
Figure 2.1: Global e-waste generation from 2010 to 2018 (data source (Baldé et al., 2015))
6.5
6.6
6.7
6.8
6.9
7
7.1
7.2
7.3
7.4
7.5
0
10
20
30
40
50
60
2010 2011 2012 2013 2014 2015 2016 2017 2018
Po
pula
tio
n,
bil
lio
n
Am
out
of
e-w
aste
gen
erat
ed,
mil
lio
n t
ons
Year
E-waste generated (Mt) Population (billion)
Stellenbosch University https://scholar.sun.ac.za

5
2.2 Composition of PCB
PCBs are platforms on which integrated circuits and other electronic devices and connections
are installed. They mechanically support and electrically connect the components using
conductive tracks, pads, and copper sheets laminated onto a non-conductive substrate. The
components (eg. capacitors, resistors or active devices) are generally soldered on the PCB.
Typically, PCBs present a heterogeneous and complex mixture of elements consisting of a 30%
polymers, 30% refractories and 40% metals. The platforms of PCB represent about 23% of the
weight of whole PCB (Silvas et al., 2015).
During the manufacturing of PCB, carbonaceous compounds such as brominated flame
retardants and dyes are added in order to improve the flame resistance and visual recognition
ability (Ning et al., 2017). The metals in PCBs consist of copper, iron, tin, nickel, lead, zinc,
silver, gold and palladium, mixed with plastics, epoxy resins reinforced with glass fibre and
ceramics. The components of circuit board assemblies are held on to the board via solder; so
effective recovery of solder via electrochemical or thermal methods would in turn lead to the
separation of the components from the board itself. Some of these materials have toxic effects
on human health and on environment (for example lead). In spite of hazardous nature of PCB,
other materials have added value, as is the case of precious metals and base metals such as gold
and copper, respectively (Sohaili, Muniyandi & Mohamad, 2012; Silvas et al., 2015).
The non-metallic materials refer to the residue after separating the copper and other metals
either physically or chemically from the waste PCB. They consist of 40% organic substance
and 60% inorganic substance. The common organic substances include epoxy resin, brominated
flame retardants, dicyandiamide and so on. However, the common inorganic substance is glass
fibre which is made from various oxides dominated by silicon oxide, aluminium oxide and
calcium oxide (Cayumil et al., 2014; Guanghan et al., 2016). PCBs are manufactured with
sophisticated technologies and due to the complex composition, PCBs recycling requires a
multidisciplinary approach intended to separate metals and plastics and reduce environmental
pollution (Sohaili, Muniyandi & Mohamad, 2012).
Stellenbosch University https://scholar.sun.ac.za

6
Table 2.1: Composition of PCB
Metallic
Element,
wt%
(Shuey &
Taylor,
2005)
(Kim et
al., 2004)
(Ogunniyi &
Vermaak,
2009)
(Chatterj
ee, 2012)
(Yokoya
ma & Iji,
1997)
(Diaz et
al.,
2016)
(Xiang
et al.,
2010)
Cu 20 15.6 23.47 16 22 22.62 23.1
Al 2 - 1.33 5 - - 2.6
Fe 8 1.4 1.22 5 3.6 - 0.8
Sn 4 3.24 1.54 3 2.6 3.075 1.88
Ni 2 0.28 2.35 1 0.32 13.49 0.19
Zn 1 0.16 1.51 1 - - 1.75
Pb 2 1.35 0.99 2 1.55 - 2.89
Sb 0.4 - - - - - 0.035
Au 1 0.042 0.570 0.025 0.35 0.53 0.014
Ag 2 1.24 3.301 0.1 - 0.26 0.026
Pd 0.05 0.01 0.29 0.01 -
Ceramic SiO2 15 41.8 - - - - - Al2O3 6 6.97 - - - - - Alkali and
alkaline earth
oxides
6 CaO 9.95 - - - - -
Titanates and
mica, etc.
3 - - - - - -
Plastics Total 16
wt%
-
Polyethylene 9.9 - - - - - - Polypropylene 4.8 - - - - - - Polyesters 4.8 - - - - - - Polyvinyl
chloride
2.4 - - - - - -
Polytetra
flouro ethane
2.4 - - - - - -
Nylon 0.9 - - - - - -
2.3 Disposal of PCB
Hazardous substances present in WEEE, including heavy metals (e.g., mercury, cadmium, lead,
etc.), flame retardants (e.g., pentabromophenol, polybrominated diphenyl ethers (PBDEs),
tetrabromobisphenol-A (TBBPA), etc.) and other chemicals may pose significant human and
environmental health risks, if improperly managed (Kaya, 2016). The non-metallic fractions of
PCB are generally treated by incineration or landfilling. There is the formation of highly toxic
polybrominated dibenzodioxins and dibenzofurans during incineration process. Moreover,
landfilling leads to leaching of some toxic substances into the soil and underground water with
time. (Kadari et al., 2017). Muniyandi et al. (2013) stated that the cost of disposal of these
Stellenbosch University https://scholar.sun.ac.za
7
hazardous residues is very expensive in developed countries in addition to the cost of
packaging, segregation, transportation and others.
2.4 Recycling PCB
Recycling of waste is not merely reduction of waste but reuse of resources with better economic
value or less environmental impact. The process of PCB manufacturing is extremely
complicated requiring a large investment in equipment and over 50 separate steps (Duan et al,
2011). It is important to recycle PCBs in order to protect the society as well as recover valuable
materials. Many researchers have used various mechanical methods to separate metals and non-
metals from PCB waste, such as multi-crushing, grinding, electrostatic separation, gravity
separation, density-based separation and magnetic separation.
Guo, Tang & Xu, (2010) used the non-metals of PCB in the production of wood plastic
composites, and they discovered that the flexural strength of the composites was higher than
those of the control specimen. Wang et al., (2010) reported that using of non-metallic powder
from PCBs as an additive in polyvinyl chloride (PVC) substrate, increased the bending strength
over the pure PVC with an incorporation of 20% PCB. Franz (2002) stated that the use of the
non-metallic PCB for thermoplastics would be the perfect recycling solution. Muniyandi et al.
(2013) investigated the feasibility of using non-metallic PCB as filler in recycled high-density
polyethylene (HDPE) in the production of rHDPE/PCB composite. They found out that tensile
strength, Young’s modulus, flexural strength and flexural modulus increased steadily until
reaching maximum at PCB content of 30 wt%.
Only 20% of the e-waste generated were recycled from 2003 to 2005. 2% was incinerated and
the remaining 78% was dumped at landfill site (Kahhat et al., 2008). Ning et al. (2017) classified
the treatment and recycling technique of waste PCB according to the recovery degree. Direct
treatment including landfilling and incineration means that no or only the energy of waste PCB
was recovered while primitive recycling means the simple recycling of metallic fraction (MF),
while the non-metallic fraction (NMF) ended up in the disposal or limited non-hazardous
treatment. Advanced recycling includes two parts: separation methods without damage to the
NMF and the direct use or modification of NMF.
According to Xiang et al. (2007) there are two types of PCB that need to be recycled. One
comes from electromechanical products and the other from the waste of PCB production
process. There are three branches of waste recycling according to the different material
recovering process. These are thermal processing, chemical processing, and physical
Stellenbosch University https://scholar.sun.ac.za

8
processing. These steps are geared towards removal of the toxic part, upgrading and then
refining the required materials.
2.4.1 Physical Recycling
Disassembling of the PCB is the first and the most important stage in recycling because it helps
to conserve scarce resources (eg. precious metals), establishes the reuse of components and
eliminate toxic materials from the environment (Xiang et al., 2007). It is often referred to as the
pre-treatment stage and it is carried out before physical recycling. Almost all current recycling
technologies of PCBs include a sorting or disassembling stage. This may be carried out
manually (using tools such as a hammer, chisel, screwdriver and bare hands) or in semi-
automatic approach; where the application of heat in addition to shear force, impact and
vibrations are used to open soldered connections. In some European countries such as Germany,
PCB recycling does not include dismantling, but it is directly crushed (Duan et al., 2011;
Robinson, 2009).
After dismantling of the PCBs, the physical recycling is carried out. The size of the PCBs is
reduced in order to easily separate the metallic from the non-metallic components. The PCB is
initially reduced to a size of about 1-2 cm2 using shredders or granulators and subsequently
reduced to 5-10 mm using cutting mills or centrifugal mills. Havlik et al. (2011) stated that
crushing is necessary to expose the metal surface by removing the plastics that cover the surface
of the metals. Shape separation is then performed using an inclined conveyor and inclined
vibrating plate to recover copper from the PCB. After the shape separation, ferrous metals are
separated from the PCB using magnet. Density-based and electrical conductivity based
separations are used to separate the metals from the non-metallic component in the PCB
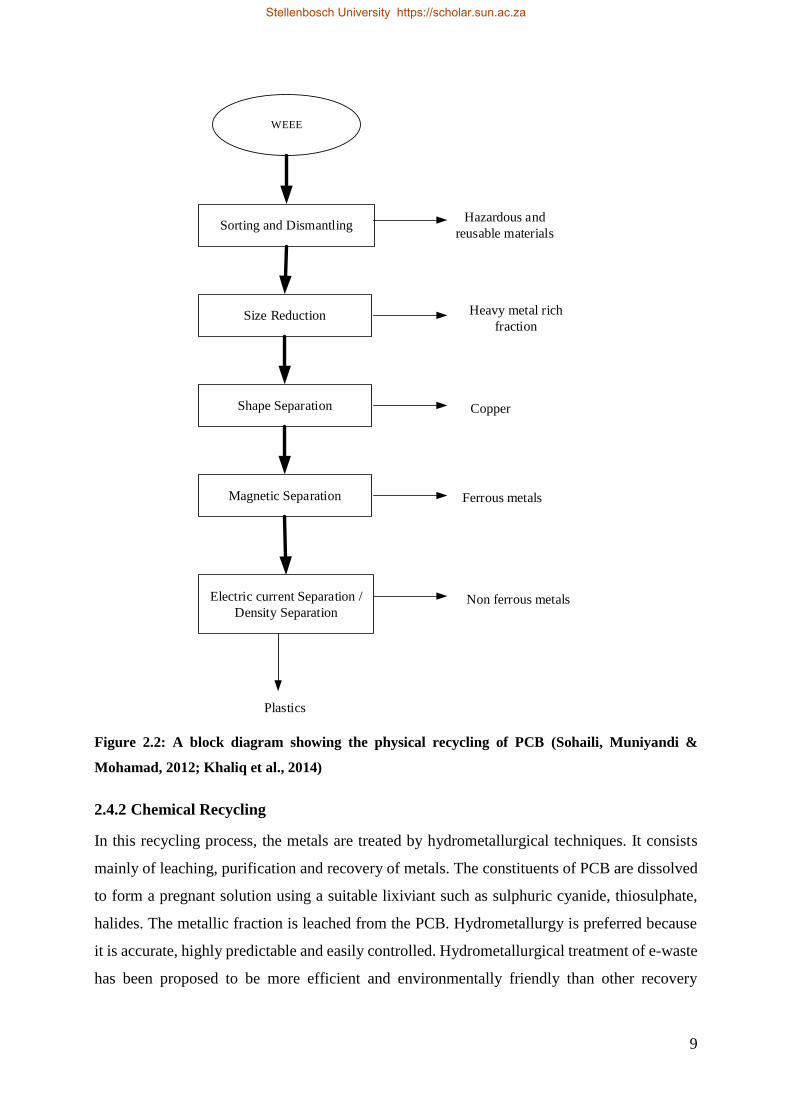
(Sohaili, Muniyandi & Mohamad, 2012; Khaliq et al., 2014).
Stellenbosch University https://scholar.sun.ac.za
9
WEEE
Sorting and Dismantling
Size Reduction
Shape Separation
Magnetic Separation
Electric current Separation /
Density Separation
Hazardous and
reusable materials
Heavy metal rich
fraction
Copper
Ferrous metals
Non ferrous metals
Plastics
Figure 2.2: A block diagram showing the physical recycling of PCB (Sohaili, Muniyandi &
Mohamad, 2012; Khaliq et al., 2014)
2.4.2 Chemical Recycling
In this recycling process, the metals are treated by hydrometallurgical techniques. It consists
mainly of leaching, purification and recovery of metals. The constituents of PCB are dissolved
to form a pregnant solution using a suitable lixiviant such as sulphuric cyanide, thiosulphate,
halides. The metallic fraction is leached from the PCB. Hydrometallurgy is preferred because
it is accurate, highly predictable and easily controlled. Hydrometallurgical treatment of e-waste
has been proposed to be more efficient and environmentally friendly than other recovery
Stellenbosch University https://scholar.sun.ac.za

10
processes, such as physical separation and combustion. (Sohaili, Muniyandi & Mohamad, 2012;
Diaz et al., 2016; Cui & Anderson, 2016).
Havlik et al. (2011) studied the leaching of metals from PCB using 1 M HCl at 80℃. It was
discovered that up to 98% of copper was leached from the thermally pre-treated PCB while
only 6% of copper was obtained from unburned PCB. He explained that the copper is covered
by plastics which protect the copper from contact with the leaching agent. The effects of stirring
speed, temperature, solid/liquid ratio and concentrations of HCl and H2O2 on the leaching of
copper were investigated by Zhang et al. (2012). They concluded that the dissolution of copper
from waste PCB in the HCl using H2O2 as oxidant was feasible. The increase in both H+ and
Cl– ion as well as stirring speed enhanced the extraction of copper from the waste PCB.
Cui & Anderson (2016) classified the metallic fractions of PCB into base metals and precious
metals. The base metals consist of metals such as copper, lead, zinc etc. whilst the precious
metals were gold, silver and palladium. The base metal leaching was generally conducted by
using acids such as H2SO4, HNO3, aqua regia and HClO with various oxidants including H2O2,
O2, Fe3+ and Cl2. Leaching of the precious metals was the second stage after leaching the base
metals. The reagents used for the precious metal leaching include cyanide, thiourea and
thiosulfate because of the stable metal complex formed.
Despite the advantages of the hydrometallurgical treatment methods, a serious issue is that they
produce a lot of highly toxic wastewater containing cyanides, which might be hazardous for
both soil and water bodies. Moreover, non-cyanide leaching solvents like thiourea or thiosulfate
have disadvantages including low-stability, high cost, and high reagent consumption (Ning et
al., 2017).
Another approach that proves promising in the metallurgical treatment of PCB is biometallurgy.
Microbes can be used to recover some metals. These microbes have the ability to bind metal
ions present in the external environment at the cell surface or to transport them into the cell for
various intracellular functions. The two main areas in biometallurgy are bioleaching and
biosorption. Bioleaching has been successfully applied for recovery of precious metals and
copper from ores for many years. Faramarzi et al. 2004 carried out research on the bioleaching
of metals from electronic wastes and demonstrated that when Chromobacterium violaceum is
used, gold can be microbially solubilized from PCB. Bacterial consortium enriched from
natural acid mine drainage could efficiently solubilized copper from waste PCBs in about 5
days (Xiang et al., 2010). Biosorption process is a passive physico-chemical interaction
Stellenbosch University https://scholar.sun.ac.za

11
between the charged surface groups of micro-organisms and ions in solution. Certain types of
inactive, dead, microbial biomass bind and concentrate heavy metals from even very dilute
aqueous solutions. Compared with the conventional methods, biosorption-based process offers
a number of advantages including low operating costs, minimization of the volume of
chemical/biological sludges to be handled and high efficiency in detoxifying (Sohaili,
Muniyandi and Mohamad, 2012).
2.4.3 Thermal Recycling
This process aims at getting metal alloys using incineration or pyrometallurgy. The PCB is
crushed and burned in a furnace to recover the precious metals. When PCB is pyrolysed, it leads
to the formation of gases, oils and char which may be used as fuels. Pyrolysis degrades the
organic part of the PCB and can be used as a method to separate the metallic from the non-
metallic component (Sohaili, Muniyandi & Mohamad, 2012). This method is available and very
simple. However, the non-metallic part cannot be reused, the waste gas produced as a result of
incineration may contain certain toxic gases such as dioxin, lead fume and others. The presence
of halogens in plastics (e.g. chlorine in PVC) and bromine in brominated flame retardant (BFR)
treated plastics in the electronics scrap feedstock may lead to the formation of brominated and
chlorinated dibenzofurans and dioxins in burning processes unless special installations and
measures are present. High dioxin and furan formation potential were due to insufficient
combustion.
Ortun et al. (2014) studied the pollutant emissions during pyrolysis and combustion of waste
PCB before and after metal removal at temperatures 600 and 850 °C at two different
atmospheres (nitrogen and sub-stoichiometric air). It was observed that hydrogen bromide is
the main gaseous product emitted besides CO and CO2 during the decomposition of the printed
circuit boards, increasing its formation with increasing temperature. The emission of
brominated pollutants is much higher than that of chlorinated. The metal enhances emission of
halogenated compounds and an increase in the temperature produces the destruction of
pollutants. They concluded that the emission trends of the compounds evolved depended mainly
on operating conditions (temperature and oxygen ratio), but also on the presence of metals in
the material.
The toxic gas emissions may be controlled by treating the off-gas or thermally decomposing at
high temperatures (Stewart & Lemieux, 2003). Moreover, the metals obtained from this process
need further refining using hydrometallurgical techniques. Bazargan et al., (2014) combined
Stellenbosch University https://scholar.sun.ac.za

12
acid treatment and thermal treatment to get porous silica from the non-metallic fraction of
printed circuit board waste. Acid treatment was done using nitric, hydrochloric, and sulphuric
acids to remove the metals. Afterwards, thermal treatment was used to remove the bromine and
other volatiles from the samples. Higher heat treatment temperatures and longer durations lead
to more crystalline SiO2 with lower specific surface areas. The optimum porous silica sample
produced at 500 oC showed relative silica content above 99% and a specific surface area as high
as 300 m2/g
Ning et al. (2017) compared pyrometallurgy to incineration of PCB in terms of dioxin and furan
emission, bromine recovery, heat recovery and heavy metal recovery and recommended
pyrometallurgy as a better approach.
2.4.4 Thermal Behaviour of PCB
When PCB is heated to high temperatures, it decomposes into smaller molecules. Several
authors have studied the pyrolysis and combustion of PCB at high temperatures under various
conditions. Pyrolysis is the process whereby a material decomposes into gases, oils and chars
when it is heated to high temperatures under inert conditions. The products of pyrolysis may be
used as chemical feedstock or fuels (Kanchanapiya et al., 2015; Yang et al., 2013).
Evangelopoulos, Kantarelis & Yang (2015) studied the pyrolytic behaviour of PCB using
thermogravimetric analysis and analytical pyrolysis. The experimental results showed that PCB
decomposes at temperatures between 250℃ and 370℃ with production of varying amounts of
aromatic compounds such as phenol, bromophenol, styrene and non-aromatic compounds such
as acetone and bromomethane. It was discovered that temperature increase favours the
production of aromatic hydrocarbons. Rajagopal, Rajarao and Sahajwalla (2016) investigated
the kinetic behaviour of waste PCB obtained from monitor and processing boards of computer
when heated from 40℃ to 700℃ under nitrogen atmosphere. In the study, pyrolysis occurred
at temperatures between 250℃ and 405℃ with a weight loss of about 25%. They estimated
activation energy range between 78.60 and 99.08 kJmol-1. The weight loss can be ascribed to
the thermal decomposition and volatilization of the epoxy resin in the PCB (Zhang et al., 2010).
Quan, Li & Gao (2012) subdivided the pyrolysis of PCB into three stages. In the first stage at
temperatures less than 293℃, the main products are CH4, H2O, CO2, CO, CH3COCH3. Organic
species with high molecular weight are produced in the second stage. Carbonization and char
formation occur in the last stage at temperatures greater than 400℃.
Stellenbosch University https://scholar.sun.ac.za

13
According to Zhang et al. (2010), the thermal behaviour of PCB in CO2 atmosphere is
comparable to N2. Nevertheless, when PCB is heated in air, two thermal decomposition steps
are obtained. The first step is similar to the degradation in the N2 atmosphere and the other
indicated oxidation of the PCB.
Figure 2.3: Thermogravimetric profile during the pyrolysis and combustion of PCB (Quan, Li, &
Gao, 2013)
2.5 Polymer Waste as a Reductant in Pyrometallurgy
Smelting is a form of pyrometallurgy where heat is applied to ore to separate metals from waste
fractions. Several metals including silver, iron, copper and other base metals are extracted from
their ores using this technique. Smelting usually takes place above the melting point of the
metal. Ore is charged in furnace together with a reductant to release the oxygen present in the
ore as carbon dioxide. The most common reducing agent is a source of carbon, such as coal,
coke, etc. There is a formation of slag during smelting operation. Both the slag produced and
the ore that is charged contains oxygen. In order to improve the formation of slag and help in
the melting of the oxides in the ore, flux, such as limestone may be added (Melorose, Perroy,
& Careas, 2015).
There are various ways of recycling waste plastics: material, energy and feedstock recycling.
Material recycling is carried out by melting and transforming the waste plastics into different
products. It is often considered as the best method. Only about 22% of the material are of good
quality to be recycled (PlasticsEurope, 2009). Energy can be recovered from the plastics by
incineration or combustion in kilns. It is estimated that 1 kg of plastic waste has the same
heating value as 1 litre of fuel oil. The cement industries consider polymer waste essentially as
a substitute for conventional fuel. The third recycling method is aimed at generating chemical
40
50
60
70
80
90
100
110
0 100 200 300 400 500 600 700 800
Wei
ght
frac
tio
n,
%
Temperature, ℃
Pyrolysis
Combustion
Stellenbosch University https://scholar.sun.ac.za

14
feedstock by using processes such as pyrolysis. There is no sharp distinction between energy
and feedstock recycling. For instance, the use of plastics in pyrometallurgical furnaces may be
considered as both energy and feedstock recycling since the furnace makes use of both the
reduction potential and the heating value of polymers (Fink, 1999; Kato, Nomura, & Uematsu,
2002).
Recycling of plastics as feedstock to reductive smelting operations has been investigated by
several authors. One of the major applications in this field involves the use of polymer waste in
blast furnaces for steelmaking, where plastics are substituted for coke, coal, or oil used for ore
reduction and heating (Carpenter, 2010; PlasticsEurope, 2009). Injecting 1 kg of waste plastics
replaced about 1.3 kg of pulverised coal in the blast furnace (BF) of JFE Steel, Japan, and about
1 kg of heavy oil at Stahlwerke Bremen, Germany (Carpenter, 2010). This technology was first
implemented on an industrial scale by NKK Keihin Works in Japan after development by
Bremen Steel Works in Germany (Zie & Stanek, 2001).
Some factors that influence the amount of polymer waste that can be added to blast furnace
feeds include the hydrogen to carbon ratio, the energy content, supply rates required to sustain
continuous operation, as well as the chloride and the residual non-ferrous metal content of the
waste (Fink, 1999; Nourreddine, 2007). Plastics, compared to coal, have higher hydrogen to
carbon ratio. Incorporating plastics in blast furnaces increases the amount of hydrogen gas. An
increase in the hydrogen gas content decreases gas density, and therefore reduces the pressure
drop or allows a greater gas flow for the same pressure. The reduction by hydrogen is less
endothermic than the direct reduction by carbon, hence there is a decrease in energy
requirements.
Plastics with high calorific values are required in reduction process. Generally, plastics have
higher calorific value relative to coal. Polyethylene(PE) typically has a calorific value of around
46 MJ/kg; polypropylene (PP) 44 MJ/kg, polystyrene(PS) 40.5 MJ/kg, polyethylene
terephthalate(PET) 23.5 MJ/kg and polyvinylchloride (PVC) 18.8 MJ/kg (although there are
wide variations between rigid an flexible PVC) (Ida, 2006).
Fink (1999), Nourreddine (2007) and Zie & Stanek (2001) reported that the formation of
dioxins is not problematic in these processing routes, but formation of chlorine-containing gases
such as HCl might result in corrosion of equipment. The chlorine present in the plastic waste is
as a result of PVC. Hence, the removal of PVC from the plastics before injection in the furnace
is a good option (Carpenter, 2010). PVCs may be treated by heating at 300 °C to 400 °C in an
Stellenbosch University https://scholar.sun.ac.za
15
atmosphere without oxygen. HCl is released and the residual can be injected in furnace. The
method is very effective, particularly for 100% PVC plastic. However, if the PVC is mixed in
low range of approximately 2% to 30%, thermal decomposition can be carried out in a reaction
vessel while agitating and moving forward the plastics by screws or paddles. Hydrochloride is
generated at a comparatively low concentration and can be treated by neutralization (Hotta,
2003).
The presence of copper in the polymer waste may however, catalyse the formation of
chlorodibenzodioxins; this could hold environmental risks if PCB waste undergoes thermal
treatment without complete prior metal recovery. Residual metals in the non-metallic fraction
of the PCB waste might also affect the reduction process and alloy quality; trace amounts of
copper in steel, for example, results in a brittle product (Fink,1999). Several strategies have
been proposed for feeding polymer wastes into the furnaces and could affect the waste’s relative
contribution to ore reduction (i.e. chemical recovery) and to energy recovery. Feeding strategies
include direct mixing with the furnace feed, thermal pre-degradation of polymers into viscous
liquids followed by direct injection, or gasification prior to injection (Fink, 1999).
According to Zie & Stanek (2001), injection of plastics in their solid state is usually the most
feasible technically and economically. NKK also feed pulverised and granulated plastic solids
through tuyeres located near the bottom of the furnace. Following this approach, Hotta (2003)
reported that the plastics decomposed to CO and H2, which acted as reducing agents; the role
of H2 as reducing agent reduced the CO2 generation by 30 %.
It is reported that approximately 60% of the injected plastics fulfilled the role of reducing
agents, while the remainder was used for energy recovery. It has been estimated that only 3%
of the total carbon used as a reducing agent remains non-oxidised (Delgado, Barruetabeña, &
Salas, 2007). Fisher (2006) also mentioned that direct addition of plastics as reductant to blast
furnaces or reductive smelters effectively constitutes in-situ gasification which results in the
formation of syngas. Dankwah et al. (2015) investigated the use of mixed plastic waste
consisting of high density polyethylene, polypropylene, low density polyethylene, and
polyethylene terephthalate as reductant in ironmaking, and reported improved reduction when
using the mixed polymers compared to metallurgical coke or individual plastics. The relatively
high oxygen content of polyethylene terephthalate was reported to be the cause for the increased
CO2 emissions observed when using the mixed polymers compared to metallurgical coke.
Stellenbosch University https://scholar.sun.ac.za
16
The use of polymer waste, and electronic scrap in particular, in non-ferrous metallurgy has been
reported to lead to process disturbances and contamination of products (Fink, 1999). Mark &
Lehner (2000) investigated the addition of PCB waste to a zinc fuming furnace, and concluded
that the non-metallic fractions of the PCB were used primarily for chemical purposes (i.e.
reduction of zinc oxide). It was furthermore reported that the participation of H2 as reducing
reagent might positively influence the reduction kinetics. Zie & Stanek (2001) performed
energy balances to compare the impact of different supplementary reducing reagents on the
energy efficiency of blast furnaces; it was concluded that the addition of plastic wastes resulted
in more savings than when using pulverised coal, natural gas or coke oven gas as the
supplementary reducing reagent. Other advantages of using waste plastics as supplementary
reducing reagent to oil or coal include the reduction in the reducing agent’s sulphur content
(and hence improved desulphurisation, which could reduce process disturbances), energy
savings of up to 40 %, easier metal/slag separation as well as improved carburisation (Dankwah
& Koshy, 2014; Nourreddine, 2007)..
Despite significant research into the use of waste plastic as supplementary reducing agent in
pyrometallurgical operations, very limited information about the use of the leached residue of
PCBs for this purpose is available. The proposed study will therefore contribute significantly
to the knowledge field and assist in expanding the basis for PCB waste recycling process design
decisions. Rajarao et al., (2014) studied the use of lead free non-metallic PCB as reducing agent
in iron making application. They pyrolysed PCB at temperatures between 750℃ and 1350℃.
Analysis of the residue showed a high percentage of carbon (85-90%) and was found to be a
promising reducing agent in iron making.
The use of plastics in as reductants in furnaces has several advantages and these are: Coal
resources are conserved since there is a lower consumption of both coke and pulverized coal.
There is a reduction in the amount of polymer waste being landfilled or incinerated which will
help solve the environmental problems associated with the disposal methods. Energy resources
are saved. Carpenter (2010) estimated that about 47 GJ/t is saved when plastic waste is used as
reductants in blast furnaces. Hydrogen is a more favourable reducing agent than carbon. The
regeneration of hydrogen is faster and less endothermic than carbon monoxide regeneration.
Plastics generally have lower sulphur and alkalis contents than coal. Injectants with low sulphur
contents are preferred because of the effects of sulphur on the quality of the hot metal. Polymer
waste have little or no sulphur present in it. Low emissions of dioxins and furans, which are
often associated with conventional waste incinerators (Carpenter, 2010).
Stellenbosch University https://scholar.sun.ac.za

17
3 Experimental Methods
3.1 Treatment of PCB
3.1.1 Dismantling
Several methods exist in dismantling of waste PCB. The most common way is manual
dismantling where components are removed using pliers, screwdrivers, hammers, etc. Another
approach exist where heat is applied to the boards in addition to shear force, impact and
vibrations to open the soldered connection.
In this study, the waste PCBs from computers were disassembled by submerging it in 2 mol/dm3
nitric acid for 24 hours to dissolve the soldered connections (Sharma et al., 2017). The large
components, such as stainless steel heat sinks which could not be easily crushed and smaller
components such as capacitors, batteries and piezo buzzers were removed after desoldering.
The desoldered PCBs were washed with water and air dried.
3.1.2 Size Reduction
The size of the dismantled PCB were reduced in several stages as shown in Figure 3.1
Figure 3.1: Schematic representation of procedure used for size reduction (Albertyn, 2017)
The boards were cut into sizes of about 2 cm by 2 cm using a band saw followed by crushing
in a hammer mill. The pieces were gradually fed into the hammer mill and the product sieved
to size less than 2 mm. The oversized materials were returned to the mill until the entire charge
pass through the 2 mm sieve. The crushed PCBs were divided using a rotary splitter in order to
get representative samples for the leaching test. Due to the formation of dust from cutting and
the milling of the PCBs, minor feed loss occurred in both operations.
Figure 3.2 (a) shows the image of the PCB used for the study. It can be observed in (b) that the
component are completely removed after it was desoldered in nitric acid solution and (c) shows
the image of PCB crushed into size less than 2mm.
Stellenbosch University https://scholar.sun.ac.za

18
(a) (b) (c)
Figure 3.2: (a) printed circuit board (PCB); (b) Desoldered PCB; (c) crushed PCB
3.1.3 Leaching of PCB
The leaching of metals from PCBs was performed in two stages as shown in Figure 3.3.
Figure 3.3: Schematic representation of procedure for metal leaching
In the first stage, 400 g of crushed PCBs were leached using 4 litres of 15 wt% H2SO4. The
leaching was performed for 24 hours at ambient temperature. The product was then filtered and
the residue dried in an oven at 60℃. The dried residue was divided using a rotary splitter.
Further leaching was performed using aqua regia to completely remove the metals present in
the PCB. Aqua regia was prepared by mixing hydrochloric acid (32 wt%) and nitric acid
(65 wt%) in a volumetric ratio of 3:1 (HCl:HNO3). The leaching test using aqua regia was
performed at a temperature of 60℃. 200 g of H2SO4 leach residue was further leached with 2
litres of aqua regia.
Table 3.1: Experimental parameters for leaching
Stage H2SO4,
wt%
HNO3,
wt%
HCl, wt% T, ℃ Pulp Density,
g/L
Residence
Time, h
1 15 - - 25 100 8
2 - 65 32 60 100 8
Stellenbosch University https://scholar.sun.ac.za
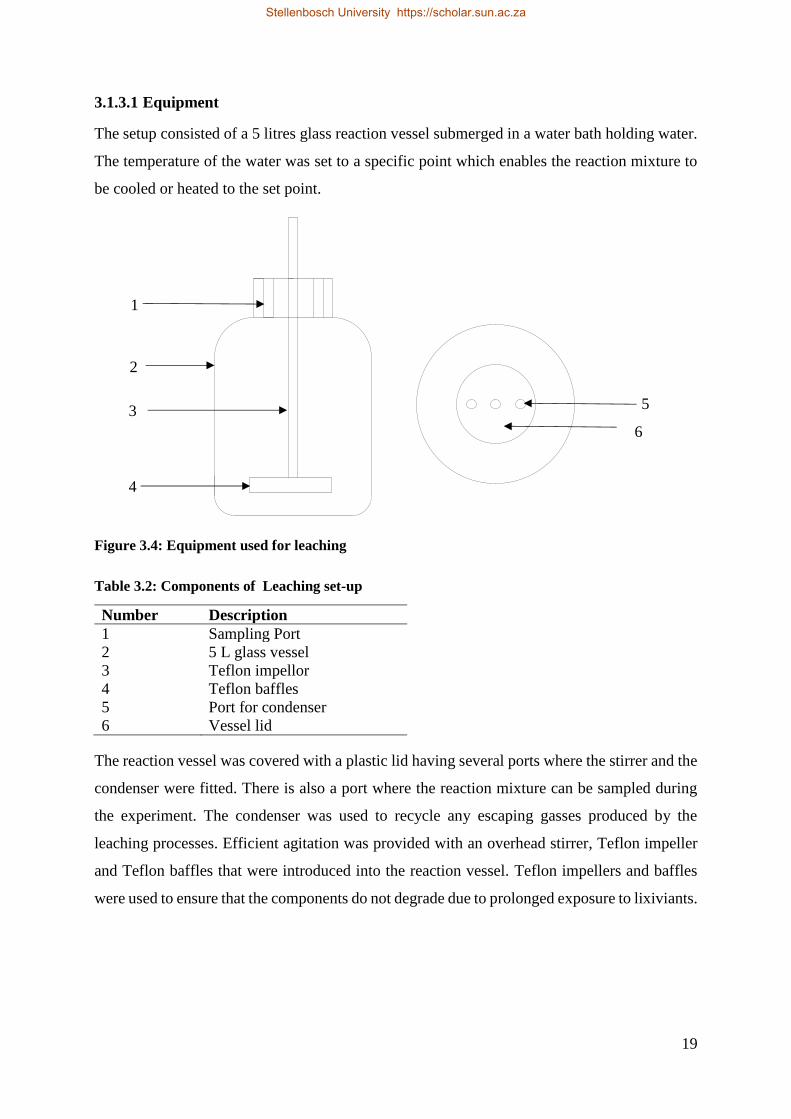
19
3.1.3.1 Equipment
The setup consisted of a 5 litres glass reaction vessel submerged in a water bath holding water.
The temperature of the water was set to a specific point which enables the reaction mixture to
be cooled or heated to the set point.
Figure 3.4: Equipment used for leaching
Table 3.2: Components of Leaching set-up
Number Description
1 Sampling Port
2 5 L glass vessel
3 Teflon impellor
4 Teflon baffles
5 Port for condenser
6 Vessel lid
The reaction vessel was covered with a plastic lid having several ports where the stirrer and the
condenser were fitted. There is also a port where the reaction mixture can be sampled during
the experiment. The condenser was used to recycle any escaping gasses produced by the
leaching processes. Efficient agitation was provided with an overhead stirrer, Teflon impeller
and Teflon baffles that were introduced into the reaction vessel. Teflon impellers and baffles
were used to ensure that the components do not degrade due to prolonged exposure to lixiviants.
5
6
1
2
3
4
Stellenbosch University https://scholar.sun.ac.za

20
3.1.3.2 Procedure
The temperature of the water in the water bath was set to the desired temperature. 4 litres of
H2SO4 was prepared and placed in the glass vessel. For the leaching test with aqua regia, 2 litres
of the lixiviant was used. The glass vessel containing the lixiviant was placed in the water after
it attained the specified temperature, and securely fixed in place.
The setup was left for about 30 minutes to allow the acid attain a similar temperature as the
water. The crushed PCBs were then placed in the glass vessel containing the acid. Subsequently,
Teflon baffles and impeller were inserted into the vessel. The lid was fitted by pushing the
impeller shaft through an aperture. The impeller shaft was connected to an overhead stirrer. The
overhead stirrer was switched on and set to 700rpm. Once the lid was in place, the condenser
was connected to the lid and the cooling switched on.
At the end of each test, the overhead stirrer and the cooling are switched off. All the connections
to the lid were removed and the impeller was unscrewed from the overhead stirrer. The impeller,
baffles and the lid were removed afterwards. The contents were decanted to separate the solid
from the liquid phase. Water was added several times and decanted after each addition to the
residue to wash off the acid. Finally, the product was filtered using a Buchner flask, funnel,
filter paper and vacuum pump. The solid residue was dried in an oven at 60℃ while the liquid
phase was disposed. Each equipment was cleaned subsequently.
3.2 Characterization of the PCB residue
The properties of residue obtained from PCB leaching were characterized using several
techniques which were subsequently used as inputs for simulating reduction.
3.2.1 Proximate Analysis
It is a technique where the properties of a substance is determined based on the moisture
content, volatile matter, fixed carbon and ash content (Speight, 2005). The proximate analysis
was performed on the PCB leach residue using LECO CS 230.
A PCB sample of about 40 mg was placed into an alumina crucible and heated in an inert
atmosphere of nitrogen and afterwards in oxygen. The sample was heated from 30℃ to 110℃
at 50℃/min and maintained at 110℃ for 5 minutes under a nitrogen flowrate of 80 mL/min.
Subsequently, the temperature was increased to 900℃ at a rate of 100℃/min where after the
sample was kept isothermally for 5 minutes under nitrogen. Finally, the sample was oxidised
for 5 minute using oxygen at the same flow rate as nitrogen.
Stellenbosch University https://scholar.sun.ac.za

21
Drying occurs when the sample is heated to 110℃. The mass loss determined is due to the
moisture content. The mass loss during the second stage, where the sample is heated from 110℃
to 900℃, represents loss of the volatile matter. The fixed carbon is the mass lost during the
oxidation stage. The mass of residue after the heating is the ash content.
3.2.2 Ultimate Analysis
This is an analysis where the weight percent of carbon, sulphur, hydrogen, nitrogen and oxygen
are determined. The weight percent of oxygen is usually calculated by the difference (Speight,
2005). It is also known as elemental analysis. The Vario EL Cube Elemental Analyser from
Elementar was used to measure C, H, N and S in the PCB sample. The PCB sample was dried
at 110’C to remove water or any absorbed moisture. A clean ball mill was used to homogenize
the sample to ensure that a representative sample was analysed. A known weight of dried,
homogenous sample was placed in an aluminium foil boat. The sample was introduced into the
combustion column at 1050℃. The combustion column was filled with WO3 and subsequently
enriched with oxygen. The C, H, N and S elements bound in the sample burn to form the
following gaseous reaction products: CO2, H2O, N2 and NOX, SO2 and SO3 respectively. High
purity argon (>99%) carrier gas, flowing at 220 ml/min carries the gaseous products through
the reduction tube filled with copper wire. The reduction column reduces the NOx to N2 and
SO3 to SO2. All the volatile halogen bound compounds produced during combustion are bound
to the silver wool in the reduction column. The pure gasses are then carried to the adsorption
columns. The N2 is not adsorbed and therefore reached the thermal conductivity detector (TCD)
first. The CO2, H2O and SO2 each gets adsorbed onto the adsorption columns at room
temperature for effective separation. The adsorption columns then get heated sequentially to
desorb the different products and are carried through to the TCD. A software computes the
percentages of C, H, N and S based on the mass of the sample.
3.2.3 Scanning Electron Microscope
Scanning electron microscope (SEM) is a widely used instrument for analysing the
microstructure morphology and the composition of a sample. It systematically scans the surface
of interest using focused beam of electrons (primary electrons). The primary electrons interact
with the atoms in the sample leading to the generation of various charged particles and photons
which contains information about the chemical composition and surface topography of the
sample (Stokes, 2008; Zhou et al., 2006).
Stellenbosch University https://scholar.sun.ac.za
22
The PCB residue was characterized using Scanning Electron Microscope (SEM). The sample
was mounted in epoxy resin and the surface was polished and coated with a conductive carbon
layer. The analysis was conducted by Stellenbosch University Central analytical facility, using
a Zeiss MERLIN Field Emission Scanning Electron Microscope, with Energy Dispersive X-
Ray Spectrometer (EDS). Beam conditions were 11 nA current, 20 kV accelerating voltage and
a distance of 9.5 mm.
3.2.4 X-ray Diffraction
X-ray Diffraction (XRD) supplies information on the phases, structures, and other structural
parameters such as average grain size, crystallinity, and crystal defect. XRD provides a way of
characterizing crystalline materials, determination of unit cell dimensions, measurement of
sample purity. This technique is used for analysing a wide range of materials including
pharmaceuticals, plastics, minerals, metals, solar cells, etc. X-rays are created by a cathode ray
tube, filtered to produce monochromatic radiation collimated to concentrate and focused toward
the material. The incident ray interacts with the material to generate diffracted rays (Bunaciu,
Udriştioiu, & Aboul-Enein, 2015).
For the XRD analysis, the PCB sample was pulverized using an agate mortar and pestle. It was
then prepared for XRD analysis using a back loading preparation method and analysed with a
PANalytical Empyrean diffractometer with PIXcel detector and fixed slits with Fe filtered Co-
Kα radiation. The phases were identified using X’Pert Highscore plus software. The relative
phase amounts (weight %) were estimated using the Rietveld method. The analysis was
conducted by XRD analytical and consulting.
3.2.5 X-ray Fluorescence
It is a technique used to determine the chemical composition of materials. X-rays produced
from an x-ray tube or radioactive sources irradiate a material. The atoms of the sample either
absorb or scatter the x-ray. The process by which atoms absorb the x-ray by transferring all of
its energy to an innermost electron is called “photoelectric effect”. During the process, if the x-
ray has enough energy to dislodge the inner electrons bound to the nucleus, the atom becomes
unstable. Electrons from the outer shell replace the missing inner electrons to stabilize the atom.
When this happens, a characteristic x-ray whose energy is the difference between the two
binding energies of the corresponding shells is emitted. The emitted x-rays produced from this
process are called X-ray fluorescence or XRF. The fluorescent x-ray radiation, which is
equivalent to colours of optical light, is characteristic of the element present. It is possible to
Stellenbosch University https://scholar.sun.ac.za

23
determine the elements present in the sample by measuring the energies (determining the
colours) (Brouwer, 2010; Schlotz & Uhlig, 2006; Verma, 1956).
The PCB sample was crushed into a fine powder (particle size < 70 µm) with a jaw crusher and
milled in a tungsten-carbide Zibb mill prior to the preparation of a fused disc for major and
trace elements analysis. The jaw crusher and mill are cleaned with clean uncontaminated quartz
between 2 samples to avoid cross contamination. Glass disks were prepared for XRF analysis
using 7 g of high purity trace element and Rare Earth Element-free flux (LiBO2 = 32.83%,
Li2B4O7 = 66.67%, LiI = 0.50%) mixed with 0.7g of the powder sample. Whole-rock major
element compositions were determined by XRF spectrometry on a PANalytical Axios
Wavelength Dispersive spectrometer at the Central Analytical Facilities, Stellenbosch
University. The spectrometer is fitted with an Rh tube and with the following analyzing crystals:
LIF200, LIF220, PE 002, Ge 111 and PX1. The instrument is fitted with a gas-flow proportional
counter and a scintillation detector. The gas-flow proportional counter uses a 90% argon-10%
methane mixture of gas. Major elements were analyzed on a fused glass disk using a 2.4 kW
rhodium tube. Matrix effects in the samples were corrected for by applying theoretical alpha
factors and measured line overlap factors to the raw intensities measured with the SuperQ
PANalytical software. The concentration of the control standards that were used in the
calibration procedures for major element analyses fit the range of concentration of the samples.
Amongst these standards were NIM-G (Granite from the Council for Mineral Technology,
South Africa) and BE-N (Basalt from the International Working Group).
3.2.6 Fourier transform infrared spectroscopy
Fourier Transform Infrared spectroscopy (FTIR) is an analytical method that can be used to
detect functional groups and the chemical structure of a liquid, solid or gas. Every bond or
functional group has a characteristic frequency at which it vibrates. When infrared (IR) is
passed through a sample, some of the radiations are absorbed while others pass through
(transmitted). IR radiation at the same frequency is absorbed by the bond and a peak is observed.
The radiation absorbed is quantified by calculating absorbance from the incident and emitted
radiation intensities (Motang, 2015; Naseska, 2016; Radebe, 2017)
FTIR analysis was performed on the PCB sample to characterize the functional groups of the
polymer present in PCB. Thermo Scientific Nicolet iS10 Spectrometer (Thermo Scientific,
Waltham, MA) equipped with a Smart iTR diamond ATR accessory was used for the analysis.
Spectra were recorded from 4000 to 650 cm-1.
Stellenbosch University https://scholar.sun.ac.za
24
3.3 Thermal Treatment and Analysis
It comprises a variety of measuring methods where the physical properties of a specimen are
monitored as a function of temperature as it is subjected to a heating or cooling program. These
techniques may include: differential scanning calorimetry (DSC), thermogravimetric analysis
(TGA), differential thermal analysis (DTA), etc. (Speyer, 1994).
3.3.1 Differential Scanning Calorimetry
Differential Scanning Calorimetry (DSC) is a technique where the difference in the quantity of
heat required to increase the temperature of a sample and reference is measured as a function
of temperature. It is an important tool used to study thermodynamic properties such as specific
heat capacity, glass transition etc. as well as information regarding reactivity and phase
transformation. Both the sample and reference are maintained at nearly the same temperature
throughout the experiment. Generally, the temperature program for a DSC analysis is designed
such that the sample holder temperature increases linearly as a function of time. The reference
sample should have a well-defined heat capacity over the range of temperatures to be scanned
(Höhne, Hemminger, & Flammersheim, 2003). The DSC curve may reveal endothermic or
exothermic peaks. The area under the peaks describes the enthalpy changes of events occurring.
The peaks may be specified based on the size (i.e. the amount of material and energy of the
reaction.); position (i.e., start, end, extrapolated onset and peak temperatures) or the shape
(which can be related to the kinetics of the process) (Speyer, 1994).
3.3.2 Thermogravimetric Analysis
Thermogravimetric Analysis (TGA) is a technique in which the weight of a sample is measured
continuously with respect to temperature or time as the specimen is subjected to a regulated
temperature program in a controlled environment. A plot of mass or mass percentage as a
function of time is called thermogram or thermal decomposition curve (Skoog, Holler, &
Crouch, 1998). It can be used to study chemical decomposition (pyrolysis), oxidation reactions
as well as physical processes like vaporization, sublimation, and desorption (Brown, 1989).
TGA usually is made up of a sample pan which is supported by a balance. The changes in the
mass of the sample as temperature varies are measured with thermobalance or
thermogravimetric analysers. The pan is situated in the furnace and is heated or cooled during
the test. The mass of the sample is measured and monitored during the experiment. The
atmosphere of the sample is purged using inert or reactive gas. A computer system is often used
for data acquisition, data processing as well as controlling the flow of purge gas and heating of
Stellenbosch University https://scholar.sun.ac.za
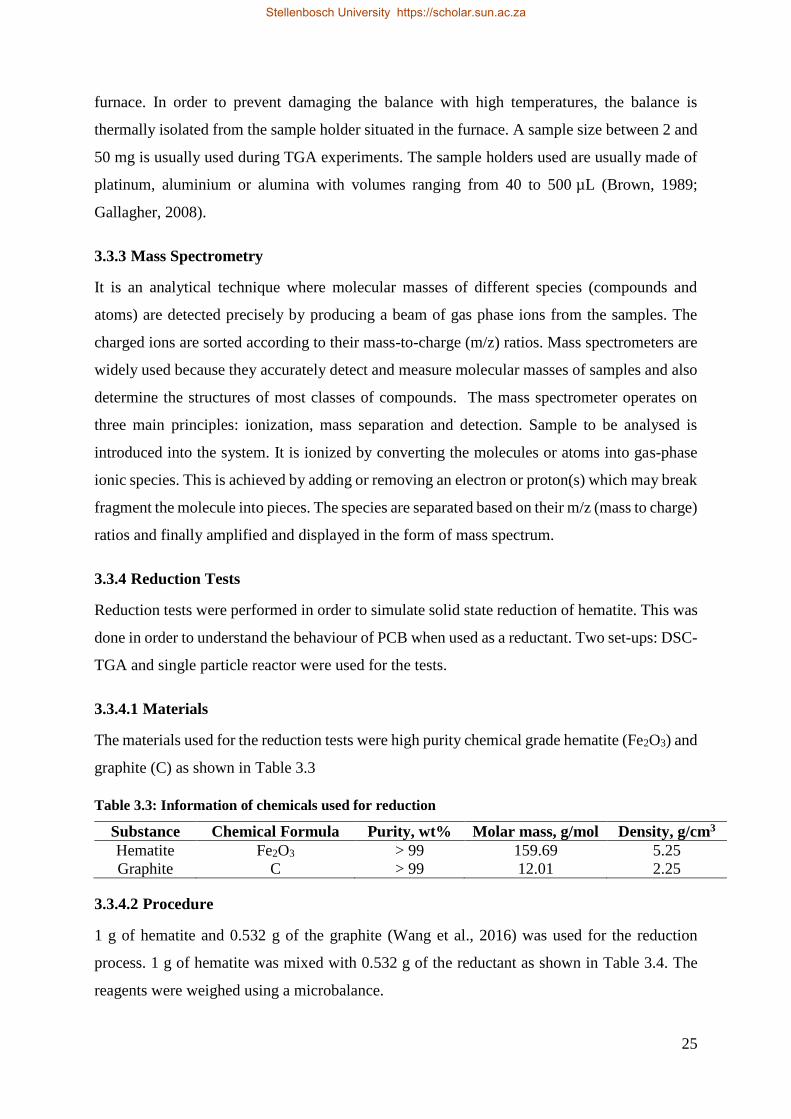
25
furnace. In order to prevent damaging the balance with high temperatures, the balance is
thermally isolated from the sample holder situated in the furnace. A sample size between 2 and
50 mg is usually used during TGA experiments. The sample holders used are usually made of
platinum, aluminium or alumina with volumes ranging from 40 to 500 µL (Brown, 1989;
Gallagher, 2008).
3.3.3 Mass Spectrometry
It is an analytical technique where molecular masses of different species (compounds and
atoms) are detected precisely by producing a beam of gas phase ions from the samples. The
charged ions are sorted according to their mass-to-charge (m/z) ratios. Mass spectrometers are
widely used because they accurately detect and measure molecular masses of samples and also
determine the structures of most classes of compounds. The mass spectrometer operates on
three main principles: ionization, mass separation and detection. Sample to be analysed is
introduced into the system. It is ionized by converting the molecules or atoms into gas-phase
ionic species. This is achieved by adding or removing an electron or proton(s) which may break
fragment the molecule into pieces. The species are separated based on their m/z (mass to charge)
ratios and finally amplified and displayed in the form of mass spectrum.
3.3.4 Reduction Tests
Reduction tests were performed in order to simulate solid state reduction of hematite. This was
done in order to understand the behaviour of PCB when used as a reductant. Two set-ups: DSC-
TGA and single particle reactor were used for the tests.
3.3.4.1 Materials
The materials used for the reduction tests were high purity chemical grade hematite (Fe2O3) and
graphite (C) as shown in Table 3.3
Table 3.3: Information of chemicals used for reduction
Substance Chemical Formula Purity, wt% Molar mass, g/mol Density, g/cm3
Hematite Fe2O3 > 99 159.69 5.25
Graphite C > 99 12.01 2.25
3.3.4.2 Procedure
1 g of hematite and 0.532 g of the graphite (Wang et al., 2016) was used for the reduction
process. 1 g of hematite was mixed with 0.532 g of the reductant as shown in Table 3.4. The
reagents were weighed using a microbalance.
Stellenbosch University https://scholar.sun.ac.za
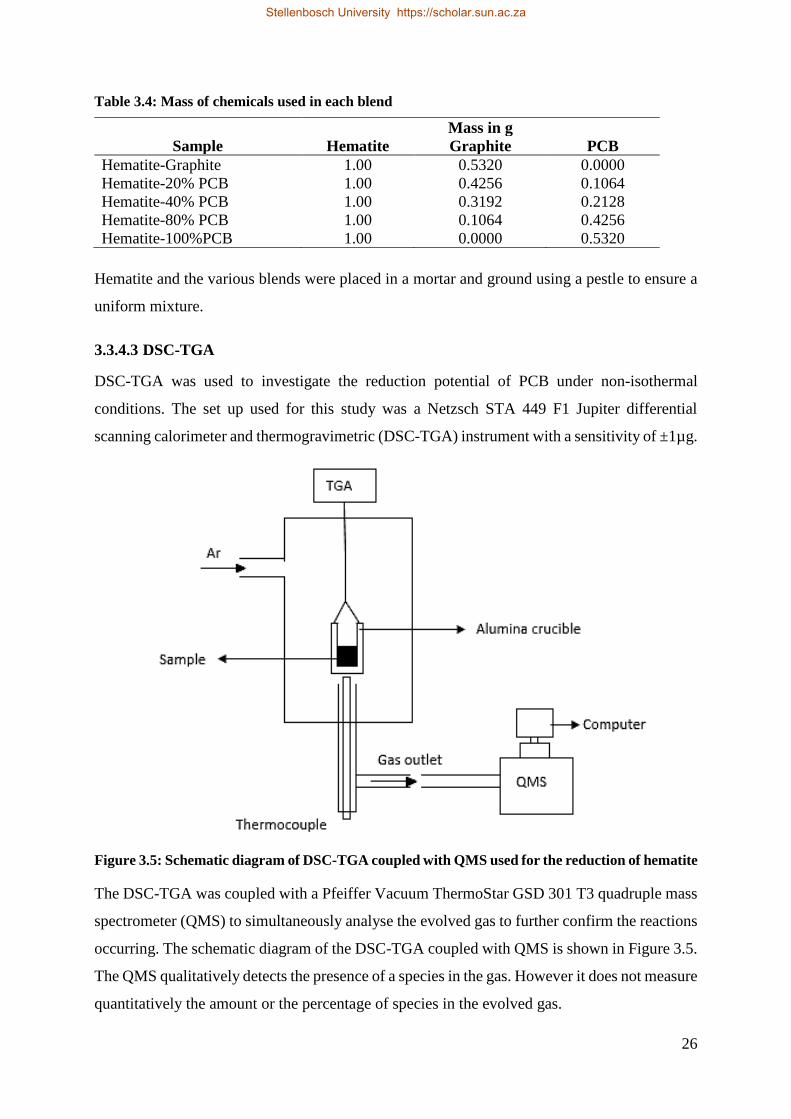
26
Table 3.4: Mass of chemicals used in each blend
Mass in g
Sample Hematite Graphite PCB
Hematite-Graphite 1.00 0.5320 0.0000
Hematite-20% PCB 1.00 0.4256 0.1064
Hematite-40% PCB 1.00 0.3192 0.2128
Hematite-80% PCB 1.00 0.1064 0.4256
Hematite-100%PCB 1.00 0.0000 0.5320
Hematite and the various blends were placed in a mortar and ground using a pestle to ensure a
uniform mixture.
3.3.4.3 DSC-TGA
DSC-TGA was used to investigate the reduction potential of PCB under non-isothermal
conditions. The set up used for this study was a Netzsch STA 449 F1 Jupiter differential
scanning calorimeter and thermogravimetric (DSC-TGA) instrument with a sensitivity of ±1µg.
Figure 3.5: Schematic diagram of DSC-TGA coupled with QMS used for the reduction of hematite
The DSC-TGA was coupled with a Pfeiffer Vacuum ThermoStar GSD 301 T3 quadruple mass
spectrometer (QMS) to simultaneously analyse the evolved gas to further confirm the reactions
occurring. The schematic diagram of the DSC-TGA coupled with QMS is shown in Figure 3.5.
The QMS qualitatively detects the presence of a species in the gas. However it does not measure
quantitatively the amount or the percentage of species in the evolved gas.
Stellenbosch University https://scholar.sun.ac.za

27
About 20 mg of sample containing the hematite-reductant mixture was weighed in an alumina
crucible using a microbalance. The crucible containing the sample was placed on the measuring
head of the DSC-TGA, after which the furnace was lowered by pressing the downward lift
button on the front display to completely cover the measuring head. The vacuum pump was
switched on to remove air and any gas which might interfere with the reduction process. After
about 5 min, the vacuum pump was switched off. A constant flow of 70 ml/min high purity
(>99%) Ar was used. The species that were expected to be detected were fed into QMS by
typing the number representing mass/charge ratio (m/z) into the computer system. For instance,
18 is an input for H2O. The samples were heated from ambient temperature to 1200℃ at a
heating rate of 10℃/min. The QMS detected the presence of CO, CO2 and other gases predicted
by FactSage© in the off gas. The various compounds in the off-gas are ionized and separated
based on mass/charge (m/z) ratio in the QMS. TGA measured the change in mass that occurs
as a result of the reaction taking place and the DSC shows whether it is exothermic or
endothermic. The QMS analysed the off-gas as the test progresses to confirm the reactions
occurring.
At the end of each test, the mass spectrometer was switched off and the furnace was allowed to
cool. Afterwards, the furnace was lifted up by pressing the upward lift button on the front
display and the crucible was taken out of the measuring head. The crucible containing the
product was weighed and the product was kept for analysis.
3.3.4.4 Single Particle Reactor
Further reduction tests were carried out in a single particle reactor (SPR) to study reduction
tests occurring under isothermal conditions. It consists of a quartz glass reactor which is heated
to the desired temperature, a nitrogen purge system, video camera and off-gas analyser as shown
in Figure 3.6.
The flow controller regulates the flowrate of the nitrogen gas in the reactor. Three analysers,
Chemiluminescence NOx Analyser model 200EM, Servomex xentra 4900 Continuous
Emissions Analyser and ABB AO20202, were used to detect and measure the presence of NO,
O2/SO2 and CO/CO2 respectively. The analysers are connected to a data logging computer. The
video camera may be used to record the images of a sample as reaction progresses.
Stellenbosch University https://scholar.sun.ac.za
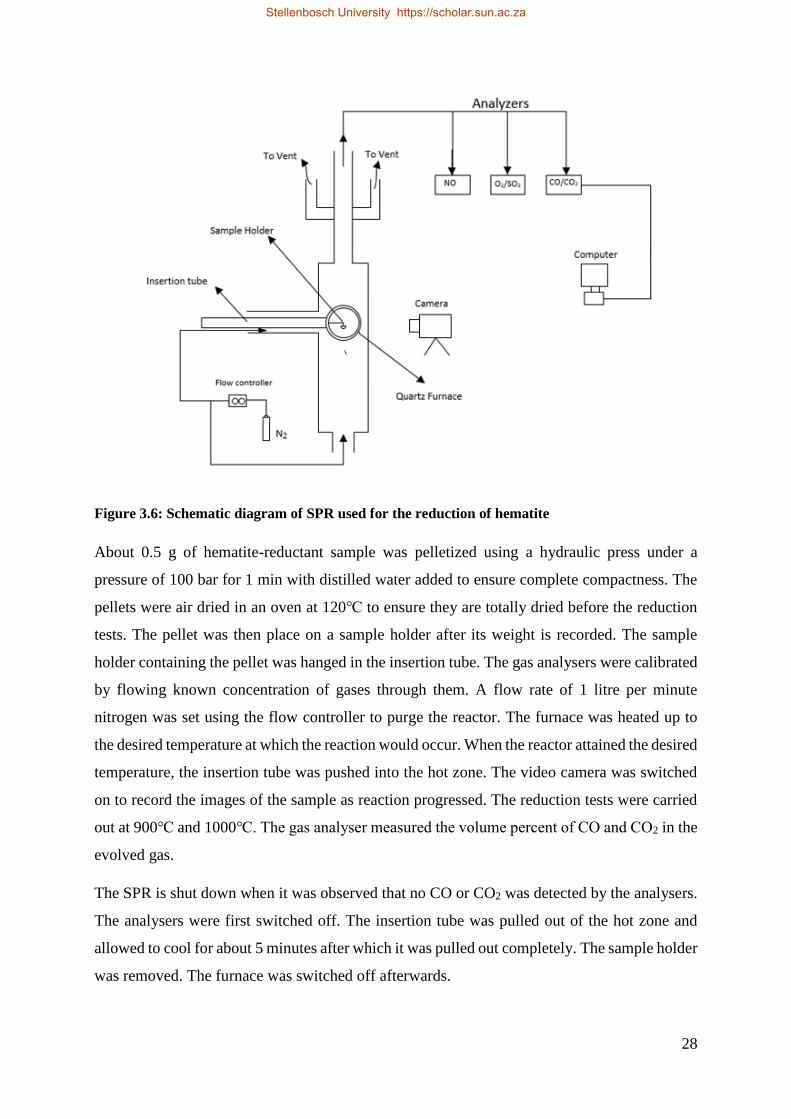
28
Figure 3.6: Schematic diagram of SPR used for the reduction of hematite
About 0.5 g of hematite-reductant sample was pelletized using a hydraulic press under a
pressure of 100 bar for 1 min with distilled water added to ensure complete compactness. The
pellets were air dried in an oven at 120℃ to ensure they are totally dried before the reduction
tests. The pellet was then place on a sample holder after its weight is recorded. The sample
holder containing the pellet was hanged in the insertion tube. The gas analysers were calibrated
by flowing known concentration of gases through them. A flow rate of 1 litre per minute
nitrogen was set using the flow controller to purge the reactor. The furnace was heated up to
the desired temperature at which the reaction would occur. When the reactor attained the desired
temperature, the insertion tube was pushed into the hot zone. The video camera was switched
on to record the images of the sample as reaction progressed. The reduction tests were carried
out at 900℃ and 1000℃. The gas analyser measured the volume percent of CO and CO2 in the
evolved gas.
The SPR is shut down when it was observed that no CO or CO2 was detected by the analysers.
The analysers were first switched off. The insertion tube was pulled out of the hot zone and
allowed to cool for about 5 minutes after which it was pulled out completely. The sample holder
was removed. The furnace was switched off afterwards.
Stellenbosch University https://scholar.sun.ac.za
29
3.4 Thermodynamic Simulations
FactSage© and EMSIM simulator (Ex Mente Technologies, 2018) were used for the
thermodynamic simulations. The characteristics of the leach residue of PCB together with
properties of chromite ore (Table 3.5), iron ore (Table 3.6) and coal (Table 3.7) reported in
literature were used as input in FactSage© software package and EMSIM.
Table 3.5: Composition of Chromite ore used for smelting (Ex Mente, 2018)
Phase Mass fraction, %
FeCr2O4 60.190
MgAl2O4 15.000
Fe2O3 9.936
Mg2SiO4 6.594
CaMg2Al16O27 3.352
Mg4Al10Si2O23 3.289
MgTiO3 0.997
MnTiO3 0.500
Cr2O3 0.116
CaSO4 0.013
Ca3P2O8 0.013
Table 3.6: Composition of Iron ore used for smelting (Sohn & Fruehan, 2005)
Phase Mass fraction, %
Fe2O3 90.08
SiO2 7.17
Al2O3 1.02
CaO 0.96
MgO 0.51
P2O5 0.09
MnO 0.07
Na2O 0.07
Table 3.7: Properties of Coal (Kleynhans et al., 2017)
Carbon Hydrogen Nitrogen Oxygen Calorific Value
80.10% 2.29% 1.45% 2.12% 30.49 MJ/kg
Moisture Ash Volatiles Fixed Carbon Sulphur
1.6% 11.7% 5.1% 81.6% 0.74%
3.4.1 EMSIM
EMSIM (Ex Mente Technologies, 2018) is a web-based modelling and simulation software that
users interact with through a web browser. It estimates process behaviour and performance
based on typical operational inputs, comparable to how the actual plant is operated. When feed
rates and ratios for the input streams are specified, the model would calculate the flow rates and
Stellenbosch University https://scholar.sun.ac.za
30
compositions of the output streams, as well as parameters such as yields, recoveries, specific
raw material consumptions, and specific energy consumption at equilibrium. EMSIM uses
FactSage thermochemical data. The FactSage data makes it possible to estimate the enthalpies
of input and output streams accurately, and therefore do accurate energy balance calculations.
The same data supports complex equilibrium calculations that are used to estimate the phase
composition of product streams and calculate properties such as liquidus temperatures and
viscosities (Zietsman, Steyn, & Pretorius, 2018).
Industrial flowsheet modelling was performed using EMSIM. Appendix A.1 shows the steps
used in creating the models. Chromite smelting operation carried out in an electric arc furnace
at 1700℃ was simulated using EMSIM. At temperatures 900℃, 1000℃, 1100℃, 1200℃ and
1700℃, iron smelting in a blast furnace were simulated using EMSIM. The inputs were
repeated in each case varying the blend and the organic content of the PCB. The off-gas
composition, degree of metallization and the energy required by each of the blends were
compared to coal under the same conditions.
3.4.2 FactSage
Since there is an infinite number of products and arrangements that can be produced from
certain reactants, it is vital to ascertain which products are favoured given chemical
composition, temperature and pressure. The final products formed during the reduction of ore
will be the species with the lowest Gibbs energy from the reactants. FactSage equilib module
makes use of the Gibbs energy minimization algorithm for determining the products of complex
heterogeneous equilibrium using compound and solution databases. The thermodynamic
calculations do not consider the kinetics of the reaction as well as the physical properties of the
products such as viscosity of slag, entrainment of alloy etc. (Bale et al., 2008; Malan, 2014).
Thermodynamic calculations were performed using equilib module of FactSage 6.2 to predict
the outcome of the reduction of hematite. After a new equilibrium calculation was created, the
appropriate units were selected. The ‘initial conditions’ was deactivated and new reactants
added. 1 g of hematite was reduced with 0.532 g of reductant as used in the reduction tests.
Table 3.4 show the masses used in each calculation. The properties of the PCB residue
previously saved as mixtures were imported and added as a mixture. The FACT, ELEM, STGE
and FToxid databases were selected for the calculations.
Stellenbosch University https://scholar.sun.ac.za
31
Figure 3.7: 6 basic steps for setting up and simulating a thermodynamic model in FactSage
Thermodynamic calculations were performed from 25℃ to 1500℃ with 25℃ interval. The
compound species and the solution phases selected were, ideal gas, pure solids, Monoxide,
Slag, Spinel, Liquid iron, BCC and, FCC. The ‘normal’ equilibrium was activated before the
calculations were performed at 1 atm.
Thermodynamic Modelling in
FactSage
PCB, Hematite Graphite
Selection of Databases
(Fact, Elem, FactOxid,
STGE)
Insert feed species and
specify initial conditions
Select possible phase formation
and enter values of variables that
are to be evaluated
Pure solid, Ideal gas,
Monoxide, Slag, FCC, BCC
and liquid iron
Repeat for all
simulations
Simulate model
Export results to Excel Sheet
Stellenbosch University https://scholar.sun.ac.za

32
4 Results and Discussion
4.1 PCB Leach Residue Characterization
The residue obtained after leaching PCB was characterized using different techniques.
The ultimate analysis or elemental analysis shows that PCB contains carbon and hydrogen
content of 30.43% and 3.10% respectively (Table 4.1). The carbon content is significantly less
than that of coal (80%), while hydrogen composition is slightly greater than coal (1.60%) as
shown in Table 3.7. Both elements give an indication of the reduction potential of PCB although
hydrogen has a higher reduction potential. The presence of both carbon and hydrogen indicates
the existence of hydrocarbons in the PCB. Carpenter, (2010) stated that the hydrogen bearing
materials improves indirect reduction because the generation of H2 as seen in Equation B.14 is
less endothermic and proceeds faster than CO regeneration (Equation B.15).
The weight percent of nitrogen and sulphur in the PCB is 1.42% and 0.63% respectively. These
values are similar to the amount present in coal (Table 3.7). The presence of nitrogen and
sulphur may be attributed to nitrogen and sulphur containing compounds in the flame-retardants
or plastics of the PCB. Polyurethane (PU) is a nitrogen-containing polymer which is made of
recurrent units of urethane (–NH–COO–). Its presence in PCB may be the source of nitrogen.
The analysis also revealed oxygen percentage of 20.72%. This value is greater than the oxygen
in coal (2.12%) in Table 3.7. Dankwah et al. (2015) investigated the use of mixed plastics as a
reductant in iron making. They observed a high CO2 emission when PET was used as a
reductant and attributed it to a high oxygen content. It can be inferred from their observation
that the high amount of oxygen present in PCB will lead to increase in the amount of CO2 during
reduction.
Table 4.1: Ultimate analysis of PCB leach residue (wt%)
Carbon Hydrogen Nitrogen Sulphur Oxygen
30.43 3.10 1.42 0.63 20.72
Table 4.2: Proximate analysis of PCB leach residue (wt%)
Moisture Content Volatile Matter Fixed Carbon Ash Content
3.60 44.80 11.50 40.10
The proximate analysis (Table 4.2) reveals that PCB decomposes with a significantly higher
amount of volatile matter compared to coal as shown in Table 3.7. PCB contains epoxy resin,
Stellenbosch University https://scholar.sun.ac.za

33
different kinds of plastics, flame retardants, and fillers. These materials decompose at high
temperature thus increasing the percentage of the volatile matter in the PCB. Moreover, plastics
are made of long polymeric chains of carbon and hydrogen. It has been reported that the use of
plastics in blast furnaces leads to production of C1 to C4 hydrocarbons, H2 and CO which are
known to have reduction potential (Sahajwalla et al., 2010).
The moisture content of PCB (3.6%), representing the amount of water present in the PCB, is
slightly higher than that of coal (1.6%) in Table 3.7. The moisture present is likely to be the
water left after drying since the PCB may not have been completely dried after the leaching
test. The water content may contribute to the formation of CO and H2 by reacting with carbon
as shown in Equation B.13. Both CO and H2 formed take part in the reduction process. Thus,
the moisture content indirectly enhances the reduction process. However, Carpenter (2010)
reported that high moisture contents affect handleability of the reducing agent since it causes
blockage during transport to injection lances of blast furnace. Moreover, energy is consumed
in driving off the water content.
The fixed carbon of PCB (11.5%) represents the carbon content present in the char after
decomposition of the PCB. This value is lower than that of the coal (81.6%). The fixed carbon
also takes part in the reduction process.
The ash composition represents the inorganic content present in the PCB which remains
unchanged after combustion (Evangelopoulos et al., 2015). PCB has ash content of about
40.1%, which is notably higher than coal (11.7%) in Table 3.7. This is attributed to the presence
of glass fibre and ceramics as well as metals used for the PCB. The glass fibre and ceramics is
mainly composed of SiO2, Al2O3 and CaO.
The ash analysis and the XRF reveals that about 83% of the ash, representing about 30% of the
PCB, is SiO2. This is the highest percentage of the PCB. Carpenter, (2010) stated that SiO2 in
reductant may lead to the presence of Si in hot liquid metal. He also reported that most of the
silicon ended up in the slag (94%) with 4% in the hot metal and 2% in the dust. Some of the
SiO2 is reduced under the reducing conditions and at high temperatures enters the molten iron
as shown in Equation 4.1
SiO2+ 2C(s) = Si(in liq. Fe) + 2CO(g) Equation 4.1
Alkaline oxides such as CaO, MgO, Fe2O3 were present in the PCB. It is believed that the
presence of the alkaline oxides acts as fluxes which lowers the melting temperatures,
Stellenbosch University https://scholar.sun.ac.za
34
particularly in the presence of excess SiO2. Table 4.5 and Appendix C show the results of XRF
scan of PCB residue.
Even though the PCB was leached to ensure that all the metals completely dissolved in the acid,
traces of metals like Cu, Ba, Ni etc. as shown in Table 4.3 were present in the ash. These metals
mainly came from the soldering tin, copper foil and other electronic components of the PCB.
The presence of Cu is undesirable in iron making process because it makes steel brittle (Fink,
1999; Lotfian et al., 2016).
Table 4.3: Ash content of PCB leach residue using ICP-OES (wt%)
SiO2 Al2O3 Fe2O3 TiO2 CaO MgO K2O MnO P
84.00 6.28 0.73 0.73 6.00 0.70 0.07 0.01 0.02
83.90 6.39 0.74 0.74 6.05 0.70 0.08 0.01 0.02
Ba Cr Cu Ni Sn Sr V Zn Zr
0.49 0.01 0.11 0.03 0.07 0.04 < 0.01 0.03 0.01
0.49 0.01 0.11 0.03 0.07 0.04 < 0.01 0.03 0.01
Table 4.4: Halide Content and calorific value of PCB leach residue
The presence of halides (F and Cl) shown in Table 4.4 is due to the halogenated flame retardant
of the PCB. The chlorine present may also be attributed to PVC plastic in the PCB. As reported
previously in 2.5, the presence of chlorine may lead to the formation of chlorine containing gas
such as HCl when PCB is used as a reductant. Several studies on recycling plastics have
reported that addition of CaO or limestone aids in dehalogenation of plastics by neutralizing
the HBr or HCl formed (Shen et al., 2016; Vasile et al, 2006). It can be inferred from this that
the CaO present in the ash helps in dehalogenation of PCB.
The calorific value of PCB is less than that of coal. The low calorific value is ascribed to the
high ash content of the PCB. The calorific value represents the energy value of the PCB.
According to Hadi et al. (2015), the glass fibers of PCB are converted to a glassy slag resulting
in a drastic reduction in the combustion efficiency.
XRD analysis (Figure 4.1) revealed that PCB is highly amorphous. Trace amounts of lithium
titanium oxide and quartz were also seen.
F, mg/kg Cl, mg/kg Calorific value, MJ/kg
2500 4174 12.08
2602 4162
Stellenbosch University https://scholar.sun.ac.za

35
Figure 4.1: XRD pattern of PCB leach residue
Table 4.5: XRF results of PCB leach residue (wt%)
Al2O3 CaO Cr2O3 Fe2O3 K2O MgO
2.62 2.66 bdl 0.31 0.02 0.25
MnO Na2O P2O5 SiO2 TiO2 L.O.I.
bdl 0.03 0.02 31.86 0.31 59.85
bdl = below detection limit; LOI = loss on ignition
(a) (b)
Figure 4.2: SEM images of PCB leach residue (a) with spectrum labels; (b) without spectrum label
Figure 4.2 shows two SEM images of the PCB sample. The results revealed that the residue
contained carbon which ranged from 17 wt% to 60 wt% among different particles. Oxygen
content among the particles was varying from 26 wt% to 60 wt%. Silicon content ranged from
0.65 wt% to 30 wt%. Aluminium also fluctuated from particle to particle from 0.69 wt% to 6.85
Position [°2θ] (Cobalt (Co))10 20 30 40 50 60 70
Counts
0
5000
10000
15000
SU_D Kyei_PLB Residue
Quartz 0.30 %
Lithium Titanium Oxide 0.27 %
Amorphous 99.43 %
Peak List
Quartz; Si O2
Li2 Ti O3
Silicon, syn; Si
Stellenbosch University https://scholar.sun.ac.za

36
wt%. Other elements like chlorine, iron, copper and titanium were detected by the SEM (Table
4.6)
Table 4.6: Composition and weight percent of elements in the PCB grains
Spectrum Label Spectrum
1 2 3 4 5
C 46.92 18.4 17.29 54.15 60.42
O 26.53 46.01 60.5 36.05 29.98
S 0.00 0.50 0.00 0.00 0.00
Al 1.08 0.65 0.96 5.75 6.85
Si 15.99 30.3 19.53 2.27 0.54
Cl 7.94 1.50 0.51 1.77 2.20
Ca 0.00 0.31 0.81 0.00 0.00
Ti 0.00 0.33 0.40 0.00 0.00
Fe 0.61 0.00 0.00 0.00 0.00
Cu 0.93 0.00 0.00 0.00 0.00
Total 100 100 100 100 100
Figure 4.3: FTIR of PCB leach residue
FTIR analysis was performed on the PCB leach residue to determine the functional groups of
the organic content present and establish the type of polymeric content in PCB. Figure 4.3
shows the peaks and the corresponding functional groups. Rajagopal et al. (2017) observed a
similar pattern in the investigation on sustainable composite panels from non-metallic waste
printed circuit boards and automotive plastics.
65
70
75
80
85
90
95
100
105
5001000150020002500300035004000
Tran
smit
ance
Wave number, cm-1
C=O
C=H
C-H
Bending
C=O
Stellenbosch University https://scholar.sun.ac.za

37
4.2 Thermal Behaviour of Reagents
Hematite, graphite and PCB were placed individually in the DSC and heated to 1200℃ at
10℃/min in argon atmosphere. Figure 4.4 to Figure 4.6 shows the thermal behaviour of
hematite, graphite and PCB respectively under inert conditions.
Figure 4.4: Thermal analysis Hematite only
Figure 4.5: Thermal analysis of graphite only
The test with hematite alone Figure 4.4 reveals a slight exothermic peak at about 800℃. This
is due to the formation of magnetite. According to Cao et al. (1999), hematite is converted to
magnetite when it is heated under inert atmosphere above 420℃ as shown in Equation 4.2.
3Fe2O3 = 2Fe3O4 + 1/2 O2 Equation 4.2
Stellenbosch University https://scholar.sun.ac.za

38
There was no significant change in mass when hematite only and graphite only were heated to
1200℃. However, there was a notable loss of mass during the run with PCB only (Figure 4.6).
About 30% of the PCB mass was lost between temperatures 275℃ and 325℃. This was also
observed by Li et al. (2010) during low-temperature pyrolysis of PCB as well as Rajagopal et
al. (2016) in kinetic studies of high-temperature transformations of waste printed circuit boards
from computer monitor and CPU. The mass loss is attributed to the pyrolysis of PCB. Epoxy
resin, the flame retardants and polymer content in the PCB decompose and are released in
gaseous form. The mass spectrometer detected the presence of CO, CO2, HBr, S2 and
hydrocarbons like CH4 and C2H6 in the off-gas as shown in Figure 4.7 and Figure 4.8
Figure 4.6: Thermal analysis of PCB only
Stellenbosch University https://scholar.sun.ac.za

39
Figure 4.7: Composition of off-gas during thermal analysis of PCB
Figure 4.8: Off-gases produced with lower ion current
PCB and graphite were mixed in the same ratio as 20%PCB blend (Table 3.4) and heated from
ambient temperature to 1200℃ in argon atmosphere. This was done to ascertain the interaction
of PCB and graphite in the blend. Figure 4.9 reveals no distinct DSC peaks. However, mass
loss (10%) occurred around 300℃ and a slight mass loss (about 3%) afterwards. Mass loss at
300℃ is attributed to the pyrolysis of PCB. The mass loss seen after 300℃ indicates that PCB
partially interacts with graphite in blend. Moreover, CO peak seen at 600℃ may also be
attributed to PCB-graphite interaction.
0.00
0.50
1.00
1.50
2.00
2.50
3.00
0 200 400 600 800 1000 1200 1400
Ion
cu
rren
t x1
0-1
0
Temperature,℃
CO CO2
CH4 C2H6
0.00
2.00
4.00
6.00
8.00
10.00
12.00
14.00
16.00
18.00
0.00
5.00
10.00
15.00
20.00
25.00
30.00
35.00
0 200 400 600 800 1000 1200 1400
S2 Io
n C
urr
ent
x10
-12
Ion
Cu
rren
t x1
0-1
3
Temperature, ℃
HBr
HS
S2
Stellenbosch University https://scholar.sun.ac.za

40
Figure 4.9: Thermal analysis of graphite and 20%PCB
4.3 Hematite reduction in DSC-TGA under Non-Isothermal Conditions
4.3.1 Hematite Reduction with Graphite
During the hematite-graphite reduction, the mass of the sample (Figure 4.10) starts to decrease
around 900℃. This indicates the onset of the reduction of hematite. It is believed that hematite
is converted to magnetite at 900℃, due to the change in mass and the release of CO2. Jung &
Yi (2013) attributed the initial formation of CO2 as a combination of Equation 4.3 and Equation
4.4. They stated that the gas-solid reaction (Equation 4.4) is faster than the solid-solid reaction
(Equation 4.3). CO produced quickly reacts with hematite and produces CO2. Thus only CO2
is observed by the mass spectrometer.
Two endothermic peaks were observed during the reduction of hematite using graphite at
1120℃ and 1150℃ respectively as shown in Figure 4.10. It is believed that iron is formed at
1120℃. This is because at that temperature, there is a steep mass change which corresponds
with a CO peak. The mass change is also attributed to gasification of carbon or a dominant
Boudouard reaction (Equation 4.5). It can be seen by the sudden increase in the partial pressure
of CO. The increase in the CO is believed to accelerate the formation of iron. The endothermic
peak at 1150℃ may be ascribed to the melting of the graphite in the iron since the peak did not
have a corresponding change in mass. This serves as a confirmation of the formation of iron at
1120℃. The mechanism for solid state reduction of hematite is described in Appendix B.1.
Stellenbosch University https://scholar.sun.ac.za

41
3Fe2O3(s) + C(s) = 2Fe3O4(s) + CO(g) Equation 4.3
CO(g) + 3Fe2O3(s) = 2Fe3O4(s) + CO2(g) Equation 4.4
C(s) + CO2(g) = 2CO(g) Equation 4.5
Figure 4.10: Reduction of Hematite with Graphite
4.3.2 Hematite Reduction with PCB only
In the reduction test of hematite with 100%PCB (Figure 4.11), the mass change observed
around 300℃ is due to the pyrolysis of the PCB.
It can be inferred that the reduction of hematite with PCB has faster kinetics than reduction with
graphite. This is due to the steady mass loss at temperatures between 500℃ and 900℃ as well
as the release of CO and CO2. PCB releases volatiles which contain hydrocarbons capable of
reducing hematite at lower temperatures than pure carbon. Chongmin et al. (2009), in their
study on the use of plastics in iron oxide reduction stated that the high percentage of volatile
matter in plastics increases porosity. The increase in porosity facilitates the mass transfer
conditions in the gas-solid reaction system and enlarges the reaction interfacial area for
reduction which improves reduction of iron oxide.
Sohn & Fruehan (2005) found that up to 900℃, reduction by H2 is considerably faster than by
carbon in pellet or by CO. Equation B.2 shows that during the decomposition of hydrocarbons
in the PCB, H2 is released and it takes part in the reduction process as shown in Equation B.8.
Moreover, it is believed that the plastics content present in the PCB forms a liquid phase which
allows it to have more contact with the hematite during reduction experiments.
Stellenbosch University https://scholar.sun.ac.za

42
FactSage© predicts the formation of fayalite (Fe2SiO4) between 200℃ and 800℃ when PCB
is used as a reducing agent for hematite. The exothermic peak observed at 750℃ is attributed
to the formation of Fe2SiO4 (Equation 4.8).
Fe2O3 + 3CH4 = 2Fe+ 6H2 + 3CO Equation 4.6
Fe2O3 + 3C2H6 = 2Fe+ 9H2 + 3CO Equation 4.7
Fe2O3 + SiO2 = Fe2SiO4 + 1/2O2 Equation 4.8
Figure 4.11: Reduction of Hematite with 100%PCB
Figure 4.12: Hydrocarbons present in off-gas during hematite reduction with 100%PCB
Figure 4.12 shows the peaks of CH4 and C2H6 that was detected during hematite-100%PCB
reduction. The peaks identified at temperatures less than 500℃ is due to the pyrolysis of PCB.
0
0.05
0.1
0.15
0.2
0.25
0.3
0 200 400 600 800 1000 1200 1400
Ion
Cu
rren
t, X
10
-10
Temperature, ℃
CH4
C2H6
Stellenbosch University https://scholar.sun.ac.za
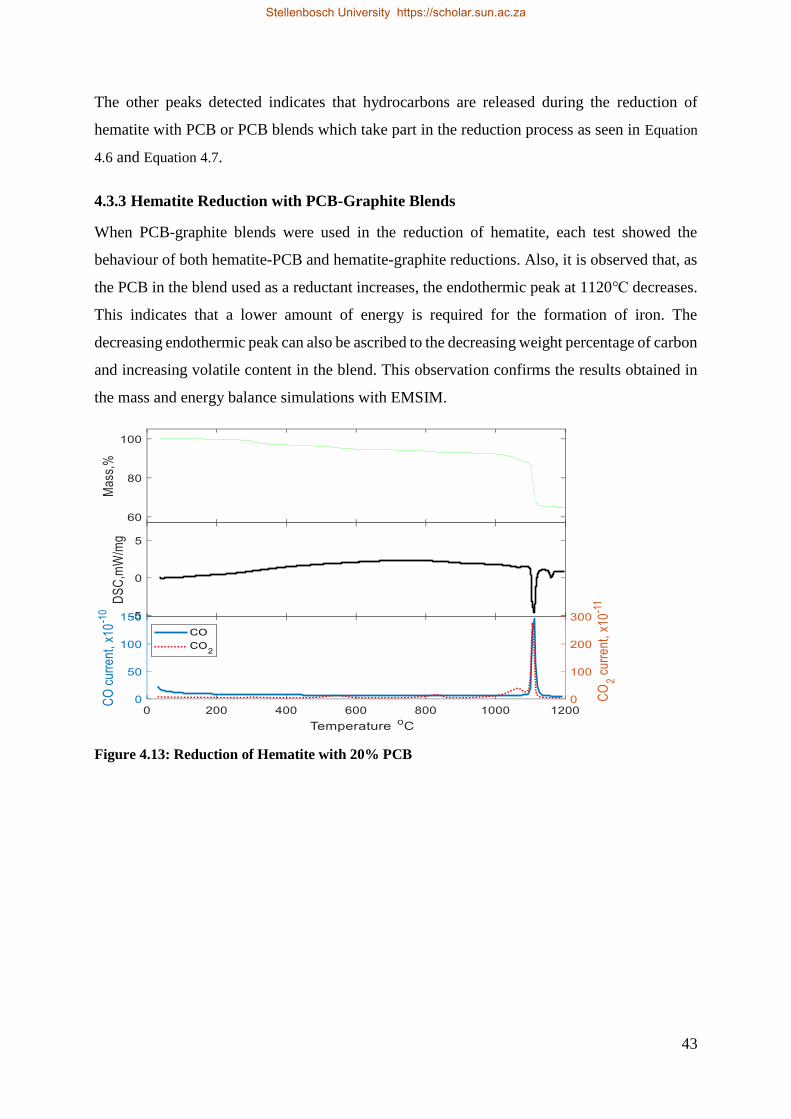
43
The other peaks detected indicates that hydrocarbons are released during the reduction of
hematite with PCB or PCB blends which take part in the reduction process as seen in Equation
4.6 and Equation 4.7.
4.3.3 Hematite Reduction with PCB-Graphite Blends
When PCB-graphite blends were used in the reduction of hematite, each test showed the
behaviour of both hematite-PCB and hematite-graphite reductions. Also, it is observed that, as
the PCB in the blend used as a reductant increases, the endothermic peak at 1120℃ decreases.
This indicates that a lower amount of energy is required for the formation of iron. The
decreasing endothermic peak can also be ascribed to the decreasing weight percentage of carbon
and increasing volatile content in the blend. This observation confirms the results obtained in
the mass and energy balance simulations with EMSIM.
Figure 4.13: Reduction of Hematite with 20% PCB
Stellenbosch University https://scholar.sun.ac.za
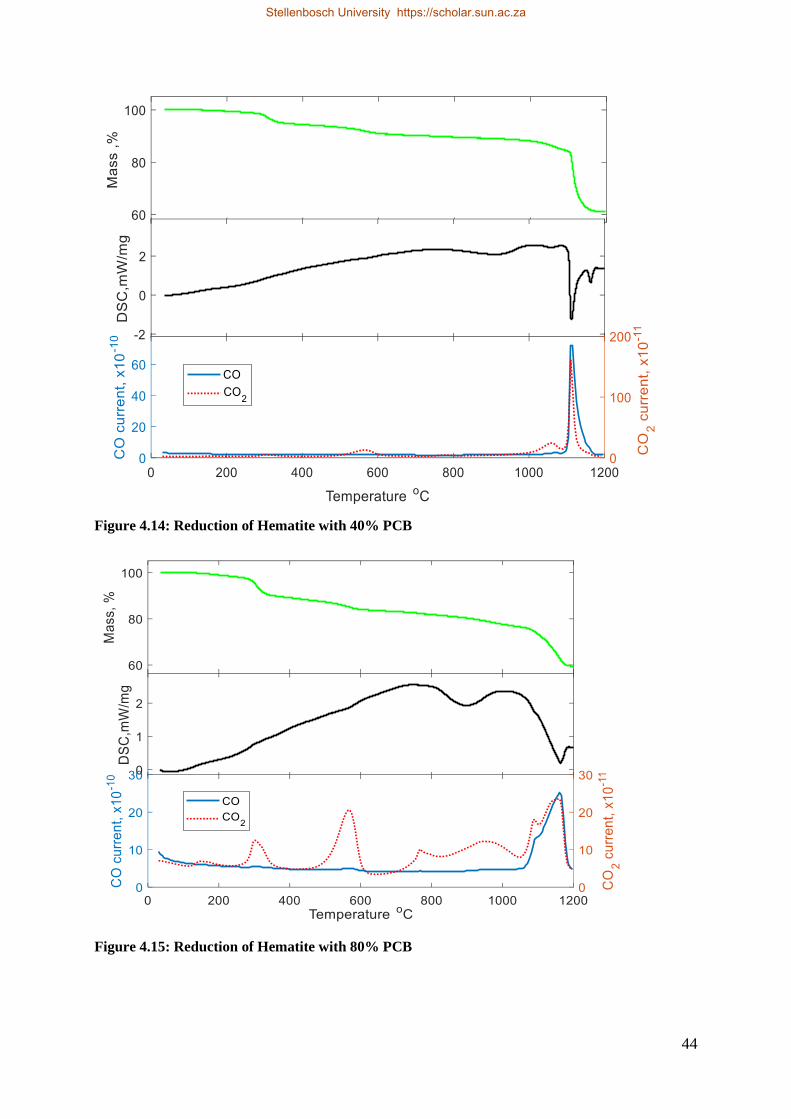
44
Figure 4.14: Reduction of Hematite with 40% PCB
Figure 4.15: Reduction of Hematite with 80% PCB
Stellenbosch University https://scholar.sun.ac.za

45
4.3.4 Reduction Degree
The reduction degree is an indication of how much oxygen has been removed from the hematite.
It was calculated using Equation 4.10 based on the mass lost during the reduction in the DSC-
TGA (Jung & Yi, 2013). Appendix B.3 shows the procedure for reduction degree calculation.
The overall reduction may be expressed by the reaction
Fe2O3 (s) + 3C = 2Fe + 3CO Equation 4.9
Reduction Degree = ∆𝑊
𝑊⁄
3𝑀𝑊𝐶𝑂(𝑀𝑊𝐹𝑒2𝑂3+3𝑀𝑊𝐶 )⁄
Equation 4.10
∆W = Mass lost; W = initial mass; MWCO = Molecular weight of CO; MWFe2O3 = Molecular
weight of Fe2O3 and MWC = Molecular weight of C
Figure 4.16: Reduction degree
The reduction degree calculated revealed that PCB reduces hematite better at temperatures
lower than 1000℃. However, at temperatures greater than 1100℃, graphite acts as a better
reductant. At the end of the reduction test, the use of graphite and 20%PCB gave the highest
reduction degree of about 97%. Moreover, it is observed that increasing the mass percent of
PCB in the reductant leads to an overall decrease in the reduction degree.
Hematite reduction test in DSC-TGA were repeated. Figure B2 to B6 shows the mass loss of
the occurred during each test and their respective repeats. The standard deviation at each of the
0
0.1
0.2
0.3
0.4
0.5
0.6
0.7
0.8
0.9
1
0 200 400 600 800 1000 1200 1400
Red
uct
ion
Deg
ree
Temperature, ℃
Hematite and Graphite
Hematite and 100%PCB
Hematite and 20%PCB
Hematite and 40%PCB
Hematite and 80%PCB
Stellenbosch University https://scholar.sun.ac.za
46
temperatures were calculated. Table B1 to B5 shows the mass and the standard deviation at
selected temperatures during reduction of hematite. Since each of the reduction tests has over
11600 data points, the temperatures 50℃ to 1200℃ with intervals 50℃ were selected. The
average value for the standard deviation for all the data point is shown in Table B6
4.3.5 SEM Analysis on the Products
The products obtained from each of the reduction test was analysed using back scattered SEM
analysis. The images reveal very bright spots when PCB or blends of PCB are used as reducing
agent. SEM produces brighter spots to indicate the presence of elements with higher atomic
mass. The analysis of the bright spots in the products of the reduction test with PCB reveal the
presence of iron, barium and silicon. The presence of iron and silicon may be attributed to the
fayalite that was formed. SEM analysis of hematite-graphite reduction shows the presence of
only iron and carbon. The image show tiny bright spots which is almost evenly distributed in
the sample. This is an indication that the excess carbon melts into the iron that was formed.
Stellenbosch University https://scholar.sun.ac.za
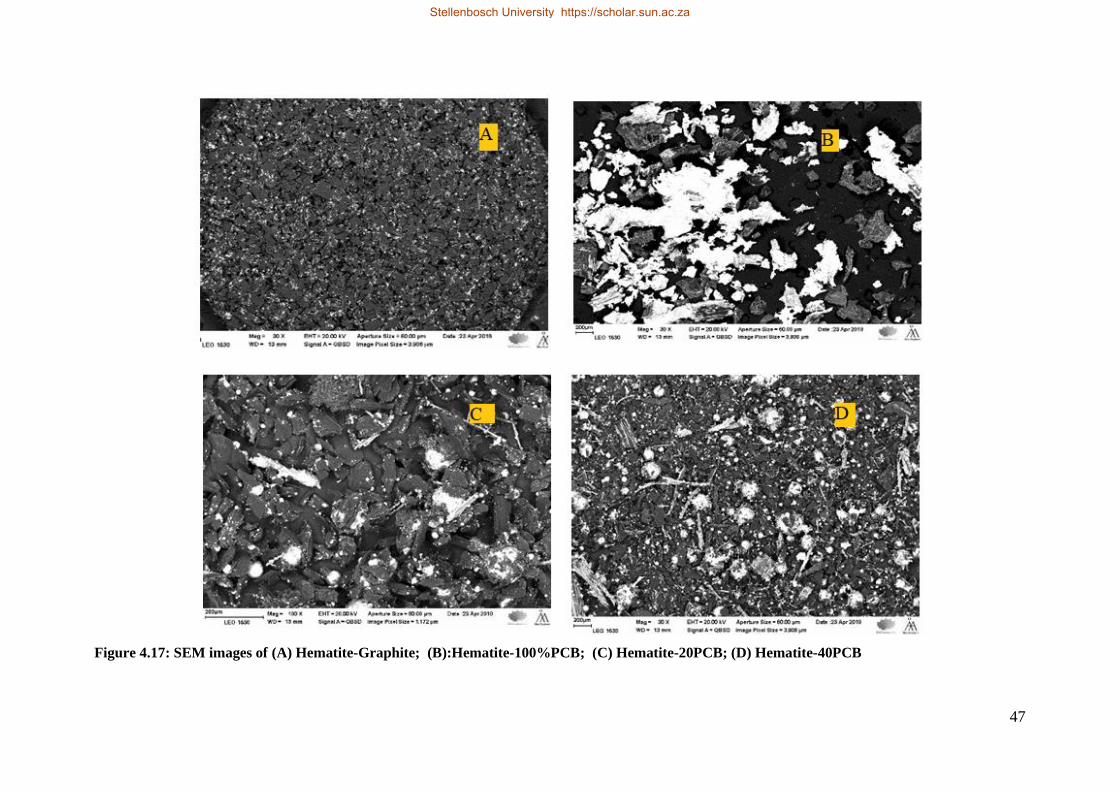
47
Figure 4.17: SEM images of (A) Hematite-Graphite; (B):Hematite-100%PCB; (C) Hematite-20PCB; (D) Hematite-40PCB
Stellenbosch University https://scholar.sun.ac.za
Stellenbosch University https://scholar.sun.ac.za
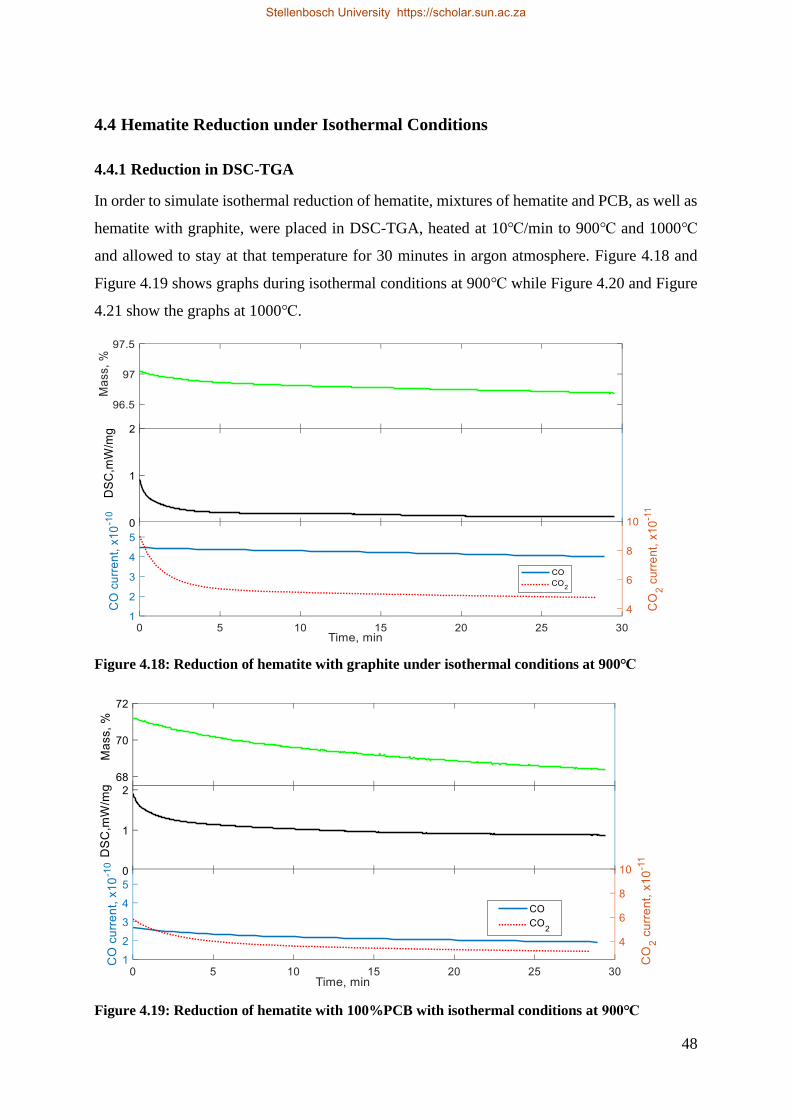
48
4.4 Hematite Reduction under Isothermal Conditions
4.4.1 Reduction in DSC-TGA
In order to simulate isothermal reduction of hematite, mixtures of hematite and PCB, as well as
hematite with graphite, were placed in DSC-TGA, heated at 10℃/min to 900℃ and 1000℃
and allowed to stay at that temperature for 30 minutes in argon atmosphere. Figure 4.18 and
Figure 4.19 shows graphs during isothermal conditions at 900℃ while Figure 4.20 and Figure
4.21 show the graphs at 1000℃.
Figure 4.18: Reduction of hematite with graphite under isothermal conditions at 900℃
Figure 4.19: Reduction of hematite with 100%PCB with isothermal conditions at 900℃
Stellenbosch University https://scholar.sun.ac.za

49
Figure 4.20: Reduction of hematite with graphite with isothermal conditions at 1000℃
Figure 4.21: Reduction of hematite with 100%PCB with isothermal conditions at 1000℃
The test with 100%PCB (Figure 4.19 and Figure 4.21) as reductants showed a mass change less
than 4% of the initial mass during isothermal condition at both temperatures. There was no
observable change when hematite was reduced with graphite at 900℃ (Figure 4.18). However,
a mass change of about 3% was seen at 1000℃ (Figure 4.20) during the test with graphite as
Stellenbosch University https://scholar.sun.ac.za
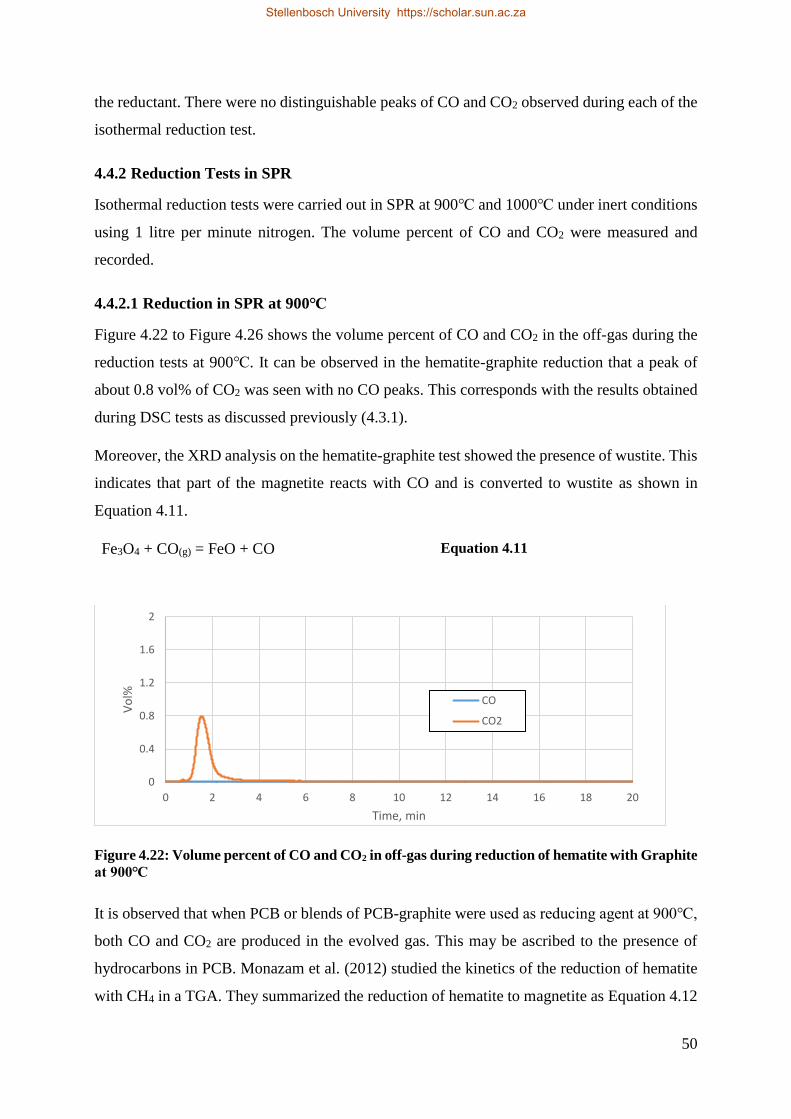
50
the reductant. There were no distinguishable peaks of CO and CO2 observed during each of the
isothermal reduction test.
4.4.2 Reduction Tests in SPR
Isothermal reduction tests were carried out in SPR at 900℃ and 1000℃ under inert conditions
using 1 litre per minute nitrogen. The volume percent of CO and CO2 were measured and
recorded.
4.4.2.1 Reduction in SPR at 900℃
Figure 4.22 to Figure 4.26 shows the volume percent of CO and CO2 in the off-gas during the
reduction tests at 900℃. It can be observed in the hematite-graphite reduction that a peak of
about 0.8 vol% of CO2 was seen with no CO peaks. This corresponds with the results obtained
during DSC tests as discussed previously (4.3.1).
Moreover, the XRD analysis on the hematite-graphite test showed the presence of wustite. This
indicates that part of the magnetite reacts with CO and is converted to wustite as shown in
Equation 4.11.
Fe3O4 + CO(g) = FeO + CO Equation 4.11
Figure 4.22: Volume percent of CO and CO2 in off-gas during reduction of hematite with Graphite
at 900℃
It is observed that when PCB or blends of PCB-graphite were used as reducing agent at 900℃,
both CO and CO2 are produced in the evolved gas. This may be ascribed to the presence of
hydrocarbons in PCB. Monazam et al. (2012) studied the kinetics of the reduction of hematite
with CH4 in a TGA. They summarized the reduction of hematite to magnetite as Equation 4.12
0
0.4
0.8
1.2
1.6
2
0 2 4 6 8 10 12 14 16 18 20
Vo
l%
Time, min
CO
CO2
Stellenbosch University https://scholar.sun.ac.za
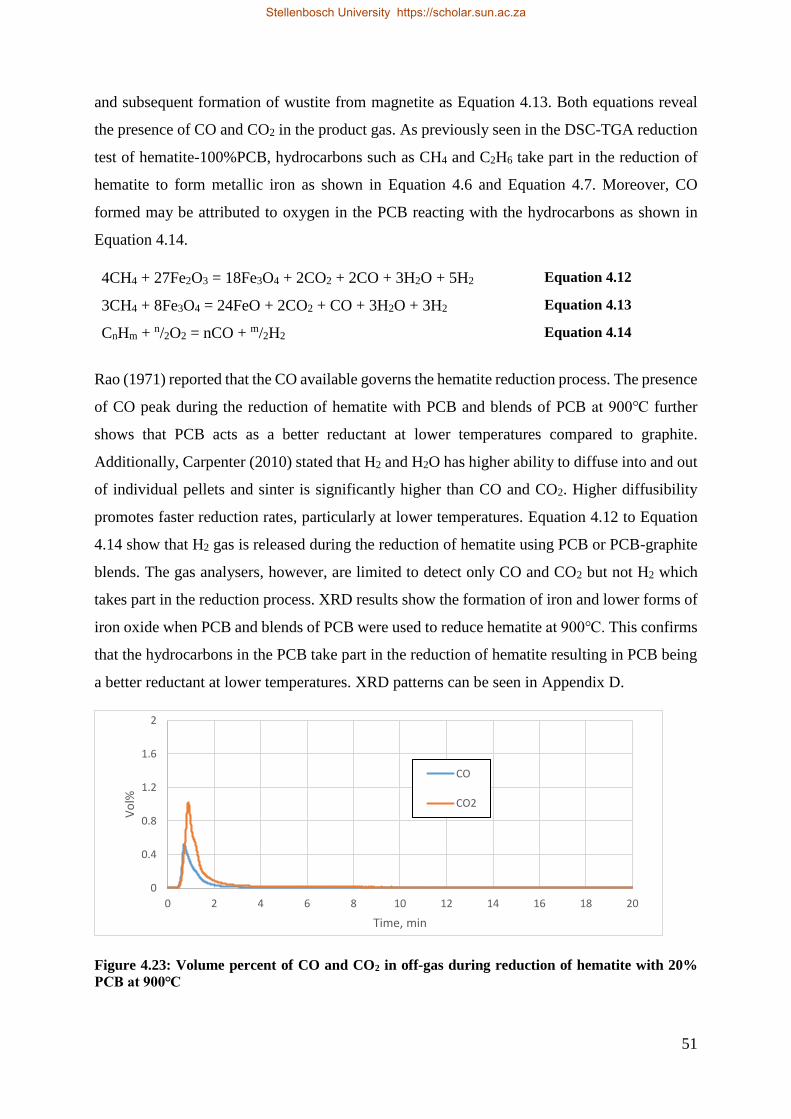
51
and subsequent formation of wustite from magnetite as Equation 4.13. Both equations reveal
the presence of CO and CO2 in the product gas. As previously seen in the DSC-TGA reduction
test of hematite-100%PCB, hydrocarbons such as CH4 and C2H6 take part in the reduction of
hematite to form metallic iron as shown in Equation 4.6 and Equation 4.7. Moreover, CO
formed may be attributed to oxygen in the PCB reacting with the hydrocarbons as shown in
Equation 4.14.
4CH4 + 27Fe2O3 = 18Fe3O4 + 2CO2 + 2CO + 3H2O + 5H2 Equation 4.12
3CH4 + 8Fe3O4 = 24FeO + 2CO2 + CO + 3H2O + 3H2 Equation 4.13
CnHm + n/2O2 = nCO + m/2H2 Equation 4.14
Rao (1971) reported that the CO available governs the hematite reduction process. The presence
of CO peak during the reduction of hematite with PCB and blends of PCB at 900℃ further
shows that PCB acts as a better reductant at lower temperatures compared to graphite.
Additionally, Carpenter (2010) stated that H2 and H2O has higher ability to diffuse into and out
of individual pellets and sinter is significantly higher than CO and CO2. Higher diffusibility
promotes faster reduction rates, particularly at lower temperatures. Equation 4.12 to Equation
4.14 show that H2 gas is released during the reduction of hematite using PCB or PCB-graphite
blends. The gas analysers, however, are limited to detect only CO and CO2 but not H2 which
takes part in the reduction process. XRD results show the formation of iron and lower forms of
iron oxide when PCB and blends of PCB were used to reduce hematite at 900℃. This confirms
that the hydrocarbons in the PCB take part in the reduction of hematite resulting in PCB being
a better reductant at lower temperatures. XRD patterns can be seen in Appendix D.
Figure 4.23: Volume percent of CO and CO2 in off-gas during reduction of hematite with 20%
PCB at 900℃
0
0.4
0.8
1.2
1.6
2
0 2 4 6 8 10 12 14 16 18 20
Vo
l%
Time, min
CO
CO2
Stellenbosch University https://scholar.sun.ac.za

52
Figure 4.24: Volume percent of CO and CO2 in off-gas during reduction of hematite with 40%
PCB at 900℃
Figure 4.25: Volume percent of CO and CO2 in off-gas during reduction of hematite with 80%
PCB at 900℃
Figure 4.26: Volume percent of CO and CO2 in off-gas during reduction of hematite with
100%PCB at 900℃
0
0.4
0.8
1.2
1.6
2
0 2 4 6 8 10 12 14 16 18 20
Vo
l%
Time, min
CO
CO2
0
0.4
0.8
1.2
1.6
2
0 2 4 6 8 10 12 14 16 18 20
Vo
l%
Time, min
CO
CO2
0
0.4
0.8
1.2
1.6
2
0 2 4 6 8 10 12 14 16 18 20
Vo
l%
Time, min
CO
CO2
Stellenbosch University https://scholar.sun.ac.za
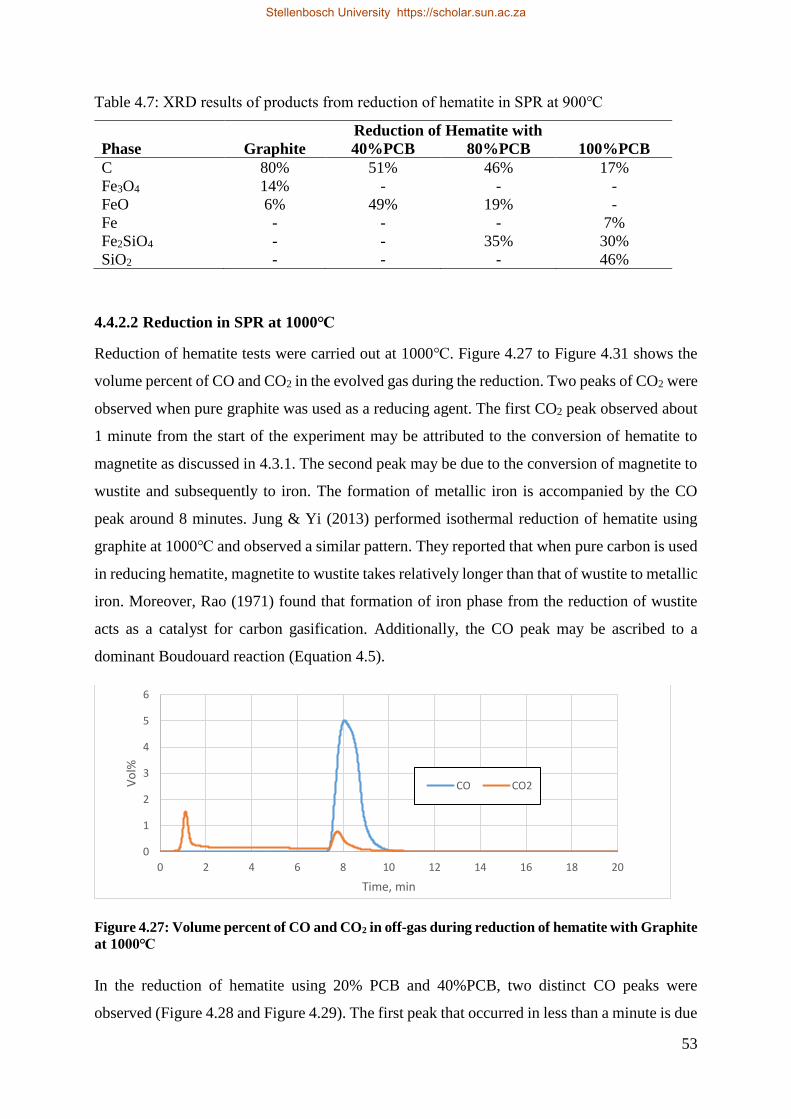
53
Table 4.7: XRD results of products from reduction of hematite in SPR at 900℃
Reduction of Hematite with
Phase Graphite 40%PCB 80%PCB 100%PCB
C 80% 51% 46% 17%
Fe3O4 14% - - -
FeO 6% 49% 19% -
Fe - - - 7%
Fe2SiO4 - - 35% 30%
SiO2 - - - 46%
4.4.2.2 Reduction in SPR at 1000℃
Reduction of hematite tests were carried out at 1000℃. Figure 4.27 to Figure 4.31 shows the
volume percent of CO and CO2 in the evolved gas during the reduction. Two peaks of CO2 were
observed when pure graphite was used as a reducing agent. The first CO2 peak observed about
1 minute from the start of the experiment may be attributed to the conversion of hematite to
magnetite as discussed in 4.3.1. The second peak may be due to the conversion of magnetite to
wustite and subsequently to iron. The formation of metallic iron is accompanied by the CO
peak around 8 minutes. Jung & Yi (2013) performed isothermal reduction of hematite using
graphite at 1000℃ and observed a similar pattern. They reported that when pure carbon is used
in reducing hematite, magnetite to wustite takes relatively longer than that of wustite to metallic
iron. Moreover, Rao (1971) found that formation of iron phase from the reduction of wustite
acts as a catalyst for carbon gasification. Additionally, the CO peak may be ascribed to a
dominant Boudouard reaction (Equation 4.5).
Figure 4.27: Volume percent of CO and CO2 in off-gas during reduction of hematite with Graphite
at 1000℃
In the reduction of hematite using 20% PCB and 40%PCB, two distinct CO peaks were
observed (Figure 4.28 and Figure 4.29). The first peak that occurred in less than a minute is due
0
1
2
3
4
5
6
0 2 4 6 8 10 12 14 16 18 20
Vo
l%
Time, min
CO CO2
Stellenbosch University https://scholar.sun.ac.za
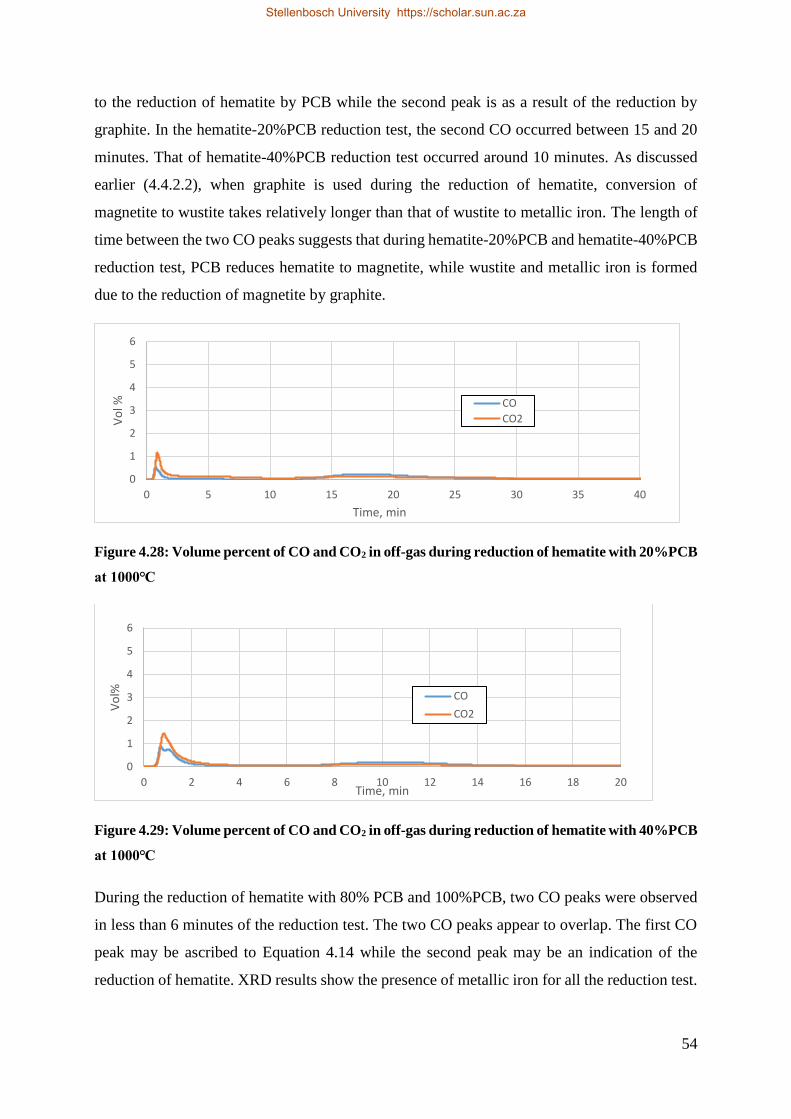
54
to the reduction of hematite by PCB while the second peak is as a result of the reduction by
graphite. In the hematite-20%PCB reduction test, the second CO occurred between 15 and 20
minutes. That of hematite-40%PCB reduction test occurred around 10 minutes. As discussed
earlier (4.4.2.2), when graphite is used during the reduction of hematite, conversion of
magnetite to wustite takes relatively longer than that of wustite to metallic iron. The length of
time between the two CO peaks suggests that during hematite-20%PCB and hematite-40%PCB
reduction test, PCB reduces hematite to magnetite, while wustite and metallic iron is formed
due to the reduction of magnetite by graphite.
Figure 4.28: Volume percent of CO and CO2 in off-gas during reduction of hematite with 20%PCB
at 1000℃
Figure 4.29: Volume percent of CO and CO2 in off-gas during reduction of hematite with 40%PCB
at 1000℃
During the reduction of hematite with 80% PCB and 100%PCB, two CO peaks were observed
in less than 6 minutes of the reduction test. The two CO peaks appear to overlap. The first CO
peak may be ascribed to Equation 4.14 while the second peak may be an indication of the
reduction of hematite. XRD results show the presence of metallic iron for all the reduction test.
0
1
2
3
4
5
6
0 5 10 15 20 25 30 35 40
Vo
l %
Time, min
CO
CO2
0
1
2
3
4
5
6
0 2 4 6 8 10 12 14 16 18 20
Vo
l%
Time, min
CO
CO2
Stellenbosch University https://scholar.sun.ac.za

55
Metallic iron present in the product of hematite-80%PCB and hematite-100%PCB shows that
H2 is released from PCB and takes part in the reduction of hematite to iron.
XRD also shows that fayalite is produced when PCB is used as a reducing agent.
Figure 4.30: Volume percent of CO and CO2 in off-gas during reduction of hematite with 80%PCB
at 1000℃
Figure 4.31: Volume percent of CO and CO2 in off-gas during reduction of hematite with
100%PCB at 1000℃
Table 4.8: XRD results of products from reduction of hematite in SPR at 1000℃
Reduction of Hematite with
Graphite 40%PCB 80%PCB 100%PCB
C 90% 90% 56% 31%
Fe3O4 - - - -
FeO - 4% - -
Fe 10% 5% 13% 17%
Fe2SiO4 - - 31% 51%
SiO2 - - - -
0
1
2
3
4
5
6
0 2 4 6 8 10 12 14 16 18 20
Vo
l%
Time, min
CO
CO2
0
1
2
3
4
5
6
0 2 4 6 8 10 12
Vo
l%
Time, min
CO
CO2
Stellenbosch University https://scholar.sun.ac.za

56
4.5 FactSage Simulations of Hematite Reduction
Reduction of pure hematite (Fe2O3) using pure carbon (graphite) as well as blends of PCB and
graphite were simulated using FactSage. This was done to predict and compare the products
expected during the reduction test in DSC-TGA. The masses used for the preparation of each
sample (Table 3.4) were used as input in FactSage and calculations were performed from 25℃
to 1500℃ with an interval of 25℃ (as described in Figure 3.7). Figure 4.32 to Figure 4.35 show
the mass fraction of the products that were predicted by FactSage.
It can be seen that the formation of solid iron starts around 700℃ for all the reduction tests.
Apart from the hematite-100%PCB and hematite-80%PCB reductions, liquid iron [Fe(liq)]
forms at temperatures above 1150℃ for all the reduction tests. When PCB or blends of PCB
are used as reductants, FactSage predicts the formation of fayalite (Fe2SiO4) between
temperatures 200℃ and 800℃. This is due to the presence of SiO2 in the PCB (Equation 4.8).
Figure 4.32: Mass fraction of products obtained from FactSage calculation during the reduction
of hematite with graphite.
Fe(s) = solid iron; Fe(liq) = liquid iron
At a temperature close to 700℃, there is a sharp increase in the mass of CO and a decrease in
the CO2 produced. This indicates the gasification of carbon.
Figure 4.36 and Figure 4.35 indicate that all the carbon present in the reductant is used up for
hematite-100%PCB and hematite-80%PCB reduction tests.
-0.1
0
0.1
0.2
0.3
0.4
0.5
0.6
0.7
0.8
0 200 400 600 800 1000 1200 1400 1600
Mas
s fr
acti
on
of
Pro
du
ct
Temperature, ℃
CO
CO2
Fe(liq)
Carbon
Fe(s)
Spinel
Stellenbosch University https://scholar.sun.ac.za
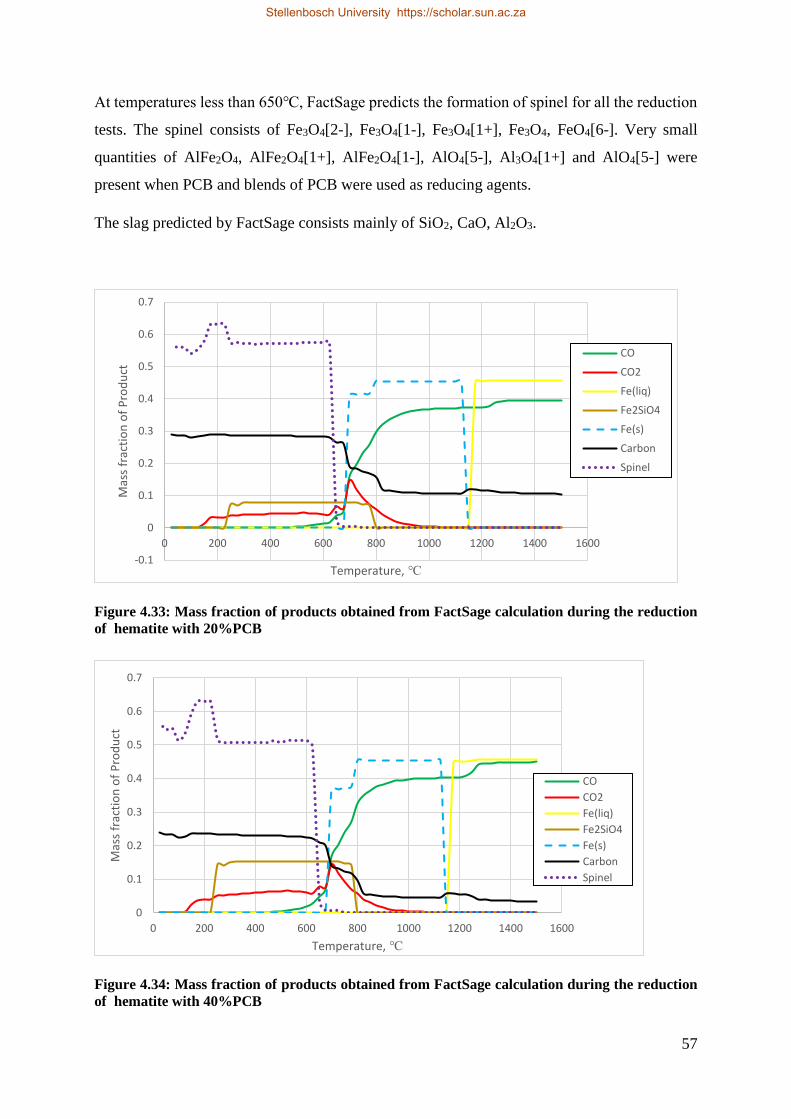
57
At temperatures less than 650℃, FactSage predicts the formation of spinel for all the reduction
tests. The spinel consists of Fe3O4[2-], Fe3O4[1-], Fe3O4[1+], Fe3O4, FeO4[6-]. Very small
quantities of AlFe2O4, AlFe2O4[1+], AlFe2O4[1-], AlO4[5-], Al3O4[1+] and AlO4[5-] were
present when PCB and blends of PCB were used as reducing agents.
The slag predicted by FactSage consists mainly of SiO2, CaO, Al2O3.
Figure 4.33: Mass fraction of products obtained from FactSage calculation during the reduction
of hematite with 20%PCB
Figure 4.34: Mass fraction of products obtained from FactSage calculation during the reduction
of hematite with 40%PCB
-0.1
0
0.1
0.2
0.3
0.4
0.5
0.6
0.7
0 200 400 600 800 1000 1200 1400 1600
Mas
s fr
acti
on
of
Pro
du
ct
Temperature, ℃
CO
CO2
Fe(liq)
Fe2SiO4
Fe(s)
Carbon
Spinel
0
0.1
0.2
0.3
0.4
0.5
0.6
0.7
0 200 400 600 800 1000 1200 1400 1600
Mas
s fr
acti
on
of
Pro
du
ct
Temperature, ℃
CO
CO2
Fe(liq)
Fe2SiO4
Fe(s)
Carbon
Spinel
Stellenbosch University https://scholar.sun.ac.za
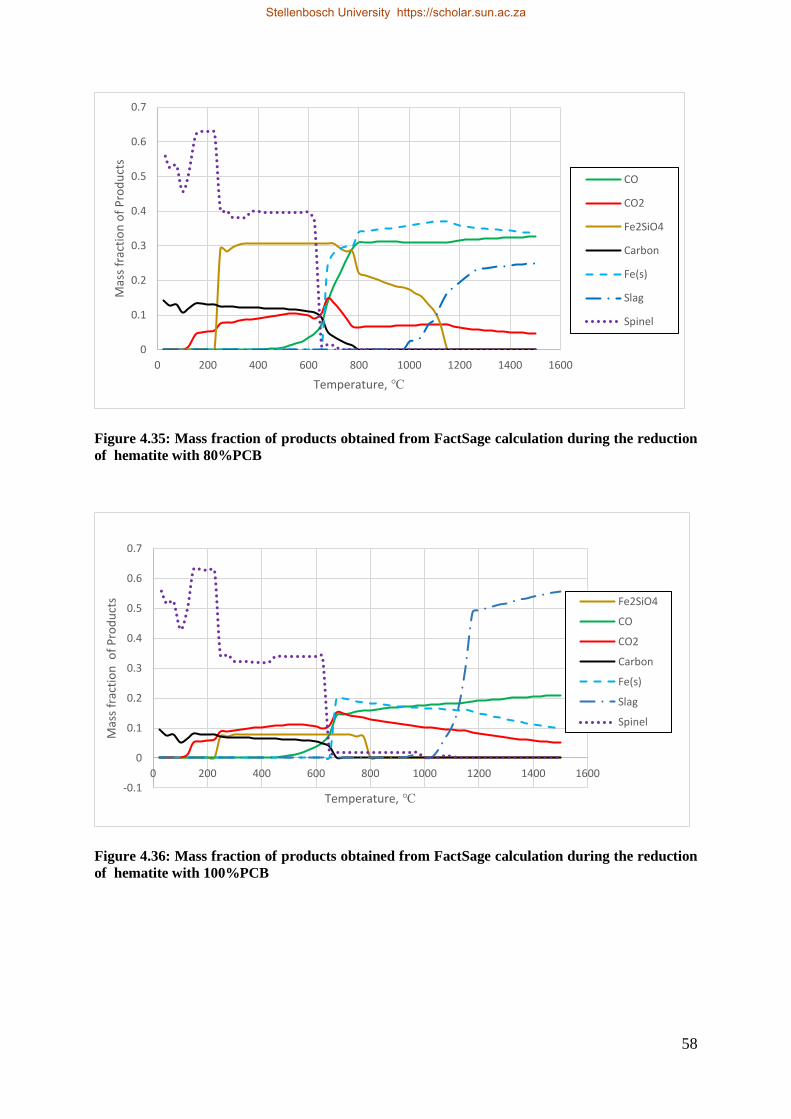
58
Figure 4.35: Mass fraction of products obtained from FactSage calculation during the reduction
of hematite with 80%PCB
Figure 4.36: Mass fraction of products obtained from FactSage calculation during the reduction
of hematite with 100%PCB
0
0.1
0.2
0.3
0.4
0.5
0.6
0.7
0 200 400 600 800 1000 1200 1400 1600
Mas
s fr
acti
on
of
Pro
du
cts
Temperature, ℃
CO
CO2
Fe2SiO4
Carbon
Fe(s)
Slag
Spinel
-0.1
0
0.1
0.2
0.3
0.4
0.5
0.6
0.7
0 200 400 600 800 1000 1200 1400 1600
Mas
s fr
acti
on
of
Pro
du
cts
Temperature, ℃
Fe2SiO4
CO
CO2
Carbon
Fe(s)
Slag
Spinel
Stellenbosch University https://scholar.sun.ac.za
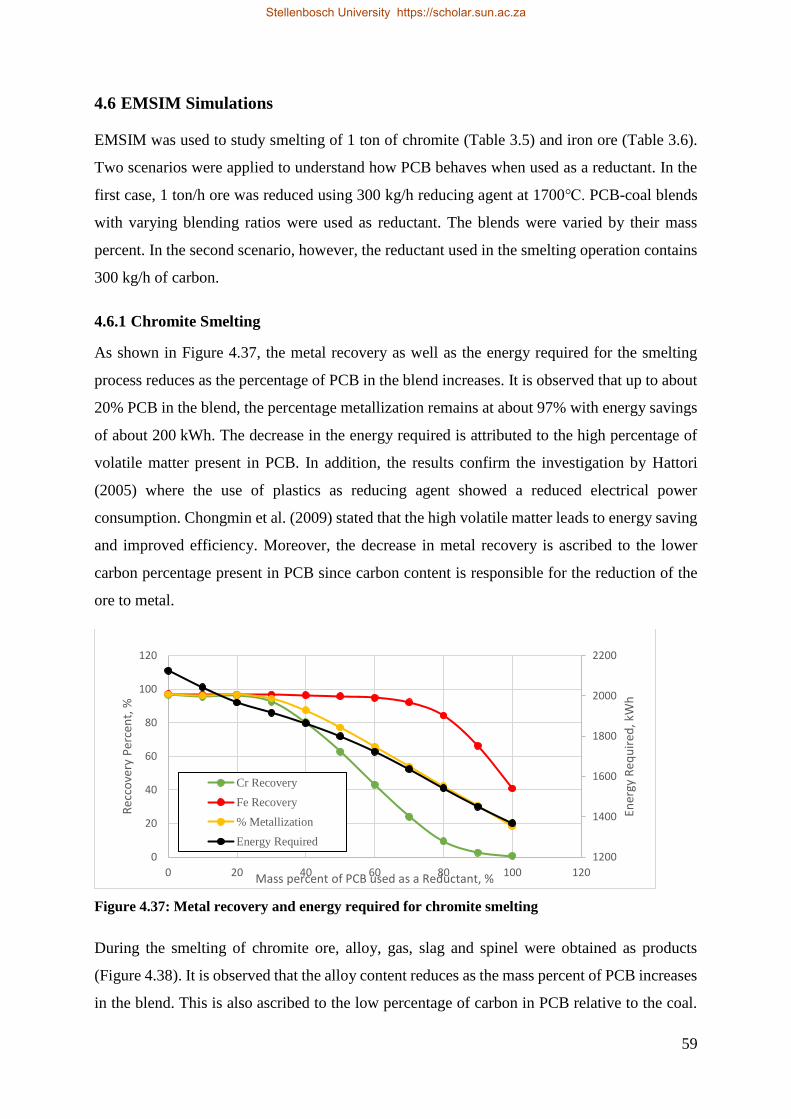
59
4.6 EMSIM Simulations
EMSIM was used to study smelting of 1 ton of chromite (Table 3.5) and iron ore (Table 3.6).
Two scenarios were applied to understand how PCB behaves when used as a reductant. In the
first case, 1 ton/h ore was reduced using 300 kg/h reducing agent at 1700℃. PCB-coal blends
with varying blending ratios were used as reductant. The blends were varied by their mass
percent. In the second scenario, however, the reductant used in the smelting operation contains
300 kg/h of carbon.
4.6.1 Chromite Smelting
As shown in Figure 4.37, the metal recovery as well as the energy required for the smelting
process reduces as the percentage of PCB in the blend increases. It is observed that up to about
20% PCB in the blend, the percentage metallization remains at about 97% with energy savings
of about 200 kWh. The decrease in the energy required is attributed to the high percentage of
volatile matter present in PCB. In addition, the results confirm the investigation by Hattori
(2005) where the use of plastics as reducing agent showed a reduced electrical power
consumption. Chongmin et al. (2009) stated that the high volatile matter leads to energy saving
and improved efficiency. Moreover, the decrease in metal recovery is ascribed to the lower
carbon percentage present in PCB since carbon content is responsible for the reduction of the
ore to metal.
Figure 4.37: Metal recovery and energy required for chromite smelting
During the smelting of chromite ore, alloy, gas, slag and spinel were obtained as products
(Figure 4.38). It is observed that the alloy content reduces as the mass percent of PCB increases
in the blend. This is also ascribed to the low percentage of carbon in PCB relative to the coal.
1200
1400
1600
1800
2000
2200
0
20
40
60
80
100
120
0 20 40 60 80 100 120
Ener
gy R
equ
ired
, kW
h
Rec
cove
ry P
erce
nt,
%
Mass percent of PCB used as a Reductant, %
Cr Recovery
Fe Recovery
% Metallization
Energy Required
Stellenbosch University https://scholar.sun.ac.za

60
Sahajwalla et al. (2012) stated that blend of end-of-life polymers and coke can be used to
efficiently increase slag foaming in electric arc furnace steelmaking. The results obtained from
chromite smelting simulation confirmed it because as PCB increases in the blend, the slag
formed also increases. This is due to the presence of alkaline oxides such as CaO, MgO, Fe2O3
and the high percentage of SiO2 present in the PCB. The slag mainly contains SiO2, Al2O3, CrO
and MgO. The solid spinel consists of MgCr2O4, MgAl2O4, AlCr2O4[1+] CrAl2O4, FeAl2O4,
etc.
Figure 4.38: Products of chromite smelting
Figure 4.39: Mass flowrate of gases during chromite smelting
0
100
200
300
400
500
600
0 20 40 60 80 100 120
Mas
s fl
ow
of
Pro
du
ct, k
g/h
Mass percent of PCB as reductant, %
Alloy
Gas
Slag
Spinel
100
150
200
250
300
350
400
450
0
1
2
3
4
5
6
7
8
9
10
0 20 40 60 80 100 120 140
Mas
s fl
ow
of
CO
, kg/
h
Mas
s fl
ow
of
Gas
es,
kg/h
Mass percent of PCB used as reductant, %
CO2
H2O
H2
N2
CO
Stellenbosch University https://scholar.sun.ac.za
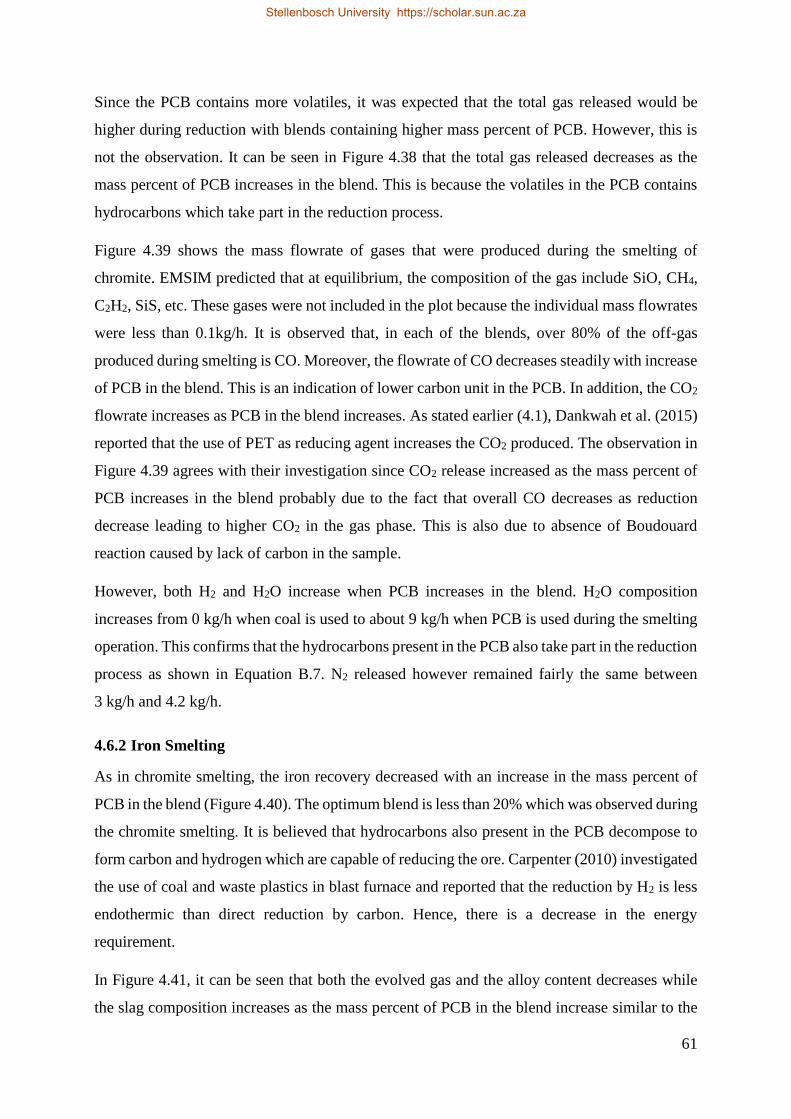
61
Since the PCB contains more volatiles, it was expected that the total gas released would be
higher during reduction with blends containing higher mass percent of PCB. However, this is
not the observation. It can be seen in Figure 4.38 that the total gas released decreases as the
mass percent of PCB increases in the blend. This is because the volatiles in the PCB contains
hydrocarbons which take part in the reduction process.
Figure 4.39 shows the mass flowrate of gases that were produced during the smelting of
chromite. EMSIM predicted that at equilibrium, the composition of the gas include SiO, CH4,
C2H2, SiS, etc. These gases were not included in the plot because the individual mass flowrates
were less than 0.1kg/h. It is observed that, in each of the blends, over 80% of the off-gas
produced during smelting is CO. Moreover, the flowrate of CO decreases steadily with increase
of PCB in the blend. This is an indication of lower carbon unit in the PCB. In addition, the CO2
flowrate increases as PCB in the blend increases. As stated earlier (4.1), Dankwah et al. (2015)
reported that the use of PET as reducing agent increases the CO2 produced. The observation in
Figure 4.39 agrees with their investigation since CO2 release increased as the mass percent of
PCB increases in the blend probably due to the fact that overall CO decreases as reduction
decrease leading to higher CO2 in the gas phase. This is also due to absence of Boudouard
reaction caused by lack of carbon in the sample.
However, both H2 and H2O increase when PCB increases in the blend. H2O composition
increases from 0 kg/h when coal is used to about 9 kg/h when PCB is used during the smelting
operation. This confirms that the hydrocarbons present in the PCB also take part in the reduction
process as shown in Equation B.7. N2 released however remained fairly the same between
3 kg/h and 4.2 kg/h.
4.6.2 Iron Smelting
As in chromite smelting, the iron recovery decreased with an increase in the mass percent of
PCB in the blend (Figure 4.40). The optimum blend is less than 20% which was observed during
the chromite smelting. It is believed that hydrocarbons also present in the PCB decompose to
form carbon and hydrogen which are capable of reducing the ore. Carpenter (2010) investigated
the use of coal and waste plastics in blast furnace and reported that the reduction by H2 is less
endothermic than direct reduction by carbon. Hence, there is a decrease in the energy
requirement.
In Figure 4.41, it can be seen that both the evolved gas and the alloy content decreases while
the slag composition increases as the mass percent of PCB in the blend increase similar to the
Stellenbosch University https://scholar.sun.ac.za
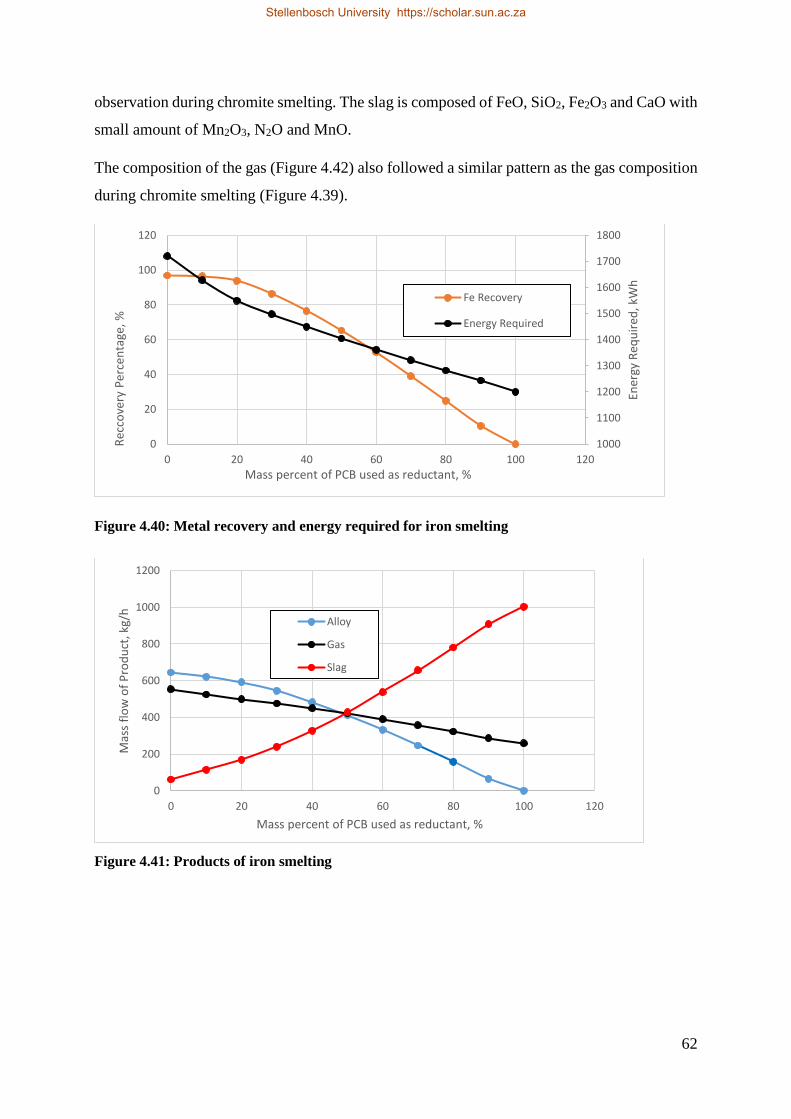
62
observation during chromite smelting. The slag is composed of FeO, SiO2, Fe2O3 and CaO with
small amount of Mn2O3, N2O and MnO.
The composition of the gas (Figure 4.42) also followed a similar pattern as the gas composition
during chromite smelting (Figure 4.39).
Figure 4.40: Metal recovery and energy required for iron smelting
Figure 4.41: Products of iron smelting
1000
1100
1200
1300
1400
1500
1600
1700
1800
0
20
40
60
80
100
120
0 20 40 60 80 100 120
Ener
gy R
equ
ired
, kW
h
Rec
cove
ry P
erce
nta
ge, %
Mass percent of PCB used as reductant, %
Fe Recovery
Energy Required
0
200
400
600
800
1000
1200
0 20 40 60 80 100 120
Mas
s fl
ow
of
Pro
du
ct, k
g/h
Mass percent of PCB used as reductant, %
Alloy
Gas
Slag
Stellenbosch University https://scholar.sun.ac.za
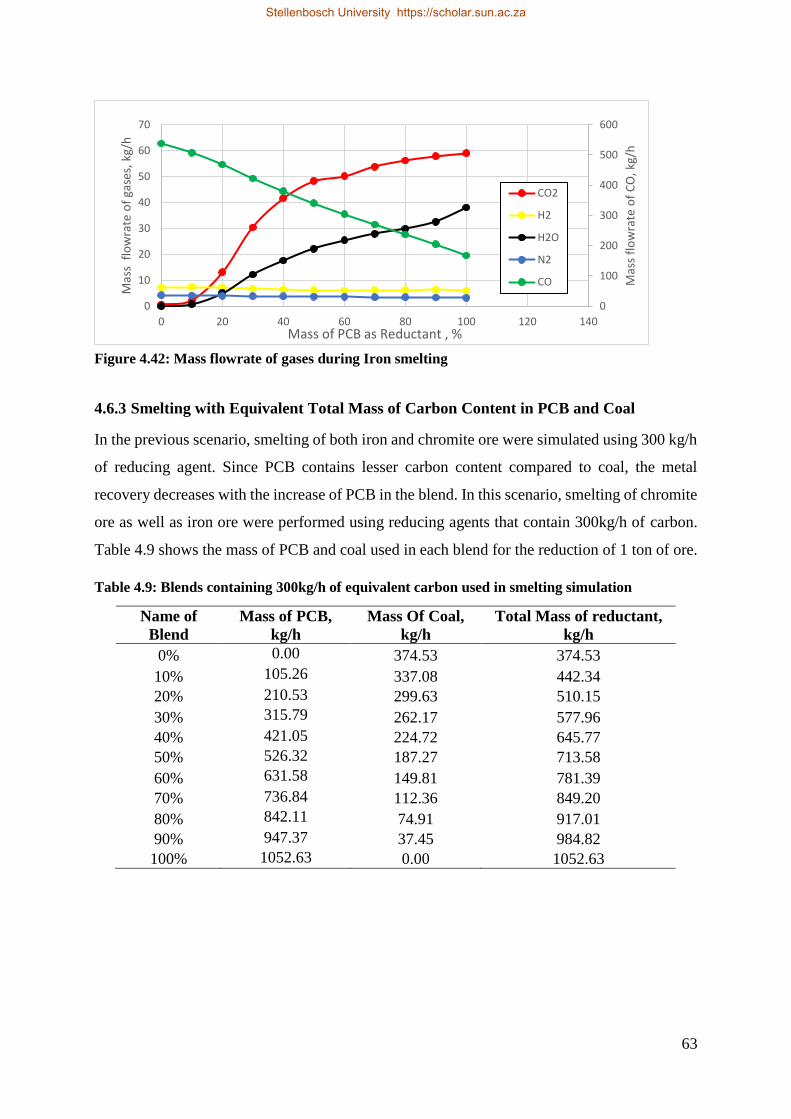
63
Figure 4.42: Mass flowrate of gases during Iron smelting
4.6.3 Smelting with Equivalent Total Mass of Carbon Content in PCB and Coal
In the previous scenario, smelting of both iron and chromite ore were simulated using 300 kg/h
of reducing agent. Since PCB contains lesser carbon content compared to coal, the metal
recovery decreases with the increase of PCB in the blend. In this scenario, smelting of chromite
ore as well as iron ore were performed using reducing agents that contain 300kg/h of carbon.
Table 4.9 shows the mass of PCB and coal used in each blend for the reduction of 1 ton of ore.
Table 4.9: Blends containing 300kg/h of equivalent carbon used in smelting simulation
Name of
Blend
Mass of PCB,
kg/h
Mass Of Coal,
kg/h
Total Mass of reductant,
kg/h
0% 0.00 374.53 374.53
10% 105.26 337.08 442.34
20% 210.53 299.63 510.15
30% 315.79 262.17 577.96
40% 421.05 224.72 645.77
50% 526.32 187.27 713.58
60% 631.58 149.81 781.39
70% 736.84 112.36 849.20
80% 842.11 74.91 917.01
90% 947.37 37.45 984.82
100% 1052.63 0.00 1052.63
0
100
200
300
400
500
600
0
10
20
30
40
50
60
70
0 20 40 60 80 100 120 140
Mas
s fl
ow
rate
of
CO
, kg/
h
Mas
s f
low
rate
of
gase
s, k
g/h
Mass of PCB as Reductant , %
CO2
H2
H2O
N2
CO
Stellenbosch University https://scholar.sun.ac.za

64
4.6.3.1 Chromite Smelting
Since each of the blends contain the same mass of carbon, it was expected that the metal
recovery remains constant for the reduction with each of the blends. However, with blends of
PCB greater than 50%, the recovery decreases with increase in PCB. Although, the energy
required for the smelting process was also expected to continuously increase since a higher
mass input of reductant was used, the energy increase was only up to 30% blend. The energy
constantly decreased with blends greater than 30%. It should be noted that since the mass
percent of carbon and SiO2 are nearly the same, increasing the mass of PCB to obtain the same
mass of carbon in coal invariably increases the SiO2 in the reductant. The increase in SiO2
results in an increase in the slag formed. The slag content increased from around 0kg/h when
only coal was used to about 1500 kg/h when only PCB was used as a reductant. The spinel in
the product decreased from 200 kg/h when pure coal was used to 0 kg/h when at least 60%
blend was used. The spinel content decreases because it is dissolved by the liquid slag. Also,
the amount of oxygen in the reductant is increased as more PCB is used to achieve the same
mass of carbon in coal. The oxygen is likely to react with the carbon in the PCB, thereby
reducing the reduction potential of the PCB.
Figure 4.43: Metal recovery and energy required for chromite smelting
2280
2320
2360
2400
2440
2480
0
20
40
60
80
100
120
0 20 40 60 80 100 120
Ener
gy R
equ
ired
, kW
h
Rec
ove
ry P
erce
nta
ge, %
Mass percent of carbon in PCB used as reductant, %
Cr Recovery
Fe Recovery
% Metallization
Energy Required
Stellenbosch University https://scholar.sun.ac.za
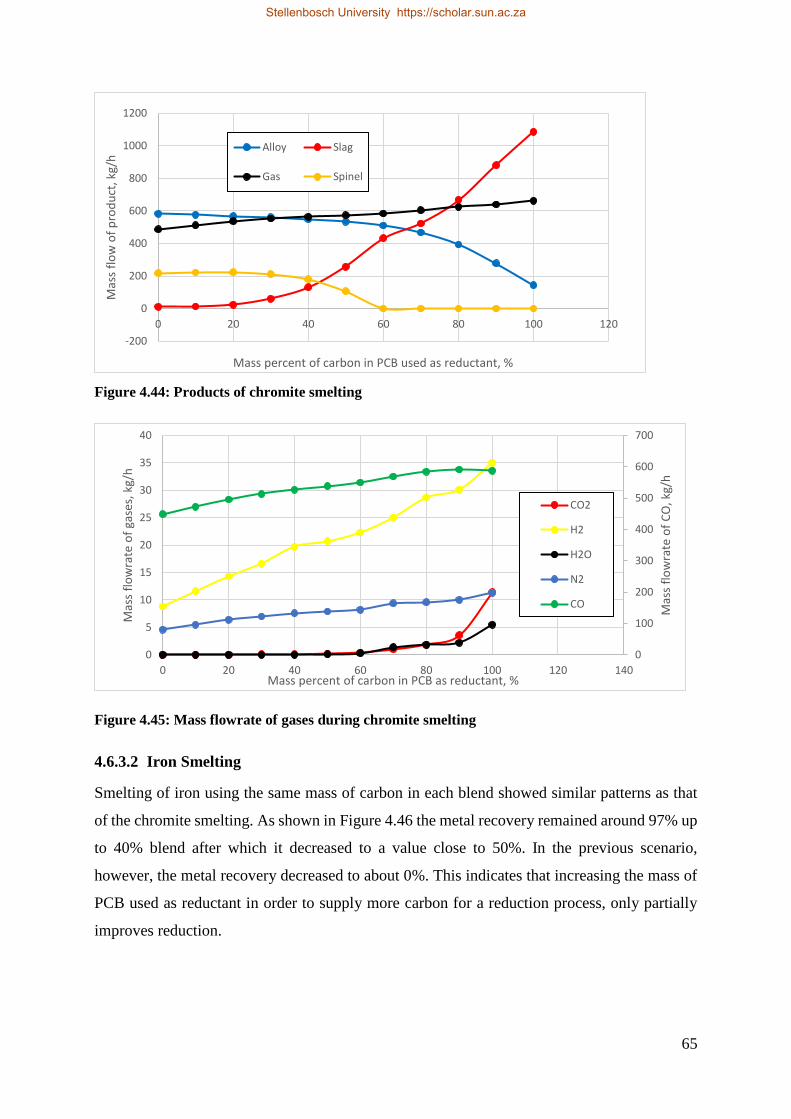
65
Figure 4.44: Products of chromite smelting
Figure 4.45: Mass flowrate of gases during chromite smelting
4.6.3.2 Iron Smelting
Smelting of iron using the same mass of carbon in each blend showed similar patterns as that
of the chromite smelting. As shown in Figure 4.46 the metal recovery remained around 97% up
to 40% blend after which it decreased to a value close to 50%. In the previous scenario,
however, the metal recovery decreased to about 0%. This indicates that increasing the mass of
PCB used as reductant in order to supply more carbon for a reduction process, only partially
improves reduction.
-200
0
200
400
600
800
1000
1200
0 20 40 60 80 100 120
Mas
s fl
ow
of
pro
du
ct, k
g/h
Mass percent of carbon in PCB used as reductant, %
Alloy Slag
Gas Spinel
0
100
200
300
400
500
600
700
0
5
10
15
20
25
30
35
40
0 20 40 60 80 100 120 140M
ass
flo
wra
te o
f C
O, k
g/h
Mas
s fl
ow
rate
of
gase
s, k
g/h
Mass percent of carbon in PCB as reductant, %
CO2
H2
H2O
N2
CO
Stellenbosch University https://scholar.sun.ac.za

66
Figure 4.46: Metal recovery and energy required for iron smelting
Figure 4.47: Products of iron smelting
1800
1850
1900
1950
2000
50
55
60
65
70
75
80
85
90
95
100
0 20 40 60 80 100 120
Ener
gy R
equ
ired
, kW
Rec
cove
ry P
erce
nta
ge, %
Mass percent of carbon in PCB used as reductant, %
Fe Recovery
Energy Required
0
200
400
600
800
1000
1200
0 20 40 60 80 100 120
Mas
s fl
ow
of
Pro
du
ct, k
g/h
Mass percent of carbon in PCB used as reductant, %
Alloy
Slag
Gas
Stellenbosch University https://scholar.sun.ac.za
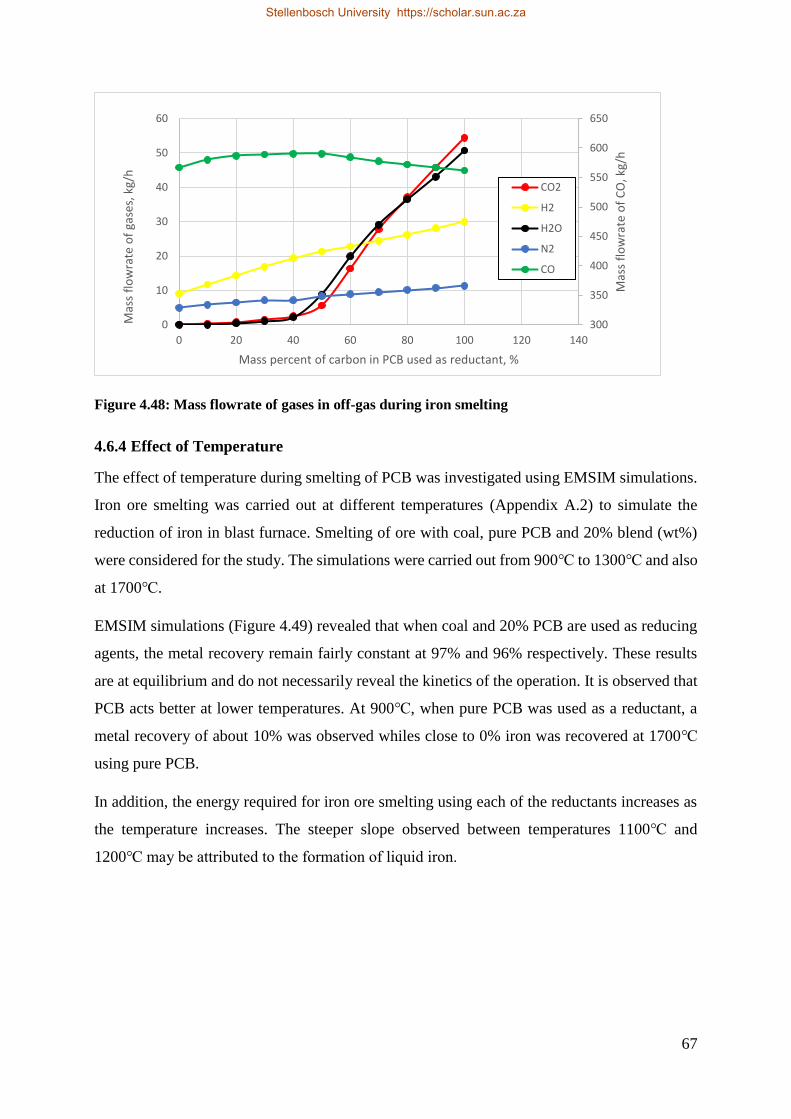
67
Figure 4.48: Mass flowrate of gases in off-gas during iron smelting
4.6.4 Effect of Temperature
The effect of temperature during smelting of PCB was investigated using EMSIM simulations.
Iron ore smelting was carried out at different temperatures (Appendix A.2) to simulate the
reduction of iron in blast furnace. Smelting of ore with coal, pure PCB and 20% blend (wt%)
were considered for the study. The simulations were carried out from 900℃ to 1300℃ and also
at 1700℃.
EMSIM simulations (Figure 4.49) revealed that when coal and 20% PCB are used as reducing
agents, the metal recovery remain fairly constant at 97% and 96% respectively. These results
are at equilibrium and do not necessarily reveal the kinetics of the operation. It is observed that
PCB acts better at lower temperatures. At 900℃, when pure PCB was used as a reductant, a
metal recovery of about 10% was observed whiles close to 0% iron was recovered at 1700℃
using pure PCB.
In addition, the energy required for iron ore smelting using each of the reductants increases as
the temperature increases. The steeper slope observed between temperatures 1100℃ and
1200℃ may be attributed to the formation of liquid iron.
300
350
400
450
500
550
600
650
0
10
20
30
40
50
60
0 20 40 60 80 100 120 140
Mas
s fl
ow
rate
of
CO
, kg/
h
Mas
s fl
ow
rate
of
gase
s, k
g/h
Mass percent of carbon in PCB used as reductant, %
CO2
H2
H2O
N2
CO
Stellenbosch University https://scholar.sun.ac.za
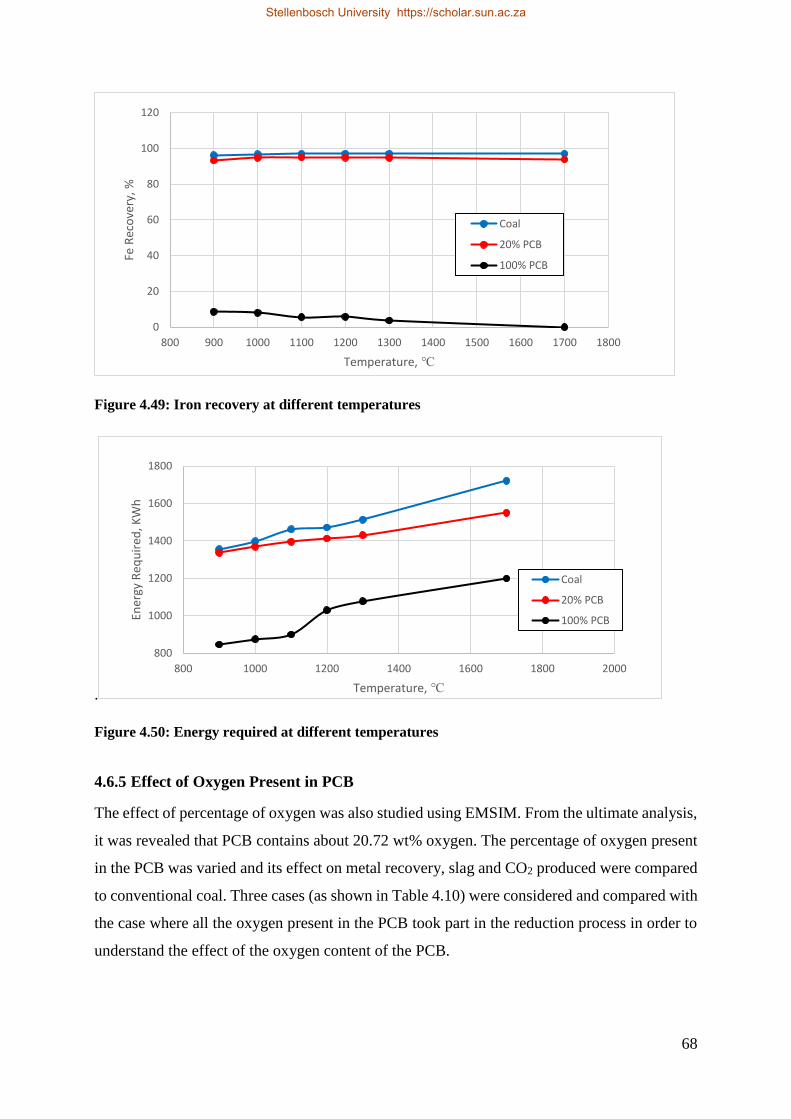
68
Figure 4.49: Iron recovery at different temperatures
.
Figure 4.50: Energy required at different temperatures
4.6.5 Effect of Oxygen Present in PCB
The effect of percentage of oxygen was also studied using EMSIM. From the ultimate analysis,
it was revealed that PCB contains about 20.72 wt% oxygen. The percentage of oxygen present
in the PCB was varied and its effect on metal recovery, slag and CO2 produced were compared
to conventional coal. Three cases (as shown in Table 4.10) were considered and compared with
the case where all the oxygen present in the PCB took part in the reduction process in order to
understand the effect of the oxygen content of the PCB.
0
20
40
60
80
100
120
800 900 1000 1100 1200 1300 1400 1500 1600 1700 1800
Fe R
eco
very
, %
Temperature, ℃
Coal
20% PCB
100% PCB
800
1000
1200
1400
1600
1800
800 1000 1200 1400 1600 1800 2000
Ener
gy R
equ
ired
, KW
h
Temperature, ℃
Coal
20% PCB
100% PCB
Stellenbosch University https://scholar.sun.ac.za

69
Table 4.10: Representations used in studying the effect of oxygen
Scenario Wt% of oxygen in
PCB that reacted
Meaning
Sc-A 20.72% All the oxygen present in the PCB took part in smelting
Sc-B 16.576% Only 80% of the oxygen present in the PCB took part in
smelting
Sc-C 10.36% Only 50% of the oxygen present in the PCB took part in
smelting
Sc-D 0% Oxygen present in the PCB did not take part in smelting
Figure 4.51: Effect of oxygen in PCB on the metal recovery
As shown in Figure 4.51, the oxygen content affects the recovery of iron. It can be seen that,
when oxygen present in PCB do not take part in the reaction (Sc-D), about 73% of iron is
recovered when pure PCB is used as reductant whereas with the case where all the oxygen takes
part in the reaction (Sc-A), almost no iron is recovered when pure PCB is used during the
reduction. Lotfian et al. (2016) reported that the presence of oxygen in some plastics like
polyurethane (PU) and polyvinyl chloride (PVC) might affect their reduction potential when
they are used as reducing agents. The simulation supports the study since there is a decrease in
the recovery of iron when higher amounts of oxygen take part in the reduction.
0
20
40
60
80
100
120
0 20 40 60 80 100 120
Fe R
eco
very
, %
Mass percent of PCB ued as reductant, %
Sc-A
Sc-B
Sc-C
Sc-D
Stellenbosch University https://scholar.sun.ac.za
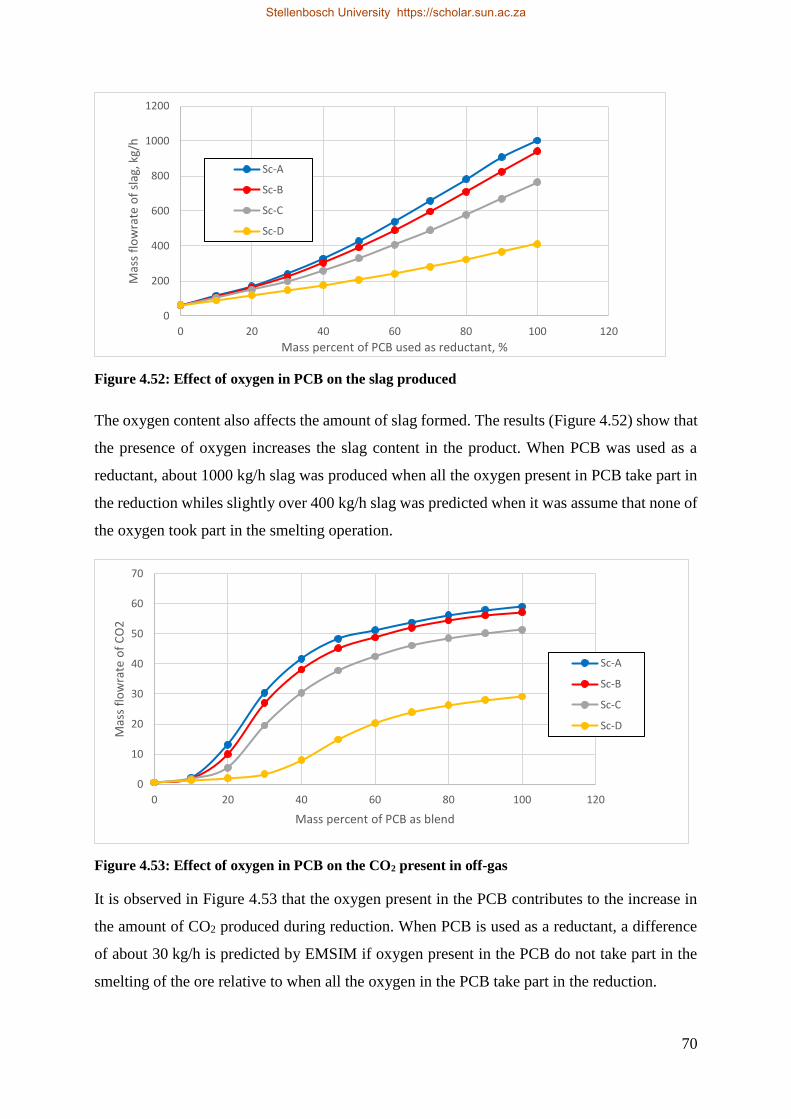
70
Figure 4.52: Effect of oxygen in PCB on the slag produced
The oxygen content also affects the amount of slag formed. The results (Figure 4.52) show that
the presence of oxygen increases the slag content in the product. When PCB was used as a
reductant, about 1000 kg/h slag was produced when all the oxygen present in PCB take part in
the reduction whiles slightly over 400 kg/h slag was predicted when it was assume that none of
the oxygen took part in the smelting operation.
Figure 4.53: Effect of oxygen in PCB on the CO2 present in off-gas
It is observed in Figure 4.53 that the oxygen present in the PCB contributes to the increase in
the amount of CO2 produced during reduction. When PCB is used as a reductant, a difference
of about 30 kg/h is predicted by EMSIM if oxygen present in the PCB do not take part in the
smelting of the ore relative to when all the oxygen in the PCB take part in the reduction.
0
200
400
600
800
1000
1200
0 20 40 60 80 100 120
Mas
s fl
ow
rate
of
slag
, kg/
h
Mass percent of PCB used as reductant, %
Sc-A
Sc-B
Sc-C
Sc-D
0
10
20
30
40
50
60
70
0 20 40 60 80 100 120
Mas
s fl
ow
rate
of
CO
2
Mass percent of PCB as blend
Sc-A
Sc-B
Sc-C
Sc-D
Stellenbosch University https://scholar.sun.ac.za
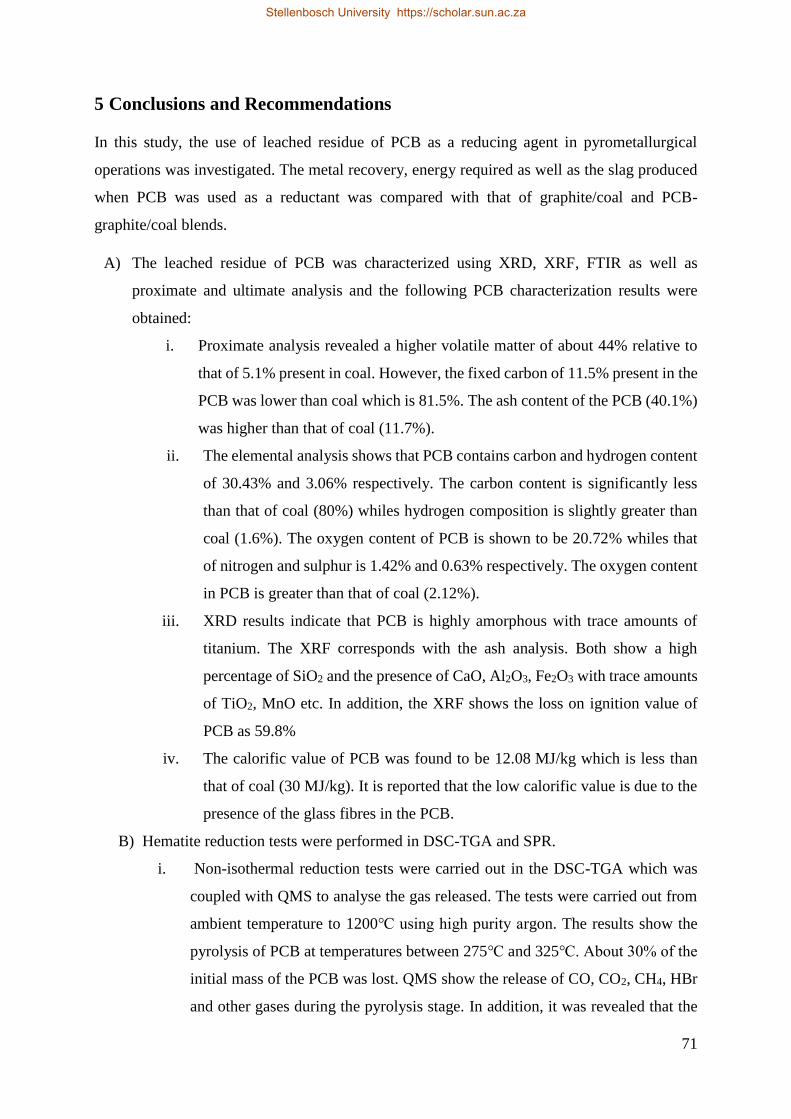
71
5 Conclusions and Recommendations
In this study, the use of leached residue of PCB as a reducing agent in pyrometallurgical
operations was investigated. The metal recovery, energy required as well as the slag produced
when PCB was used as a reductant was compared with that of graphite/coal and PCB-
graphite/coal blends.
A) The leached residue of PCB was characterized using XRD, XRF, FTIR as well as
proximate and ultimate analysis and the following PCB characterization results were
obtained:
i. Proximate analysis revealed a higher volatile matter of about 44% relative to
that of 5.1% present in coal. However, the fixed carbon of 11.5% present in the
PCB was lower than coal which is 81.5%. The ash content of the PCB (40.1%)
was higher than that of coal (11.7%).
ii. The elemental analysis shows that PCB contains carbon and hydrogen content
of 30.43% and 3.06% respectively. The carbon content is significantly less
than that of coal (80%) whiles hydrogen composition is slightly greater than
coal (1.6%). The oxygen content of PCB is shown to be 20.72% whiles that
of nitrogen and sulphur is 1.42% and 0.63% respectively. The oxygen content
in PCB is greater than that of coal (2.12%).
iii. XRD results indicate that PCB is highly amorphous with trace amounts of
titanium. The XRF corresponds with the ash analysis. Both show a high
percentage of SiO2 and the presence of CaO, Al2O3, Fe2O3 with trace amounts
of TiO2, MnO etc. In addition, the XRF shows the loss on ignition value of
PCB as 59.8%
iv. The calorific value of PCB was found to be 12.08 MJ/kg which is less than
that of coal (30 MJ/kg). It is reported that the low calorific value is due to the
presence of the glass fibres in the PCB.
B) Hematite reduction tests were performed in DSC-TGA and SPR.
i. Non-isothermal reduction tests were carried out in the DSC-TGA which was
coupled with QMS to analyse the gas released. The tests were carried out from
ambient temperature to 1200℃ using high purity argon. The results show the
pyrolysis of PCB at temperatures between 275℃ and 325℃. About 30% of the
initial mass of the PCB was lost. QMS show the release of CO, CO2, CH4, HBr
and other gases during the pyrolysis stage. In addition, it was revealed that the
Stellenbosch University https://scholar.sun.ac.za

72
reduction of hematite with PCB has faster kinetics than reduction with graphite
due to the presence of hydrocarbons in PCB. The hydrocarbons were found to
be reducing hematite at lower temperatures than pure carbon. Moreover, it is
believed that plastics content present in the PCB forms a liquid phase which
allows it to have more contact with the hematite during reduction experiments.
The reduction degrees which were calculated from the mass loss showed that
PCB and blends of PCB act as better reducing agents at lower temperatures.
ii. Isothermal reduction test were also carried out in SPR at 1000℃ and 900℃. The
volume percent of CO and CO2 present in the off-gas were analysed and
recorded. The results show that, at 900℃, PCB reduces hematite better than
graphite. At 1000℃ however, pure carbon proves to be a better reducing agent.
C) FactSage simulations were also carried out for validation of lab scale tests for solid state
reduction of hematite. FactSage simulations predicted the formation of fayalite
(Fe2SiO4) between 200℃ and 800℃ when PCB or blends of PCB are used as reducing
agents. Moreover, the calculations predict the formation of solid iron at temperatures
above 700℃. This is in good agreement with the experimental findings with respect to
iron formation at 900℃.
D) Smelting of chromite ore and iron ore were simulated using EMSIM. Two scenarios
were considered
i. In the first case, 1 ton of ore was smelted with the same mass of reductant and
the following were established:
As PCB in the blend increases, the amount of energy required for the
smelting operation decreases
Metal recovery decreased as the mass percent of PCB in the blend used
as a reductant increased. The decrease in the metal recovery is ascribed
to lower carbon content present in PCB relative to coal
The optimum mass percent of PCB used in the blend is about 20% since
about 200 kWh of energy is saved to achieve the same metal recovery.
The decrease in the amount of energy required for the operation is also
attributed to the higher volatile content of the PCB which also takes part
in the reduction process
As PCB in the blend increases, the slag produced increases. The slag
increase is due to the relatively high content of SiO2 present in the PCB
Stellenbosch University https://scholar.sun.ac.za
73
Mass flow rate of the evolved gas was seen to decrease as PCB in the
blend increased. This is because the hydrocarbons present in the PCB
also take part in the reduction of the ore
CO decreased while the CO2 increased as the mass percent of PCB in the
blend increased. The decrease in CO is due to the lower carbon content
in the PCB whereas the CO2 increase is due to the higher amount of
oxygen in PCB
ii. A second scenario was simulated where the blends used in the smelting process
contained the same mass of carbon
EMSIM predicted that an increase in energy up to about 30% carbon
from PCB blend after which the energy decreases. The recovery also
decreased with blend higher than 40% carbon from PCB. In this scenario
however, the mass flow rate of the evolved gas increase as PCB increases
in the blend
E)
i. Mass and energy balance models showed that the energy required for smelting
decreases when PCB or PCB blends are used as reducing agent. The economics
of incorporating the non-metallic fraction of PCB could be studied
ii. Due to the high percentage of oxygen in the PCB sample, high amount of CO2
was released when PCB was used as a reducing agent. Further studies could be
done to investigate ways to reduce the CO2 produced or capturing the CO2 for
other purposes
iii. The feasibility of using non-metallic fractions of PCB as reducing agent for
hematite reduction showed that PCB has faster kinetics at lower temperatures
than graphite. Further studies could be done to adequately comprehend the
kinetic behaviour of PCB during reduction process.
iv. The study showed that pyrolysis of PCB occurs at a temperature around 300℃.
Further investigations could be done to derive fuel and other products from the
pyrolysis of the non-metallic fractions of PCB.
Contribution
Attah-Kyei, D., Akdogan, G., Dorfling, C., Erwee, M., Zietsman, J., Reynolds, Q., 2018.
Printed circuit board leach residue as a reductant for pyrometallurgical operations, in:
WasteCon 2018. Johannesburg, South Africa, pp. 1–11.
Stellenbosch University https://scholar.sun.ac.za

74
6 List of References
Albertyn, P. W., & Dorfling, C. (2017). Ammonium thiosulphate leaching of gold from printed
circuit board waste. Stellenbosch University.
Baldé, C. P., Wang, F., Kuehr, R., & Huisman, J. (2015). The Global E-Waste Monitor 2014.
United Nations University, IAS – SCYCLE, Bonn, Germany.
Bale, C. W., Bélisle, E., Chartrand, P., Decterov, S. A., Eriksson, G., Hack, K., … Petersen, S.
(2008). FactSage Thermochemical Software and Databases – Recent Developments.
Calphad, 33(2), 295–311.
Bazargan, A., Bwegendaho, D., Barford, J., & McKay, G. (2014). Printed circuit board waste
as a source for high purity porous silica. Separation and Purification Technology, 136,
88–93. https://doi.org/10.1016/j.seppur.2014.08.026
Brouwer, P. (2010). Theory of XRF. Theory of XRF (3rd ed.). Almelo: PANalytical B.V.
Brown, M. E. (1989). Introduction to Thermal Analysis: Techniques and Applications.
Mineralogical Magazine. https://doi.org/10.1180/minmag.1989.053.373.29
Bunaciu, A. A., Udriştioiu, E. gabriela, & Aboul-Enein, H. Y. (2015). X-Ray Diffraction:
Instrumentation and Applications. Critical Reviews in Analytical Chemistry, 45(4), 289–
299. https://doi.org/10.1080/10408347.2014.949616
Cao, X., Prozorov, B., Koltypin, Y., Felner, I., & Gedanken, A. (1997). Synthesis of pure
amorphous Fe2O3. Journal of Materials Research, 2(Feb 1997), 2–6.
Carpenter, A. M. (2010). Injection of coal and waste plastics in blast furnaces. Report
CCC/166. Retrieved from https://www.usea.org/sites/default/files/032010_Injection of
coal and waste plastics in blast furnaces_ccc166.pdf
Cayumil, R., Khanna, R., Ikram-Ul-Haq, M., Rajarao, R., Hill, A., & Sahajwalla, V. (2014).
Generation of copper rich metallic phases from waste printed circuit boards. Waste
Management, 34(10), 1783–1792. https://doi.org/10.1016/j.wasman.2014.05.004
Chatterjee, S. (2012). Sustainable Electronic Waste Management and Recycling Process, 2(1),
23–33. https://doi.org/10.5923/j.ajee.20120201.05
Chen, H., Zheng, Z., Chen, Z., & Bi, X. T. (2017). Reduction of hematite (Fe2O3) to metallic
iron (Fe) by CO in a micro fluidized bed reaction analyzer: A multistep kinetics study.
Stellenbosch University https://scholar.sun.ac.za

75
Powder Technology, 316, 410–420. https://doi.org/10.1016/j.powtec.2017.02.067
Cui, H., & Anderson, C. G. (2016). Literature Review of Hydrometallurgical Recycling of
Printed Circuit Boards (PCBs). Journal of Advanced Chemical Engineering, 6(1), 1–11.
https://doi.org/10.4172/2090-4568.1000142
Dankwah, J., Amoah, T., Dankwah, J., & Fosu, A. (2016). Recycling Mixed Plastics Waste as
Reductant in Ironmaking. Ghana Mining Journal, 15(2), 73–80. Retrieved from
http://www.ajol.info/index.php/gm/article/view/127934
Dankwah, J. R., & Koshy, P. (2014). Reduction of FeO in EAF steelmaking slag by blends of
metallurgical coke and waste polypropylene. High Temperature Materials and Processes,
4(1), 274–279. https://doi.org/10.1515/htmp-2013-0035
Dankwah, J. R., Koshy, P., O’Kane, P., & Sahajwalla, V. (2012). Reduction of FeO in EAF
steelmaking slag by blends of metallurgical coke and end-of-life tyre. Steel Research
International, 83(8), 766–774. https://doi.org/10.1002/srin.201200019
Delgado, A. C., Barruetabeña, L., & Salas, O. (2007). Assessment of the Environmental
Advantages and Drawbacks of Existing and Emerging Polymers Recovery Processes.
https://doi.org/10.2791/46661
Diaz, L. A., Lister, T. E., Parkman, J. A., & Clark, G. G. (2016). Comprehensive process for
the recovery of value and critical materials from electronic waste. Journal of Cleaner
Production, 125, 236–244. https://doi.org/10.1016/j.jclepro.2016.03.061
Duan, H., Hou, K., Li, J., & Zhu, X. (2011). Examining the technology acceptance for
dismantling of waste printed circuit boards in light of recycling and environmental
concerns. Journal of Environmental Management. Elsevier Ltd.
https://doi.org/10.1016/j.jenvman.2010.10.057
Evangelopoulos, P., Kantarelis, E., & Yang, W. (2015). Investigation of the thermal
decomposition of printed circuit boards (PCBs) via thermogravimetric analysis (TGA) and
analytical pyrolysis (Py-GC/MS). Journal of Analytical and Applied Pyrolysis, 115, 337–
343. https://doi.org/10.1016/j.jaap.2015.08.012
Fink, J. K. (1999). Pyrolysis and combustion of polymer wastes in combination with
metallurgical processes and the cement industry. Journal of Analytical and Applied
Pyrolysis, 51(1), 239–252. https://doi.org/10.1016/S0165-2370(99)00019-4
Stellenbosch University https://scholar.sun.ac.za

76
Fisher, M. M. (2006). Feedstock recycling technologies in the sustainable recycling of plastics
from end-of-life electrical and electronic products. IEEE International Symposium on
Electronics and the Environment, 2006, 292–297.
https://doi.org/10.1109/ISEE.2006.1650079
Franz, R. L. (2002). Optimizing portable product recycling through reverse supply chain
technology. IEEE International Symposium on Electronics and the Environment, 274–
279. https://doi.org/10.1109/ISEE.2002.1003279
Gallagher, P. (2008). Handbook of Thermal Analysis and Calorimetry. Handbook of Thermal
Analysis and Calorimetry (Vol. 5). https://doi.org/10.1016/S1573-4374(13)60004-7
Guanghan, S., Zhu, X., Wenyi, Y., Chenglong, Z., & Wen, M. (2016). Recycling and disposal
technology for non-mentallic materials from waste printed circuit boards ( WPCBs ) in
China. Procedia Environmental Sciences, 31, 935–940.
https://doi.org/10.1016/j.proenv.2016.02.114
Guo, J., Guo, J., & Xu, Z. (2009). Recycling of non-metallic fractions from waste printed circuit
boards: A review. Journal of Hazardous Materials, 168(2–3), 567–590.
https://doi.org/10.1016/j.jhazmat.2009.02.104
Guo, J., Tang, Y., & Xu, Z. (2010). Performance and thermal behavior of wood plastic
composite produced by nonmetals of pulverized waste printed circuit boards. Journal of
Hazardous Materials, 179(1–3), 203–207. https://doi.org/10.1016/j.jhazmat.2010.02.080
Hadi, P., Ning, C., Ouyang, W., Xu, M., Lin, C. S. K., & McKay, G. (2015). Toward
environmentally-benign utilization of nonmetallic fraction of waste printed circuit boards
as modifier and precursor. Waste Management, 35, 236–246.
https://doi.org/10.1016/j.wasman.2014.09.020
Hattori, T. (2005). Recycling Technique of Waste Plastics as Carbon Material, 50(1), 27–32.
Havlik, T., Orac, D., Petranikova, M., & Miskufova, A. (2011). Hydrometallurgical treatment
of used printed circuit boards after thermal treatment. Waste Management, 31(7), 1542–
1546. https://doi.org/10.1016/j.wasman.2011.02.012
Höhne, G. W. H., Hemminger, W. F., & Flammersheim, H. J. (2003). Differential scanning
calorimetry (p. 298). https://doi.org/10.1007/978-3-662-06710-9
Hotta, H. (2003). Recycling Technologies for Promoting Recycling-oriented Society, 88(88).
Stellenbosch University https://scholar.sun.ac.za

77
Huang, K., Guo, J., & Xu, Z. (2009). Recycling of waste printed circuit boards : A review of
current technologies and treatment status in China, 164, 399–408.
https://doi.org/10.1016/j.jhazmat.2008.08.051
Ida, H. (2006). Current Status of Plastics Recycling in Japan.
Jung, S. M., & Yi, S. H. (2013). A kinetic study on carbothermic reduction of hematite with
graphite employing thermogravimetry and quadruple mass spectrometry. Steel Research
International, 84(9), 908–916. https://doi.org/10.1002/srin.201200310
Kadari, R., Velchuri, R., Malathi, M., Vithal, M., & Munirathnam, N. R. (2017). Degradation
of organic pollutants by Ag , Cu and Sn doped waste non-metallic printed circuit boards.
Waste Management, 60, 629–635. https://doi.org/10.1016/j.wasman.2016.09.026
Kahhat, R., Kim, J., Xu, M., Allenby, B., Williams, E., & Zhang, P. (2008). Resources ,
Conservation and Recycling Exploring e-waste management systems in the United States,
52, 955–964. https://doi.org/10.1016/j.resconrec.2008.03.002
Kanchanapiya, P., Pinyo, W., Jareemit, S., & Kwonpongsagoon, S. (2015). Recycling of non-
metallic powder from printed circuit board waste as a filler material in a fiber reinforced
polymer. Environment Protection Engineering, 41(4), 151–166.
https://doi.org/10.5277/epel50412
Kato, K., Nomura, S., & Uematsu, H. (2002). Development of waste plastics recycling process
using Coke ovens. ISIJ International, 42(87), 10–13. https://doi.org/10.4144/rpsj.50.182
Kaya, M. (2016). Recovery of metals and nonmetals from electronic waste by physical and
chemical recycling processes. Waste Management, 57, 64–90.
https://doi.org/10.1016/j.wasman.2016.08.004
Khaliq, A., Rhamdhani, M., Brooks, G., & Masood, S. (2014). Metal Extraction Processes for
Electronic Waste and Existing Industrial Routes: A Review and Australian Perspective.
Resources, 3(1), 152–179. https://doi.org/10.3390/resources3010152
Kim, B., Lee, J., Kim, B., Lee, J., Seo, S., Park, Y., & Sohn, H. Y. (2004). A Process for
Extracting Precious Metals from Spent Printed Circuit Boards and Automobile Catalysts
A Process for Extracting Precious Metals from Spent Printed Circuit Boards and
Automobile Catalysts, (December 2015). https://doi.org/10.1007/s11837-004-0237-9
Kleynhans, E. L. J., Beukes, J. P., Van Zyl, P. G., Bunt, J. R., Nkosi, N. S. B., & Venter, M.
Stellenbosch University https://scholar.sun.ac.za

78
(2017). The Effect of Carbonaceous Reductant Selection on Chromite Pre-reduction.
Metallurgical and Materials Transactions B, 48(2), 827–840.
https://doi.org/10.1007/s11663-016-0878-4
Legarth, J. B., Alting, L., & Baldo, G. L. (1995). Sustainability issues in circuit board recycling.
Proceedings of the 1995 IEEE International Symposium on Electronics and the
Environment ISEE (Cat. No.95CH35718), 126–131.
https://doi.org/10.1109/ISEE.1995.514963
Li, J., Duan, H., Yu, K., Liu, L., & Wang, S. (2010). Characteristic of low-temperature pyrolysis
of printed circuit boards subjected to various atmosphere. Resources, Conservation and
Recycling, 54(11), 810–815. https://doi.org/10.1016/j.resconrec.2009.12.011
Lotfian, S., Ahmed, H., El-Geassy, A.-H. A., & Samuelsson, C. (2016). Alternative Reducing
Agents in Metallurgical Processes: Gasification of Shredder Residue Material. Journal of
Sustainable Metallurgy. https://doi.org/10.1007/s40831-016-0096-y
Luda, M. P. (2011). Recycling of Printed Circuit Boards. Integrated Waste Management -
Volume II, 285–299. https://doi.org/10.5772/17220
Malan, W. T., Akdogan, G., & Bradshaw, S. (2014). The recovery of platinum group metals
from low- grade concentrates to an iron alloy using silicon carbide as reductant.
Stellenbosch University.
Mark, F. E., & Lehner, T. (2000). Plastics Recovery from Waste Electrical & Electronic
Equipment in Non-Ferrous Metal Processes. Technical Paper, Association of Plastics
Manufacturers in Europe (APME).
Melorose, J., Perroy, R., & Careas, S. (2015). Rate Processes of Extractive Metallurgy.
Statewide Agricultural Land Use Baseline 2015 (Vol. 1).
https://doi.org/10.1017/CBO9781107415324.004
Monazam, E. R., Breault, R. W., Siriwardane, R., Richards, G., Virginia, W., & Virginia, W.
(2013). Kinetics of the reduction of hematite (Fe2O3) by methane (CH4) during chemical
looping combustion: a global mechanism. CHEMICAL ENGINEERING JOURNAL, 1–28.
Motang, N. (Stellenbosch U. (2015). In situ FTIR Measurements of the Kinetics of the Aqueous
CO 2 - Monoethanolamine Reaction. Stellenbosch University.
Muniyandi, S., Sohaili, J., Hassan, A., & Mohamad, S. (2013). Converting non-metallic printed
Stellenbosch University https://scholar.sun.ac.za

79
circuit boards waste into a value added product. Journal of Environmental Health Science
and Engineering, 11(1), 2. https://doi.org/10.1186/2052-336X-11-2
Naseska, M. (2016). Fourier Transform Infrared Spectroscopy. University of Ljubljana, 1–12.
https://doi.org/10.1016/B978-0-323-46140-5.00004-2
Ning, C., Lin, C. S. K., Hui, D. C. W., & McKay, G. (2017a). Waste Printed Circuit Board
(PCB) Recycling Techniques. Topics in Current Chemistry, 375(2), 43.
https://doi.org/10.1007/s41061-017-0118-7
Ning, C., Lin, C. S. K., Hui, D. C. W., & McKay, G. (2017b). Waste Printed Circuit Board
(PCB) Recycling Techniques. Topics in Current Chemistry, 375(2), 43.
https://doi.org/10.1007/s41061-017-0118-7
Nourreddine, M. (2007). Recycling of auto shredder residue, 139, 481–490.
https://doi.org/10.1016/j.jhazmat.2006.02.054
Ogunniyi, I. O., & Vermaak, M. K. G. (2009). Froth flotation for beneficiation of rinted circuit
boards comminution fines : An overview. Mineral Processing & Extractive Metallurgy
Review, 7508. https://doi.org/10.1080/08827500802333123
Ortun, N., Conesa, J. A., Molto, J., & Font, R. (2014). Pollutant emissions during pyrolysis and
combustion of waste printed circuit boards, before and after metal removal. Science of the
Total Environment, 499, 27–35. https://doi.org/10.1016/j.scitotenv.2014.08.039
PlasticsEurope. (2009). Plastics Convert Iron Ore To Steel, 1–8.
Quan, C., Li, A., & Gao, N. (2012). Research on pyrolysis of PCB waste with TG-FTIR and
Py-GC/MS. Journal of Thermal Analysis and Calorimetry, 110(3), 1463–1470.
https://doi.org/10.1007/s10973-011-2048-x
Quan, C., Li, A., & Gao, N. (2013). Combustion and Pyrolysis of Electronic Waste:
Thermogravimetric Analysis and Kinetic Model. Procedia Environmental Sciences, 18,
776–782. https://doi.org/10.1016/j.proenv.2013.04.104
Radebe, N. W. (2017). Coupling of Thermal Field-Flow Fractionation and FTIR Spectroscopy
for the Fractionation and Analysis of Complex Polymers by, (December).
Rajagopal, R. R., Rajarao, R., Cholake, S. T., & Sahajwalla, V. (2017). Sustainable composite
panels from non-metallic waste printed circuit boards and automotive plastics. Journal of
Stellenbosch University https://scholar.sun.ac.za
80
Cleaner Production, 144, 470–481. https://doi.org/10.1016/j.jclepro.2016.12.139
Rajagopal, R. R., Rajarao, R., & Sahajwalla, V. (2016). High temperature transformations of
waste printed circuit boards from computer monitor and CPU: Characterisation of residues
and kinetic studies. Waste Management, 57, 91–101.
https://doi.org/10.1016/j.wasman.2015.11.016
Rajarao, R., Sahajwalla, V., Cayumil, R., Park, M., & Khanna, R. (2014). Novel Approach for
Processing Hazardous Electronic Waste. Procedia Environmental Sciences, 21, 33–41.
https://doi.org/10.1016/j.proenv.2014.09.005
Rao, Y. K. (1971). The kinetics of reduction of hematite by carbon. Metallurgical Transactions,
2(5), 1439–1447. https://doi.org/10.1007/BF02913373
Robinson, B. H. (2009). E-waste: An assessment of global production and environmental
impacts. Science of the Total Environment. Elsevier B.V.
https://doi.org/10.1016/j.scitotenv.2009.09.044
Sahajwalla, V., Zaharia, M., Kongkarat, S., Khanna, R., Rahman, M., Saha-Chaudhury, N., …
Knights, D. (2012). Recycling end-of-life polymers in an electric arc furnace steelmaking
process: Fundamentals of polymer reactions with slag and metal. Energy and Fuels, 26(1),
58–66. https://doi.org/10.1021/ef201175t
Sahajwalla, V., Zaharia, M., Kongkarat, S., Khanna, R., Saha-Chaudhury, N., & O’Kane, P.
(2010). Recycling plastics as a resource for electric arc furnace (EAF) steelmaking:
Combustion and structural transformations of metallurgical coke and plastic blends.
Energy and Fuels, 24(1), 379–391. https://doi.org/10.1021/ef900875r
Schlotz, R., & Uhlig, S. (2006). Introduction to X-Ray Fluorescence (XRF) - Guide To XRF
Basics. Bruker AXS GmbH, 62.
Sharma, A. K., Sharma, S., Bagdi, U., & Gautam, P. (2017). Copper extraction from the
discarded printed circuit board by leaching, 3(3), 634–637.
Shen, Y., Zhao, R., Wang, J., Chen, X., Ge, X., & Chen, M. (2016). Waste-to-energy:
Dehalogenation of plastic-containing wastes. Waste Management, 49, 287–303.
https://doi.org/10.1016/j.wasman.2015.12.024
Shuey, S. A., & Taylor, P. (2005). Review of pyrometallurgical treatment of electronic scrap.
In SME Annual Meeting (pp. 1–4). https://doi.org/10.1007/s11837-004-0237-9
Stellenbosch University https://scholar.sun.ac.za

81
Silvas, F. P. C., Jiménez Correa, M. M., Caldas, M. P. K., de Moraes, V. T., Espinosa, D. C.
R., & Tenório, J. A. S. (2015). Printed circuit board recycling: Physical processing and
copper extraction by selective leaching. Waste Management, 46, 503–510.
https://doi.org/10.1016/j.wasman.2015.08.030
Silvas, F. P. C., Jiménez, M. M., Caldas, M. P. K., Moraes, V. T. De, Espinosa, D. C. R., &
Tenório, J. A. S. (2015). Printed circuit board recycling : Physical processing and copper
extraction by selective leaching, 46, 503–510.
https://doi.org/10.1016/j.wasman.2015.08.030
Skoog, D. A., Holler, F. J., & Crouch, S. R. (1998). Principles of Instrumental Analysis Sixth
Edition. Thompson Brooks/Cole. https://doi.org/10.1016/S0003-2670(00)84936-3
Sohaili, J., Muniyandi, S. K., & Mohamad, S. S. (2012a). A Review on Printed Circuit Board
Recycling Technology. Journal of Emerging Trends in Engineering and Applied Sciences,
3(1), 12–18.
Sohaili, J., Muniyandi, S. K., & Mohamad, S. S. (2012b). A Review on Printed Circuit Board
Recycling Technology Corresponding Author : Johan Sohaili, 3(1), 12–18.
Sohaili, J., Muniyandi, S. K., & Mohamad, S. S. (2012c). A Review on Printed Circuit Boards
Waste Recycling Technologies and Reuse of Recovered Nonmetallic Materials.
International Journal Os Scientific & Engineering Research, 3(2), 1–7.
Sohn, I., & Fruehan, R. J. (2005). The reduction of iron oxides by volatiles in a rotary hearth
furnace process: Part I. The role and kinetics of volatile reduction. Metallurgical and
Materials Transactions B: Process Metallurgy and Materials Processing Science, 36(5),
605–612. https://doi.org/10.1007/s11663-005-0051-y
Speight, J. G. (2005). Handbook of Coal Analysis. (J. D. Winefordner, Ed.). New Jersy: John
Wiley & Sons, Inc. https://doi.org/10.1002/0471718513
Speyer, R. F. (Georgia I. of T. (1994). Thermal Analysis of Materials. MARCEL DEKKER,
INC. NewYork.
Stewart, E. S., & Lemieux, P. M. (2003). Emissions from the incineration of electronics industry
waste. IEEE International Symposium on Electronics and the Environment, 2003.
https://doi.org/10.1109/ISEE.2003.1208088
Stokes, D. (2008). Principles and Practice of Variable Pressure / Environmental Scanning
Stellenbosch University https://scholar.sun.ac.za
82
Electron Microscopy ( VP-ESEM ). https://doi.org/10.1002/9780470758731
United States Environmental Protection Agency. (2012). Printed Circuit Board Recycling
Methods. Workshop Materials on WEEE Management in Taiwan, 27(October), 33–42.
Vasile, C., Brebu, M. A., Karayildirim, T., Yanik, J., & Darie, H. (2006). Feedstock recycling
from plastic and thermoset fractions of used computers (I): Pyrolysis. Journal of Material
Cycles and Waste Management, 8(2), 99–108. https://doi.org/10.1007/s10163-006-0151-
z
Verma, H. R. (1956). Atomic and Nuclear Analytical Methods. Nuclear Physics.
https://doi.org/10.1016/0029-5582(56)90014-1
Wang, X., Guo, Y., Liu, J., Qiao, Q., & Liang, J. (2010). PVC-based composite material
containing recycled non-metallic printed circuit board (PCB) powders. Journal of
Environmental Management, 91(12), 2505–2510.
https://doi.org/10.1016/j.jenvman.2010.07.014
Wang, Z., Li, G., Sun, Y., & He, M. (2016). Reduction behavior of hematite in the presence of
coke, 23(11), 1244–1251. https://doi.org/10.1007/s12613-016-1345-6
Widmer, R., Oswald-krapf, H., Sinha-khetriwal, D., Schnellmann, M., & Bo, H. (2005). Global
perspectives on e-waste, 25, 436–458. https://doi.org/10.1016/j.eiar.2005.04.001
Xiang, D., Mou, P., Wang, J., Duan, G., & Zhang, H. C. (2007). Printed circuit board recycling
process and its environmental impact assessment. International Journal of Advanced
Manufacturing Technology, 34(9–10), 1030–1036. https://doi.org/10.1007/s00170-006-
0656-6
Xiang, Y., Wu, P., Zhu, N., Zhang, T., Liu, W., Wu, J., & Li, P. (2010). Bioleaching of copper
from waste printed circuit boards by bacterial consortium enriched from acid mine
drainage. Journal of Hazardous Materials, 184(1–3), 812–818.
https://doi.org/10.1016/j.jhazmat.2010.08.113
Yamane, L. H., de Moraes, V. T., Espinosa, D. C. R., & Tenório, J. A. S. (2011). Recycling of
WEEE: Characterization of spent printed circuit boards from mobile phones and
computers. Waste Management, 31(12), 2553–2558.
https://doi.org/10.1016/j.wasman.2011.07.006
Yang, X., Sun, L., Xiang, J., Hu, S., & Su, S. (2013). Pyrolysis and dehalogenation of plastics
Stellenbosch University https://scholar.sun.ac.za

83
from waste electrical and electronic equipment (WEEE): A review. Waste Management,
33(2), 462–473. https://doi.org/10.1016/j.wasman.2012.07.025
Yokoyama, S., & Iji, M. (1997). Recycling of printed wiring boards with mounted electronic
parts. Proceedings of the 1997 IEEE International Symposium on Electronics and the
Environment. ISEE-1997, 109–114. https://doi.org/10.1109/ISEE.1997.605282
Zhang, C., Chen, S., Miao, X., & Yuan, H. (2009). Reduction experiment of iron scale by
adding waste plastics. Journal of Environmental Sciences, 21(SUPPL. 1), 48–51.
https://doi.org/10.1016/S1001-0742(09)60035-8
Zhang, Y., Liu, S., Xie, H., Zeng, X., & Li, J. (2012). Current status on leaching precious metals
from waste printed circuit boards, 16, 560–568.
https://doi.org/10.1016/j.proenv.2012.10.077
Zhang, Z., Zhao, X., Kown, E., & Calstaldi, M. J. (2010). Experimental Research on Microwave
Induced Thermal Decomposition of Printed Circuit Board Wastes. In Proceedings of the
18th Annual North American Waste-to-Energy Conference, NAWTEC18 (Vol. 7, pp. 1–7).
Orlando, Florida: ASME.
Zhao, M., Zhao, C., Yu, L., Li, G., Huang, J., Zhu, H., & He, W. (2016). Prediction and analysis
of WEEE in China based on the gray model. Procedia Environmental Sciences, 31, 925–
934. https://doi.org/10.1016/j.proenv.2016.02.113
Zhou, W., Apkarian, R. P., & Wang, Z. L. (2006). Fundamentals of Scanning Electron
Microscopy. In Fundamentals of scanning electron microscopy (pp. 1–40). NewYork:
Springer. https://doi.org/10.1007/978-0-387-39620-0_1
Zie, A., & Stanek, W. (2001). Forecasting of the energy effects of injecting plastic wastes into
the blast furnace in comparison with other auxiliary fuels, 26, 1159–1173.
Zietsman, J. H., Steyn, A., & Pretorius, W. (2018). Evaluating Pre-treatment and Smelting
Options with EMSIM to Improve Production Efficiency, (February), 25–28.
Stellenbosch University https://scholar.sun.ac.za

84
Appendices
Appendix A. EMSIM Simulations
Appendix A.1 Creating EMSIM Models
In order to create the mass and energy balance models using EMSIM, the following steps are
performed;
Figure A.1: Creating a new model
Figure A.2: Composition of Iron ore
Stellenbosch University https://scholar.sun.ac.za

85
Figure A.3: Composition of Reducing agents
Figure A.4: Ambient parameters
Stellenbosch University https://scholar.sun.ac.za
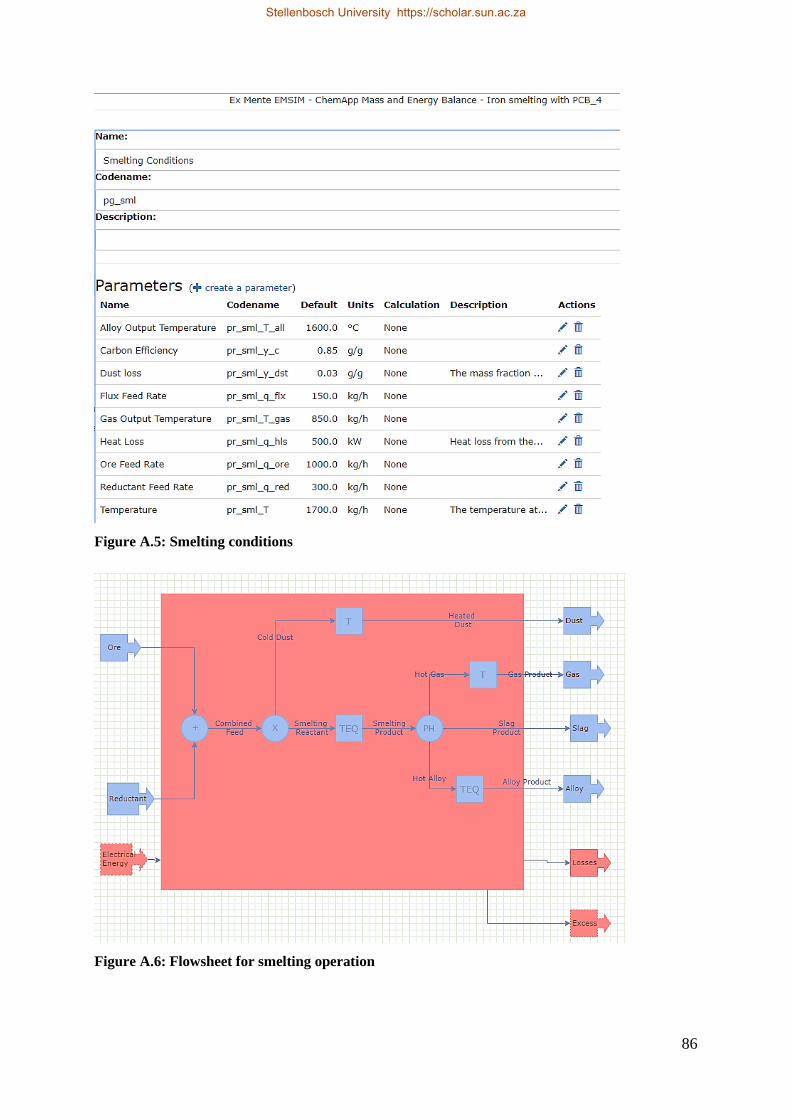
86
Figure A.5: Smelting conditions
Figure A.6: Flowsheet for smelting operation
Stellenbosch University https://scholar.sun.ac.za

87
Energy nodes use a red colour, and material nodes and streams are shown in blue.
Table A.1: Energy Nodes for EMSIM flow sheet components
Name Description
Input This node brings a user-specified quantity of
energy into the system.
Output This node removes a user-specified quantity of
energy from the system.
Energy
Balance
This node calculates the system's energy
balance.
Energy
Deficit
The energy balance associates an energy deficit
with this node. An example would be the
electrical energy required by a smelting furnace.
Energy Excess
The energy balance associates an energy excess
with this. An example would be energy released
by an aluminothermic reaction.
Table A.2: Material Nodes for EMSIM flow sheet components
Name Description
Input
This node brings a user-specified quantity of a
specified material and specified composition into
the system.
Output This node removes a user-specified quantity of
material from the system.
Combiner This node combines two or more nodes into one.
Fraction Splitter
This node splits a single input stream into two or
more output streams based on user-specified
fractions of phases and phase constituents.
Phase Splitter
This node splits a single input stream into two or
more output streams based on user-specified phase
associations with the output streams.
Temperature
Setter
This node sets the temperature of a stream to a user-
specified value.
Isothermal
Equilibrium
This node equilibrates a stream at a user-specified
temperature.
Stellenbosch University https://scholar.sun.ac.za
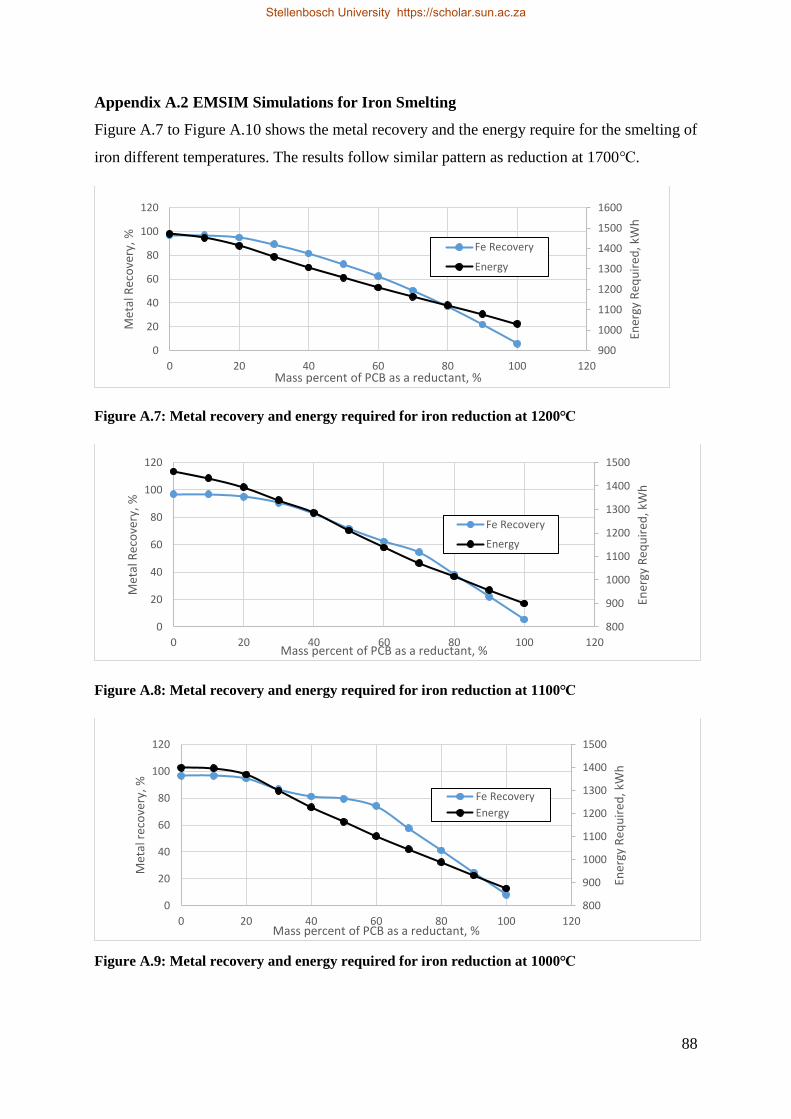
88
Appendix A.2 EMSIM Simulations for Iron Smelting
Figure A.7 to Figure A.10 shows the metal recovery and the energy require for the smelting of
iron different temperatures. The results follow similar pattern as reduction at 1700℃.
Figure A.7: Metal recovery and energy required for iron reduction at 1200℃
Figure A.8: Metal recovery and energy required for iron reduction at 1100℃
Figure A.9: Metal recovery and energy required for iron reduction at 1000℃
900
1000
1100
1200
1300
1400
1500
1600
0
20
40
60
80
100
120
0 20 40 60 80 100 120
Ener
gy R
equ
ired
, kW
h
Met
al R
eco
very
, %
Mass percent of PCB as a reductant, %
Fe Recovery
Energy
800
900
1000
1100
1200
1300
1400
1500
0
20
40
60
80
100
120
0 20 40 60 80 100 120En
ergy
Req
uir
ed, k
Wh
Met
al R
eco
very
, %
Mass percent of PCB as a reductant, %
Fe Recovery
Energy
800
900
1000
1100
1200
1300
1400
1500
0
20
40
60
80
100
120
0 20 40 60 80 100 120
Ener
gy R
equ
ired
, kW
h
Met
al r
eco
very
, %
Mass percent of PCB as a reductant, %
Fe Recovery
Energy
Stellenbosch University https://scholar.sun.ac.za
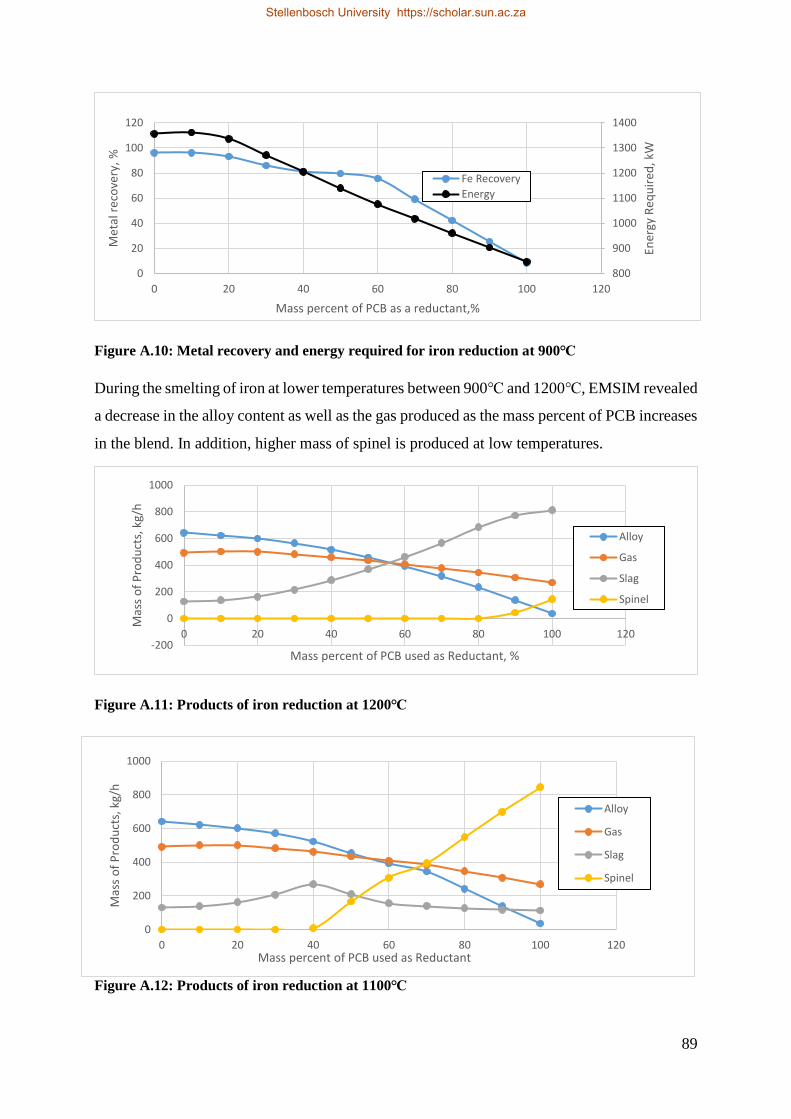
89
Figure A.10: Metal recovery and energy required for iron reduction at 900℃
During the smelting of iron at lower temperatures between 900℃ and 1200℃, EMSIM revealed
a decrease in the alloy content as well as the gas produced as the mass percent of PCB increases
in the blend. In addition, higher mass of spinel is produced at low temperatures.
Figure A.11: Products of iron reduction at 1200℃
Figure A.12: Products of iron reduction at 1100℃
800
900
1000
1100
1200
1300
1400
0
20
40
60
80
100
120
0 20 40 60 80 100 120
Ener
gy R
equ
ired
, kW
Met
al r
eco
very
, %
Mass percent of PCB as a reductant,%
Fe Recovery
Energy
-200
0
200
400
600
800
1000
0 20 40 60 80 100 120
Mas
s o
f P
rod
uct
s, k
g/h
Mass percent of PCB used as Reductant, %
Alloy
Gas
Slag
Spinel
0
200
400
600
800
1000
0 20 40 60 80 100 120
Mas
s o
f P
rod
uct
s, k
g/h
Mass percent of PCB used as Reductant
Alloy
Gas
Slag
Spinel
Stellenbosch University https://scholar.sun.ac.za

90
Figure A.13: Products of iron reduction at 1000℃
Figure A.14: Products of iron reduction at 900℃
EMSIM simulations revealed that at lower temperature, the mass flow rate of CO2 also
increases as PCB in the blend increases. The flow rate of CO, however, decreases as the mass
of PCB in the blend increases.
0
200
400
600
800
1000
0 20 40 60 80 100 120
Mas
s o
f P
rod
uct
s, k
g/h
Mass percent of PCB used as Reductant,%
Alloy
Gas
Slag
Spinel
0
200
400
600
800
1000
0 20 40 60 80 100 120
Mas
s o
f P
rod
uct
s, k
g/h
Mass percent of PCB used as Reductant
Alloy
Gas
Slag
Spinel
Stellenbosch University https://scholar.sun.ac.za
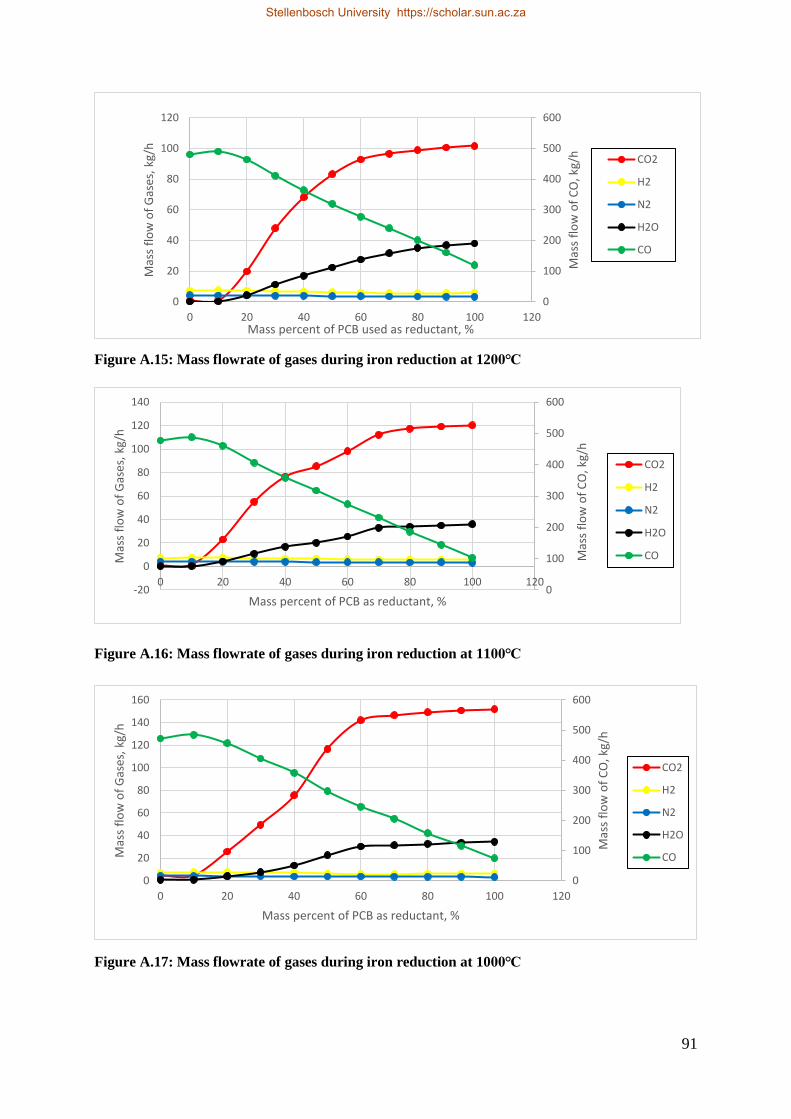
91
Figure A.15: Mass flowrate of gases during iron reduction at 1200℃
Figure A.16: Mass flowrate of gases during iron reduction at 1100℃
Figure A.17: Mass flowrate of gases during iron reduction at 1000℃
0
100
200
300
400
500
600
0
20
40
60
80
100
120
0 20 40 60 80 100 120
Mas
s fl
ow
of
CO
, kg/
h
Mas
s fl
ow
of
Gas
es,
kg/h
Mass percent of PCB used as reductant, %
CO2
H2
N2
H2O
CO
0
100
200
300
400
500
600
-20
0
20
40
60
80
100
120
140
0 20 40 60 80 100 120M
ass
flo
w o
f C
O, k
g/h
Mas
s fl
ow
of
Gas
es,
kg/h
Mass percent of PCB as reductant, %
CO2
H2
N2
H2O
CO
0
100
200
300
400
500
600
0
20
40
60
80
100
120
140
160
0 20 40 60 80 100 120
Mas
s fl
ow
of
CO
, kg/
h
Mas
s fl
ow
of
Gas
es,
kg/h
Mass percent of PCB as reductant, %
CO2
H2
N2
H2O
CO
Stellenbosch University https://scholar.sun.ac.za

92
Figure A.18: Mass flowrate of gases during iron reduction at 900℃
Table A.3 and Table A.9 shows the mass and energy balance of the chromite smelting. It can
be observed that in each of the smelting simulations the mass input is equal to the mass output.
Table A.4 to Table A.8 and Table A.140 to Table A.14 shows the mass balance and energy
balance respectively during the reduction of iron at different temperatures when blends of coal
and PCB were used as reducing agents.
The energy balance was calculated using Equation A.1
𝐸𝑙𝑒𝑐𝑡𝑟𝑖𝑐𝑎𝑙 𝐸𝑛𝑒𝑟𝑔𝑦 = [𝐻𝑓(𝑎𝑙𝑙𝑜𝑦) + 𝐻𝑓(𝑠𝑙𝑎𝑔) + 𝐻𝑓(𝑔𝑎𝑠) + 𝐻𝑓(𝑑𝑢𝑠𝑡) +
ℎ𝑒𝑎𝑡 𝑙𝑜𝑠𝑡] − [𝐻𝑓(𝑜𝑟𝑒) + 𝐻𝑓(𝑟𝑒𝑑𝑢𝑐𝑡𝑎𝑛𝑡)]
Equation A.1
Where Hf(x) = the enthalpy of formation of x
It can be observed that as PCB in the blend increases, the mass flowrate of the alloy product
decreases resulting in a decrease in enthalpy of formation of the alloy product. The slag products
however increases as PCB in the blend increases. Since the enthalpy of formation of the slag is
negative, the overall enthalpy of formation of the slag products increases in the negative
direction as PCB increases in the blend. This results in a decrease in the amount of energy
required for the smelting process.
0
100
200
300
400
500
0
20
40
60
80
100
120
140
160
180
0 20 40 60 80 100 120
Mas
s fl
ow
of
CO
, kg/
h
Mas
s fl
ow
of
Gas
es,
kg/h
Mass percent of PCB as reductant, %
CO2
H2
N2
H2O
CO
Stellenbosch University https://scholar.sun.ac.za

93
Table A.3: Mass balance for chromite smelting
Mass flow rate, kg/h
Stream T, ℃ Mass percent of PCB in blend
0 10 20 30 40 50 60 70 80 90 100
Ore Feed 25.0 1,000.0 1,000.0 1,000.0 1,000.0 1,000.0 1,000.0 1,000.0 1,000.0 1,000.0 1,000.0 1,000.0
Reductant Feed 25.0 300.0 300.0 300.0 300.0 300.0 300.0 300.0 300.0 300.0 300.0 300.0
Total 1,300.0 1,300.0 1,300.0 1,300.0 1,300.0 1,300.0 1,300.0 1,300.0 1,300.0 1,300.0 1,300.0
Alloy Product 1,600.0 564.0 564.0 525.3 495.6 450.2 393.9 332.9 270.9 211.4 152.7 91.4
Dust Output 850.0 39.0 39.0 39.0 39.0 39.0 39.0 39.0 39.0 39.0 39.0 39.0
Gas Output 850.0 463.8 449.0 429.5 414.0 397.1 374.1 346.5 315.1 282.5 250.5 219.7
Slag Product 1,700.0 233.2 265.2 306.2 351.3 413.7 493.0 581.7 675.0 767.1 857.8 949.9
Total 1,300.0 1,300.0 1,300.0 1,300.0 1,300.0 1,300.0 1,300.0 1,300.0 1,300.0 1,300.0 1,300.0
Balance 0.0 0.0 0.0 0.0 0.0 0.0 0.0 0.0 0.0 0.0 0.0
Table A.4: Mass balance for Iron smelting at 1700℃
Mass flow rate, kg/h
Stream T, ℃ Mass percent of PCB in blend,%
0 10 20 30 40 50 60 70 80 90 100
Ore Feed 25.0 1,000.0 1,000.0 1,000.0 1,000.0 1,000.0 1,000.0 1,000.0 1,000.0 1,000.0 1,000.0 1,000.0
Reductant Feed 25.0 300.0 300.0 300.0 300.0 300.0 300.0 300.0 300.0 300.0 300.0 300.0
Total 1,300.0 1,300.0 1,300.0 1,300.0 1,300.0 1,300.0 1,300.0 1,300.0 1,300.0 1,300.0 1,300.0
Alloy Product 1,600.0 644.8 621.0 592.4 544.4 482.6 411.7 332.3 246.7 157.3 65.8 0.0
Dust Output 850.0 39.0 39.0 39.0 39.0 39.0 39.0 39.0 39.0 39.0 39.0 39.0
Gas Output 850.0 553.7 525.1 499.0 476.5 450.4 421.7 390.3 356.9 322.2 286.8 258.6
Slag Product 1,700.0 62.4 114.9 169.7 240.1 328.0 427.6 538.4 657.5 781.5 908.4 1,002.4
Stellenbosch University https://scholar.sun.ac.za
Stellenbosch University https://scholar.sun.ac.za
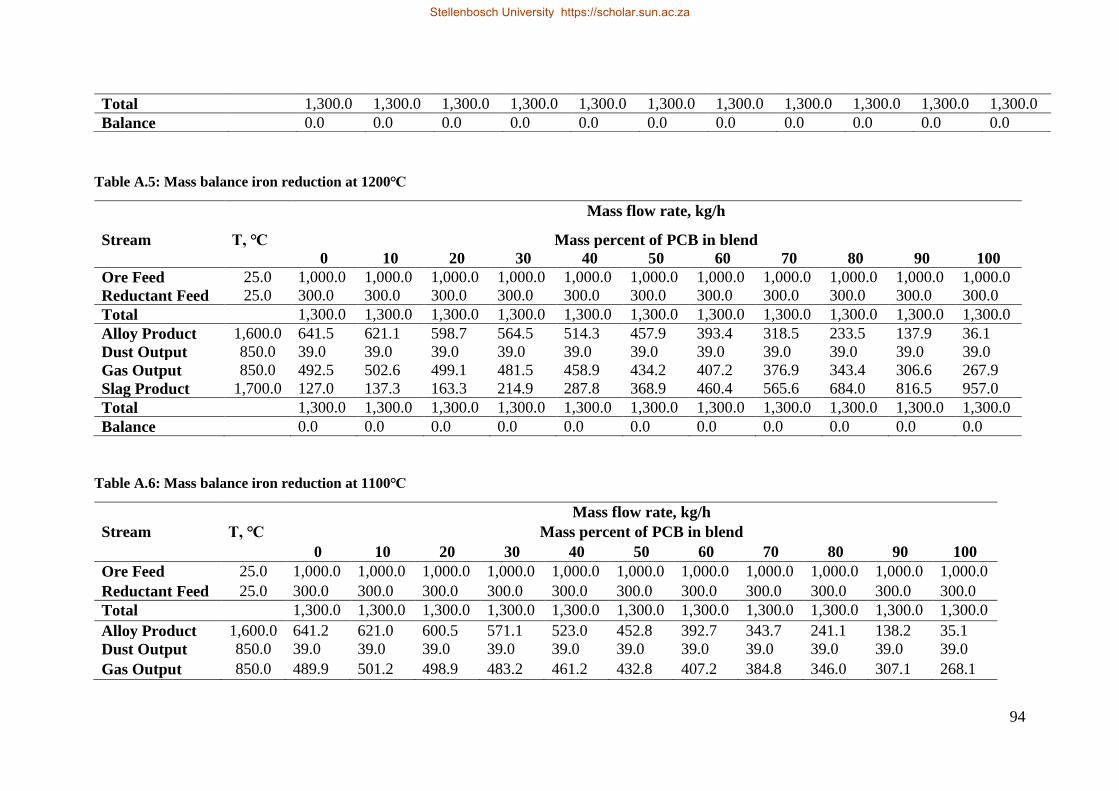
94
Table A.5: Mass balance iron reduction at 1200℃
Mass flow rate, kg/h
Stream T, ℃ Mass percent of PCB in blend
0 10 20 30 40 50 60 70 80 90 100
Ore Feed 25.0 1,000.0 1,000.0 1,000.0 1,000.0 1,000.0 1,000.0 1,000.0 1,000.0 1,000.0 1,000.0 1,000.0
Reductant Feed 25.0 300.0 300.0 300.0 300.0 300.0 300.0 300.0 300.0 300.0 300.0 300.0
Total 1,300.0 1,300.0 1,300.0 1,300.0 1,300.0 1,300.0 1,300.0 1,300.0 1,300.0 1,300.0 1,300.0
Alloy Product 1,600.0 641.5 621.1 598.7 564.5 514.3 457.9 393.4 318.5 233.5 137.9 36.1
Dust Output 850.0 39.0 39.0 39.0 39.0 39.0 39.0 39.0 39.0 39.0 39.0 39.0
Gas Output 850.0 492.5 502.6 499.1 481.5 458.9 434.2 407.2 376.9 343.4 306.6 267.9
Slag Product 1,700.0 127.0 137.3 163.3 214.9 287.8 368.9 460.4 565.6 684.0 816.5 957.0
Total 1,300.0 1,300.0 1,300.0 1,300.0 1,300.0 1,300.0 1,300.0 1,300.0 1,300.0 1,300.0 1,300.0
Balance 0.0 0.0 0.0 0.0 0.0 0.0 0.0 0.0 0.0 0.0 0.0
Table A.6: Mass balance iron reduction at 1100℃
Mass flow rate, kg/h
Stream T, ℃ Mass percent of PCB in blend
0 10 20 30 40 50 60 70 80 90 100
Ore Feed 25.0 1,000.0 1,000.0 1,000.0 1,000.0 1,000.0 1,000.0 1,000.0 1,000.0 1,000.0 1,000.0 1,000.0
Reductant Feed 25.0 300.0 300.0 300.0 300.0 300.0 300.0 300.0 300.0 300.0 300.0 300.0
Total 1,300.0 1,300.0 1,300.0 1,300.0 1,300.0 1,300.0 1,300.0 1,300.0 1,300.0 1,300.0 1,300.0
Alloy Product 1,600.0 641.2 621.0 600.5 571.1 523.0 452.8 392.7 343.7 241.1 138.2 35.1
Dust Output 850.0 39.0 39.0 39.0 39.0 39.0 39.0 39.0 39.0 39.0 39.0 39.0
Gas Output 850.0 489.9 501.2 498.9 483.2 461.2 432.8 407.2 384.8 346.0 307.1 268.1
Total 1,300.0 1,300.0 1,300.0 1,300.0 1,300.0 1,300.0 1,300.0 1,300.0 1,300.0 1,300.0 1,300.0
Balance 0.0 0.0 0.0 0.0 0.0 0.0 0.0 0.0 0.0 0.0 0.0
Stellenbosch University https://scholar.sun.ac.za
Stellenbosch University https://scholar.sun.ac.za

95
Slag Product 1,700.0 129.9 138.8 161.6 206.7 276.8 375.5 461.1 532.4 673.9 815.7 957.8
Total 1,300.0 1,300.0 1,300.0 1,300.0 1,300.0 1,300.0 1,300.0 1,300.0 1,300.0 1,300.0 1,300.0
Balance 0.0 0.0 0.0 0.0 0.0 0.0 0.0 0.0 0.0 0.0 0.0
Table A.7: Mass balance iron reduction at 1000℃
Mass flow rate, kg/h
Stream T, ℃ Mass percent of PCB in blend
0 10 20 30 40 50 60 70 80 90 100
Ore Feed 25.0 1,000.0 1,000.0 1,000.0 1,000.0 1,000.0 1,000.0 1,000.0 1,000.0 1,000.0 1,000.0 1,000.0
Reductant Feed 25.0 300.0 300.0 300.0 300.0 300.0 300.0 300.0 300.0 300.0 300.0 300.0
Total 1,300.0 1,300.0 1,300 1,300.0 1,300.0 1,300.0 1,300.0 1,300.0 1,300.0 1,300.0 1,300.0
Alloy Product 1,600.0 641.3 622.1 599.2 547.2 513.1 501.0 467.6 363.9 259.6 155.1 269.6
Dust Output 850.0 39.0 39.0 39.0 39.0 39.0 39.0 39.0 39.0 39.0 39.0 39.0
Gas Output 850.0 487.9 500.3 497.2 475.5 457.8 446.1 427.7 388.4 348.8 309.3 269.6
Slag Product 1,700.0 131.8 138.6 164.6 238.3 290.1 313.9 365.7 508.7 652.6 796.6 940.8
Total 1,300.0 1,300.0 1,300.0 1,300.0 1,300.0 1,300.0 1,300.0 1,300.0 1,300.0 1,300.0 1,300.0
Balance 0.0 0.0 0.0 0.0 0.0 0.0 0.0 0.0 0.0 0.0 0.0
Table A.8: Mass balance iron reduction at 900℃
Mass flow rate, kg/h
Stream T, ℃ Mass percent of PCB in blend
0 10 20 30 40 50 60 70 80 90 100
Ore Feed 25.0 1,000.0 1,000.0 1,000.0 1,000.0 1,000.0 1,000.0 1,000.0 1,000.0 1,000.0 1,000.0 1,000.0
Reductant Feed 25.0 300.0 300.0 300.0 300.0 300.0 300.0 300.0 300.0 300.0 300.0 300.0
Total 1,300.0 1,300.0 1,300 1,300.0 1,300.0 1,300.0 1,300.0 1,300.0 1,300.0 1,300.0 1,300.0
Alloy Product 1,600.0 642.1 622.2 592.9 543.6 512.7 501.5 476.9 372.9 266.7 160.2 53.6
Dust Output 850.0 39.0 39.0 39.0 39.0 39.0 39.0 39.0 39.0 39.0 39.0 39.0
Stellenbosch University https://scholar.sun.ac.za
Stellenbosch University https://scholar.sun.ac.za

96
Gas Output 850.0 482.3 494.1 492.3 472.6 456.8 448.8 430.3 390.9 350.8 310.7 270.5
Slag Product 1,700.0 136.5 144.6 175.8 244.7 291.5 313.8 353.8 497.2 643.5 790.1 936.9
Total 1,300.0 1,300.0 1,300.0 1,300.0 1,300.0 1,300.0 1,300.0 1,300.0 1,300.0 1,300.0 1,300.0
Balance 0.0 0.0 0.0 0.0 0.0 0.0 0.0 0.0 0.0 0.0 0.0
Table A.9: Energy balance for chromite smelting
Energy, kWh
Stream T, ℃ Mass percent of PCB in blend,%
0 10 20 30 40 50 60 70 80 90 100
Ore Feed 25.0 -2,539.8 -2,539.8 -2,539.8 -2,539.8 -2,539.8 -2,539.8 -2,539.8 -2,539.8 -2,539.8 -2,539.8 -2,539.8
Reductant Feed 25.0 -110.5 -169.5 -228.5 -287.5.5 -346.6 -405.6 -464.6 -523.6 -582.7 -641.7 -700.7
Electrical Energy 2,124.7 2,042.1 1,966.5 1,915.8 1,864.2 1,799.1 1,723.0 1,636.5 1,541.7 1,449.1 1,368.1
Total -525.5 -667.2 -801.8 -911.5 -1,022.1 -1,146.3 -1,281.4 -1,426.9 -1,580.8 -1,732.3 -1,872.4
Alloy Product 1,600.0 260.4 232.9 214.5 196.8 173.5 147.7 122.4 99.2 78.1 56.9 34.2
Dust Output 850.0 -69.8 -71.6 -73.4 -75.2 -77.0 -78.8 -80.6 -82.4 -84.2 -86.0 -87.8
Gas Output 850.0 -310.2 -319.9 -317.8 -307.8 -294.7 - 275.8 -252.7 -227.5 -203.9 -185.8 -173.3
Slag Product 1,700.0 -905.9 -1,008.6 -1,125.1 -1,225.3 -1,323.9 -1,439.4 -1,570.5 -1,716.3 -1,870.8 -2,017.4 -2,145.4
Heat loss⃰ 500.0 500.0 500 500 500 500.0 500.0 500.0 500.0 500.0 500.0
Total -525.5 -667.2 -801.8 -911.5 -1,022.1 -1,146.3 -1,281.4 -1,426.9 -1,580.8 -1,732.3 -1,872.4
Balance 0.0 0.0 0.0 0.0 0.0 0.0 0.0 0.0 0.0 0.0 0.0
Assumed Heat loss⃰ is 500kWh
Stellenbosch University https://scholar.sun.ac.za
Stellenbosch University https://scholar.sun.ac.za
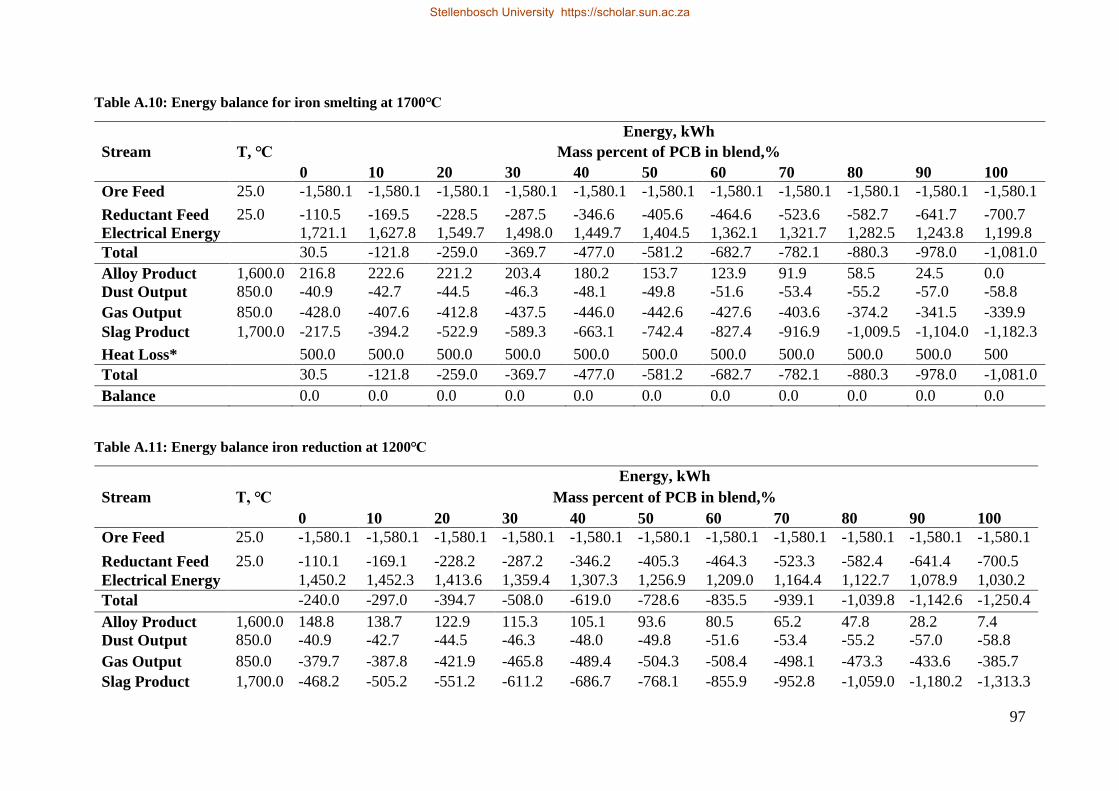
97
Table A.10: Energy balance for iron smelting at 1700℃
Energy, kWh
Stream T, ℃ Mass percent of PCB in blend,%
0 10 20 30 40 50 60 70 80 90 100
Ore Feed 25.0 -1,580.1 -1,580.1 -1,580.1 -1,580.1 -1,580.1 -1,580.1 -1,580.1 -1,580.1 -1,580.1 -1,580.1 -1,580.1
Reductant Feed 25.0 -110.5 -169.5 -228.5 -287.5 -346.6 -405.6 -464.6 -523.6 -582.7 -641.7 -700.7
Electrical Energy 1,721.1 1,627.8 1,549.7 1,498.0 1,449.7 1,404.5 1,362.1 1,321.7 1,282.5 1,243.8 1,199.8
Total 30.5 -121.8 -259.0 -369.7 -477.0 -581.2 -682.7 -782.1 -880.3 -978.0 -1,081.0
Alloy Product 1,600.0 216.8 222.6 221.2 203.4 180.2 153.7 123.9 91.9 58.5 24.5 0.0
Dust Output 850.0 -40.9 -42.7 -44.5 -46.3 -48.1 -49.8 -51.6 -53.4 -55.2 -57.0 -58.8
Gas Output 850.0 -428.0 -407.6 -412.8 -437.5 -446.0 -442.6 -427.6 -403.6 -374.2 -341.5 -339.9
Slag Product 1,700.0 -217.5 -394.2 -522.9 -589.3 -663.1 -742.4 -827.4 -916.9 -1,009.5 -1,104.0 -1,182.3
Heat Loss* 500.0 500.0 500.0 500.0 500.0 500.0 500.0 500.0 500.0 500.0 500
Total 30.5 -121.8 -259.0 -369.7 -477.0 -581.2 -682.7 -782.1 -880.3 -978.0 -1,081.0
Balance 0.0 0.0 0.0 0.0 0.0 0.0 0.0 0.0 0.0 0.0 0.0
Table A.11: Energy balance iron reduction at 1200℃
Energy, kWh
Stream T, ℃ Mass percent of PCB in blend,%
0 10 20 30 40 50 60 70 80 90 100
Ore Feed 25.0 -1,580.1 -1,580.1 -1,580.1 -1,580.1 -1,580.1 -1,580.1 -1,580.1 -1,580.1 -1,580.1 -1,580.1 -1,580.1
Reductant Feed 25.0 -110.1 -169.1 -228.2 -287.2 -346.2 -405.3 -464.3 -523.3 -582.4 -641.4 -700.5
Electrical Energy 1,450.2 1,452.3 1,413.6 1,359.4 1,307.3 1,256.9 1,209.0 1,164.4 1,122.7 1,078.9 1,030.2
Total -240.0 -297.0 -394.7 -508.0 -619.0 -728.6 -835.5 -939.1 -1,039.8 -1,142.6 -1,250.4
Alloy Product 1,600.0 148.8 138.7 122.9 115.3 105.1 93.6 80.5 65.2 47.8 28.2 7.4
Dust Output 850.0 -40.9 -42.7 -44.5 -46.3 -48.0 -49.8 -51.6 -53.4 -55.2 -57.0 -58.8
Gas Output 850.0 -379.7 -387.8 -421.9 -465.8 -489.4 -504.3 -508.4 -498.1 -473.3 -433.6 -385.7
Slag Product 1,700.0 -468.2 -505.2 -551.2 -611.2 -686.7 -768.1 -855.9 -952.8 -1,059.0 -1,180.2 -1,313.3
Stellenbosch University https://scholar.sun.ac.za
Stellenbosch University https://scholar.sun.ac.za
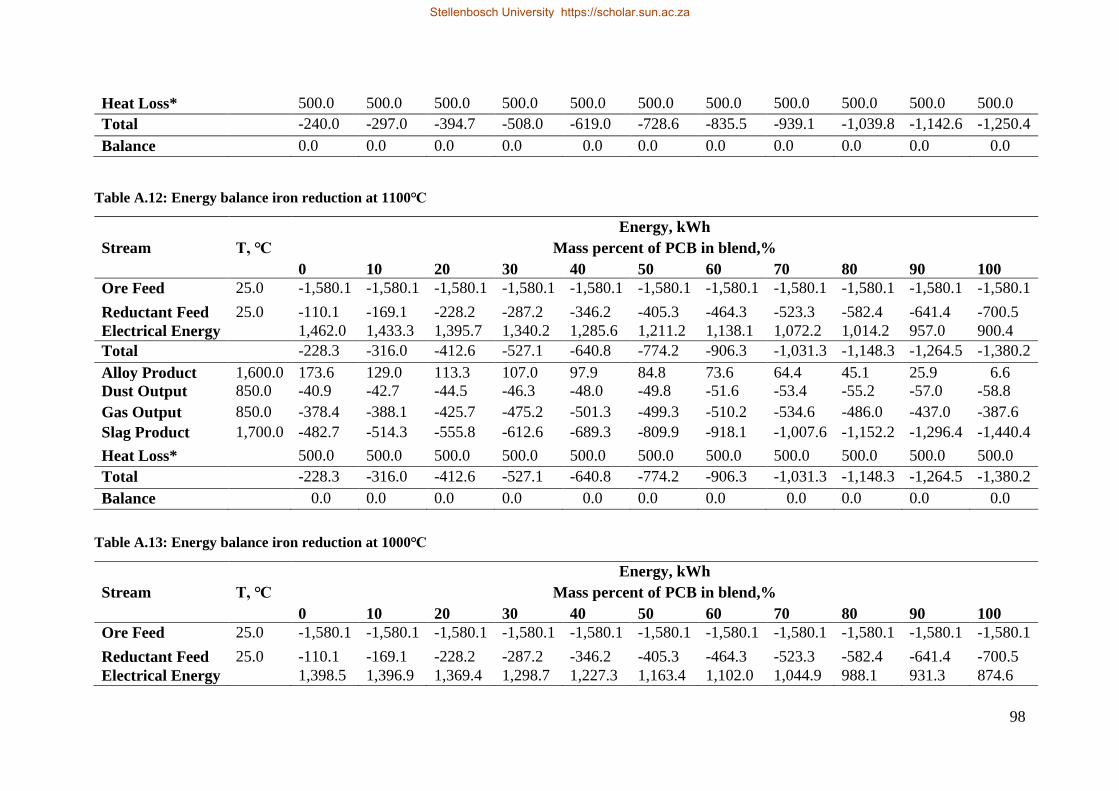
98
Heat Loss* 500.0 500.0 500.0 500.0 500.0 500.0 500.0 500.0 500.0 500.0 500.0
Total -240.0 -297.0 -394.7 -508.0 -619.0 -728.6 -835.5 -939.1 -1,039.8 -1,142.6 -1,250.4
Balance 0.0 0.0 0.0 0.0 0.0 0.0 0.0 0.0 0.0 0.0 0.0
Table A.12: Energy balance iron reduction at 1100℃
Energy, kWh
Stream T, ℃ Mass percent of PCB in blend,%
0 10 20 30 40 50 60 70 80 90 100
Ore Feed 25.0 -1,580.1 -1,580.1 -1,580.1 -1,580.1 -1,580.1 -1,580.1 -1,580.1 -1,580.1 -1,580.1 -1,580.1 -1,580.1
Reductant Feed 25.0 -110.1 -169.1 -228.2 -287.2 -346.2 -405.3 -464.3 -523.3 -582.4 -641.4 -700.5
Electrical Energy 1,462.0 1,433.3 1,395.7 1,340.2 1,285.6 1,211.2 1,138.1 1,072.2 1,014.2 957.0 900.4
Total -228.3 -316.0 -412.6 -527.1 -640.8 -774.2 -906.3 -1,031.3 -1,148.3 -1,264.5 -1,380.2
Alloy Product 1,600.0 173.6 129.0 113.3 107.0 97.9 84.8 73.6 64.4 45.1 25.9 6.6
Dust Output 850.0 -40.9 -42.7 -44.5 -46.3 -48.0 -49.8 -51.6 -53.4 -55.2 -57.0 -58.8
Gas Output 850.0 -378.4 -388.1 -425.7 -475.2 -501.3 -499.3 -510.2 -534.6 -486.0 -437.0 -387.6
Slag Product 1,700.0 -482.7 -514.3 -555.8 -612.6 -689.3 -809.9 -918.1 -1,007.6 -1,152.2 -1,296.4 -1,440.4
Heat Loss* 500.0 500.0 500.0 500.0 500.0 500.0 500.0 500.0 500.0 500.0 500.0
Total -228.3 -316.0 -412.6 -527.1 -640.8 -774.2 -906.3 -1,031.3 -1,148.3 -1,264.5 -1,380.2
Balance 0.0 0.0 0.0 0.0 0.0 0.0 0.0 0.0 0.0 0.0 0.0
Table A.13: Energy balance iron reduction at 1000℃
Energy, kWh
Stream T, ℃ Mass percent of PCB in blend,%
0 10 20 30 40 50 60 70 80 90 100
Ore Feed 25.0 -1,580.1 -1,580.1 -1,580.1 -1,580.1 -1,580.1 -1,580.1 -1,580.1 -1,580.1 -1,580.1 -1,580.1 -1,580.1
Reductant Feed 25.0 -110.1 -169.1 -228.2 -287.2 -346.2 -405.3 -464.3 -523.3 -582.4 -641.4 -700.5
Electrical Energy 1,398.5 1,396.9 1,369.4 1,298.7 1,227.3 1,163.4 1,102.0 1,044.9 988.1 931.3 874.6
Stellenbosch University https://scholar.sun.ac.za
Stellenbosch University https://scholar.sun.ac.za
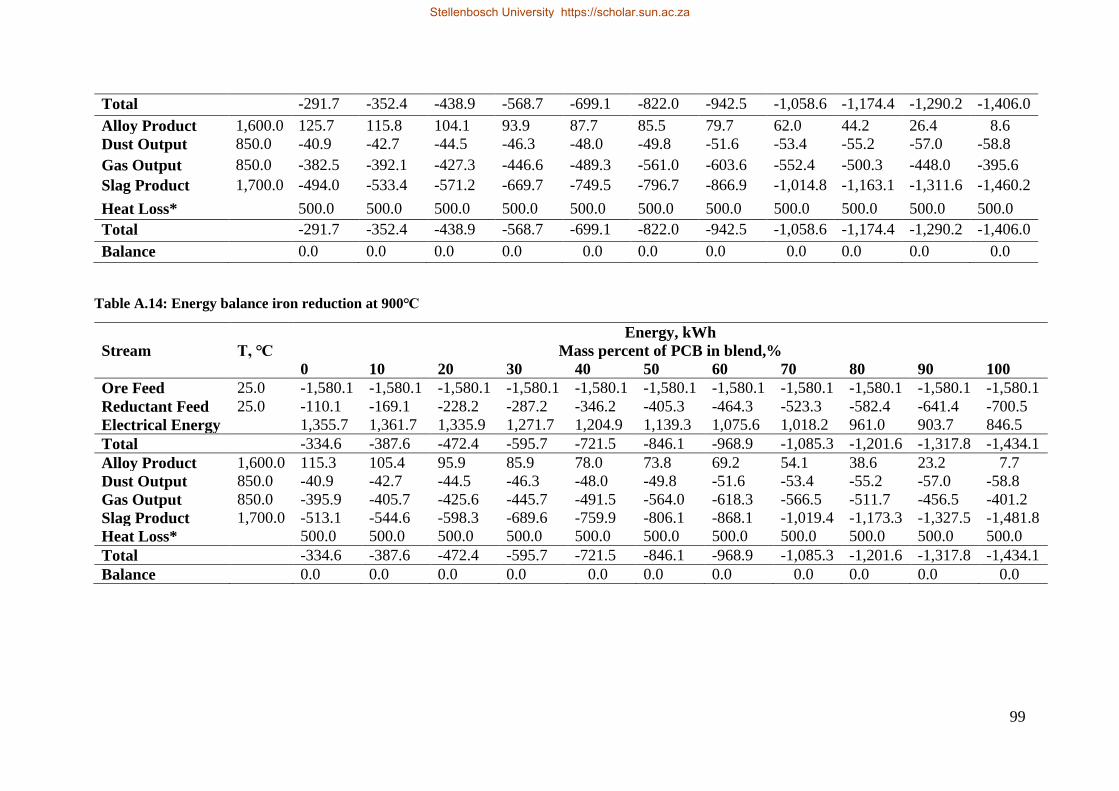
99
Total -291.7 -352.4 -438.9 -568.7 -699.1 -822.0 -942.5 -1,058.6 -1,174.4 -1,290.2 -1,406.0
Alloy Product 1,600.0 125.7 115.8 104.1 93.9 87.7 85.5 79.7 62.0 44.2 26.4 8.6
Dust Output 850.0 -40.9 -42.7 -44.5 -46.3 -48.0 -49.8 -51.6 -53.4 -55.2 -57.0 -58.8
Gas Output 850.0 -382.5 -392.1 -427.3 -446.6 -489.3 -561.0 -603.6 -552.4 -500.3 -448.0 -395.6
Slag Product 1,700.0 -494.0 -533.4 -571.2 -669.7 -749.5 -796.7 -866.9 -1,014.8 -1,163.1 -1,311.6 -1,460.2
Heat Loss* 500.0 500.0 500.0 500.0 500.0 500.0 500.0 500.0 500.0 500.0 500.0
Total -291.7 -352.4 -438.9 -568.7 -699.1 -822.0 -942.5 -1,058.6 -1,174.4 -1,290.2 -1,406.0
Balance 0.0 0.0 0.0 0.0 0.0 0.0 0.0 0.0 0.0 0.0 0.0
Table A.14: Energy balance iron reduction at 900℃
Energy, kWh
Stream T, ℃ Mass percent of PCB in blend,%
0 10 20 30 40 50 60 70 80 90 100
Ore Feed 25.0 -1,580.1 -1,580.1 -1,580.1 -1,580.1 -1,580.1 -1,580.1 -1,580.1 -1,580.1 -1,580.1 -1,580.1 -1,580.1
Reductant Feed 25.0 -110.1 -169.1 -228.2 -287.2 -346.2 -405.3 -464.3 -523.3 -582.4 -641.4 -700.5
Electrical Energy 1,355.7 1,361.7 1,335.9 1,271.7 1,204.9 1,139.3 1,075.6 1,018.2 961.0 903.7 846.5
Total -334.6 -387.6 -472.4 -595.7 -721.5 -846.1 -968.9 -1,085.3 -1,201.6 -1,317.8 -1,434.1
Alloy Product 1,600.0 115.3 105.4 95.9 85.9 78.0 73.8 69.2 54.1 38.6 23.2 7.7
Dust Output 850.0 -40.9 -42.7 -44.5 -46.3 -48.0 -49.8 -51.6 -53.4 -55.2 -57.0 -58.8
Gas Output 850.0 -395.9 -405.7 -425.6 -445.7 -491.5 -564.0 -618.3 -566.5 -511.7 -456.5 -401.2
Slag Product 1,700.0 -513.1 -544.6 -598.3 -689.6 -759.9 -806.1 -868.1 -1,019.4 -1,173.3 -1,327.5 -1,481.8
Heat Loss* 500.0 500.0 500.0 500.0 500.0 500.0 500.0 500.0 500.0 500.0 500.0
Total -334.6 -387.6 -472.4 -595.7 -721.5 -846.1 -968.9 -1,085.3 -1,201.6 -1,317.8 -1,434.1
Balance 0.0 0.0 0.0 0.0 0.0 0.0 0.0 0.0 0.0 0.0 0.0
Stellenbosch University https://scholar.sun.ac.za
Stellenbosch University https://scholar.sun.ac.za

100
Appendix B. Reduction of Hematite
Appendix B.1 Mechanism of Solid State Reduction of Hematite at High Temperatures
The reduction of hematite is complex and takes place through a series of stages. Chen et al.
(2017) studied the reduction of hematite to metallic iron in a micro fluidized bed. They stated
that the reduction of hematite could be separated into two parts that proceed in series. In the
first part, hematite is converted to magnetite in a single-step reaction which proceeds fast and
covers a reduction degree of about 11%. The conversion of hematite occurs between 600 and
700℃ (Jung & Yi, 2013). A two-step reaction of magnetite to metallic iron takes place in the
second part. This is a combination of two single step reaction; magnetite to wustite and wustite
to iron; that occur in parallel to cover the conversion from 11% to 100%. Metallic iron is formed
at temperatures between 900 and 1100℃ (Carpenter, 2010).
Figure B.1: Mechanism for the reduction hematite to iron reported by Chen et al., (2017)
According to Dankwah et al., (2012) and Carpenter, (2010), the reactions that are believed to
occur during reduction of hematite are divided into the following four categories: The removal
of oxygen from the iron oxides takes place by a series of chemical reactions
1. Conversion of polymers into hydrocarbons (mainly CH4)
Polymers = CnHm(g) Equation B.1
2. Decomposition of hydrocarbons into carbon and hydrogen:
CnHm(g) = Cn(s) + m/2H2(g) Equation B.2
The hydrocarbon could also act as a sink for CO2 gas, producing CO and H2
CnHm(g) + nCO2(g) = 2nCO(g) + m/2H2(g) Equation B.3
Stellenbosch University https://scholar.sun.ac.za
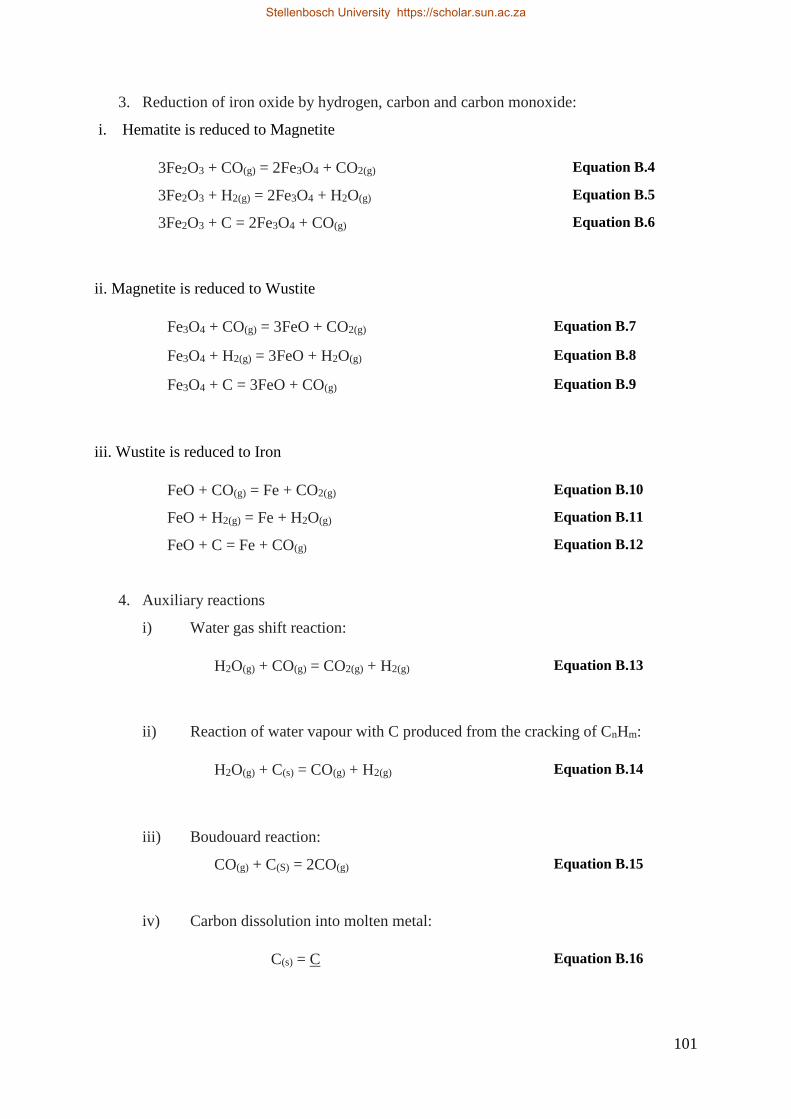
101
3. Reduction of iron oxide by hydrogen, carbon and carbon monoxide:
i. Hematite is reduced to Magnetite
3Fe2O3 + CO(g) = 2Fe3O4 + CO2(g) Equation B.4
3Fe2O3 + H2(g) = 2Fe3O4 + H2O(g) Equation B.5
3Fe2O3 + C = 2Fe3O4 + CO(g) Equation B.6
ii. Magnetite is reduced to Wustite
Fe3O4 + CO(g) = 3FeO + CO2(g) Equation B.7
Fe3O4 + H2(g) = 3FeO + H2O(g) Equation B.8
Fe3O4 + C = 3FeO + CO(g) Equation B.9
iii. Wustite is reduced to Iron
FeO + CO(g) = Fe + CO2(g) Equation B.10
FeO + H2(g) = Fe + H2O(g) Equation B.11
FeO + C = Fe + CO(g) Equation B.12
4. Auxiliary reactions
i) Water gas shift reaction:
H2O(g) + CO(g) = CO2(g) + H2(g) Equation B.13
ii) Reaction of water vapour with C produced from the cracking of CnHm:
H2O(g) + C(s) = CO(g) + H2(g) Equation B.14
iii) Boudouard reaction:
CO(g) + C(S) = 2CO(g) Equation B.15
iv) Carbon dissolution into molten metal:
C(s) = C Equation B.16
Stellenbosch University https://scholar.sun.ac.za
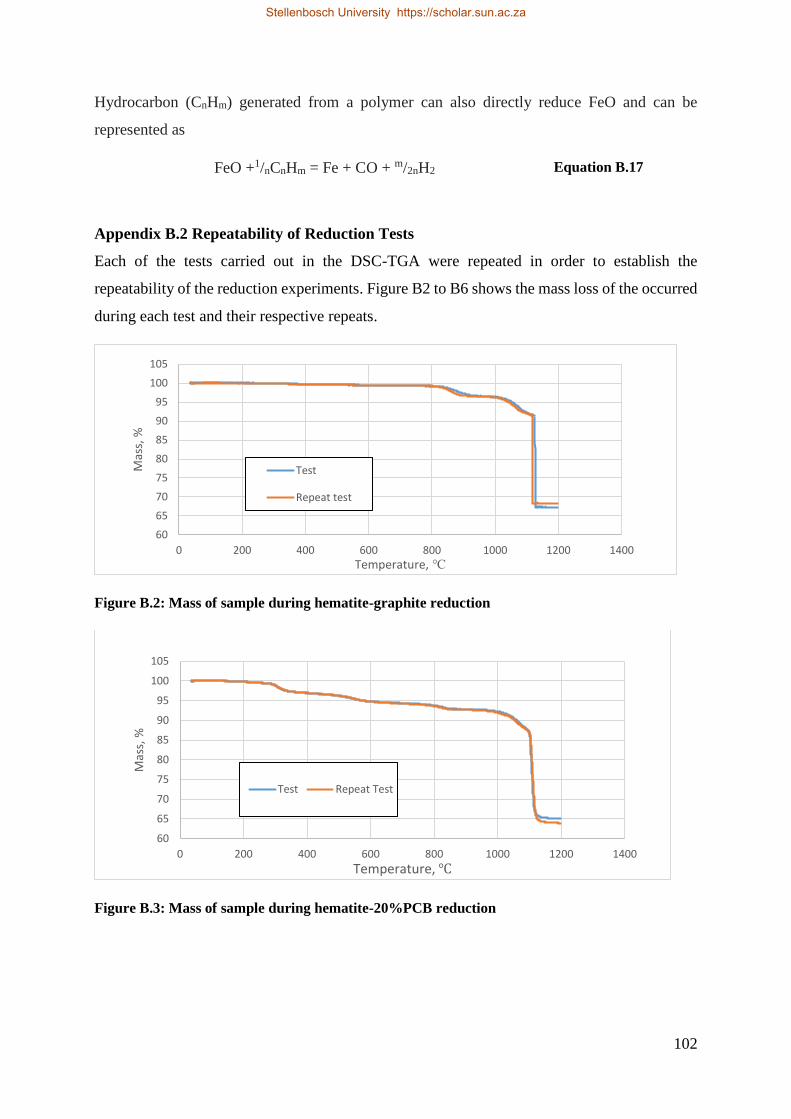
102
Hydrocarbon (CnHm) generated from a polymer can also directly reduce FeO and can be
represented as
FeO +1/nCnHm = Fe + CO + m/2nH2 Equation B.17
Appendix B.2 Repeatability of Reduction Tests
Each of the tests carried out in the DSC-TGA were repeated in order to establish the
repeatability of the reduction experiments. Figure B2 to B6 shows the mass loss of the occurred
during each test and their respective repeats.
Figure B.2: Mass of sample during hematite-graphite reduction
Figure B.3: Mass of sample during hematite-20%PCB reduction
60
65
70
75
80
85
90
95
100
105
0 200 400 600 800 1000 1200 1400
Mas
s, %
Temperature, ℃
Test
Repeat test
60
65
70
75
80
85
90
95
100
105
0 200 400 600 800 1000 1200 1400
Mas
s, %
Temperature, ℃
Test Repeat Test
Stellenbosch University https://scholar.sun.ac.za
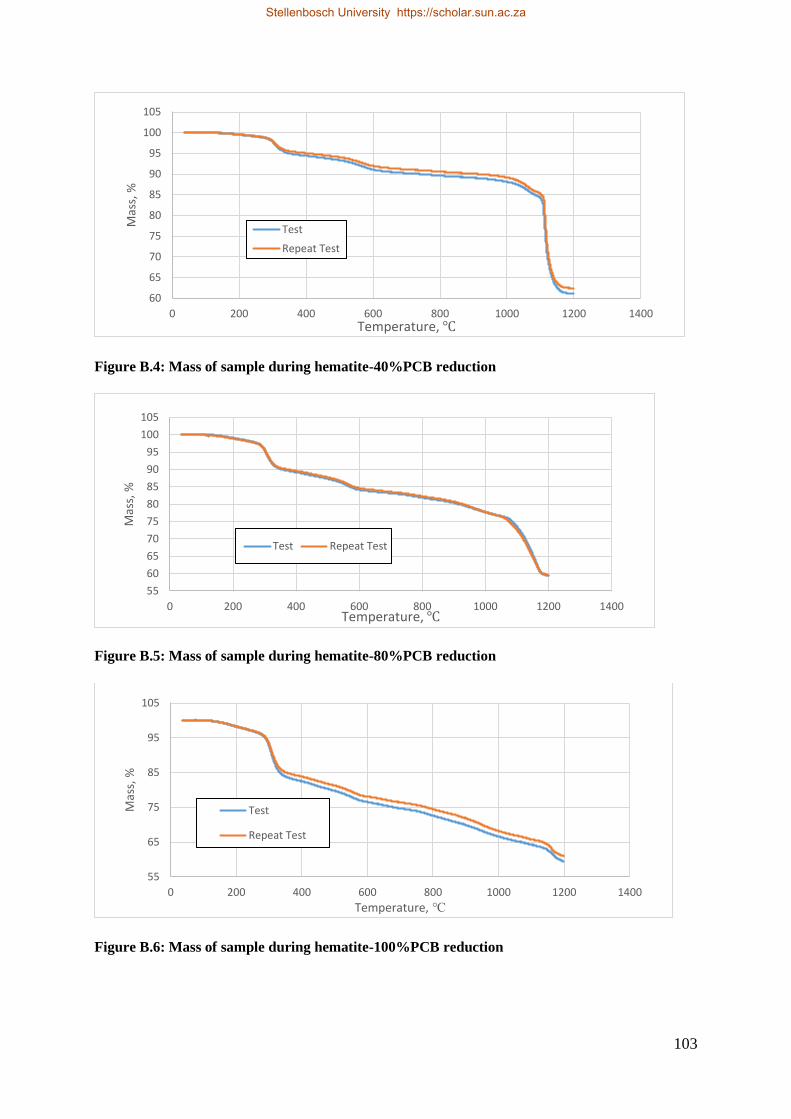
103
Figure B.4: Mass of sample during hematite-40%PCB reduction
Figure B.5: Mass of sample during hematite-80%PCB reduction
Figure B.6: Mass of sample during hematite-100%PCB reduction
60
65
70
75
80
85
90
95
100
105
0 200 400 600 800 1000 1200 1400
Mas
s, %
Temperature, ℃
Test
Repeat Test
55
60
65
70
75
80
85
90
95
100
105
0 200 400 600 800 1000 1200 1400
Mas
s, %
Temperature, ℃
Test Repeat Test
55
65
75
85
95
105
0 200 400 600 800 1000 1200 1400
Mas
s, %
Temperature, ℃
Test
Repeat Test
Stellenbosch University https://scholar.sun.ac.za
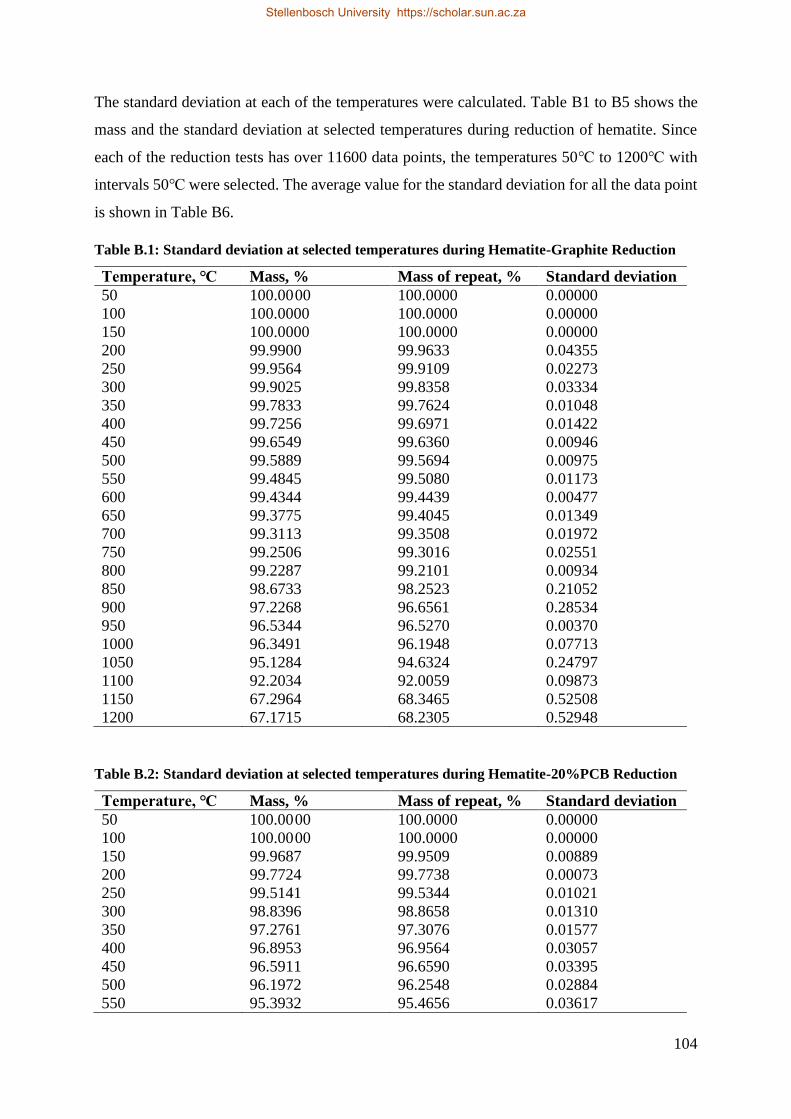
104
The standard deviation at each of the temperatures were calculated. Table B1 to B5 shows the
mass and the standard deviation at selected temperatures during reduction of hematite. Since
each of the reduction tests has over 11600 data points, the temperatures 50℃ to 1200℃ with
intervals 50℃ were selected. The average value for the standard deviation for all the data point
is shown in Table B6.
Table B.1: Standard deviation at selected temperatures during Hematite-Graphite Reduction
Temperature, ℃ Mass, % Mass of repeat, % Standard deviation
50 100.00 00 100.0000 0.00000
100 100.0000 100.0000 0.00000
150 100.0000 100.0000 0.00000
200 99.9900 99.9633 0.04355
250 99.9564 99.9109 0.02273
300 99.9025 99.8358 0.03334
350 99.7833 99.7624 0.01048
400 99.7256 99.6971 0.01422
450 99.6549 99.6360 0.00946
500 99.5889 99.5694 0.00975
550 99.4845 99.5080 0.01173
600 99.4344 99.4439 0.00477
650 99.3775 99.4045 0.01349
700 99.3113 99.3508 0.01972
750 99.2506 99.3016 0.02551
800 99.2287 99.2101 0.00934
850 98.6733 98.2523 0.21052
900 97.2268 96.6561 0.28534
950 96.5344 96.5270 0.00370
1000 96.3491 96.1948 0.07713
1050 95.1284 94.6324 0.24797
1100 92.2034 92.0059 0.09873
1150 67.2964 68.3465 0.52508
1200 67.1715 68.2305 0.52948
Table B.2: Standard deviation at selected temperatures during Hematite-20%PCB Reduction
Temperature, ℃ Mass, % Mass of repeat, % Standard deviation
50 100.00 00 100.0000 0.00000
100 100.00 00 100.0000 0.00000
150 99.9687 99.9509 0.00889
200 99.7724 99.7738 0.00073
250 99.5141 99.5344 0.01021
300 98.8396 98.8658 0.01310
350 97.2761 97.3076 0.01577
400 96.8953 96.9564 0.03057
450 96.5911 96.6590 0.03395
500 96.1972 96.2548 0.02884
550 95.3932 95.4656 0.03617
Stellenbosch University https://scholar.sun.ac.za

105
600 94.7758 94.7242 0.02578
650 94.5469 94.4475 0.04968
700 94.3432 94.2356 0.05379
750 94.1493 94.0238 0.06275
800 93.7844 93.6141 0.08515
850 92.9477 92.7841 0.08180
900 92.8138 92.6605 0.07667
950 92.6989 92.5022 0.09832
1000 92.2464 91.9188 0.16384
1050 90.5857 90.2509 0.16740
1100 86.7604 86.8953 0.06743
1150 65.2756 64.2022 0.53675
1200 65.0546 63.9511 0.55171
Table B.3: Standard deviation at selected temperatures during Hematite- 40%PCB Reduction
Temperature, ℃ Mass, % Mass of repeat, % Standard deviation
50 100.0000 100.0000 0.00000
100 100.0000 100.0000 0.00000
150 99.9110 99.8772 0.01688
200 99.5359 99.5566 0.01037
250 99.0829 99.1556 0.03636
300 97.8435 97.9353 0.04589
350 94.9916 95.5478 0.27811
400 94.4399 95.0467 0.30337
450 93.9287 94.5880 0.32965
500 93.3632 94.0788 0.35781
550 92.3609 93.1550 0.39706
600 91.0641 91.9460 0.44097
650 90.5402 91.4359 0.44784
700 90.2058 91.1345 0.46439
750 89.9500 90.8912 0.47058
800 89.6041 90.5802 0.48807
850 89.3555 90.3236 0.48403
900 89.1034 90.0821 0.48938
950 88.7376 89.7363 0.49935
1000 88.1275 89.1834 0.52794
1050 86.6867 87.6391 0.47619
1100 84.2183 85.2815 0.53162
1150 62.6020 63.6320 0.51501
1200 61.1036 62.3952 0.64581
Table B.4: Standard deviation at selected temperatures during Hematite- 80%PCB Reduction
Temperature, ℃ Mass, % Mass of repeat, % Standard deviation
50 100.0000 100.0000 0.00000
100 100.0000 100.0000 0.00000
150 99.8038 99.6225 0.09063
200 99.0554 98.8884 0.08350
Stellenbosch University https://scholar.sun.ac.za
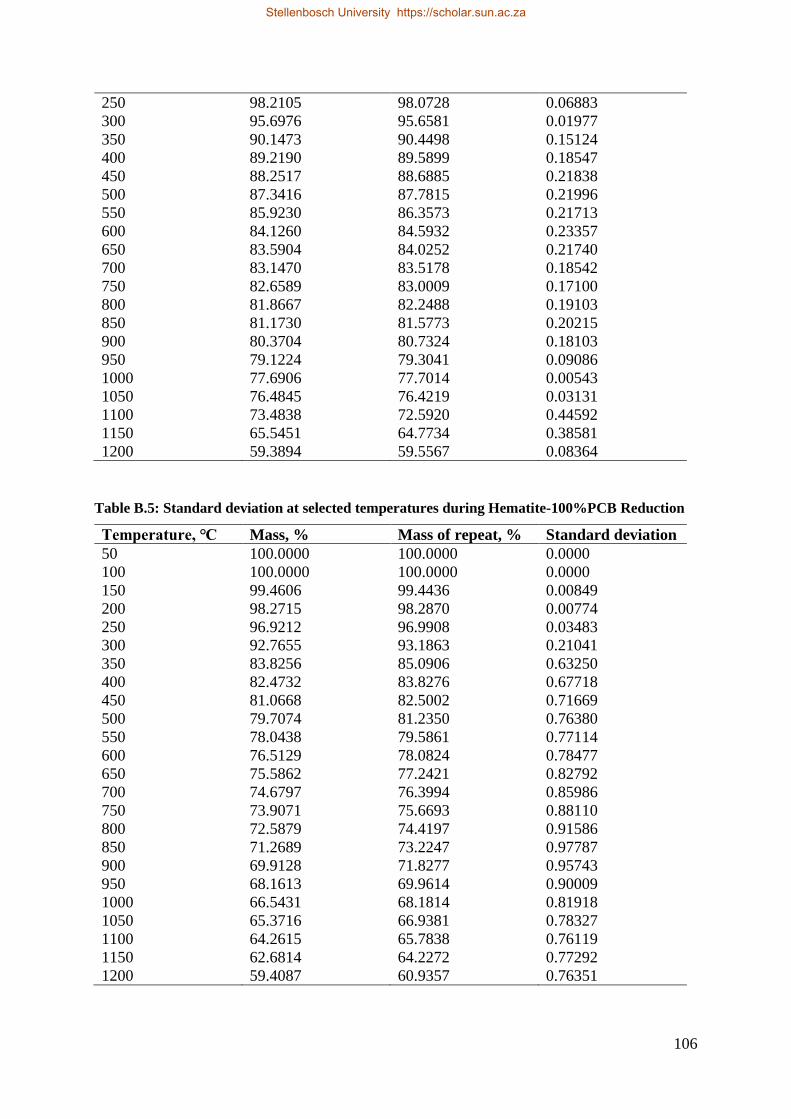
106
250 98.2105 98.0728 0.06883
300 95.6976 95.6581 0.01977
350 90.1473 90.4498 0.15124
400 89.2190 89.5899 0.18547
450 88.2517 88.6885 0.21838
500 87.3416 87.7815 0.21996
550 85.9230 86.3573 0.21713
600 84.1260 84.5932 0.23357
650 83.5904 84.0252 0.21740
700 83.1470 83.5178 0.18542
750 82.6589 83.0009 0.17100
800 81.8667 82.2488 0.19103
850 81.1730 81.5773 0.20215
900 80.3704 80.7324 0.18103
950 79.1224 79.3041 0.09086
1000 77.6906 77.7014 0.00543
1050 76.4845 76.4219 0.03131
1100 73.4838 72.5920 0.44592
1150 65.5451 64.7734 0.38581
1200 59.3894 59.5567 0.08364
Table B.5: Standard deviation at selected temperatures during Hematite-100%PCB Reduction
Temperature, ℃ Mass, % Mass of repeat, % Standard deviation
50 100.0000 100.0000 0.0000
100 100.0000 100.0000 0.0000
150 99.4606 99.4436 0.00849
200 98.2715 98.2870 0.00774
250 96.9212 96.9908 0.03483
300 92.7655 93.1863 0.21041
350 83.8256 85.0906 0.63250
400 82.4732 83.8276 0.67718
450 81.0668 82.5002 0.71669
500 79.7074 81.2350 0.76380
550 78.0438 79.5861 0.77114
600 76.5129 78.0824 0.78477
650 75.5862 77.2421 0.82792
700 74.6797 76.3994 0.85986
750 73.9071 75.6693 0.88110
800 72.5879 74.4197 0.91586
850 71.2689 73.2247 0.97787
900 69.9128 71.8277 0.95743
950 68.1613 69.9614 0.90009
1000 66.5431 68.1814 0.81918
1050 65.3716 66.9381 0.78327
1100 64.2615 65.7838 0.76119
1150 62.6814 64.2272 0.77292
1200 59.4087 60.9357 0.76351
Stellenbosch University https://scholar.sun.ac.za
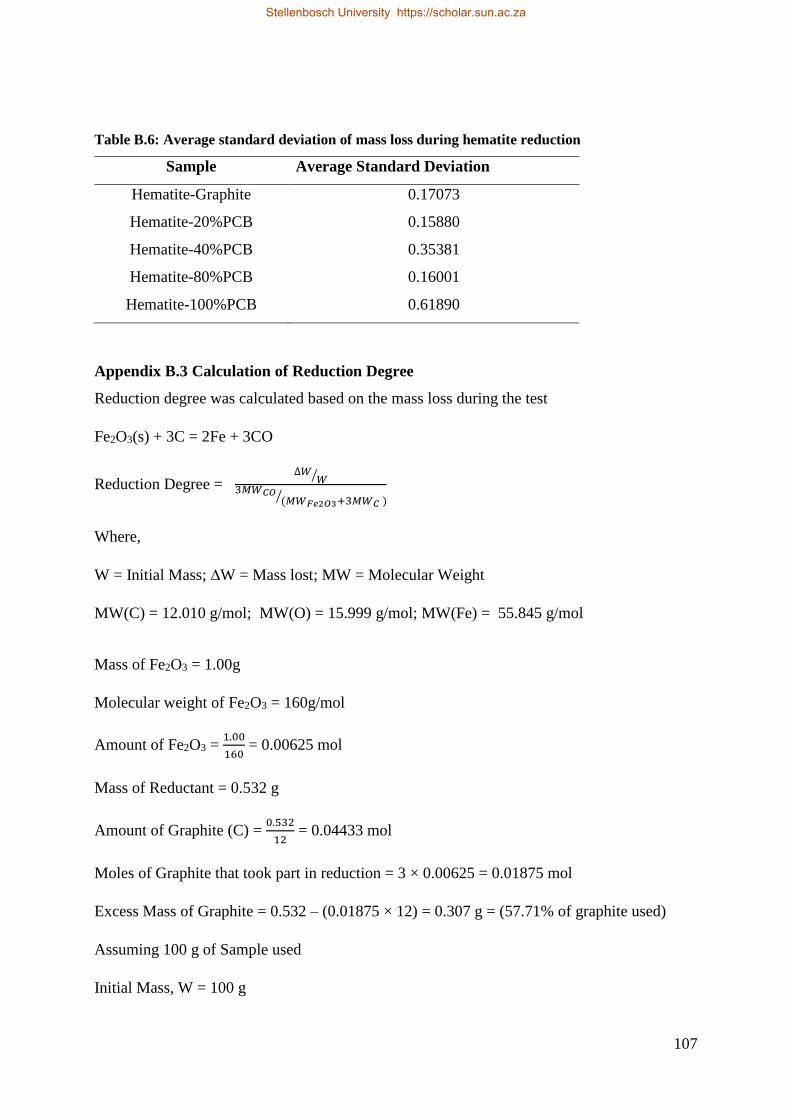
107
Table B.6: Average standard deviation of mass loss during hematite reduction
Sample Average Standard Deviation
Hematite-Graphite 0.17073
Hematite-20%PCB 0.15880
Hematite-40%PCB 0.35381
Hematite-80%PCB 0.16001
Hematite-100%PCB 0.61890
Appendix B.3 Calculation of Reduction Degree
Reduction degree was calculated based on the mass loss during the test
Fe2O3(s) + 3C = 2Fe + 3CO
Reduction Degree = ∆𝑊
𝑊⁄
3𝑀𝑊𝐶𝑂(𝑀𝑊𝐹𝑒2𝑂3+3𝑀𝑊𝐶 )⁄
Where,
W = Initial Mass; ∆W = Mass lost; MW = Molecular Weight
MW(C) = 12.010 g/mol; MW(O) = 15.999 g/mol; MW(Fe) = 55.845 g/mol
Mass of Fe2O3 = 1.00g
Molecular weight of Fe2O3 = 160g/mol
Amount of Fe2O3 = 1.00
160 = 0.00625 mol
Mass of Reductant = 0.532 g
Amount of Graphite (C) = 0.532
12 = 0.04433 mol
Moles of Graphite that took part in reduction = 3 × 0.00625 = 0.01875 mol
Excess Mass of Graphite = 0.532 – (0.01875 × 12) = 0.307 g = (57.71% of graphite used)
Assuming 100 g of Sample used
Initial Mass, W = 100 g
Stellenbosch University https://scholar.sun.ac.za
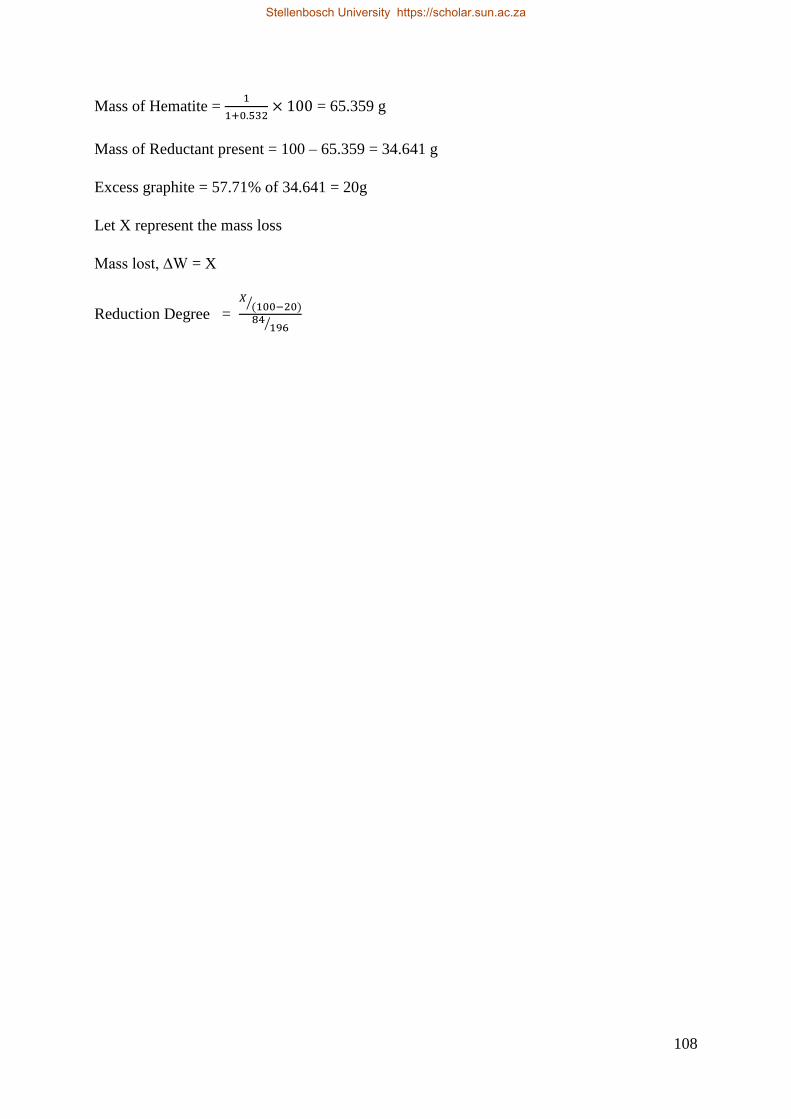
108
Mass of Hematite = 1
1+0.532× 100 = 65.359 g
Mass of Reductant present = 100 – 65.359 = 34.641 g
Excess graphite = 57.71% of 34.641 = 20g
Let X represent the mass loss
Mass lost, ∆W = X
Reduction Degree = 𝑋
(100−20)⁄
84196⁄
Stellenbosch University https://scholar.sun.ac.za

109
Appendix C. XRF full Scan of PCB
Instrument: XRF Axios (PANalytical)
Crystals used: LIF220, LIF 200, Ge, PE, PX1.
The following elements were detected: Tellurium, Antimony, Tin, Palladium, Molybdenum,
Zirconium, Strontium, Copper, Zinc, Tungsten, Nickel, Iron, Titanium, Barium, Calcium,
Potassium, Chlorine, Suplhur, Posphorus, Silicon, Tantalum, Aluminium, Magnesium
Detection of small quantity need to be measured as the resolution of the scan is not small
enough.
Figure C.1: XRF scan from angle 16 (2θ) to 110 (2θ), using LiF 220 crystal
Figure C.2: XRF scan from angle 56 (2θ) to 140 (2θ), using LiF 200 crystal
Figure C.3: XRF scan from angle 0 (2θ) to 160 (2θ), using Ge crystal
Stellenbosch University https://scholar.sun.ac.za
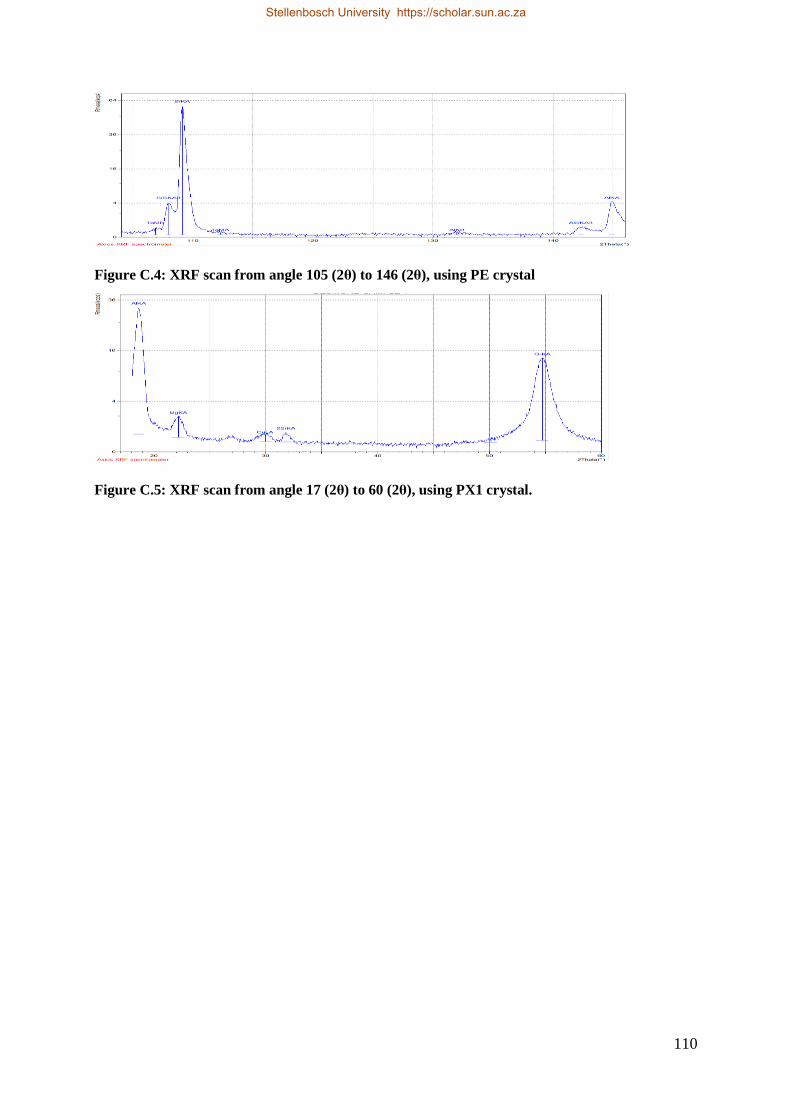
110
Figure C.4: XRF scan from angle 105 (2θ) to 146 (2θ), using PE crystal
Figure C.5: XRF scan from angle 17 (2θ) to 60 (2θ), using PX1 crystal.
Stellenbosch University https://scholar.sun.ac.za
111
Appendix D. XRD Patterns from products of hematite reduction in SPR
Figure D.1: XRD pattern from hematite-graphite reduction at 900℃
Figure D.2: XRD pattern from hematite-40%PCB reduction at 900℃
Figure D.3: XRD pattern from hematite-80%PCB reduction at 900℃
Position [°2θ] (Copper (Cu))
20 30 40 50 60 70 80 90
Counts
0
20000
40000
60000
SPR Hematite-graphite 30.04. 900C
04-008-4511
00-056-0160
01-089-0690
Position [°2θ] (Copper (Cu))
20 30 40 50 60 70 80 90
Counts
0
20000
40000
SPR Hematite-40PCB 02.05. 900C
01-089-0687
00-056-0160
Position [°2θ] (Copper (Cu))
20 30 40 50 60 70 80 90
Counts
0
10000
20000 SPR Hematite-80PCB 02.05. 900C
00-056-0160
01-089-0690
01-071-1400
Stellenbosch University https://scholar.sun.ac.za

112
Figure D.4: XRD pattern from hematite-100%PCB reduction at 900℃
Figure D.5: XRD pattern from hematite-graphite reduction at 1000℃
Figure D.6: XRD pattern from hematite-40%PCB reduction at 1000℃
Position [°2θ] (Copper (Cu))
20 30 40 50 60 70 80 90
Counts
0
5000
10000 SPR Hematite-100PCB 30.04. 900C
01-071-1400
04-014-0360
00-056-0160
04-008-7743
Position [°2θ] (Copper (Cu))
20 30 40 50 60 70 80 90
Counts
0
20000
40000
SPR Hematite-graphite 26.04. 1000C
00-056-0160
04-014-0360
Position [°2θ] (Copper (Cu))
20 30 40 50 60 70 80 90
Counts
0
20000
40000
60000
80000 SPR Hematite-40PCB 27.04. 1000C
00-056-0160
04-014-0360
01-089-0690
Stellenbosch University https://scholar.sun.ac.za

113
Figure D.7: XRD pattern from hematite-80%PCB reduction at 1000℃
Figure D.8: XRD pattern from hematite-100%PCB reduction at 1000℃
Table D.1: Reference codes representing each compound in XRD patterns
Reference Code Compound Name Chemical Formula
04-008-4511 Iron Oxide Fe3O4
00-056-0160 Graphite C
01-089-0690 Iron Oxide FeO
01-071-1400 Iron Silicate Fe2SiO4
04-008-7743 Silicon Oxide SiO2 01-071-1400 Iron Fe
Position [°2θ] (Copper (Cu))
20 30 40 50 60 70 80 90
Counts
0
5000
10000
15000 SPR Hematite-80PCB 27.04. 1000C
00-056-0160
04-014-0360
01-071-1400
Position [°2θ] (Copper (Cu))
20 30 40 50 60 70 80 90
Counts
0
2000
4000
6000
SPR Hematite-100PCB 26.04. 1000C
01-071-1400
04-014-0360
00-056-0160
Stellenbosch University https://scholar.sun.ac.za