investigating the effects of fluid intrusion on nomex ...ciec/proceedings_2017/ciec/ciec... ·...
TRANSCRIPT
Session CIEC 361
Proceedings of the 2017 Conference for Industry and Education Collaboration Copyright ©2017 American Society for Engineering Education
Investigating The Effects of Fluid Intrusion on Nomex® Honeycomb
Structures with Carbon Fiber Face Sheets
Garam Kim, Tyler Futch, Ronald Sterkenburg, Sadat Ahsan,
Gozdem Kilaz, Brian Kozak
Purdue University
Abstract
Honeycomb sandwich construction is often used in aircraft structures to make aircraft parts
with a good strength to weight ratio. Nomex® honeycomb core is used extensively for
flooring, skin panels, fairings, engine cowlings, and flight controls. Honeycomb core
structures are prone to fluid intrusion due to their thin face sheets which get damaged easily
by impact or erosion. The purpose of this research was to determine how the mechanical
properties of honeycomb core structures were affected if the honeycomb core was saturated
by a fluid such as water, fuel, hydraulic fluid or engine oil. Especially honeycomb core
structures located near the bilge areas of the aircraft or bottom of engine nacelles or
cowlings, where standing fluids are common will be prone to fluid intrusion. The test panels
were made of carbon fiber pre-preg (IM7 5774) face sheets bonded to a 0.5 inch Nomex®
core. Face sheets and core were bonded with a film adhesive. The test specimens were cut to
size from the cured panels. The test specimens were soaked in either water, fuel, hydraulic
fluid, or engine oil for 45 days. After the soak period the test specimens and the control
group were tested with a four-point loading test and impact test in accordance with ASTM
standards. The collected data was analyzed with an ANOVA and Bonferroni statistical
significance test.
literature review
Due to the wide range of applications of composite sandwich structures in the aerospace,
automobile, shipbuilding, construction, and rail transportation industries, there has been a
significant increase in their usage. Composite sandwich structures consist of multi-layered
materials that are made by bonding rigid, high strength skin facings to low density core
materials. The high strength and low weight ratios of the sandwich concept are the primary
advantages of using it in structural components, such as fuselage, wing flaps, and fairings.
Primary advantages of using bonded joint composite structures include: reduction of local
delamination because no holes are required, significant reduction in the weight of the joints,
the ability to assemble dissimilar materials, prevent galvanic corrosion of conductor metals,
and design a smooth external surface. Before the sandwich structure is to be used for
different applications, there is a great need to better understand their static and fatigue
behavior, as well as the various failure mechanisms under static and fatigue loading
conditions.[1]
Because of the location of composite structures in aerospace applications, they experience
multiple environmental conditions by which, through diffusion, they can absorb moisture,
Session CIEC 361
Proceedings of the 2017 Conference for Industry and Education Collaboration Copyright ©2017 American Society for Engineering Education
oil, aviation hydraulic fluid, anti-icing additive, or jet fuel. Diffusion occurs when there is
enough porosity, voids and vacancies within structures to allow the liquid to permeate the
face sheets or honeycomb. This absorption is largely permanent and can lead to chemical
and/or physical aging of the material, and can result in the part failing at loads lower than its
designed strength. In one study, a researcher used barrier films to reduce absorption of fluids,
and it considerably improved the mechanical properties of the sandwich structures.[2]
Sandwich structures are made of two face sheets and a core. The face sheets are co-cured to
the low density lightweight core. These sheets are manufactured from thin, high strength
materials. Face sheets are usually made of; carbon fiber, fiberglass, or aluminum and are
designed to withstand damage and high in plane stresses.[3] The structure gains it flexural
rigidity and strength in the transverse direction from the core. The core separates the two face
sheets and greatly increases the structure’s strength without a large increase in weight: one of
the primary advantages of composite sandwich structures. The core is generally made of
materials with lower stiffness and strength than the face sheet’s materials. Aluminum and
Nomex® honeycombs, synthetic PVC, aluminum foams, balsa wood, and corrugated
materials are examples of materials that can be used for the core.[3]
Because of the lack of knowledge of composite structures under complex dynamic loads, its
expansion to fields in which high reliability is demanded, such as aviation, has been
constrained. There are numerous challenges that must be met before composites sandwich
structures can be used in primary structures and before there can a widespread application of
it. Before this can be achieved, the sandwich structure needs to be assessed in order to verify
that any stresses experienced during the service life will not result in failure, or excessive
structural deformation before the damage is detected.[4]
The major failure mode of the structure is the de-bonding of the adhesive between the face
sheet and the core. A finite element analysis approach was utilized by Jen, Y. M., & Chang,
L. Y. to determine the local elastic modulus by taking account of the adhesive’s geometry
and dimensions. In order to properly evaluate the fatigue life of the studied sandwich
structures, several global and local parameters were utilized.[5] Jen and Chang utilized a
circular shaped local parameter in their experiment, this combined the peeling stress and the
shear stress of the adhesive on the de-bonding plane, which correlates with the fatigue life of
the sandwich beams with various core densities effectively. The analysis proved to be
accurate when compared to the de-bonding locations observed in fatigue tests. These are key
areas to examine during testing of composite sandwich structures.[5]
One of the biggest challenges in aircraft design is weight to strength ratio. It is critical to
retain a strong, stable structure that can withstand the various loads aircraft experience in
flight, and to ensure that it is still light enough to fly from point A to point B.[6] The face
sheets are mainly manufactured from fiber glass and carbon fiber reinforced prepregs with
epoxy resin matrices. The core material widely used in sandwich structures is Nomex®
honeycomb.[6] Composite sandwich structures have a wide range of applications on aircraft.
Many of their applications are on fairings, doors, radomes, leading edges, primary flight
controls, secondary flight controls, and non-structural part applications. The Airbus A340,
for example, has its entire vertical tail plane made of composite sandwich structures.[6] In
order for composite sandwich structures to be more widely used in commercial aviation,
many of the challenges with these structures will need to be addressed in the future.[6]
Problem statement
Usage of honeycomb materials in various industries is increasing. In the case of the
aerospace industry, lightweight and high strength aircraft structures are very important.
Therefore, honeycomb structures occupy a large portion of airplane. There are many types of

Session CIEC 361
Proceedings of the 2017 Conference for Industry and Education Collaboration Copyright ©2017 American Society for Engineering Education
fluids that come into contact with the aircraft such as moisture, fuel, hydraulic fluids, and oil.
Aircraft fluids can be a possible factor that causes defects affecting the strength of
honeycomb structures. This is especially true for the areas where liquids can be collected
such as at the bottom sides of engine cowlings where there is a higher chance to be exposed
to aviation liquids. Therefore, it is important to find out how various aircraft fluids affect the
mechanical properties of honeycomb structures that have been saturated.
Proposed methodology
To determine how aircraft fluids affect honeycomb structures two kinds of experiments were
prepared; four-point loading test and impact test.[7] The four-point loading test is used for
quasi-static analysis and it is utilized to investigate the flexural stiffness of the specimen. The
objective of a four-point loading test is to observe flexural stiffness of honeycomb core for
different groups and compare each other to determine how fluids affect the core of the
specimen.[8] The damage resistance test is used for dynamic analysis and it is conducted by
causing an impact to the specimen by dropping a weight from a specified height above the
specimen. The objective of this test is to compare the damage resistance properties of each
sample with the control group and to observe any negative effects.
Manufacturing
Sample manufacturing can be divided into 3 processes; manufacturing face sheets, bonding
face sheets to the core, and cutting specimen into appropriate size. The face sheets were
made out of carbon fiber prepreg (IM7 5442). They were cut into 10-inch x 14-inch plies
with a 0.03-inch thickness. Each face sheet was 4 plies thick and the orientation of the face
sheets were [-45/90/0/45]. Aluminum caul plates were placed on top of the face sheets to
insure that they would have a uniform flatness on both sides. The sheets were vacuum
bagged and cured with the appropriate cure cycle. Figure 1 illustrated the complete face sheet
of the honeycomb panel. After curing, the parts were trimmed to remove rough edges and
make them easier to handle. Nomex® honeycomb, 0.5-inch thick, was used as the core
material for the specimen. They were cut to 10-inch x 14-inches and prepared for bonding.
After the face sheets were made, they were bonded to the core on both sides with film
adhesive, HCS2404-050. The assembled honeycomb sandwich panel was vacuum bagged
and cured in an oven. Figure 2 showed the bagging process of the honeycomb panel. The
cured part was cut into correct specimen size. The dimensions of the 4-point loading test
sample were 8-inch x 3-inch. The dimensions of the impact test sample were 6-inch x 4 inch.
Samples were cut using a surface grinder fitted with a diamond coated saw blade. After the
specimens were cut, the edges were sanded lightly to create a smooth edge. The samples
were then lightly blown off by compressed air to remove any contaminants created during
cutting and sanding processes. The top and bottom surface of samples were wiped with clean
rag and acetone. Dimensions (Length, width and thickness) and weight were measured before
the samples were soaked into the fluids. Figure 3 showed the complete set of impact test
specimens

Session CIEC 361
Proceedings of the 2017 Conference for Industry and Education Collaboration Copyright ©2017 American Society for Engineering Education
Figure 1. Face sheet of the honeycomb panel
Figure 2. Honeycomb panel assembly process
Figure 3. Manufactured honeycomb panel specimen (impact test)
Soaking
All of the samples were soaked into a different kind of aircraft fluid. Four kinds of aircraft
fluids were prepared; distilled water, aircraft turbine engine oil, JET-A (Aircraft Jet Fuel) and
Skydrol (Hydraulic Fluid). The reason of choosing these four kinds of liquid was because
these fluids were used on aircraft and there was an opportunity that these fluid could come in
contact with the honeycomb structure of the aircraft. The specimens were soaked in glass
containers that were big enough to soak all the specimens that were prepared. Glass
containers were used to reduce any reaction between the fluid and container. Samples were
soaked all the way from the bottom to the top, so that there was no area of the specimens that
did not touch the fluid. After the samples were soaked into the fluid, containers were sealed

Session CIEC 361
Proceedings of the 2017 Conference for Industry and Education Collaboration Copyright ©2017 American Society for Engineering Education
to make sure any dust or moisture could not enter the containers. Samples were removed
from the containers after 45 days of soaking. The samples were dried before testing.
4 points loading test
A 4-point loading test was designed and performed based on ASTM C393/C393M-16. MTS
810 test machine was used for testing. Figure 4 depicted the 4-point loading test specimen
that was ready to be tested. Figure 5 showed the test machine (MTS 810) that was used for 4-
point loading test. ASTM standard fixture was prepared and installed appropriately on the
machine. Bottom span was 6 inches wide and top span was 3 inch wide. 1-inch diameter
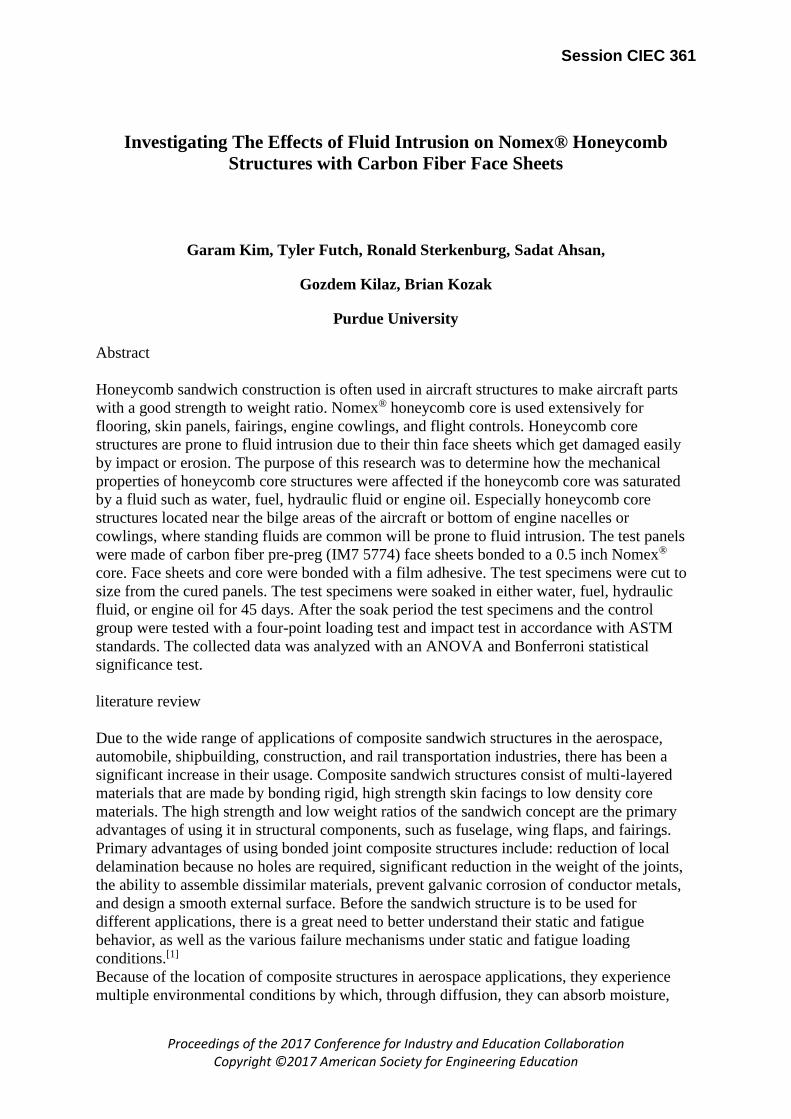
aluminum rods were placed on the top of the spans. The test speed was 6 mm/min. Figure 6
displayed 4-point loading test process with the specimen.
Figure 4. 4-point loading test specimen
Figure 5. 4-Point loading test machine
Session CIEC 361
Proceedings of the 2017 Conference for Industry and Education Collaboration Copyright ©2017 American Society for Engineering Education
Figure 6. 4-point loading test machine with specimen
Impact test
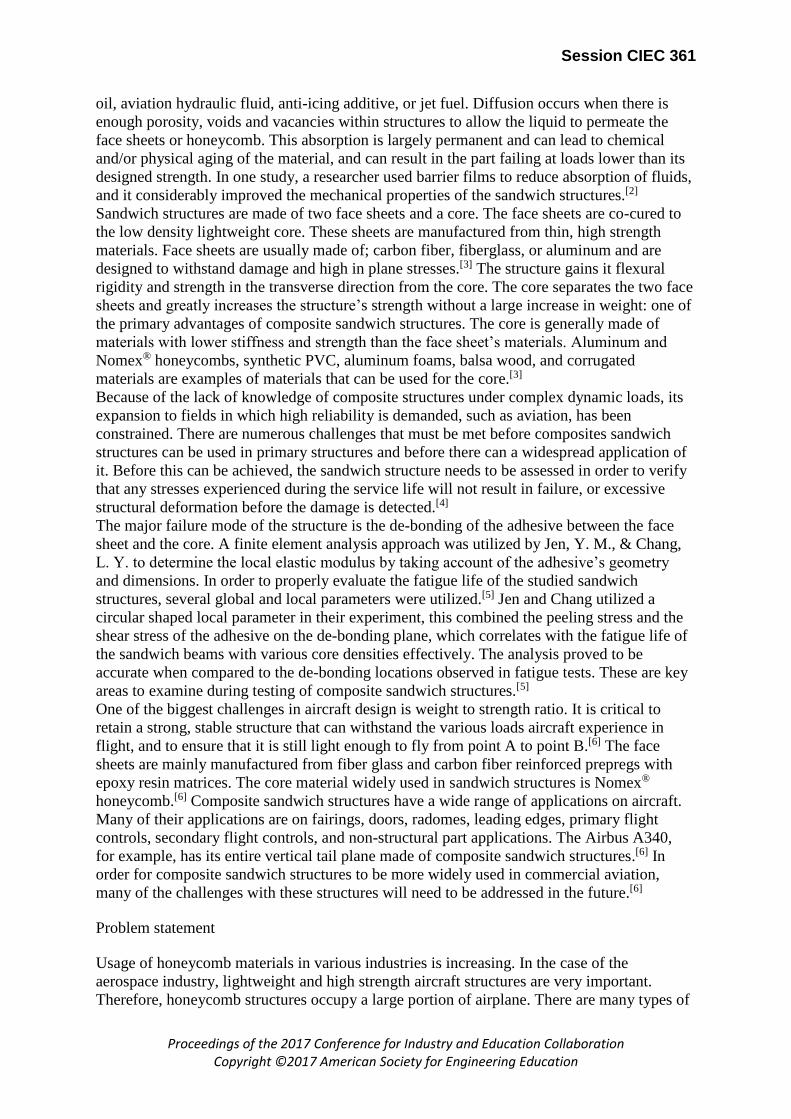
The impact test was designed and performed based on ASTM D7136/D7136M-15. Figure 7
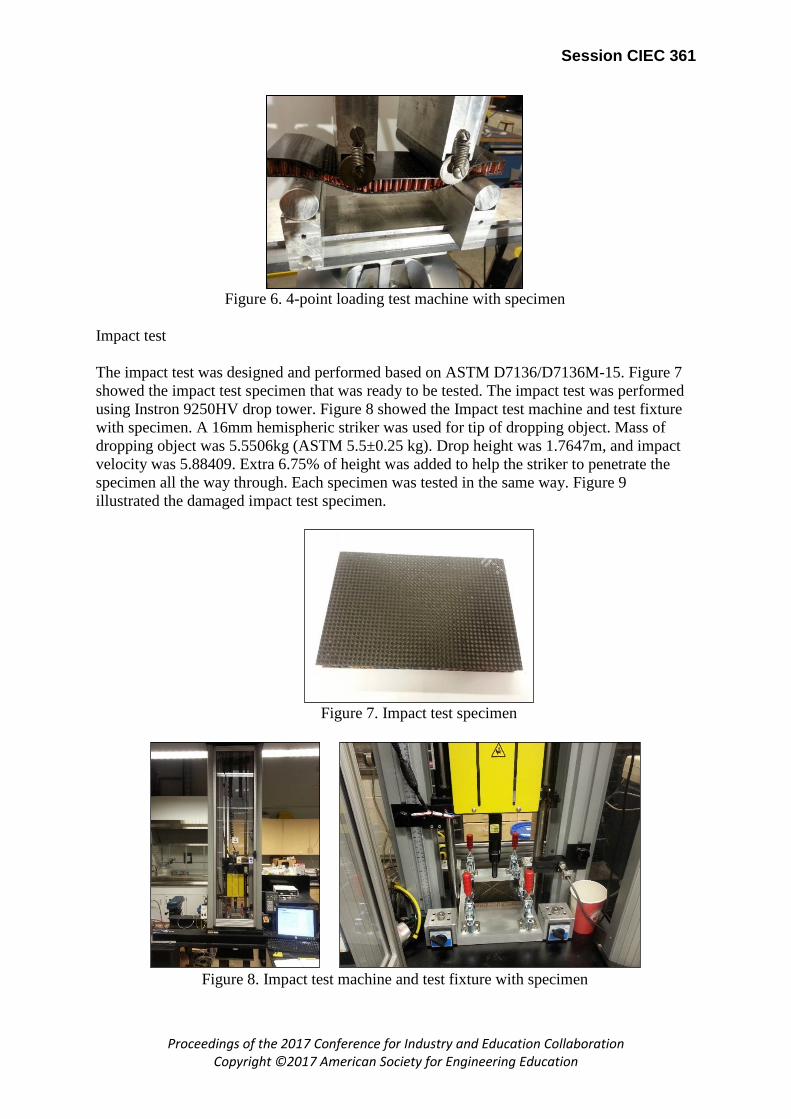
showed the impact test specimen that was ready to be tested. The impact test was performed
using Instron 9250HV drop tower. Figure 8 showed the Impact test machine and test fixture
with specimen. A 16mm hemispheric striker was used for tip of dropping object. Mass of
dropping object was 5.5506kg (ASTM 5.5±0.25 kg). Drop height was 1.7647m, and impact
velocity was 5.88409. Extra 6.75% of height was added to help the striker to penetrate the
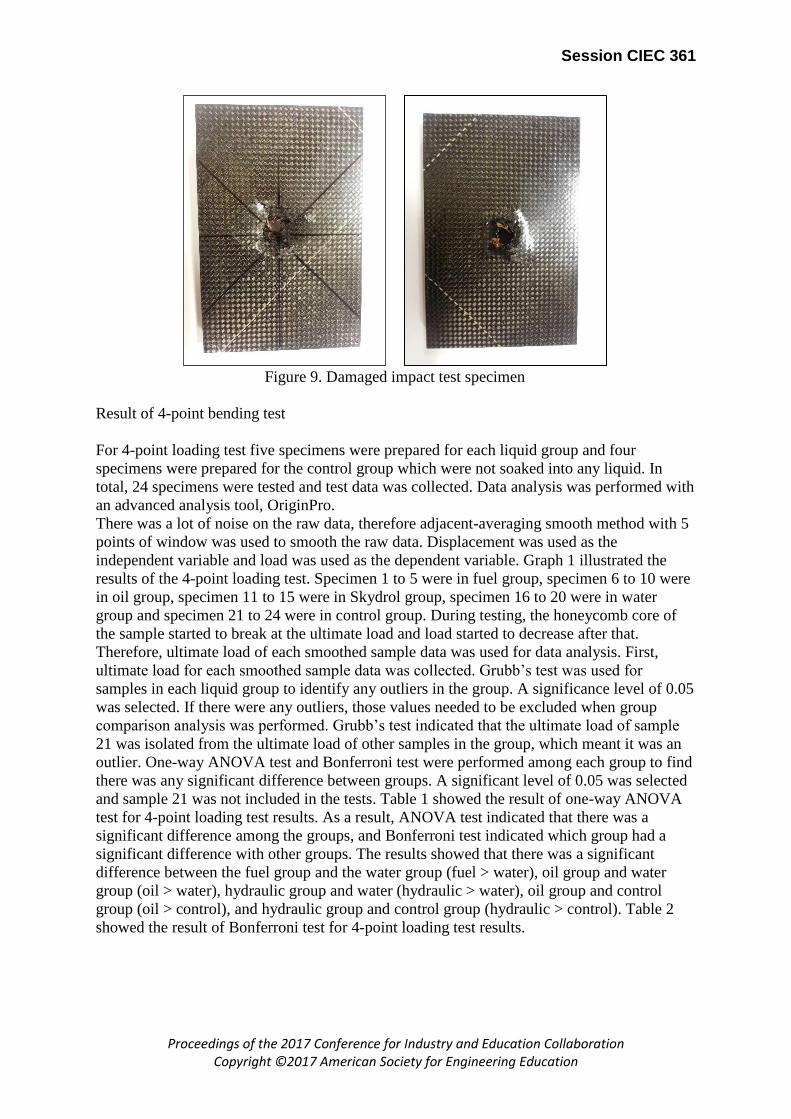
specimen all the way through. Each specimen was tested in the same way. Figure 9
illustrated the damaged impact test specimen.
Figure 7. Impact test specimen
Figure 8. Impact test machine and test fixture with specimen
Session CIEC 361
Proceedings of the 2017 Conference for Industry and Education Collaboration Copyright ©2017 American Society for Engineering Education
Figure 9. Damaged impact test specimen
Result of 4-point bending test
For 4-point loading test five specimens were prepared for each liquid group and four
specimens were prepared for the control group which were not soaked into any liquid. In
total, 24 specimens were tested and test data was collected. Data analysis was performed with
an advanced analysis tool, OriginPro.
There was a lot of noise on the raw data, therefore adjacent-averaging smooth method with 5
points of window was used to smooth the raw data. Displacement was used as the
independent variable and load was used as the dependent variable. Graph 1 illustrated the
results of the 4-point loading test. Specimen 1 to 5 were in fuel group, specimen 6 to 10 were
in oil group, specimen 11 to 15 were in Skydrol group, specimen 16 to 20 were in water
group and specimen 21 to 24 were in control group. During testing, the honeycomb core of
the sample started to break at the ultimate load and load started to decrease after that.
Therefore, ultimate load of each smoothed sample data was used for data analysis. First,
ultimate load for each smoothed sample data was collected. Grubb’s test was used for
samples in each liquid group to identify any outliers in the group. A significance level of 0.05
was selected. If there were any outliers, those values needed to be excluded when group
comparison analysis was performed. Grubb’s test indicated that the ultimate load of sample
21 was isolated from the ultimate load of other samples in the group, which meant it was an
outlier. One-way ANOVA test and Bonferroni test were performed among each group to find
there was any significant difference between groups. A significant level of 0.05 was selected
and sample 21 was not included in the tests. Table 1 showed the result of one-way ANOVA
test for 4-point loading test results. As a result, ANOVA test indicated that there was a
significant difference among the groups, and Bonferroni test indicated which group had a
significant difference with other groups. The results showed that there was a significant
difference between the fuel group and the water group (fuel > water), oil group and water
group (oil > water), hydraulic group and water (hydraulic > water), oil group and control
group (oil > control), and hydraulic group and control group (hydraulic > control). Table 2
showed the result of Bonferroni test for 4-point loading test results.

Session CIEC 361
Proceedings of the 2017 Conference for Industry and Education Collaboration Copyright ©2017 American Society for Engineering Education
Graph 1. 4-point loading test result of 24 specimens
Table 1. ANOVA test result for 4-point loading test results
Table 2. Bonferroni Test for 4-point loading test results

Session CIEC 361
Proceedings of the 2017 Conference for Industry and Education Collaboration Copyright ©2017 American Society for Engineering Education
Result of impact test
For impact testing, five specimens were prepared for each liquid group and four specimens of
the control group specimens. In total 24 specimens were tested and the data was collected. A
load vs. time graph was made for each specimen and Fast Fourier Transform smoothing
function with 20 points of window was used to smooth the graph and remove the noise.
Graph 2 illustrates the results of the impact test. Specimen 1 to 5 were in fuel group,
specimen 6 to 10 were in oil group, specimen 11 to 15 were in Skydrol group, specimen 16 to
20 were in water group and specimen 21 to 24 were in control group. Three different
methods were used for the drop test data analysis. The first method was to compare the
ultimate load of the sample when the tip of the striker met the top face sheet. As the striker
met the face sheet of the sample, load increased and reached ultimate load. If the honeycomb
core that supported the face sheet was affected by the fluid and the mechanical property
changed, the ultimate load changed as well. The ultimate load was collected from smoothed
graph of each specimen. Grubb’s test was performed to determine ultimate load in each
liquid group to find if there were any outliers in the groups. The test showed that there were
no outliers. The ANOVA test and Bonferroni test were performed to check for any
significant difference among the group. 0.05 was used for significant level, ɑ. Neither test
showed significant difference among the groups. Table 3 and table 4 showed the result of
each test.
Graph 2. Impact test result of 24 specimens

Session CIEC 361
Proceedings of the 2017 Conference for Industry and Education Collaboration Copyright ©2017 American Society for Engineering Education
Table 3. ANOVA test result for the ultimate load comparison
Table 4. Bonferroni test result for the ultimate load coparison
The second method used compared the max slope value in load vs. time graph when the top
of the striker hit the top of the face sheet. The slope of the graph indicated the stiffness of the
carbon fiber face sheet material and honeycomb core. OriginPro “Move Slope” function was
used to find the maximum slope of the load vs. time graph. After the slope value was
collected at each point, slope vs. time graph was generated and the maximum value of the
graph when the striker hit the face sheet was recorded. Grubb’s test was used to find any
outliers in the groups (ɑ=0.05). Specimen 2 and specimen 20 were indicated as outliers,
therefore, specimen 2 and specimen 20 were excluded for the ANOVA test and Bonferroni
test. The ANOVA test and Bonferroni test were used to check if there was any significant
difference among the groups (ɑ=0.05). The tests indicated that there was no significant
difference among the groups. Table 5 and table 6 showed the result of each test.
Table 5. Anova test result for the 1st slope comparison

Session CIEC 361
Proceedings of the 2017 Conference for Industry and Education Collaboration Copyright ©2017 American Society for Engineering Education
Table 6. Bonferroni test result for the 1st slope comparison
The third method used compared the slope of the graph when the tip of the striker met the
honeycomb core after it passes through the top face sheet. The slope of the graph indicated
the stiffness of the material and the stiffness of the honeycomb core was found by recording
the slope when the tip hit the core. The face sheet was stiffer than the honeycomb core,
therefore, the load started to decrease after the tip passed the face sheet. The slope of the
decreasing load was affected by the stiffness of the honeycomb core. The slope value of the
graph when the tip met the core showed how honeycomb core mechanical properties got
affected by the different types of liquids. The “Move Slope” function of OriginPro was used
for smoothed load vs. time graph. After the slope value was collected at each point, a slope
vs. time graph was generated and the minimum value of the graph when the striker hit the
honeycomb core was collected. Grubb’s test was used to find any outliers in the groups
(ɑ=0.05) and it indicated specimen 14 as the only outlier. Specimen 14 was excluded from
ANOVA test and Bonferroni test. The ANOVA test and Bonferroni test were performed to
find any significant difference among the groups (ɑ=0.05). The analysis showed that the
minimum slope of the Skydrol group was significantly lower than fuel group and oil group.
Table 7 and table 8 showed the result of each test.
Table 7. Anova test result for the 2nd slope comparison
Table 8. Bonferroni test result for the 2nd slope comparison
Session CIEC 361
Proceedings of the 2017 Conference for Industry and Education Collaboration Copyright ©2017 American Society for Engineering Education
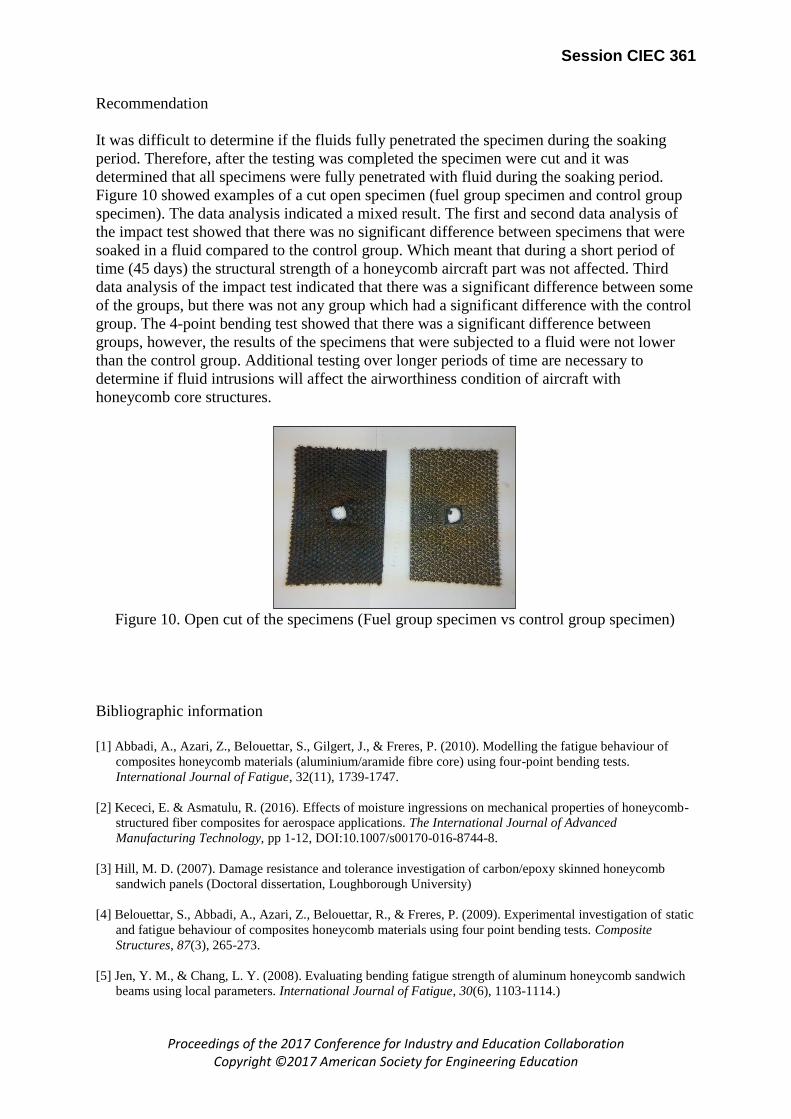
Recommendation
It was difficult to determine if the fluids fully penetrated the specimen during the soaking
period. Therefore, after the testing was completed the specimen were cut and it was
determined that all specimens were fully penetrated with fluid during the soaking period.
Figure 10 showed examples of a cut open specimen (fuel group specimen and control group
specimen). The data analysis indicated a mixed result. The first and second data analysis of
the impact test showed that there was no significant difference between specimens that were
soaked in a fluid compared to the control group. Which meant that during a short period of
time (45 days) the structural strength of a honeycomb aircraft part was not affected. Third
data analysis of the impact test indicated that there was a significant difference between some
of the groups, but there was not any group which had a significant difference with the control
group. The 4-point bending test showed that there was a significant difference between
groups, however, the results of the specimens that were subjected to a fluid were not lower
than the control group. Additional testing over longer periods of time are necessary to
determine if fluid intrusions will affect the airworthiness condition of aircraft with
honeycomb core structures.
Figure 10. Open cut of the specimens (Fuel group specimen vs control group specimen)
Bibliographic information
[1] Abbadi, A., Azari, Z., Belouettar, S., Gilgert, J., & Freres, P. (2010). Modelling the fatigue behaviour of
composites honeycomb materials (aluminium/aramide fibre core) using four-point bending tests.
International Journal of Fatigue, 32(11), 1739-1747.
[2] Kececi, E. & Asmatulu, R. (2016). Effects of moisture ingressions on mechanical properties of honeycomb-
structured fiber composites for aerospace applications. The International Journal of Advanced
Manufacturing Technology, pp 1-12, DOI:10.1007/s00170-016-8744-8.
[3] Hill, M. D. (2007). Damage resistance and tolerance investigation of carbon/epoxy skinned honeycomb
sandwich panels (Doctoral dissertation, Loughborough University)
[4] Belouettar, S., Abbadi, A., Azari, Z., Belouettar, R., & Freres, P. (2009). Experimental investigation of static
and fatigue behaviour of composites honeycomb materials using four point bending tests. Composite
Structures, 87(3), 265-273.
[5] Jen, Y. M., & Chang, L. Y. (2008). Evaluating bending fatigue strength of aluminum honeycomb sandwich
beams using local parameters. International Journal of Fatigue, 30(6), 1103-1114.)

Session CIEC 361
Proceedings of the 2017 Conference for Industry and Education Collaboration Copyright ©2017 American Society for Engineering Education
[6] Hermann, A. S., Zahlen, P. C., & Zuardy, I. (2005). Sandwich Structures 7: Advancing with Sandwich
Structures and Materials. In Sandwich Structures Technology in Commercial Aviation (pp. 13-26). Springer
Netherlands. Retrieved October 12, 2016, from http://link.springer.com/chapter/10.1007/1-4020-3848-8_2
[7] ASTM Standard D7250, 2016, “Standard Practice for Determining Sandwich Beam Flexural and Shear
Stiffness,” ASTM International, West Conshohocken, PA, 2016, DOI: 10.1520/D7250_D7250M-16,
www.astm.org.
[8] ASTM Standard D7766, 2016, “Standard Practice for Damage Resistance Testing of Sandwich
Constructions,” ASTM International, West Conshohocken, PA, 2016, DOI: 10.1520/D7766_D7766M-16,
www.astm.org.
Biographical information
Garam Kim is a graduate research assistant in the advanced composite laboratory of Purdue University.
Currently, he is completing his master program at the School of Aviation and Transportation Technology at
Purdue University. He is a certificated Airframe & Powerplant mechanic (A&P) and he has experience as an
aircraft maintenance technician in the Republic of Korea Air force. He is focusing on designing, manufacturing
and testing composite material parts for his study.
Tyler Futch is from the city of Phoenix, Arizona in the United States. After high school, Tyler received his
undergraduate degree from Purdue University majoring in Aeronautical Engineering Technology. While
managing the composites laboratory at the Purdue Airport, Tyler completed a master's degree with the
department of Aviation Technology. Presently, Tyler is working on a doctorate degree in technology at Purdue
University with a concentration in composite manufacturing.
Dr. Ronald Sterkenburg is a professor at the School of Aviation and Transportation Technology at Purdue
University. He is a certificated Airframe & Powerplant mechanic (A&P), holds an Inspector Authorization (IA)
and performs the duties as a Designated Mechanic Examiner. Dr. Sterkenburg's main research interests are in
advanced composite materials for aerospace vehicles. He has published many articles, book chapters and books
on all types of aviation maintenance topics.
Sadat Ahsan is an undergraduate research assistant in the department of Aviation Technology at Purdue
University. He is currently pursuing a Bachelor of Science degree in Aeronautical Engineering with a minor in
Product Lifecycle Management. He is teaching assistant for composite manufacturing courses.
Gozdem Kilaz is an assistant professor in the School of Engineering Technology, at Purdue University, with a
joint appointment in the Laboratory of Renewable Resources Engineering. Dr. Kilaz earned Bachelor’s,
Master’s, and Ph.D. degree in Chemical Engineering. Currently, Dr. Kilaz serves as the Chief Scientist of the
Air Transport Institute for Environmental Sustainability (AirTIES) center, in the Aviation Department of
Purdue University. She is teaching aviation fuels and materials.
Dr. Kozak is an Assistant Professor in the School of Aviation and Transportation Technology. He currently
teaches within the Aeronautical Engineering Technology (AET) and Unmanned Aerial Systems (UAS)
majors. Dr. Kozak holds Private Pilot Airplane Single Engine Land (ASEL), Airframe and Powerplant (A&P),
and Small Unmanned Aerial Systems Remote Pilot (sUAS) certificates from the FAA. He has strong personal
interests in aviation where he enjoys flying aircraft and building a composite airplane.