investigating the effect of advanced automatic transmissions on
TRANSCRIPT

INTRODUCTIONIncreasing powertrain efficiency is a primary path manufacturers have available for reducing fuel consumption (and thus GHG emissions). In general, increasing powertrain efficiency can be accomplished by increasing engine efficiency, increasing transmission efficiency, or altering transmission shift strategy so the engine operates nearer its peak efficiency more often.
Transmission technology is a significant portion of the potential reduction in fuel usage for advanced vehicles. Automatic transmission systems can be altered to
• Contain more gears with a wider gear ratio span, allowing the engine to operate closer to its peak efficiency more often.
• Upshift earlier, so the engine operates in a more efficient portion of its map when possible.
• Lock up the torque converter earlier, resulting in fewer losses in the torque converter.
• Reduce frictional and other energy losses in the transmission itself.
Previous studies have estimated a range of potential reduction in fuel usage. For example, Argonne National Labs (ANL) examined the potential reduction in fuel consumption when installing an advanced transmission in a midsized vehicle equipped with a four-cylinder spark ignited direct injection (SIDI) engine. [1] The study predicted a 6.9% improvement in fuel consumption when comparing a 96% efficient eight-speed automatic transmission with early torque converter (TC) lockup to a 92% efficient five-speed transmission without early TC lockup. For a port fuel injected (PFI) engine, the same transmission comparison yielded a 9.0% improvement in fuel consumption. [2]
Likewise, the National Research Council (NRC) investigated the potential effects of advanced transmissions on fuel economy in their 2015 report. [3] They examined the potential reduction in fuel
Investigating the Effect of Advanced Automatic Transmissions on Fuel Consumption Using Vehicle Testing and Modeling
Andrew Moskalik, Aaron Hula, Daniel Barba, and John KargulUS Environmental Protection Agency
ABSTRACTIn preparation for the midterm evaluation (MTE) of the 2022-2025 Light-Duty Greenhouse Gas (LD GHG) emissions standards, the Environmental Protection Agency (EPA) is refining and revalidating their Advanced Light-Duty Powertrain and Hybrid Analysis (ALPHA) tool using newly acquired data from model year 2013-2015 engines and vehicles. ALPHA is a physics-based, forward-looking, full vehicle computer simulation capable of analyzing various vehicle types with different powertrain technologies, showing realistic vehicle behavior, and auditing of all internal energy flows in the model.
As part of the validation of ALPHA, the EPA obtained model year 2014 Dodge Chargers equipped with 3.6 liter V6 engines and either a NAG1 five-speed automatic transmission or an 845RE eight-speed automatic transmission. Vehicles were tested on a chassis dynamometer; test results showed eight-speed vehicles averaging 6.5% reduction in unadjusted combined city-highway fuel consumption compared to five-speed vehicles. In addition, an 845RE eight-speed transmission was obtained and tested in a standalone transmission test rig. The measured transmission parameters were used in ALPHA to simulate the behavior and fuel consumption of the eight-speed Dodge Charger. A companion model for the five-speed Charger was also constructed; the resulting simulated fuel consumption for both vehicles closely matched the test results.
This paper uses the validated ALPHA model to predict the effectiveness improvement of real-world transmissions over a baseline circa 2008 four-speed transmission, and to predict further improvements possible from future eight-speed transmissions. To that end, transmission models for a four-speed automatic transmission and future eight-speed automatic transmissions were constructed, and ALPHA was used to predict the fuel consumption differences of a Dodge Charger equipped with these transmissions. A fuel consumption reduction of over 12% was predicted when comparing a future eight-speed transmission to a baseline four-speed. Predicted fuel consumption reduction was over 16% when the engines were resized to maintain a constant acceleration performance.
CITATION: Moskalik, A., Hula, A., Barba, D., and Kargul, J., "Investigating the Effect of Advanced Automatic Transmissions on Fuel Consumption Using Vehicle Testing and Modeling," SAE Int. J. Engines 9(3):2016, doi:10.4271/2016-01-1142.
2016-01-1142Published 04/05/2016
doi:10.4271/2016-01-1142saeeng.saejournals.org
Downloaded from SAE International by Andrew Moskalik, Friday, April 01, 2016

consumption for six- and eight-speed automatic transmissions with improved controls, early TC lockup, and a high efficiency gearbox. The NRC concluded that, compared to an unimproved four-speed transmission, the most likely potential reduction in fuel consumption ranged from 10.9% to 13.1%.
In the original analysis of LD GHG emissions standards, EPA created a lumped parameter model (LPM) to estimate the CO2 reduction (and thus fuel consumption) of various technologies. For a standard or large car containing a high-efficiency eight-speed transmission with early upshift and early TC lockup, the LPM predicts 17.8%-17.9% CO2 reduction over a base four-speed, when paired with a base PFI engine with no cam phasing. [4]
In preparation for the midterm evaluation (MTE) of the 2022-2025 Light-Duty Greenhouse Gas (LD GHG) emissions standards, the EPA performed a new examination of the potential for transmission technology to reduce GHG emissions (and fuel consumption), using a two-pronged approach. First, current vehicles were experimentally tested to determine the effect of advanced transmission technology. Then, the experimental data were used to computationally predict the effect of wider transmission changes.
For this paper, the computational tool used was EPA’s Advanced Light-Duty Powertrain and Hybrid Analysis (ALPHA) model. ALPHA is a physics-based, forward-looking, full vehicle computer simulation capable of analyzing various vehicle types with different powertrain technologies, showing realistic vehicle behavior. Powertrain components (such as engines or transmissions) are individually parameterized and can be exchanged within the model. ALPHA audits all internal energy flows through the powertrain model during simulation runs, and the energy audit is used both to monitor losses and to confirm an accurate energy-balanced simulation. Vehicle data were used to calibrate and validate this model. [5] Then, using the calibrated model, the potential effectiveness of a range of transmissions could be extrapolated.
Vehicle ChoiceThe MY 2014 Dodge Charger was chosen as a test vehicle. The 3.6 liter V6 Charger was offered with two different transmissions: a NAG1 five-speed transmission in the SE trim package or an optional 845RE eight-speed transmission in the SXT trim package. The powertrains of these vehicles were otherwise identical, with the same engines, rear end ratios, and tires. This unique offering presented an ideal case study to examine the effect of an improved transmission on vehicle fuel economy and operation. Vehicle and transmission specifications for the two Charger trim packages are given in Table 1.
There are some significant differences, noted in Table 1, between the vehicles with the five- and eight-speed transmission. The eight-speed has a much wider gear spread with a higher reported label fuel economy. In addition, performance testing of Chargers with the same powertrains (but from earlier model years) by Car and Driver showed the eight-speed had noticeably better acceleration performance than the five-speed, gaining 0.5 seconds in 0-60 time and 0.4 seconds over the quarter mile. [6] [7]
Table 1. Vehicle and transmission specifications (including gear ratios) and acceleration performance metrics for the five-speed and eight-speed Dodge Chargers trim packages. Acceleration times are from Car and Driver road tests. [6] [7]
TEST PROCEDUREFour vehicles were leased and tested for this project. All were MY 2014 Dodge Chargers with the same 3.6L engine, final drive ratio, and body style. Two vehicles had five-speed transmissions and the other two had eight-speed transmissions. The vehicle basics are shown in Table 2.
Table 2. The four test vehicles, including vehicle identification number (VIN). The tires and equivalent test weight (ETW) are identical for all vehicles.
Test Site and Vehicle PrepVehicle testing took place in the same chassis dynamometer test cell at the EPA’s National Vehicle and Fuel Emissions Laboratory (NVFEL). Testing occurred at various times over a one-year period from June of 2014 to July of 2015.
The vehicles were fueled with Tier 2 certification gasoline and put into rolls mode by the manufacturer to allow testing on the 2WD dynamometer while avoiding fault codes related to the front wheels remaining stationary. One vehicle (vehicle 3) arrived new, and was driven until there were 1000 miles on the odometer as a break in to ensure engine and transmission frictional performance had stabilized. The remaining vehicles were received with 16,000 to 25,000 miles on the odometer.
A road load derivation was performed on vehicle 1 (a five-speed vehicle) based on the target coefficients obtained from the manufacturer. The targets, and resulting set coefficients, are given in Table 3. Once this derivation was completed, all vehicles were tested with the same derived set coefficients, so that the dynamometer loading on all vehicle powertrains was identical.
Moskalik et al / SAE Int. J. Engines / Volume 9, Issue 3 (September 2016)
Downloaded from SAE International by Andrew Moskalik, Friday, April 01, 2016

Table 3. Road Loads: Target coefficients for vehicle 1 and set coefficients derived therefrom. The same set coefficients were used to load all vehicles.
Test Methodology (Cycle Testing)Multiple 4-bag FTP, HWFET, and US06 tests were recorded. The test procedures were performed according to the test cycle description, 40 CFR part 86 or 40 CFR part 1065. During each cycle, bag emissions and summary dynamometer data were taken, and used to determine cycle fuel economy.
In addition, data were obtained from the onboard vehicle CAN system during many, although not all, of the test cycles. CAN data were recorded at a 10 Hz frequency using the OBD port, a commercially available ValueCAN connector, and a laptop running “Krakspy,” a custom data-logging software developed by engineers at the EPA. The CAN data recorded included vehicle-reported engine speed, engine torque, vehicle speed, transmission gear, and other engine and transmission parameters which varied from vehicle to vehicle.
RESULTSAt least two sets of tests (FTP, HWFET, and US06 test cycles) were run on each vehicle. Two additional tests were run on vehicles 1 and 3, to make a total of six tests for the five-speed Chargers and six tests for the eight-speed Chargers. The unadjusted fuel economy results for the twelve test runs of the three test cycles are given in Table 4, along with the combined city/highway fuel economy, calculated using a weighted 55%/45% average of the FTP and HWFET.
Table 4. Fuel economy test results for four vehicles, including the FTP, HWFET, US06, and the 55/45 combined city/highway. The average fuel economy for each vehicle type (five-speed and eight-speed) is also given, as well as the differences between the average results.
Table 4 also shows the average results for the five- and eight-speed vehicles, and a comparison between them, both in increase in fuel economy and decrease in fuel consumption. The fuel consumption of
the eight-speed vehicle was lower by 5.9% over the FTP, 7.7% over the highway cycle, and 6.0% over the US06. Fuel consumption for the combined city and highway cycles was lower by 6.5%.
Engine Operation and EfficienciesInsight into the reasons for the decrease in fuel consumption in the eight-speed vehicle can be gained by estimating and comparing the average efficiency of the engine to that of the drivetrain over each of the cycles for each vehicle. To estimate efficiencies, the total cycle energy was calculated for each test run in three locations along the powertrain. The energy calculations were restricted to “positive engine power” points, where the engine was producing torque and the vehicle was moving (i.e., not at idle). The three energy quantities calculated were:
1. The fuel energy going into the engine over each cycle, which was calculated by using the total CO2 emissions data for the cycle, then subtracting the proportion of fuel used at idle (estimated from CAN manifold airflow data).
2. The engine shaft energy (going out of the engine and into the drivetrain) over each cycle, which was calculated by multiplying the engine speed and torque obtained from the vehicle CAN, then integrating over the cycle. Only positive engine power points were counted.
3. The vehicle energy going out of the drivetrain over each cycle, which was calculated by multiplying the vehicle speed and load obtained from the recorded dynamometer data, then integrating over the cycle. Only positive vehicle power was counted; negative power (braking energy) was ignored.
From these cycle energy values, the approximate engine efficiency and drivetrain efficiency were calculated for each cycle, with engine efficiency = (engine shaft energy)/(fuel energy) and drivetrain efficiency = (vehicle energy)/(engine shaft energy). Although the drivetrain efficiency reflects losses in the entire drivetrain from the torque converter through the drive tires, the difference in efficiency between the five-and eight-speed vehicles should be due only to the components that are different: the transmission and torque converter.
This methodology should produce reasonable approximations for engine and drivetrain efficiencies, although not necessarily exact values. In particular, the methodology relies on CAN signals, which, while useful, can have some limitations, as they lack resolution and calibration of dedicated sensors. In addition, CAN-reported torque may be less accurate than measured torque (although prior studies have shown that the information used by the ECM to estimate torque has a good correlation to actual measured engine torque [8]).
Thus, the engine shaft energy is likely approximate, as are the resulting efficiencies. However, since the data are from vehicles with the same engine and ECU, and the methodology is applied in the same fashion to all vehicles, the comparison of values between five-and eight-speed vehicles should result in a reasonable estimation of the relative change in efficiencies between vehicles.
Moskalik et al / SAE Int. J. Engines / Volume 9, Issue 3 (September 2016)
Downloaded from SAE International by Andrew Moskalik, Friday, April 01, 2016
In addition, all three quantities - fuel energy, engine shaft energy, and vehicle energy - were not available from all 36 test runs represented in Table 4 (six repeats of three cycles on two types of vehicles). The quantities were available for three repeats of the three cycles on both transmission versions; however, the final average fuel consumption data of the three repeat tests were slightly different than for the full suite of six repeat tests.
For the cycles where all signals were available, the engine and drivetrain efficiencies were calculated using the methodology above, and averaged for both five- and eight-speed vehicles. The average resulting efficiencies, as well as the differences between the five-speed and eight-speed results, are given in Table 5 for each test cycle. Because of the differences in data sets, there is a slight discrepancy between the total efficiency differences in Table 5 (which is based on three repeat tests) and the overall fuel consumption differences in Table 4 (which is based on six repeat tests).
Table 5. Engine and drivetrain efficiencies for each transmission over the FTP, HWFET, US06: Energy-weighted averages are of “positive engine power” points, where the engine was producing torque and the vehicle was not at idle.
In Table 5, the final column (% Difference) reflects the relative reduction in energy losses in the engine and the drivetrain. On the FTP, the engine and drivetrain (i.e., transmission) have approximately similar increases in efficiency, while on the HWFET the increase in engine efficiency makes up the bulk of the efficiency improvement. Over the US06, the drivetrain is responsible for a slightly larger proportion of the efficiency increase than the engine.
The efficiency values given are approximate, but should demonstrate proportionally where the increases in efficiency are realized. These values give an important insight into the causes of the decrease in fuel consumption in the eight-speed vehicle:
• An increase in the engine efficiency is likely due to changing operational points of the engine (due to the additional gears and/or earlier upshift strategy), resulting in more operation closer to peak engine efficiency points.
• An increase in drivetrain efficiency is likely due to an earlier lock up in the torque converter (resulting in fewer losses in the torque converter), and/or reduced frictional and other energy losses in the transmission itself.
The increase in engine efficiency is typically due to operation at lower speeds and higher torques (i.e., “downspeeding”), which is an area of the engine map that tends to be more efficient. To determine if this was indeed the case, the CAN-reported engine speed and torque were examined for each cycle for both the five-speed and eight-speed vehicles.
In general, high power operational points have high fuel consumption, and have a more significant effect on cycle fuel consumption than low-power points. Thus, to emphasize the higher fuel consumption points, the CAN-reported engine speed and torque points were energy-weighed. For all “positive engine power” points (where the engine was producing torque and the vehicle was not at idle), the energy-weighted engine speed and torque were then averaged; the average values for the three cycles are given in Table 6.
Table 6. Energy-weighted average engine operation points for each transmission over the FTP, HWFET, US06: Energy-weighted averages are of “positive engine power” points, where the engine was producing torque and the vehicle was not at idle
The data in Table 6 clearly show that the engine in eight-speed transmission vehicles indeed runs at a lower speed when compared with the five-speed transmission vehicles. Moreover, on the HWFET cycle, the change in the energy-weighted average values is fairly substantial, which is reflected by the large engine efficiency gain shown in Table 5.
STANDALONE TRANSMISSION TESTINGIn an effort to further understand the operation of the eight-speed transmission, a separate vehicle equipped with the 3.6 liter V6 and 845RE eight-speed transmission was procured, instrumented, and driven for 3000 miles as a break-in. During break-in, the transmission solenoid control signals were mapped and the main line pressures were recorded as a function of gear, speed, and load. After break-in, the transmission was removed and tested on a standalone transmission test stand.
Once in the test stand, the torque converter was locked to eliminate its associated losses. The transmission parameters were externally adjusted: the solenoids were manually controlled to choose the appropriate gear, the line pressure was externally regulated to match in-vehicle values, and the oil temperature was independently controlled. The TCM was not included in the controls in order to avoid any hard-coded operation range limitations.
For testing, zero-load spin losses were recorded at three oil temperatures (35 °C, 60 °C, and 100 °C) for all eight gears over a range of speeds. In addition, efficiency testing was performed in each gear over a range of input speeds and torques, and at the same three oil temperatures. Steady-state modes were taken at discrete speed and load points; in general these points were between 1000 and 4000 rpm input speed and up to 250 Nm input torque.
Moskalik et al / SAE Int. J. Engines / Volume 9, Issue 3 (September 2016)
Downloaded from SAE International by Andrew Moskalik, Friday, April 01, 2016
For each test point, line pressures were set according to the pressures measured during vehicle testing. Input and output speeds and loads were recorded, and used to determine the efficiency of the transmission at each point. The final data provided an efficiency map for the transmission as a function of speed, load, gear, and temperature.
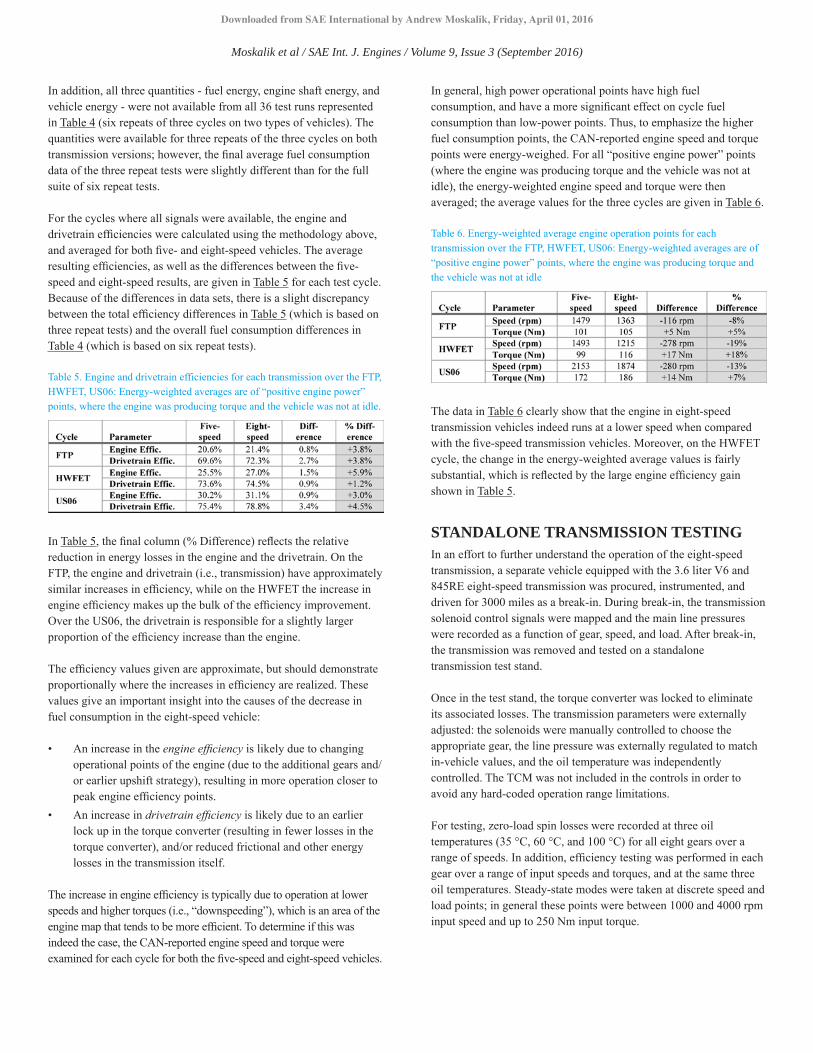
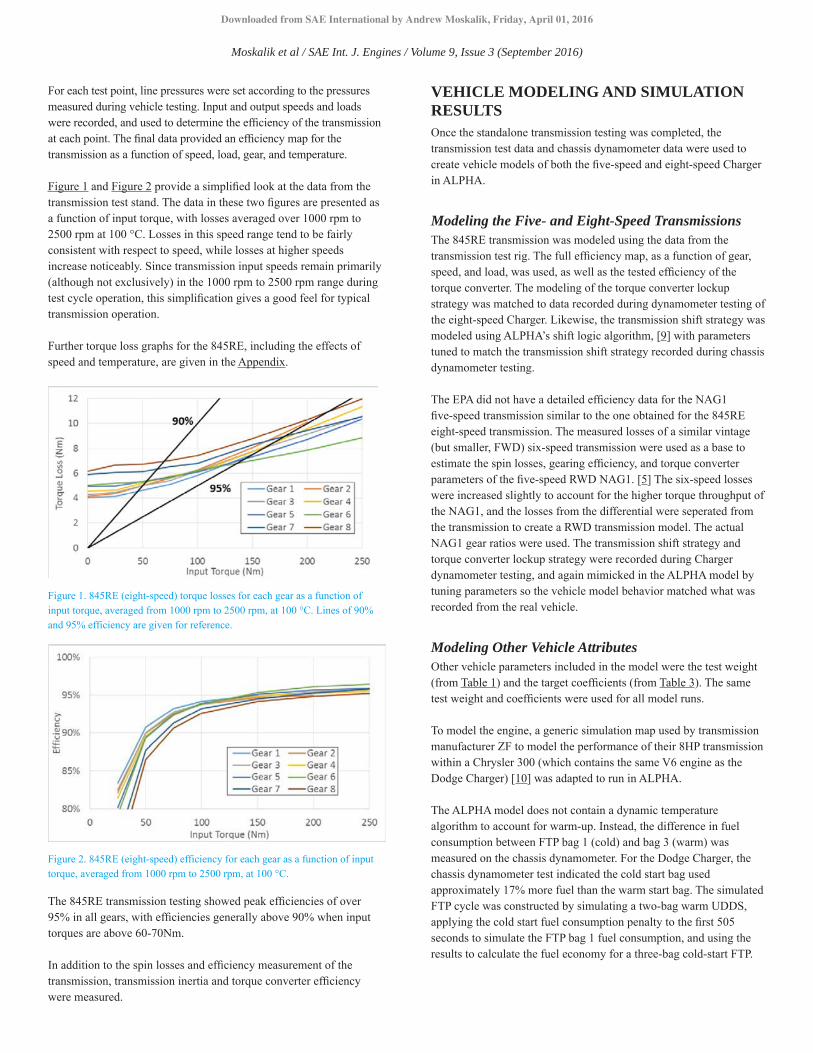
Figure 1 and Figure 2 provide a simplified look at the data from the transmission test stand. The data in these two figures are presented as a function of input torque, with losses averaged over 1000 rpm to 2500 rpm at 100 °C. Losses in this speed range tend to be fairly consistent with respect to speed, while losses at higher speeds increase noticeably. Since transmission input speeds remain primarily (although not exclusively) in the 1000 rpm to 2500 rpm range during test cycle operation, this simplification gives a good feel for typical transmission operation.
Further torque loss graphs for the 845RE, including the effects of speed and temperature, are given in the Appendix.
Figure 1. 845RE (eight-speed) torque losses for each gear as a function of input torque, averaged from 1000 rpm to 2500 rpm, at 100 °C. Lines of 90% and 95% efficiency are given for reference.
Figure 2. 845RE (eight-speed) efficiency for each gear as a function of input torque, averaged from 1000 rpm to 2500 rpm, at 100 °C.
The 845RE transmission testing showed peak efficiencies of over 95% in all gears, with efficiencies generally above 90% when input torques are above 60-70Nm.
In addition to the spin losses and efficiency measurement of the transmission, transmission inertia and torque converter efficiency were measured.
VEHICLE MODELING AND SIMULATION RESULTSOnce the standalone transmission testing was completed, the transmission test data and chassis dynamometer data were used to create vehicle models of both the five-speed and eight-speed Charger in ALPHA.
Modeling the Five- and Eight-Speed TransmissionsThe 845RE transmission was modeled using the data from the transmission test rig. The full efficiency map, as a function of gear, speed, and load, was used, as well as the tested efficiency of the torque converter. The modeling of the torque converter lockup strategy was matched to data recorded during dynamometer testing of the eight-speed Charger. Likewise, the transmission shift strategy was modeled using ALPHA’s shift logic algorithm, [9] with parameters tuned to match the transmission shift strategy recorded during chassis dynamometer testing.
The EPA did not have a detailed efficiency data for the NAG1 five-speed transmission similar to the one obtained for the 845RE eight-speed transmission. The measured losses of a similar vintage (but smaller, FWD) six-speed transmission were used as a base to estimate the spin losses, gearing efficiency, and torque converter parameters of the five-speed RWD NAG1. [5] The six-speed losses were increased slightly to account for the higher torque throughput of the NAG1, and the losses from the differential were seperated from the transmission to create a RWD transmission model. The actual NAG1 gear ratios were used. The transmission shift strategy and torque converter lockup strategy were recorded during Charger dynamometer testing, and again mimicked in the ALPHA model by tuning parameters so the vehicle model behavior matched what was recorded from the real vehicle.
Modeling Other Vehicle AttributesOther vehicle parameters included in the model were the test weight (from Table 1) and the target coefficients (from Table 3). The same test weight and coefficients were used for all model runs.
To model the engine, a generic simulation map used by transmission manufacturer ZF to model the performance of their 8HP transmission within a Chrysler 300 (which contains the same V6 engine as the Dodge Charger) [10] was adapted to run in ALPHA.
The ALPHA model does not contain a dynamic temperature algorithm to account for warm-up. Instead, the difference in fuel consumption between FTP bag 1 (cold) and bag 3 (warm) was measured on the chassis dynamometer. For the Dodge Charger, the chassis dynamometer test indicated the cold start bag used approximately 17% more fuel than the warm start bag. The simulated FTP cycle was constructed by simulating a two-bag warm UDDS, applying the cold start fuel consumption penalty to the first 505 seconds to simulate the FTP bag 1 fuel consumption, and using the results to calculate the fuel economy for a three-bag cold-start FTP.
Moskalik et al / SAE Int. J. Engines / Volume 9, Issue 3 (September 2016)
Downloaded from SAE International by Andrew Moskalik, Friday, April 01, 2016

Five- and Eight-Speed Fuel Economy and Consumption ResultsVehicle models for the five- and eight-speed Dodge Chargers were constructed and used in ALPHA to simulate fuel consumption and fuel economy over the FTP, HWFET, and US06 cycles. The cold start penalty discussed above was used to calculate the final number for the FTP. The calculated fuel economy numbers for each cycle are given in Table 7.
Table 7. ALPHA unadjusted fuel economy results for the FTP, HWFET, US06, and combined cycles, compared to the average unadjusted dynamometer results given in Table 4.
Table 7 shows that the ALPHA fuel economy / fuel consumption results match the test results within 6%, and within 1.5% for the combined unadjusted city/highway fuel economy. Moreover, for the city, highway, and combined cycles, the predicted reduction in fuel consumption of the eight-speed compared to the five-speed Charger was only roughly 1% different between the ALPHA model and the dynamometer data. The ALPHA model prediction of reduction in fuel consumption was consistently lower than that seen in the dynamometer test results, and thus the modeling was slightly conservative in estimating the effect of the more advanced higher speed transmission when compared to the dynamometer data.
Modeling the Effects of Other TransmissionsTo extend the understanding of the effects of transmission technology, transmission models were constructed for both “future,” more advanced transmissions, and a “past,” less advanced transmission.
The “past” transmission modelled was a four-speed transmission, with gear ratios which were extrapolated from the “real” five- and eight-speed transmission to provide a proportional gear ratio spread. Transmission efficiency was reduced slightly from the five-speed, and shift parameters used in ALPHA’s shift logic algorithm were substantially the same. The torque converter lockup strategy was modelled based on data obtained from a 2009 Toyota Camry equipped with a five-speed transmission. This vehicle was very similar to the 2007 Toyota Camry used as a baseline by Ricardo in their 2010 computer simulation of light-duty vehicle technologies [11] which in turn was used to inform the effectiveness numbers used in the lumped parameter model.
Two generations of “future” eight-speed transmissions were constructed based on information presented by transmission manufacturer ZF about real and potential improvements to their
8HP45 transmission (a clone of the 845RE). [12] The 845RE parameters used in modeling the “real” eight-speed Charger (called the “Gen 1” eight-speed in this paper) were modified to include the improvements outlined by ZF. A second generation eight-speed transmission model (the “Gen 2”), similar to the ZF 8HP50, was created by incorporating:
1. A wider gear spread 2. Reduced drag torque 3. Earlier torque converter lockup 4. Reduced creep torque
A third generation eight-speed transmission model (the “Gen 3”), based on potential improvements identified by ZF, was also constructed. This model improved transmission parameters even further by incorporating:
1. Wider yet gear spread 2. Reduced losses from the oil pump 3. Even earlier torque converter lockup
The shift parameters used in ALPHA’s shift logic algorithm were substantially the same among the three eight-speed transmissions.
ZF estimated fuel consumption benefits of the Gen 2 and Gen 3 transmissions over the Gen 1 transmission. [12] For the 8HP50 (Gen 2), they estimated approximately 1.8% fuel consumption reduction due to the wider spread and reduced drag torque, and a total fuel consumption reduction of about 3% compared to the 8HP45 (Gen 1) transmission. The estimated fuel consumption benefits for the Gen 3 were approximately an additional 1.4% from reduced oil pump losses and the wider gear ratio spread.
ZF did not specify at what speed early torque converter lockup could be achieved, so for this modeling study, another transmission was used as a guide: the Mazda Skyactiv six-speed automatic. Mazda has incorporated torque converter lockup as early as 5 mph in their six-speed Skyactiv transmissions. [13] To be conservative in the ALPHA simulation, the torque converter lockup was lowered in the Gen 2 and Gen 3 eight-speed transmissions by a single gear step in each case, so that lockup on the Gen 3 occurred at approximately 13 mph.
Fuel Economy and Consumption Results: All TransmissionsThese three transmission models were used in a Charger vehicle model in ALPHA to predict vehicle fuel economy over the same cycles the MY 2014 five- and eight-speed Chargers were run on. Other vehicle parameters, including the engine, rear end ratio, and road loads, were kept the same as the earlier simulation runs. The simulated fuel economies for the future eight-speed transmissions (Gen 2 and Gen 3) and the baseline four-speed transmission are given in Table 8, along with the simulation results for the real five-speed and eight-speed (Gen 1) transmissions. The percent reduction in fuel consumption for each change in transmission is given in Table 9.
Moskalik et al / SAE Int. J. Engines / Volume 9, Issue 3 (September 2016)
Downloaded from SAE International by Andrew Moskalik, Friday, April 01, 2016

Table 8. ALPHA results: Unadjusted fuel economy results for the FTP, HWFET, US06, and combined cycles for all five transmissions (“past” four-speed, “real” five-speed, “real” eight-speed Gen1, and “future” eight-speed Gen2 and Gen3).
Table 9. ALPHA results: percent reduction in fuel consumption for the FTP, HWFET, US06, and combined cycles, comparing transmissions.
The Gen 2 eight-speed transmission decreases the combined cycle fuel consumption by 2.2%. About 0.6% of this reduction in fuel consumption was due to the reduction in creep torque, leaving the remaining 1.6% due to earlier torque converter lockup, and a small amount of engine speed reduction. The Gen 3 decreases the combined cycle fuel consumption by an additional 1.5%. These results generally come close to, but fall slightly short of, the original reductions estimated by ZF, [12] of 3.0% for the Gen 2 and an additional 1.4% for the Gen 3. It is possible that a more intensive optimization of the shift algorithm would result in fuel consumption reductions closer to ZF’s predictions.
The four-speed transmission increased fuel consumption by 4.1% compared to the five-speed transmission. Approximately half of this increase was due to a decrease in engine efficiency, with the reduced number of gears causing the engine to operate farther from its most efficient point. The remainder of the increase was due to higher losses in the torque converter and transmission.
Overall, the Gen 3 eight-speed provided an 8.8% reduction in fuel usage when compared to the five-speed transmission, and 12.6% reduction in fuel usage when compared to the four-speed transmission.
“PERFORMANCE NEUTRAL” MODELING AND RESULTSThe Charger powertrains modelled in ALPHA in the previous section were identical among vehicles, other than the transmissions/torque converter portion of the model. Although that allows a direct comparison between vehicles having identical powertrain components, it results in a set of vehicles where both fuel consumption and acceleration performance vary. However, to objectively measure the total effectiveness of transmission technologies, a comparison where when vehicle acceleration performance remains equivalent is preferred. [14] Therefore, an
alternative “performance neutral” analysis was conducted to account for the variations in acceleration performance among vehicles with different transmissions.
Acceleration performance results: Test and modelingModeling of the acceleration performance was calibrated to test results. Rather than perform acceleration testing at the NVFEL, test results from earlier model year five-and eight-speed Chargers, tested by Car and Driver, were used. These tests demonstrated a difference in acceleration performance between the vehicles, with the eight-speed being generally faster. Four of these acceleration performance metrics (0 to 60 time, 30 to 50 time, 50 to 70 time, and ¼ mile time) for each vehicle are summarized in Table 10.
Table 10. Acceleration performance of the five-speed and eight-speed Chargers, both as measured by Car and Driver and as calculated by ALPHA.
These four acceleration performance metrics were summed to get an overall acceleration performance number for each vehicle. The total times measured by Car and Driver differ by 1.6 seconds, or approximately 5%.
ALPHA is primarily a fuel economy calculation tool, and has not been optimized to predict WOT acceleration and other performance metrics. However, ALPHA was used to estimate the same four acceleration performance metrics for the five- and eight-speed Chargers, and the resulting acceleration performance numbers were fairly similar to those measured by Car and Driver. Moreover, the difference between the summed acceleration performance numbers was 1.9 seconds (approximately 6%), which is somewhat more than, but reasonably close to, the difference measured by Car and Driver.
To judge the relative acceleration performance of all the modeled transmissions, the same four acceleration performance metrics were calculated for the remaining vehicle models with different transmissions. The results are given in Table 11 for all five vehicles.
Table 11. Acceleration performance of the modelled Charger with various transmissions (“past” four-speed, “real” five-speed, “real” eight-speed Gen1, and “future” eight-speed Gen2 and Gen3), as calculated by ALPHA.
Moskalik et al / SAE Int. J. Engines / Volume 9, Issue 3 (September 2016)
Downloaded from SAE International by Andrew Moskalik, Friday, April 01, 2016

In the summed acceleration performance metric, the four-speed vehicle was 0.6 seconds slower than the five-speed, and the Gen 3 eight-speed was 0.6 seconds faster than the Gen 1 eight-speed. The total difference between the four-speed and Gen 3 eight-speed was 3.2 seconds (approximately 10%).
“Performance Neutral” Fuel Economy and Consumption Results: Changing Rear End RatioTo compare vehicles with the same performance rather than the same components, two methodologies were attempted. The first, which has been employed previously, [2] was to alter the final drive ratio while keeping the other characteristics of the vehicle the same. To employ this strategy, the “real” five-speed transmission was used as a baseline for acceleration performance modeling. For each of the other four vehicles, the rear end ratio was altered until the sum of all four acceleration performance metrics totaled 31.7 seconds (the five-speed results), to within 0.05 seconds. The FTP and HWFET results were then re-run using the resized rear end.
Using this methodology, the four-speed transmission required a rear end ratio of 2.77 (compared to a stock 2.65) to improve its performance to match that of the five-speed. As expected, the fuel consumption on the combined cycle of the performance neutral four-speed was worse than the four-speed vehicle with the stock rear end, due to higher engine speeds. The difference in fuel consumption between the vehicle with the resized rear end ratio and the vehicle with the stock rear end ratio was 0.9%.
For the eight-speed transmissions, the fuel economy of a “performance neutral” vehicle was expected to improve when acceleration performance was tuned to match that of the five-speed. However, the predicted fuel economy was actually worse than that of a vehicle using the stock rear end ratio. For example, for the eight-speed Gen 3 vehicle, a “performance neutral” rear end ratio was 1.63, compared to 2.65 for the stock rear end. At this ratio, the HWFET fuel economy was slightly better, but the FTP fuel economy was noticeably worse, as the transmission stayed in the less efficient, lower gears for a longer period of time. The combined fuel economy using the 1.63 rear end ratio was 2.6% worse than the nonperformance neutral version of the same vehicle.
Rear end ratios between about 2.0 and 3.0 resulted in substantially similar fuel economy (less than 0.8% difference over the combined cycle). Within that range, the stock rear end ratio of 2.65 provided essentially the peak fuel economy for the eight-speed Gen 3 vehicle. Because altering the rear end ratio, while achieving performance neutrality, did not improve fuel economy, another methodology was tried.
“Performance Neutral” Fuel Economy and Consumption Results: Resizing the EngineAs an alternative, an engine resizing strategy was employed to retune the vehicle acceleration performance. The resizing strategy consisted of changing the engine volume while maintaining the same BMEP, thus changing the peak engine torque and associated engine power. In addition, the BSFC map was also adjusted so as not to overestimate
the efficiency gain from using a smaller engine. As engine size is reduced, the cylinder surface area to volume ratio increases, which increases the relative heat losses and decreases efficiency. An adjustment factor, drawn from proprietary studies performed by Ricardo, Inc., [11] was used to scale the BSFC maps, resulting in a small increase in BSFC (a decrease in efficiency) for engines with smaller volume.
The “real” five-speed was again used as a baseline for acceleration performance modeling. For each of the other four vehicles, the engine was resized until the sum of all four acceleration performance metrics totaled 31.7 seconds (the five-speed results), to within 0.05 seconds. The test weights for each run were maintained at the same base equivalent test weight (4250 pounds, from Table 2), with no attempt to account for the different weight of the resized engines. The FTP and HWFET were then re-run for each vehicle using the resized engine; the results are given in Tables 12 and 13.
Table 12. ALPHA results: Unadjusted fuel economy results for all five transmissions (“past” four-speed, “real” five-speed, “real” eight-speed Gen1, and “future” eight-speed Gen2 and Gen3), performance neutral with resized engine.
Table 13. ALPHA results: percent reduction in fuel consumption, comparing transmissions (“past” four-speed, “real” five-speed, “real” eight-speed Gen1, and “future” eight-speed Gen2 and Gen3), performance neutral with resized engine.
Tables 12 and 13 show a significant reduction in fuel consumption over the results with constant engine size (and variable acceleration performance) in Tables 8 and 9. This would be expected, as the downsized engines associated with the eight-speed transmissions operate at a higher average BMEP (and thus efficiency) than the base engine. With the engine resizing, the Gen 3 eight-speed transmission provided a 11.8% reduction in fuel consumption compared to the five-speed transmission, and 16.1% reduction in fuel usage when compared to a the four-speed. These results show an increase of around 3.5% when compared to the non-performance neutral vehicle results shown in Tables 8 and 9.
DISCUSSIONThe methodology used in this instance was to model a series of transmissions that embodied increasingly sophisticated levels of various technologies, rather than estimate the effect of each transmission technology separately.
Moskalik et al / SAE Int. J. Engines / Volume 9, Issue 3 (September 2016)
Downloaded from SAE International by Andrew Moskalik, Friday, April 01, 2016

Although the relative effects of each technology have been occasionally highlighted earlier in this paper, vehicle drivetrains are complex, and altering one portion of the drivetrain will potentially affect losses in other areas. For example, altering the torque converter lockup strategy changes required engine speed, which changes average engine efficiency and the optimal shift strategy, which also changes the average losses in the transmission as it spends different amounts of time in each gear.
Thus, the individual effects of transmission technologies are somewhat difficult to separate. However, in general the effects can be divided into improvements in engine efficiency (due to the change in number of gears and shift strategy) and improvements in transmission and torque converter efficiency (due to lockup strategy and reduction in transmission losses).
From the dynamometer testing, the engine efficiency increase on the combined cycle accounts for about a 4-5% reduction in fuel consumption between the five-speed and eight-speed Charger. From simulation results, the four-speed vehicle has slightly worse engine efficiency compared to the five-speed, resulting in an additional 2% increase in fuel consumption. The increase in engine efficiency in the eight-speed Gen 3 vehicle compared to the Gen 1 vehicle is negligible. The engine resizing technique to maintain performance neutrality also affects engine efficiency, reducing fuel consumption of the Gen 3 eight-speed by approximately 3.5% compared to the four-speed, so the overall effect of improvements in engine efficiency totals approximately 9.5%. The remainder of the total 16.1% fuel consumption reduction must then be attributed to improvements in transmission and torque converter efficiency.
In addition to the technologies in the transmission, the fuel consumption results from ALPHA are also a result of other vehicle assumptions. For example, this modeling study used a V6 PFI engine map, representing the engine used in the Charger. It is expected, and well-understood, that the fuel consumption reduction due to transmissions paired with more advanced engines, which have wider islands of high efficiency, would be less.
Comparison of Results to Other SourcesAnother important assumption, as noted previously in this paper, is the methodology of implementing performance neutrality. For the advanced eight-speed transmission, changing the rear end ratio had little or no effect on fuel consumption. When this effect is taken into account, comparing the fuel consumption results from this paper to the results from the earlier ANL study [2] yields a good correlation.
The ANL study used an altered rear end ratio to maintain performance. In that case, the study found a 9.0% reduction in fuel consumption of a PFI engine when comparing a 96% efficient eight-speed automatic transmission with early torque converter (TC) lockup to a 92% efficient five-speed transmission without early TC lockup. From Table 9 in this paper (recognizing that altering the rear end ratio has little effect on fuel consumption), an advanced eight-speed transmission would be expected to reduce fuel consumption by 8.8% when compared to a
current production five-speed. This is a particularly good correlation considering that the initial modeling assumptions, although similar between the two studies, were not identical.
Likewise, the NRC estimated a 10.9% to 13.1% improvement when comparing an advanced eight-speed to an unimproved four-speed transmission. [3] While the NRC’s assumptions on performance neutrality are not clear, they did cite the same ANL report, and thus likely assumed the same methodology. From Table 9 in this paper, an advanced eight-speed transmission would be expected to reduce fuel consumption by 12.6% when compared to a current production four-speed (again realizing that altering the rear end ratio to account for acceleration performance returns little fuel consumption benefit). This estimate aligns well with the range estimated by the NRC.
The EPA’s lumped parameter model estimates 17.8%-17.9% CO2 reduction (and thus fuel consumption reduction) when comparing an advanced eight-speed transmission with an unimproved four-speed in a standard or large car containing a base PFI engine with no cam phasing. [4] For an engine with cam phasing and some friction reduction, similar to the V6 PFI engine in the Dodge Charger, the estimated effect is 16.1%.
This compares well with the total effectiveness of an advanced transmission shown above in Table 13. For a performance-neutral vehicle with a downsized engine, the combined fuel consumption reduction for an advanced eight-speed transmission is 16.1%. As with the other comparisons, the correlation is quite good considering that the initial modeling assumption in the two studies, although similar, were not identical. A summary of all results, and comparisons between them, is shown in Table 14.
Table 14. Result comparison: the combined highway/city results from ALPHA compared to other cited sources from Argonne National Labs (ANL), the National Research Council (NRC), and EPA’s lumped parameter model (LPM).
SUMMARY/CONCLUSIONSThe EPA investigated the effects of advanced transmissions on fuel consumption in a large car containing a conventional V6 PFI engine. The reduction in fuel consumption was calculated based on chassis dynamometer tests of a five-speed and eight-speed Dodge Charger. Test results showed the eight-speed consumed 6.5% less fuel than the five-speed on the combined city/highway cycle.
Moskalik et al / SAE Int. J. Engines / Volume 9, Issue 3 (September 2016)
Downloaded from SAE International by Andrew Moskalik, Friday, April 01, 2016

The two vehicles were then modeled using ALPHA, with a reasonable match between the simulated results and dynamometer test results. The ALPHA model predicted a 5.4% reduction in fuel consumption when comparing the eight-speed to the five-speed on the combined city/highway cycle, also a good match. Three more transmissions were modeled: one “past” four-speed transmission, and two “future” eight-speed transmissions based on analysis from transmission manufacturer ZF.
The future eight-speed modeling predicted an additional 3.6% fuel consumption reduction, for a total of 8.8% compared to the five-speed transmission. In comparison, the unimproved four-speed transmission showed an increase of 4.3% fuel consumption over the actual five-speed.
Incorporating more advanced transmission technologies in a given vehicle also results in an acceleration performance increase. To account for the additional acceleration, performance-neutral versions of the Charger were modeled, using the five-speed transmission as a base. This resulted in total fuel consumption reductions of 11.8% when comparing the Gen 3 eight-speed to the five-speed, and 16.1% when comparing the Gen 3 eight-speed to the four-speed transmission.
This process of combining experimental test data and computational models is a good method for estimating the effectiveness of vehicle technology for reduction of fuel consumption. A range of scenarios can be explored using computational models, which have a basis in, and are calibrated with, experimental test results.
These modeling results likely underestimate the potential fuel economy benefit of advanced transmissions. In the ALPHA modeling study, several assumptions were made which tend to produce conservative results. Specifically,
• While the ALPHA model predictions matched chassis dynamometer results reasonably closely, the model under-predicted the fuel economy improvement of the eight-speed Charger by about 1%.
• The future eight-speed transmissions (Gen 2 and Gen 3) produced fuel consumption reductions close to, but short of, the estimates given by ZF, [12] possibly showing where the shift strategy could be further optimized.
• The modeled torque converter lockup strategy for the Gen 2 and Gen 3 eight-speed transmissions, although more aggressive than the Gen 1 transmission, locks up at higher vehicle speed than the Mazda SkyActiv six-speed.
• When engines were resized, the test weights for each run were maintained at the same base equivalent test weight (4250 pounds). No attempt was made to estimate the change in vehicle mass caused by resizing the engine, or the resulting effect on acceleration performance or fuel economy.
Some additional work on torque converter lockup and shift strategy could help inform how conservative the ALPHA predictions are.
In addition, this analysis includes only automatic transmissions with current, proven technology. Other transmission types (such as DCTs or CVTs) or other transmission- and drivetrain-related technologies that improve fuel economy (such as, for example, cold-start warm-up systems [15]) were not included. The results of this analysis are also a function of the engine technology in the Charger V6 PFI engine; repeating the same analysis with a different engine would likely produce different results.
REFERENCES1. Moawad, A. and Rousseau, A., "Impact of Transmission Technologies
on Fuel Efficiency to Support 2017-2025 CAFE Regulations," SAE Technical Paper 2014-01-1082, 2014, doi:10.4271/2014-01-1082.
2. Moawad, A., and Rousseau, A., “Impact of Transmission Technologies on Fuel Efficiency - Final Report,” Report No. DOT HS 811 667 (Argonne National Laboratory, August 2012), pp. 31, 83.
3. National Research Council, “Cost, Effectiveness and Deployment of Fuel Economy Technologies for Light-Duty Vehicles,” (National Academies Press, 2015), ISBN 978-0-309-37388-3, http://www.nap.edu/catalog/21744, p. 5-56.
4. EPA, “Lumped Parameter Model (LPM) for Light-Duty Vehicles, V. 2.12.,” http://www3.epa.gov/otaq/climate/lpm.htm, (2012), accessed October 2015.
5. Newman, K., Kargul, J., and Barba, D., "Benchmarking and Modeling of a Conventional Mid-Size Car Using ALPHA," SAE Technical Paper 2015-01-1140, 2015, doi:10.4271/2015-01-1140.
6. Gall, J., “2011 Dodge Charger V6,” http://www.caranddriver.com/reviews/2011-dodge-charger-v6-test-review, (July 2011), accessed October 2015.
7. Gall, J., “2012 Dodge Charger SXT V6,” http://www.caranddriver.com/reviews/2012-dodge-charger-sxt-v6-test-review (January 2012), accessed October 2015.
8. Corsetti, A., O'Connell, G., and Watkins, K., "In-Vehicle Engine Torque Model Validation," SAE Technical Paper 2002-01-1143, 2002, doi:10.4271/2002-01-1143.
9. Newman, K., Kargul, J., and Barba, D., "Development and Testing of an Automatic Transmission Shift Schedule Algorithm for Vehicle Simulation," SAE Int. J. Engines 8(3):1417-1427, 2015, doi:10.4271/2015-01-1142.
10. Dick, A., Greiner, J., Locher, A., and Jauch, F., "Optimization Potential for a State of the Art 8-Speed AT," SAE Int. J. Passeng. Cars - Mech. Syst. 6(2):899-907, 2013, doi:10.4271/2013-01-1272.
11. Ricardo, Inc., “Computer Simulation of Light-Duty Vehicle Technologies for Greenhouse Gas Emission Reduction in the 2020-2025 Timeframe,” Report EPA-420-R-11-020, (EPA, 2011), 36-38.
12. Greiner, J., Grumbach, M., Dick, A., and Sasse, C., "Advancement in NVH- and Fuel-Saving Transmission and Driveline Technologies," SAE Technical Paper 2015-01-1087, 2015, doi:10.4271/2015-01-1087.
13. Weissler, P., “2012 Mazda3 Skyactiv achieves 40 mpg without stop/start,” Automotive Engineering Magazine: October 2011. http://articles.sae.org/10335/.
14. National Research Council, “Assessment of Fuel Economy Technologies for Light-Duty Vehicles,” (National Academies Press, 2011), ISBN 978-0-309-15607-3, http://www.nap.edu/catalog/12924, pp. 25, 62.
15. Lee, B., Jung, D., Myers, J., Kang, J. et al., "Fuel Economy Improvement During Cold Start Using Recycled Exhaust Heat and Electrical Energy for Engine Oil and ATF Warm-Up," SAE Technical Paper 2014-01-0674, 2014, doi:10.4271/2014-01-0674.
CONTACT INFORMATIONAndrew Moskalik can be contacted [email protected]
ACKNOWLEDGMENTSThe authors would like to thank Logan Smith from SouthWest Research for his help in modelling the vehicles, and Karla Butters for her help in reviewing the manuscript.
Moskalik et al / SAE Int. J. Engines / Volume 9, Issue 3 (September 2016)
Downloaded from SAE International by Andrew Moskalik, Friday, April 01, 2016

DEFINITIONS/ABBREVIATIONSALPHA - Advanced Light-Duty Powertrain and Hybrid Analysis
ANL - Argonne National Lab
BMEP - Brake mean effective pressure
BSFC - Brake specific fuel consumption
CAN - Controller Area Network
ECM - Engine control module
EPA - Environmental Protection Agency
ETW - Equivalent Test Weight (used in chassis dynamometer testing)
FTP - Federal Test Procedure (the “city cycle”)
FWD - Front wheel drive
GHG - Greenhouse gas
HWFET - Highway Fuel Economy Test (the “highway cycle”)
LPM - Lumped Parameter Model
mpg - Miles per Gallon
MTE - Mid-Term Evaluation
NRC - National Research Council
NVFEL - National Vehicle and Fuel Emissions Laboratory
OBD - On-board diagnostics
PFI - Port fuel injected
RWD - Rear wheel drive
SIDI - Spark ignited direct injection
TC - Torque Converter
TCM - Transmission control module
UDDS - Urban Dynamometer Driving Cycle
US06 - Aggressive driving cycle
VIN - Vehicle Identification Number
WOT - Wide-open throttle
ZF - ZF Friedrichshafen AG, a transmission supplier
Moskalik et al / SAE Int. J. Engines / Volume 9, Issue 3 (September 2016)
Downloaded from SAE International by Andrew Moskalik, Friday, April 01, 2016

APPENDIX
845RE Torque Losses
These charts show the measured torque losses of the 845RE in each gear, at 100 °C and with line pressures reflecting those measured in the vehicle. Torque losses are given as a function of input torque (Nm) and input speed (rpm). Lines of 90% and 95% efficiency are given for reference.
Moskalik et al / SAE Int. J. Engines / Volume 9, Issue 3 (September 2016)
Downloaded from SAE International by Andrew Moskalik, Friday, April 01, 2016
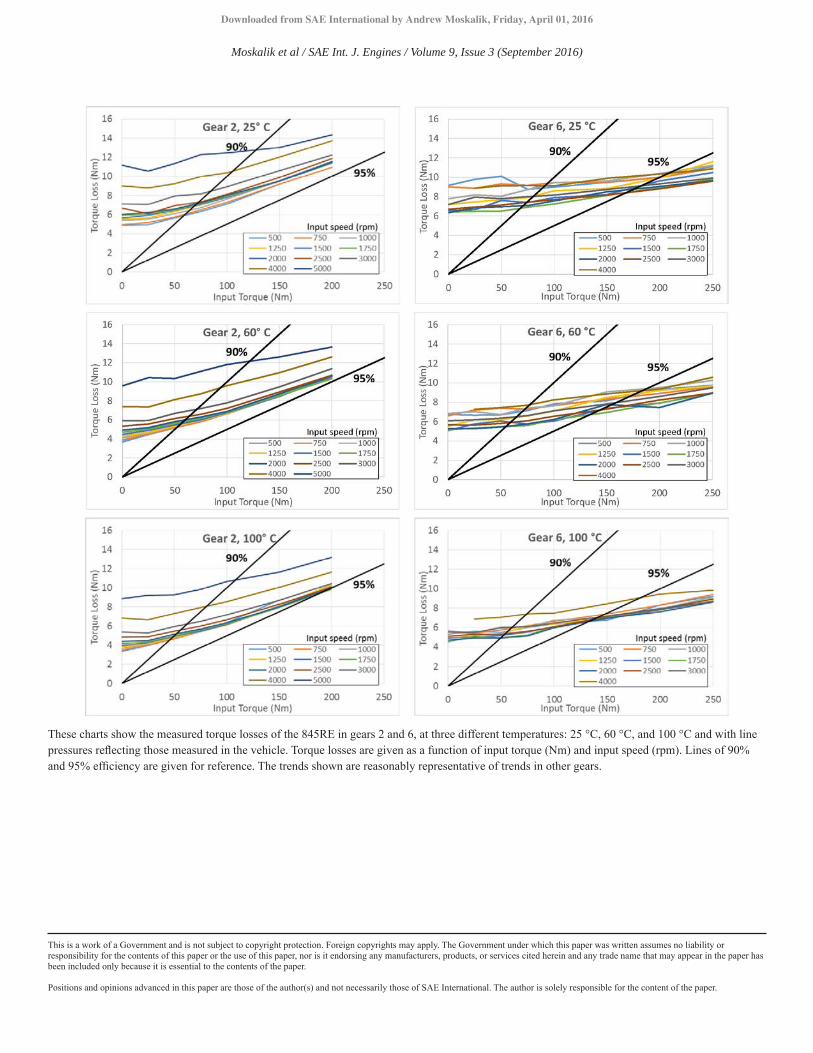
These charts show the measured torque losses of the 845RE in gears 2 and 6, at three different temperatures: 25 °C, 60 °C, and 100 °C and with line pressures reflecting those measured in the vehicle. Torque losses are given as a function of input torque (Nm) and input speed (rpm). Lines of 90% and 95% efficiency are given for reference. The trends shown are reasonably representative of trends in other gears.
This is a work of a Government and is not subject to copyright protection. Foreign copyrights may apply. The Government under which this paper was written assumes no liability or responsibility for the contents of this paper or the use of this paper, nor is it endorsing any manufacturers, products, or services cited herein and any trade name that may appear in the paper has been included only because it is essential to the contents of the paper.
Positions and opinions advanced in this paper are those of the author(s) and not necessarily those of SAE International. The author is solely responsible for the content of the paper.
Moskalik et al / SAE Int. J. Engines / Volume 9, Issue 3 (September 2016)
Downloaded from SAE International by Andrew Moskalik, Friday, April 01, 2016