investigating student satisfaction with online courses
TRANSCRIPT

DOI: 10.4018/IJICTE.20210701.oa2
International Journal of Information and Communication Technology EducationVolume 17 • Issue 3 • July-September 2021
This article, published as an Open Access article on April 23rd, 2021 in the gold Open Access journal, the International Journal of Informa-tion and Communication Technology Education (converted to gold Open Access January 1st, 2021), is distributed under the terms of the Creative Commons Attribution License (http://creativecommons.org/licenses/by/4.0/) which permits unrestricted use, distribution, and
production in any medium, provided the author of the original work and original publication source are properly credited.
12
Investigating Student Satisfaction With Online Courses:A Case Study of Uttarakhand Open UniversityJeetendra Pande and http, Uttarakhand Open University, India
Mythili G., Indira Gandhi National Open University, India
ABSTRACT
The educational system has moved towards digitization and online learning in the past two decades. The institutions are focusing on delivering online courses to facilitate the students. Uttarakhand Open University offered online courses to reach the unreached learners. High dropout rate from MOOCs is a global concern. Learners’ satisfaction survey is one of the important instruments to investigate the reasons of discontinuance from an online course. Detailed analysis of learners’ satisfaction survey will help the educators understand learners’ expectations from the course and they can work on these factors which leads to increasing the learners’ satisfaction with MOOCs and thereby address high-dropout rates from MOOCs. This paper investigates the students’ satisfaction of online courses on academic counselling, assignments, and examination marking process and various support services provided by the university. A structed questionnaire of 5-point Likert scale was administrated using Google form. The data (269 valid responses) have been analysed quantitatively by implying statistical measures. The findings show that academic counselling provided by the university to students are conceptual, clear, and knowledgeable. The students are comfortable on assignment, examination, and their result declarations. Along with this the online services, different initiatives and other support services provided by university are discussed in detail and suggested for further enhancements. Furthermore, it is also concluded that the study center structure is adequate, and personnel at study center are very helpful with students.
KEyWORdSAcademic Counseling, E-Learning, Online Assignment, Online Course, Student Satisfaction, Student Support Services
RATIONALE
Teaching and Learning has changed in the 21st century. The Open University established by United Kingdom in year and the first students enrolled in January 1971. At later periods other Traditional Universities have developed online distance courses across the world. Continuing the trend of open learning, the concept of Massive Open Online Courses (MOOCs) are a recent development which is grabbing the attention from academic as well as corporate world (Kumar & Kumar, 2020). Learning through the digital mode is gaining popularity day by day and professionals are preferring it to upgrade their skill and knowledge (Macleod, Sinclair, Haywood, & Woodgate, 2016). Universities are increasingly turning to online or blended formats to teach required courses. Although offering

International Journal of Information and Communication Technology EducationVolume 17 • Issue 3 • July-September 2021
13
university courses online provides a number of benefits both to students, who can take courses even from remote locations with the flexibility of studying according to their own schedules, and to universities, which can serve more students without having to physically house the courses (Ghaderizefreh & Hoover, 2018).
Due to huge demand on online learning opportunities, the private institutions are also offering online courses. Students’ world over in the coming years will be using the e - learning tools more than the printed textual material and India is not far behind.
E-learning can be seen as an innovative approach to the delivery of educational services through electronic forms of information that enhance knowledge, skills, and other outcomes of learners (Fazlollahtabar & Muhammadzadeh, 2012). Open Universities in the last more than 20 years have moved from print material to web-based courses for delivery of instruction. With the emergence of new technologies, the Universities have to move fast and keep the pace with the rest of the world.
Online Learning is mainly the transfer of skills and knowledge through computer. The content is delivered via Internet or audio/video or satellite or CDROM. Online education continues to expand at a rate faster than traditional campus-based programs (Cole, Shelley, & Swartz, 2014). One reason for increasing online course offerings is to accommodate more students without incurring significant costs of building new infrastructure (Seaman, Allen, & Seama, 2018).
Customer satisfaction is essential to the success of any business venture and online education is no exception (Wengrowicz, et al., 2018). Satisfaction refers to a range of feelings about a learner’s accomplishments and learning experiences (Bradford, 2011). Learner satisfaction reflects students’ perception of their learning experience (Kuo, Walker, Schroder, & Belland, 2014) (Littlejohn, Hood, Milligan, & Mustain, 2016) and is defined as a student’s overall positive assessment of his or her learning experience (Keller, 1983) (Rabin, Kalman, & Kalz, 2019).
Studies on e-learning also confirms that student satisfaction is very likely to lead to improved student loyalty (Kilburn, Kilburn, & Davis, 2016).
(Swart, Wengrowicz, & Wuensch, 2015) cited several studies that found strong correlations between student satisfaction, learning, and retention. According to (Donohue & Wong, 1997), satisfaction affects the student’s level of motivation. There exist enormous opportunities of research in the area focusing on the factors that affects a learners’ satisfaction to continue the MOOCs. Need arises to study these factors because non-fulfillment of these factors ultimately leads to discontinuance or dropouts (Kumar & Kumar, 2020).
The student satisfaction study conducted at IGNOU by (Parhar, Mythili, & Unnikrishnan, 2010) stated that overall satisfaction of students was concerned of improving upon the quality of programme materials, provision of supplementary learning materials, good counselors, better co-ordination with study centers etc. on the part of University was required for improving upon the satisfaction level of students. (Arbaugh, 2000) argued that learners’ interactions with others in online courses increase their satisfaction with these courses.
Another study shows that “the participants of the online program were satisfied with the information on the website, regular interaction between the teacher and participants, interaction among the participants, e-content available on online portal, support material including video and PowerPoint presentations and content of the response/feedback received from the teacher” (Mythili, 2017).
Clear understanding of the nature of interaction in distance education and how to facilitate interaction through interactive telecommunication is essential (Moore & Kearsley, 2011). Because MOOCs are a new educational innovation, there is limited quantitative research that addresses learner experience and satisfaction with MOOCs (Gameel, 2017).
The feedback study needs to conduct frequently to find the satisfaction level from students on various components such as study material, academic counselling, learner support services, providing information through website, etc. which help to improve the quality of programme. This study focuses on Students’ Satisfaction with Online Courses of Uttarakhand Open University.
Keeping above views, the research questions for this study was framed as follows:

International Journal of Information and Communication Technology EducationVolume 17 • Issue 3 • July-September 2021
14
Research Questions
1. How the students satisfied with learning material, counselling, assessment & evaluation and support services of university?
2. How to predict the components (learning material, counselling, assessment &evaluation and support services) statistically significant?
To answer the research questions the objectives were framed. The objectives of this study are to:
• find the Students’ accessible preferences of University Information• explore the students’ satisfaction on learning materials and their supplementary media tools.• study the students’ satisfaction on Assignments, Examination and various services provided by
the university.
METHOdOLOGy
The tools and techniques used in the present baseline is based on a questionnaire for students (5-point scale). The data was gathered through Google online form and 269 valid responses were accepted for the analysis. The data have been analysed quantitatively by implying statistical measures. The frequency measures were used to present the demographic as well as other data along with mean, range and standard deviation wherever needed. The analysis was done in SPSS. The tables and figures are presented for visual presentation of data wherever appropriate. The Data analysis and interpretation is presented further in details.
Brief demographic Profile of the RespondentsThe data based on student’s locality results reveals that out of total 269 respondents, 136(50.60%) are from urban area, 127(47.20%) are from rural area and 6(2.20%)respondents did not respond to this question. Furthermore, maximum percentage of students in the university were recorded from urban area as compare to rural.
The gender analysis shows that out of total 269 respondents, 99(36.80%) are female, 168(62.45%) are male and 2(0.74%) did not mentioned their gender. Furthermore, maximum percentage of students in the university were recorded male as compare to female.
description of data Based on Student’s Program LevelTable 1 shows description of collected data based on student’s program level. The data reveal that respondents are enrolled in university in four different categories namely certificate, diploma/PG diploma, post graduate and under graduate. From total 269 respondents 30(11.15%) are enrolled in certificate, 33(12.26%) are in diploma/PG diploma, 104(38.66%) are in post graduate and 101(37.54%) are in undergraduate level. While 1(0.37%) did not mentioned program level. Data reveals that, maximum number and percentages of respondents were recorded in post graduate while minimum were in certificate course. Moreover, for simplification and enhanced understanding presents the observed output based on student’s program level.
Access to University InformationTable 2 presents description of respondent responses to question that from where you access university information. Data show that, 26(9.66%) respondent’s access university information through mobile app, 44(166.35%) through prospectus. 152(56.50%) through website and 47(17.47%) use other sources. This show that, maximum number and percentages of student’s access university information by using website while minimum were recorded through mobile app.

International Journal of Information and Communication Technology EducationVolume 17 • Issue 3 • July-September 2021
15
EXPLORATORy ANALySIS
In this section respondents’ responses were explored regarding learning material and induction program, counselling, examination and assignment and online services. The respondents’ responses were recorded using five-point Likert scale from strongly disagree = 1, disagree = 2, average = 3, agree = 4 and strongly agree = 5. Basic description of respondent responses was explored using histogram and exploratory analysis were carried out using descriptive statistics in the sub-sections below based on following rules.
• A mean value less than 3 show that on the average respondents are strongly disagree and disagree with the given statement
• A mean value equal to 3 show that on the average respondents are average/neither agree, nor disagree with the given statement
• A mean value greater than 3 show that on the average respondents are strongly agree and agree with the given statement
Respondent’s Responses Regarding Learning Material and Induction ProgramTable 3 shows descriptive statistics of respondents’ responses about learning material and induction program conducted at study center. The descriptive statistics includes number of observations, minimum, maximum, mean value and standard deviation. The mean and standard deviation for clearly stated concepts in learning material were recorded (Mean = 4.1561 and S.D = 0.91717). The mean value is more than 3 which indicates that, maximum number of respondents are agreed and strongly agreed with the statement that in learning material concepts are clearly stated. The average value of respondent responses about on time receiving printed material were also recorded positive as (Mean = 3.5502 and S.D = 1.12398) the mean value is more than 3 indicating that maximum respondents are agreed and strongly agreed with the statement. Similarly, the mean value of respondent’s responses
Table 1. Frequency and percentage distribution based on program level
Categories Frequency Percentage
Certificate 30 11.15
Diploma/PG Diploma 33 12.26
Post Graduate 104 38.66
Under Graduate 101 37.54
(blank) 1 0.37
Grand Total 269 100.00
Table 2. Frequency and percentage distribution based on access university information
Categories Frequency Percentage
Mobile App 26 9.66
Prospectus 44 16.35
Website 152 56.50
Others 47 17.47
Total 269 100

International Journal of Information and Communication Technology EducationVolume 17 • Issue 3 • July-September 2021
16
about supplementary learning material were noted (Mean = 3.9033 and S.D = 1.08842) greater than 3 illustrates that maximum respondents’ responses are positive with the statement. This indicates more respondents are agreed and strongly agreed that, supplementary learning material are available. The mean value of responses for the easily availability of study material in digital form is recorded (Mean = 4.0074 and S.D = 1.07548) which show positive responses of respondents. As the mean value is greater than 3 suggests that, a greater number of respondents are agreed and strongly agreed that, study material is easily available in digital form. The same result were noticed for induction program at study center as the recorded mean value (Mean = 3.6840 and S.D = 1.08954) is greater than 3 illustrates that, respondent are positive. Furthermore, highest mean is noted for clearly stated concepts in learning materials followed by easily availability of materials in digital form, availability of supplementary learning material, usefulness of induction program, and printed learning material received on time respectively. However, maximum variation in respondents’ response’s form mean value were noted in timely receiving printed learning materials while minimum were in clearly stated concepts in the learning material.
Overall, the estimated output indicates that, respondents are much comfortable with the concepts in learning material both in printed and digital format and easily availability of learning material. Furthermore, respondents are also comfortable with induction program conducted at study center.
Figure 1 presents respondent’s responses regarding learning material and induction program of the university. Reponses of total 269 respondents regarding clearly stated concepts in learning material were recorded 8 strongly disagreed, 3 disagreed, 38 average, 110 agreed and strongly agreed, this clearly indicate positivity of respondents. Similarly, for on time receiving printed material 19 respondents were recorded strongly disagreed, 22 disagreed, 77 average, 94 agreed and 57 strongly agreed. Regarding availability of supplementary learning materials 13 respondents are noted strongly disagreed, 19 disagreed, 38 average, 110 agreed and 89 strongly agreed. For availability of study materials in digital form 14 are noted strongly disagreed, 10 disagreed, 40 average, 101 agreed and 104 strongly agreed. Similarly, respondents’ responses about induction program were recorded with 15 strongly disagreed, 22 disagreed, 59 average, 110 agreed and 63 strongly agreed responses. Overall for each given statement maximum number of respondents noted agreed and strongly agreed indicates that students are comfortable with the current concepts and availability of supplementary learning resources. Students also concur with the usefulness of the induction program conducted at study center.
Respondent’s Responses Regarding CounsellingTable 4 illustrates descriptive statistics of respondents’ responses about counselling provided in the university. This includes number of observations, minimum, maximum, mean value and standard
Table 3. Descriptive statistics of learning material and induction program
Statements N Minimum Maximum Mean Std. Deviation
1. Concepts are clearly stated in the Learning Material 269 1.00 5.00 4.1561 0.91717
2. Printed Learning Material are received on Time 269 1.00 5.00 3.5502 1.12398
3. Supplementary Learning Material like Video/Radio counselling etc. are available 269 1.00 5.00 3.9033 1.08842
4. Study Materials are easily available in Digital form 269 1.00 5.00 4.0074 1.07548
5. Induction program conducted at study centers are useful 269 1.00 5.00 3.6840 1.08954

International Journal of Information and Communication Technology EducationVolume 17 • Issue 3 • July-September 2021
17
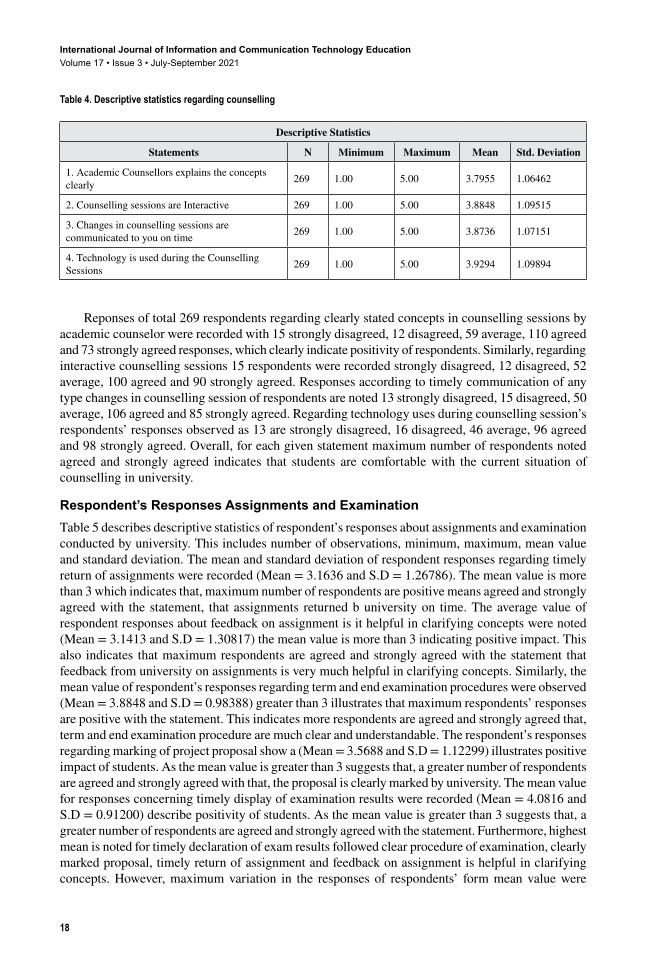
deviation. The mean and standard deviation of respondent responses regarding clearly in the explanation of concepts by the academic counsel and explanation were recorded (Mean = 3.7955 and S.D = 1.06462). The mean value is more than 3 which indicates that, maximum number of respondents are positive means agreed and strongly agreed with the statement. The average value of respondent responses about interactive counselling session were noted (Mean = 3.8848 and S.D = 1.09515) the mean value is more than 3 indicating positive impact also indicates that maximum respondents are agreed and strongly agreed with the statement. Similarly, the mean value of respondent’s responses regarding any changes in counselling session on time communication were observed (Mean = 3.8737 and S.D = 1.07151) greater than 3 illustrates that maximum respondents’ responses are positive with the statement. However, maximum variation in mean value of the respondents’ response is recorded for timely receiving printed learning materials while minimum were in clearly stated concepts in the learning material. The mean value of responses about technology use during counselling session in the university were recorded (Mean = 3.9294 and S.D = 1.09894) which show positive responses of respondents. As the mean value is greater than 3 suggests that, a greater number of respondents are agreed and strongly agreed that, academic counselor make use of technology during counselling session. Furthermore, highest mean is noted for technology use during counselling sessions followed by interactive counselling session, on time communication in counselling session regarding any changes and clear explanation of academics’ counselor. However, maximum deviation in the responses of respondent’s form mean value were recorded in technology usage during counselling session while minimum was in timely commination with students regarding any changes in counselling sessions.
Overall, the estimated output indicates that, respondents are comfortable with the concepts in learning material available in both, printed and digital format. They are also comfortable with the easily availability of learning material.
Figure 1. Respondent’s responses regarding learning material and induction program
International Journal of Information and Communication Technology EducationVolume 17 • Issue 3 • July-September 2021
18
Reponses of total 269 respondents regarding clearly stated concepts in counselling sessions by academic counselor were recorded with 15 strongly disagreed, 12 disagreed, 59 average, 110 agreed and 73 strongly agreed responses, which clearly indicate positivity of respondents. Similarly, regarding interactive counselling sessions 15 respondents were recorded strongly disagreed, 12 disagreed, 52 average, 100 agreed and 90 strongly agreed. Responses according to timely communication of any type changes in counselling session of respondents are noted 13 strongly disagreed, 15 disagreed, 50 average, 106 agreed and 85 strongly agreed. Regarding technology uses during counselling session’s respondents’ responses observed as 13 are strongly disagreed, 16 disagreed, 46 average, 96 agreed and 98 strongly agreed. Overall, for each given statement maximum number of respondents noted agreed and strongly agreed indicates that students are comfortable with the current situation of counselling in university.
Respondent’s Responses Assignments and ExaminationTable 5 describes descriptive statistics of respondent’s responses about assignments and examination conducted by university. This includes number of observations, minimum, maximum, mean value and standard deviation. The mean and standard deviation of respondent responses regarding timely return of assignments were recorded (Mean = 3.1636 and S.D = 1.26786). The mean value is more than 3 which indicates that, maximum number of respondents are positive means agreed and strongly agreed with the statement, that assignments returned b university on time. The average value of respondent responses about feedback on assignment is it helpful in clarifying concepts were noted (Mean = 3.1413 and S.D = 1.30817) the mean value is more than 3 indicating positive impact. This also indicates that maximum respondents are agreed and strongly agreed with the statement that feedback from university on assignments is very much helpful in clarifying concepts. Similarly, the mean value of respondent’s responses regarding term and end examination procedures were observed (Mean = 3.8848 and S.D = 0.98388) greater than 3 illustrates that maximum respondents’ responses are positive with the statement. This indicates more respondents are agreed and strongly agreed that, term and end examination procedure are much clear and understandable. The respondent’s responses regarding marking of project proposal show a (Mean = 3.5688 and S.D = 1.12299) illustrates positive impact of students. As the mean value is greater than 3 suggests that, a greater number of respondents are agreed and strongly agreed with that, the proposal is clearly marked by university. The mean value for responses concerning timely display of examination results were recorded (Mean = 4.0816 and S.D = 0.91200) describe positivity of students. As the mean value is greater than 3 suggests that, a greater number of respondents are agreed and strongly agreed with the statement. Furthermore, highest mean is noted for timely declaration of exam results followed clear procedure of examination, clearly marked proposal, timely return of assignment and feedback on assignment is helpful in clarifying concepts. However, maximum variation in the responses of respondents’ form mean value were
Table 4. Descriptive statistics regarding counselling
Descriptive Statistics
Statements N Minimum Maximum Mean Std. Deviation
1. Academic Counsellors explains the concepts clearly 269 1.00 5.00 3.7955 1.06462
2. Counselling sessions are Interactive 269 1.00 5.00 3.8848 1.09515
3. Changes in counselling sessions are communicated to you on time 269 1.00 5.00 3.8736 1.07151
4. Technology is used during the Counselling Sessions 269 1.00 5.00 3.9294 1.09894

International Journal of Information and Communication Technology EducationVolume 17 • Issue 3 • July-September 2021
19
recorded in feedback on assignments are helpful for clarifying concept while minimum was in term and end examination clear procedures.
Overall, the estimated output of student’s responses regarding assignments and examination, of respondents are much better and students are comfortable with current system of university.
Figure 2 presents respondent’s responses regarding assignments and examination system of university. Reponses of total 269 respondents regarding timely return of assignments were recorded with 38 strongly disagreed, 43 disagreed, 35 average, 83 agreed and 40 strongly agreed, this clearly indicate positivity of respondents. Similarly, regarding feedback on assignment clarifying students’ concepts 42 respondents were recorded strongly disagreed, 43 disagreed, 63 average, 77 agreed and 44 strongly agreed. Responses regarding term and examination clear procedures are noted 10 strongly disagreed, 13 disagreed, 48 average, 125 agreed and 73 strongly agreed. Regarding project proposal clearly marking respondent’s responses observed as 16 are strongly disagreed, 31 disagreed, 63 average,
Table 5. Descriptive statistics regarding assignments and examination
Statements N Minimum Maximum Mean Std. Deviation
Assignments are returned on time 269 1.00 5.00 3.1636 1.26786
Feedback on the assignments helped in clarifying the concepts 269 1.00 5.00 3.1413 1.30817
Term End Examination procedures are given clearly to you 269 1.00 5.00 3.8848 0.98388
Project proposals are clearly marked 269 1.00 5.00 3.5688 1.12299
Exam results are declared on time 269 1.00 5.00 4.0186 0.91200
Figure 2. Respondent’s responses assignments and examination

International Journal of Information and Communication Technology EducationVolume 17 • Issue 3 • July-September 2021
20
102 agreed and 57 strongly agreed. Respondent’s responses regarding term and examination clear procedures are noted 10 strongly disagreed, 13 disagreed, 48 average, 125 agreed and 73 strongly agreed. Responses related to on time result declaration were observed as 9 are strongly disagreed, 4 disagreed, 43 average, 130 agreed and 83 strongly agreed. Overall, for each given statement maximum number of respondents are noted agreed and strongly agreed indicates that students are comfortable with the current situation of assignments and examination in university.
Respondent’s Responses Services provided by UniversityTable 6 illustrates descriptive statistics of respondent’s responses about services provided by university to students. This includes number of observations, minimum, maximum, mean value and standard deviation. The mean and standard deviation of respondent responses regarding helpfulness of personal at study were recorded (Mean = 3.7732 and S.D = 1.03153). The mean value is more than 3 which indicates that, maximum number of respondents are positive means agreed and strongly agreed with the statement, that is personal at study center are helpful. The respondent responses about infrastructure of study center produced an average value (Mean = 3.6803 and S.D = 1.00094) the mean value is more than 3 indicating positive impact. This also indicates that, maximum respondents are agreed and strongly agreed with the statement that, infrastructure of study center is adequate. Similarly, the mean value of respondent’s responses regarding timely response about any query were observed (Mean = 3.7844 and S.D = 1.12882) greater than 3 illustrates that maximum respondents’ responses are positive. Indicating maximum students are agreed and strongly agreed that, responses regarding any query by university is on time. The mean vale of responses about initiatives taken by university for placements were recorded (Mean = 2.6543 and S.D = 1.37522) which show negative responses from respondents. As the mean value is less than 3 suggests that, a greater number of respondents are disagreed and strongly disagreed on that, initiatives taken by university for placements. The mean vale of responses regarding easily accessible online services provided by university were observed (Mean = 3.9071 and S.D = 0.96714) which suggests positive responses from respondents. As the mean value is greater than 3 suggests that, a greater number of respondents are agreed and strongly agreed on that, online services provided by university are easily accessible to students. Respondents responses mean vale about overall in love with university were observed (Mean = 3.8625 and S.D = 0.99983) which suggests positive responses from respondents. As the mean value is greater than 3 suggests that, more number of respondents are agreed and strongly agreed on that, generally students are in love with the university. Furthermore, highest mean is noted for easily accessible online services, followed by overall student’s satisfaction from university initiatives, timely response to students, helpful personal at study center, adequate infrastructure of study center and initiatives taken for placement by university. However, maximum deviation in the respondent’s responses form mean value were recorded in initiative taken by university for placement while minimum was in online services provided by university.
Overall, the estimated output of student’s responses indicates that, respondents are much comfortable with the structure and personal at study center, timely response, easily accessible online services and overall, satisfied with university. However, students are not comfortable initiatives taken by university for placement.
Figure 3 presents respondent’s responses regarding services provided by university. Reponses of total 269 respondents regarding helpfulness of persons at study centers were recorded 13 strongly disagreed, 16 disagreed, 54 average, 122 agreed and 64 strongly agreed, this clearly indicate positivity of respondents. Similarly, regarding infrastructure of study center 12 respondents were recorded strongly disagreed, 13 disagreed, 80 average, 108 agreed and 56 strongly agreed. Responses according to timely communication of student’s query of respondents are noted 21 strongly disagreed, 8 disagreed, 56 average, 107 agreed and 77 strongly agreed. Regarding initiatives taken by university for placement respondents responses observed as 77 are strongly disagreed, 52 disagreed, 60 average, 47 agreed and 33 strongly agreed. Respondent response’s about easily availability of university online

International Journal of Information and Communication Technology EducationVolume 17 • Issue 3 • July-September 2021
21
services were observed as 9 are strongly disagreed, 13 disagreed, 46 average, 127 agreed and 74 strongly agreed. Respondent response’s regarding overall loving with university are recorded as 11 are strongly disagreed, 14 disagreed, 47 average, 16 agreed and 71 strongly agreed. Overall, for each given statement maximum number of respondents noted agreed and strongly agreed except initiatives taken by university for placement indicates that students are comfortable with the current services provided by university.
Inferential Statistical AnalysisIn order to arrive the conclusion for the population, the regression test was used. Table 7-9 represent the analysis. The four components such as Learning Material, Counselling, Assessment & Evaluation and Support System were taken into consideration.
The “R” representing here multiple correlation coefficient. R can be considered to be one measure of the role and importance of Assessment and Evaluation (AE). A value of .461, in the table,
Table 6. Descriptive Statistics Regarding Services provided by university
Statements N Minimum Maximum Mean Std. Deviation
Personnel in the Study centers are helpful 269 1.00 5.00 3.7732 1.03153
Infrastructure of Study Centers is adequate 269 1.00 5.00 3.6803 1.00094
Timely response is given to your query 269 1.00 5.00 3.7844 1.12882
Initiatives are taken by your university for placements 269 1.00 5.00 2.6543 1.37522
Online services provided are easily accessible 269 1.00 5.00 3.9071 0.96714
Overall, I am satisfied with the University 269 1.00 5.00 3.8625 0.99983
Figure 3. Respondent’s Responses Services provided by university

International Journal of Information and Communication Technology EducationVolume 17 • Issue 3 • July-September 2021
22
indicates a good level of prediction. The “R Square” representing the (also called the coefficient of determination), proportion of variance in the dependent variable that is Assessment and Evaluation (AE) that can be explained by the independent variable (technically, it is the proportion of variation accounted for by the regression model above and beyond the mean model). R Square value of 0.212 that our independent variables explain 21.2% of the variability of our dependent variable, Assessment and Evaluation (AE). Adjusted R-squared adjusts the statistic based on the number of independent variables in the model. Adjusted R Square value of 0.209 that our independent variables explain 21% of the variability of our dependent variable, Assessment and Evaluation (AE).
The F-ratio in the ANOVA test whether the overall regression model is a good fit for the data. Table 8 shows that the independent variables statistically significantly predict the dependent variable, F (1, 267) = 71.931, p < 0.05 (i.e., the regression model is a good fit of the data).
With the help of Table 8, the general form of equation to predict, Assessment and Evaluation (AE) (Dependent Variables), Learning Material (LM) (Independent Variable) (Table 9).
A multiple regression was predicted with Assessment and Evaluation (AE) (Dependent Variables), Learning Material (LM) (Independent Variable). These variables statistically significantly predicted Assessment and Evaluation (AE). It means Learning Material (LM) variable is important for Assessment and Evaluation.
Another important component is counselling (C). A value of .580 shown in Table 10 indicates a good level of prediction.
The F-ratio in the ANOVA test shows that the counselling (independent variables) statistically significantly with assessment & evaluation (dependent variable), F (1, 267) = 135.226, p < 0.05 (Table 11 and Table 12).
Regression equation was created with Assessment and Evaluation (AE) (Dependent Variables), Counselling (C) (Independent Variable). These variables statistically significantly predicted Assessment and Evaluation (AE). It means counselling is important for Assessment and Evaluation.
Table 7. Regression test on learning material
Regression Test on Learning Material
R R Square Adjusted R Square Std. Error of the Estimate
.461a .212 .209 .7980
Table 8. Coefficients between assessment and evaluation and learning material
Coefficientsa between Assessment & Evaluation and Learning Material
Model
Unstandardized CoefficientsStandardized Coefficients
t Sig.B Std. Error Beta
1 (Constant) 1.129 .290 3.896 .000
Learning Material (LM)
.628 .074 .461 8.481 .000
a. Dependent Variable: Assessment and Evaluation
Table 9. Regression equation
Assessment and Evaluation (AE) = 1.129 + (0.628× Learning Material)

International Journal of Information and Communication Technology EducationVolume 17 • Issue 3 • July-September 2021
23
Support Services is important component for any programme of study. A value of .853 shown in Table 13 indicates a good level of prediction.
The F-ratio in the ANOVA test shows that the support system (independent variables) statistically significantly with assessment &evaluation (dependent variable), F (1, 267) = 713.756, p < 0.05 (Table 14 and 15).
Table 10. Regression model on counselling
Model R R Square Adjusted R Square Std. Error of the Estimate
1 .580a .336 .334 .7325
Table 11. Coefficientsa between assessment and evaluation and counselling
Model Unstandardized Coefficients Standardized Coefficients
t Sig.
B Std. Error Beta
1 (Constant) 1.533 .179 8.554 .000
Counselling .521 .045 .580 11.629 .000
a. Dependent Variable: Assessment & Evaluation
Table 12. Regression equation
Assessment and Evaluation (AE) = 1.533 + (0.521× Counselling)
Table 13. Regression Model on support system
Model R R Square Adjusted R Square Std. Error of the Estimate
1 .853a .728 .727 .4691
a. Predictors: (Constant), Support System
Table 14. Coefficientsa between support system and assessment and evaluation
Model
Unstandardized CoefficientsStandardized Coefficients
t Sig.B Std. Error Beta
1 (Constant) .368 .123 3.002 .003
SS .882 .033 .853 26.716 .000
a. Dependent Variable: AE

International Journal of Information and Communication Technology EducationVolume 17 • Issue 3 • July-September 2021
24
Regression equation was created with Assessment and Evaluation (AE) (Dependent Variables), Support Services (SS) (Independent Variable). These variables statistically significantly predicted Assessment and Evaluation (AE). It means support service is important for Assessment and Evaluation.
Learning Material is important component for any programme of study. A value of .570 shown in Table 16 indicates a good level of prediction.
The F-ratio in the ANOVA test shows that the learning material (independent variables) statistically significantly with support services (dependent variable), F (1, 267) = 128.272, p < 0.05 (Table 17-18).
Regression equation was created with Support Services (SS) (Dependent Variables), Learning Material (LM) (Independent Variable). These variables statistically significantly predicted Assessment and Evaluation (AE). It means learning material is important for support service.
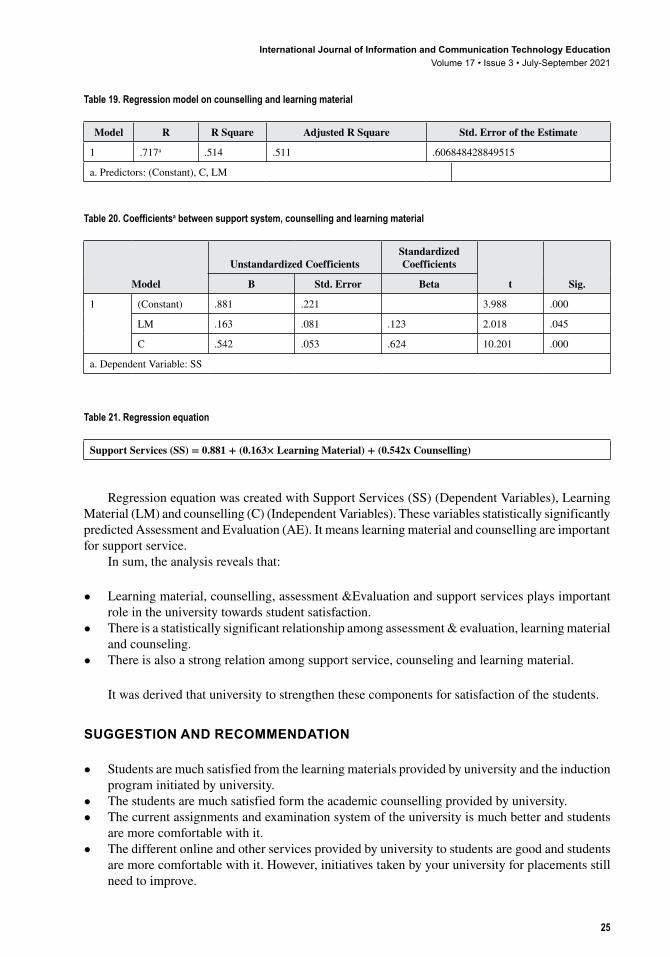
Counselling and Learning Material is important component for any programme of study. A value of .717 shown in Table 19 indicates a good level of prediction.
The F-ratio in the ANOVA test shows that the learning material and counselling (independent variables) statistically significantly with support services (dependent variable), F (1, 267) = 140.925, p < 0.05 (Table 20-21).
Table 15. Regression Equation
Assessment and Evaluation (AE) = 0.368 + (0.882× Support Services)
Table 16. Regression model on learning material
Model R R Square Adjusted R Square Std. Error of the Estimate
1 .570a .325 .322 .714435519285717
a. Predictors: (Constant), LM
Table 17. Coefficientsa between support system and learning material
Model
Unstandardized CoefficientsStandardized Coefficients
t Sig.B Std. Error Beta
1 (Constant) .712 .259 2.743 .006
Learning Material
.751 .066 .570 11.326 .000
a. Dependent Variable: Support Services
Table 18. Regression equation
Support Services (SS) = 0.712 + (0.751× Learning Material)
International Journal of Information and Communication Technology EducationVolume 17 • Issue 3 • July-September 2021
25
Regression equation was created with Support Services (SS) (Dependent Variables), Learning Material (LM) and counselling (C) (Independent Variables). These variables statistically significantly predicted Assessment and Evaluation (AE). It means learning material and counselling are important for support service.
In sum, the analysis reveals that:
• Learning material, counselling, assessment &Evaluation and support services plays important role in the university towards student satisfaction.
• There is a statistically significant relationship among assessment & evaluation, learning material and counseling.
• There is also a strong relation among support service, counseling and learning material.
It was derived that university to strengthen these components for satisfaction of the students.
SUGGESTION ANd RECOMMENdATION
• Students are much satisfied from the learning materials provided by university and the induction program initiated by university.
• The students are much satisfied form the academic counselling provided by university.• The current assignments and examination system of the university is much better and students
are more comfortable with it.• The different online and other services provided by university to students are good and students
are more comfortable with it. However, initiatives taken by your university for placements still need to improve.
Table 19. Regression model on counselling and learning material
Model R R Square Adjusted R Square Std. Error of the Estimate
1 .717a .514 .511 .606848428849515
a. Predictors: (Constant), C, LM
Table 20. Coefficientsa between support system, counselling and learning material
Model
Unstandardized CoefficientsStandardized Coefficients
t Sig.B Std. Error Beta
1 (Constant) .881 .221 3.988 .000
LM .163 .081 .123 2.018 .045
C .542 .053 .624 10.201 .000
a. Dependent Variable: SS
Table 21. Regression equation
Support Services (SS) = 0.881 + (0.163× Learning Material) + (0.542x Counselling)

International Journal of Information and Communication Technology EducationVolume 17 • Issue 3 • July-September 2021
26
Based on the findings of the study the following recommendation are suggested:
• Overall, the student’s attitude observed positive regarding different services provided by university.• As regarding learning material, induction program, study center structure and facilities, online
services, counselling, assignment and examination the student’s reports positive attitude.• The university still needs to improve these facilities.• Furthermore, attitude towards placement are needs to be worked-out.
CONCLUSION
The present research study carried out on a sample of 269 students’ data of Uttarakhand Open University , which represents both the genders and various localities, and the responses were recorded regarding different services provided by university by using different statistical approaches. From the results it is concluded that, the learning materials provided by university to students of different social group are clear, understandable and of high standard. Along with this, the learning material provided by the university for each level has high output. Furthermore, the induction program conducted by the university at study center are fruitful for students.
The finding shows that, academic counselling provided by theuniversity to students are conceptual, clear and knowledgeable. Furthermore, change in the schedule of interactive counselling sessions is communicated by the university to students on-time.
Moreover, the findings reveal that, current assignments, examination system and marking system of the university is better and students are comfortable with it. The assignments are conceptual, knowledgeable and objective oriented also the feedback provided by university are clear. The students are satisfied with marking system of university and declaration of exam results by university on time. Along with this the online services, different initiatives and other services provided by university all are in favor of students. Furthermore, it is also concluded that the study center structure is adequate and personal at study center are very much helpful with students.
The result of the regression model reveals that the relation among the assessment & evaluation of the university and learning material. Similarly, significant relation between assessment & evaluation of the university and counselling. There also significant relation between assessment & evaluation of the university and support services. The Uttarakhand Open University may consider these inferences that the learning materials should reach on time and the appropriate counselling sessions to support the students to archive the assessment and evaluation. Further the university focus on support services to get highest satisfaction from the students.
ACKNOWLEdGMENT
This publication is a part of a joint Project ‘‘Integrated Open and Distance Learning through ICT at Uttarakhand Open University for Sustainable Development’’ of Uttarakhand Open University, Haldwani (India) and Commonwealth Educational Media Centre for Asia, New Delhi.

International Journal of Information and Communication Technology EducationVolume 17 • Issue 3 • July-September 2021
27
REFERENCES
Arbaugh, J. B. (2000). Virtual classroom characteristics and student satisfaction with internet based MBA courses. Journal of Management Education, 24(1), 32–54. doi:10.1177/105256290002400104
Bradford, G. R. (2011). A relationship study of student satisfaction with learning online and cognitive load: Initial results. The Internet and Higher Education, 14(4), 217–226. doi:10.1016/j.iheduc.2011.05.001
Cole, M. T., Shelley, D. J., & Swartz, L. B. (2014). Online Instruction, E-Learning, and Student Satisfaction: A Three Year Study. International Review of Research in Open and Distance Learning, 15(6), 111–131. doi:10.19173/irrodl.v15i6.1748
Donohue, T., & Wong, E. (1997). Achievement motivation and college satisfaction in traditional and nontraditional students. Education, 237–243.
Fazlollahtabar, H., & Muhammadzadeh, A. (2012). A knowledge-based user interface to optimize curriculum utility in an e-learning system. International Journal of Enterprise Information Systems, 8(3), 34–53. doi:10.4018/jeis.2012070103
Gameel, B. G. (2017). Learner Satisfaction with Massive Open Online Courses. American Journal of Distance Education, 31(2), 98–111. doi:10.1080/08923647.2017.1300462
Ghaderizefreh, S., & Hoover, M. L. (2018). Student Satisfaction with Online Learning in a Blended Course. International Journal of Digital Society, 1393-1398.
Keller, J. (1983). Instructional design theories and models: an overview. Erlbaum.
Kilburn, B., Kilburn, A., & Davis, D. (2016). Building collegiate e-loyalty: The role of perceived value in the quality-loyalty linkage in online higher education. Contemporary Issues in Education Research, 9(3), 95–102. doi:10.19030/cier.v9i3.9704
Kumar, P., & Kumar, N. (2020). A study of learner’s satisfaction from MOOCs through a mediation model. In International Conference on Smart Sustainable Intelligent Computing and Applications under ICITETM2020 (pp. 354–363). Elsevier. doi:10.1016/j.procs.2020.06.041
Kuo, Y., Walker, A., Schroder, K., & Belland, B. (2014). Interaction, internet self-efficacy, and self-regulated learning as predictors of student satisfaction in online education courses. Internet and Higher Education, 20, 35–50. doi:10.1016/j.iheduc.2013.10.001
Littlejohn, A., Hood, N., Milligan, C., & Mustain, P. (2016). Learning in MOOCs: Motivations and self-regulated learning in MOOCs. The Internet and Higher Education, 29, 40–48. doi:10.1016/j.iheduc.2015.12.003
Macleod, H., Sinclair, C., Haywood, J., & Woodgate, A. (2016). Massive Open Online Courses: Designing for the unknown learner. Teaching in Higher Education, 21(1), 13–24. doi:10.1080/13562517.2015.1101680
Moore, M., & Kearsley, G. (2011). Distance education: A systems view of online learning. Wadsworth.
Mythili, G. (2017). Satisfaction and Performance of Academic Counsellors in an Online Training Programme—A Study. Indian Journal of Open Learning, 3-10.
Parhar, M., Mythili, G., & Unnikrishnan, P. (2010). Student Satisfaction Survey at Indira Gandhi National Open University. EduComm Asia, 16-21.
Rabin, E., Kalman, Y., & Kalz, M. (2019). An empirical investigation of the antecedents of learner-centered outcome measures in MOOCs. International Journal of Educational Technology in Higher Education.
Seaman, J. E., Allen, I. E., & Seama, J. (2018). Grade Increase: Tracking Distance Education in the United States. Babson Survey Research Group.
Swart, W., Wengrowicz, N., & Wuensch, K. (2015). Using transactional distances to explore student satisfaction with group collaboration in the flipped classroom. International Journal of Information and Operations Management Education, 6(1), 24–48. doi:10.1504/IJIOME.2015.073155

International Journal of Information and Communication Technology EducationVolume 17 • Issue 3 • July-September 2021
28
Jeetendra Pande (PhD) is working as an Associate Professor of Computer Science Department at Uttarakhand Open University, Haldwani. He has to his credit more than 12 research papers in International Journals, 12 papers in conference proceedings and 03 refereed books. His current area of interests are cyber security, computer forensics, component based software development, mobile learning and Open Educational Resources. Dr. Pande has worked in the areas Component Based Software Development and Cyber Security. He has been involved in development of pliability metric for optimal component selection for component-based software development. He has carried out many projects as a Principal Investigator sanctioned by Commonwealth Educational Media Center for Asia, USERC and Govt. of Uttarakhand. Presently is he working on an International Project funded by Commonwealth of Learning, Canada. Dr. Pande has been reviewer for several archived journals at the International level. International Journal Of Software Engineering & Knowledge Engineering (World Scientific, Singapore), Journal of Information Technology & Decision Making (World Scientific, Singapore), International Journal of Computer Systems Science and Engineering (United Kingdom) are to name a few of them. He is a member of several academic and professional bodies in the area of computer science and distance education. He has been awarded Gold Medal for Innovation in Open and Distance Learning by the Hon’ble Vice President of India in the 32nd convocation of IGNOU.
G. Mythili (PhD) is a Deputy Director since 2012 at the Staff Training and Research Institute, Indira Gandhi National Open University, India. She has presented conference papers, published research papers in refereed journals, conducted and participated as resource person in various workshops/training programmes in India. Her areas of interest are: Massive Open Online Course (MOOC); E-Learning; Online Training; Training and Development; Multimedia Design and Development; Web Design and Development; OER & Open Source Tools; Staff development and Program Evaluation.
Wengrowicz, N., Swart, W., Paul, R., Macleod, K., Dori, D., & Dori, Y. J. (2018). Students’ Collaborative Learning Attitudes and Their Satisfaction with Online Collaborative Case-Based Courses. American Journal of Distance Education, 283-300.