investigating perceptual biases, data reliability, and...
TRANSCRIPT

Investigating perceptual biases, data reliability, and data discovery in a methodology for collecting speech
errors from audio recordingsJohn Alderete, Simon Fraser University
In collaboration with:Monica Davies (University of British Columbia)
Draft for of paper: anderei.net/publications Slides at: anderei.net Comments welcome!
October 7, 2016 Pacific Lutheran University

2
Psycholinguistics• Language acquisition: learning/development of categories and
patterns • Sentence processing/comprehension: “from ear to mind”
processes involved in listening and understanding utterances • Language production: “from mind to mouth”
processes involved in speaking, preparing a prelinguistic message, encoding grammatical and sound structure, producing fluid speech
Speech errors: slips of tongue, spoonerisms, etc., typically ungrammatical utterances that talkers recognize as errors but can’t avoid producing.
Examples: Sound error: Reah, I read that somewhere. (yeah →.reah, sfused6011)
Word error: This side has green Vs, I mean red Vs (sfused797)
Syntactic error: I'm not staying all up night. (sfused1817)
Classic studies: Dell & Reich 1981, Fromkin 1971, 1973, Garrett 1975, Harley 1984, 1996, Shattuck-Hufnagel 1979, Stemberger 1982/1985
Major theme: structure of speech errors is not random but patterned in ways that supports inferences about the processes that underlie language production

3
Lemma selection: concepts to lemmas
Breakdown: word errors (specifically lexical errors)
Example: …and clutching the, the kitchen sink. (bathroom → kitchen, sfused495)
Properties: -usually not contextual (less than 20%) -typically semantically related (e.g., kitchen, bathroom) -respects the category constraint (same part of speech)
Phonological encoding: lemmas to sounds
Breakdown: sound errors
Example: … if you cool, … two tubes (coil → cool, sfused4502) Properties: -usually contextual (more than 60%) -source and error words don’t generally respect the category constraint -phonological constraints: syllable position constraint, phonological similarity of intruder, word-onset effect -governed by different distant requirements than word errors
DOG CAT MILK
cat, N
kæt
k æ t

The numbers matter• Sound exchanges are subject to a locality requirement not found
in word exchanges (Garrett 1975): 87% sound exchanges in adjacent words vs. 19% exchanges of adjacent words
• Sound substitutions are asymmetric and subject to a frequency bias: frequent replaces infrequent (Dell 1986)
• Sound exchanges are the most common type of sound error (Shattuck-Hufnagel 1979): 50% (with incompletes), vs. anticipations (7%), perseverations (13%), other substitutions (30%)
→ Claims about psycholinguistic processes depend crucially on counts of specific error patterns; these counts often require statistical analysis and may have small effect sizes
4

5
Leading questions
How does the methods used to collect speech errors affect data quality and data composition?
Are the counts reported in prior research representative of the actual occurrence of speech errors?

Road map• Background: speech error collection is plagued by a number of
problems in data reliability and various biases that can have a major impact on data composition
• SFUSED (Simon Fraser University Speech Error Database): describe a collection method designed to address these problems based on audio recordings and using many data collectors
• Experiment 1: many listeners, same recording, are they consistent?
• Experiment 2: online data collection (on the spot observation) vs. offline data collection with audio recordings
• Discovery: the SFUSED approach supports exploration of the data in ways that are not possible with traditional observational techniques
6

Background: data reliability
7
Problems producing an unrepresentative sample of actual patternsFailure to record errors
-errors are not recognized/remembered-errors occur too fast, past time envelope
False Positives-error was misheard (‘slip of ear’, Cutler 1981)-incorrect recall or transcription of error-error doesn’t meet definition “unintended non-habitual deviation from speech plan”
Misclassification-due to incorrect transcriptions-incorrect or insufficient contextual information-coding inconsistency
A reliability test: Ferber 19914 listeners, 45 minutes of German (online), also listened offline by Ferber
-Approx. 2/3 online errors heard by only one listener-Many false positives: 24% (12/51 all online)-Important differences between two classes of listeners: one listener found no sound
errors, two listeners found no word errors

Background: difficulty in spotting errors
8
Definition: a speech error is an unintended non-habitual deviation from the speech plan (Dell 1986)
Many types: speech errors apply at many levels of linguistic analysis (sounds, words, word phrases), and are cross-classified by types (e.g., substitutions, additions, deletions, shifts), and direction (anticipation, perseverations); taxonomy includes at least 11 distinct types
Exclusion 1: not casual speech phonology, e.g., goon news, so collector must be aware of approx. 30 rules of casual speech patterns.
Exclusion 2: not a change of speech plan (because not unintended), subtle modifications we all do in disfluent speech
Exclusion 3: not dialectal differences or idiolectal (habitual), not marginally grammatical

Background: perceptual biases (Bock 1996, Pérez 2007)
9
Content bias: errors are easier to detect if they affect meaning
Attention bias: lower level errors (phonetic or phonological) are often more difficult to detect and therefore require greater attention, substitution harder detect than exchange (e.g., left lemisphere vs. heft lemisphere)
Word onset: errors are less noticeable if they occur at the end of words than the beginnings of words
Predictability: errors also easier to detect when they occur in highly predictable environments (e.g., … go smoke a cikarette) or primed with words associated with the error word
Bias for discrete symbolic categories: especially for sound errors, biased toward assigning sounds to discrete phonological categories
Compensation for coarticulation: phonetic environments may enhance certain contrasts and lead to selection of some discrete sounds over others
Feature biases: sound errors with changes in some features are easier to detect that others, e.g., nasality and voicing easier than place; also more feature changes easier to detect than fewer

Background: additional constraints and biases (see Stemberger 1982/1985, Dell & Reich 1981)
10
Data collector bias: collectors differ in the rate of detection and types of errors (see perceptual biases)
Talker sampling bias: sample may be biased toward the errors of specific individuals, e.g., if just one data collector
Theoretical bias: purchase of a theory or specific hypothesis may affect the errors collected
Memory constraints: mentally very taxing to follow a conversation, track entities, and then detect and record errors
Native language bias: hard to detect errors that don’t fall into the categories of your own language

Background: best practices in prior studies
11
Documentation strategies: only write down errors that have high degree of confidence in, 30 seconds after speech act, make conscious effort to collect errors (no multi-tasking)
Intended words: Immediately question speaker if intended word unclear (not always useful)
Many data collectors: Dell & Reich (1981) used 200 undergraduate students to collect a large sample; see also Pérez et al. 2007
Collect lots of data: 3 data collections have upwards of 6,000 errors
Compare with experimental data (see Stemberger): if fits with trends in experimental data, stronger statement; otherwise look for tasks effects or problems with data collection
Audio recordings: rather than on the spot observation, some more recent collections have collection primarily from audio recordings (Chen 1999, 2000)
Objections→ Most large corpora are collected online by one or two individuals; therefore prone to
perceptual biases of that collector, and typically limited to specific talkers.
→ Most collections are created using on the spot observation, or “online”; therefore prone to a range of reliability problems.

SFUSED: general methodsSimon Fraser University Speech Error Database
12
Multiple data collectors-reduces collector bias, allows it to be studied-currently six data collectors, generating about 200 errors a week
Offline collection from audio recordings-Errors collected from podcasts on different topics-Podcasts selected for having natural unscripted speech, usually Western
Canada and U.S. (Midlands dialect ‘Standard American’)-Examples: Astronomy Cast, Go Bayside, Accidental Tech, Rooster Teeth-Multiple podcasts (8 currently) with different talkers, approx. 50 hours of each
podcast-Record dialectal and idiolectal features associated with speakers (because
habitual, so not an error); listeners develop expectations about individuals-Older approach combined online and offline, but no longer collect online
Training regime-Undergraduate students, introduction to formal linguistics, phonetics and
phonology-Given phonetic training in transcription and tested for transcription accuracy-Introduction to speech errors, definition and illustration of all types-Training through listening tests: assigned pre-screened recordings, asked to find
errors; learn by reviewing correct list of errors. Trainees that reach a certain level of accuracy continue.
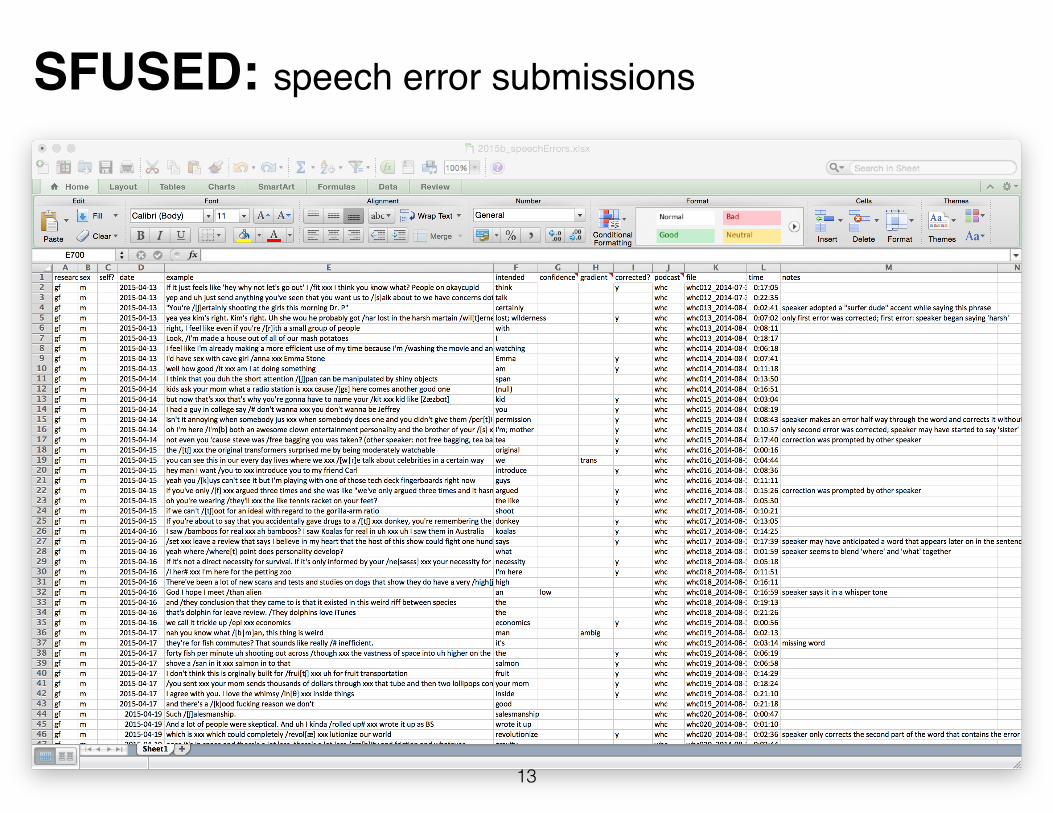
SFUSED: speech error submissions
13

SFUSED: classification by data analyst
14

SFUSED: addressing the methodological problems
• Collector bias: still present, but should be reduced to specific individuals, and can now be studied and corrected for
• Talker bias: record talker identity, so it too can be studied; in general, many talkers, so any effect limited to specific individuals
• Perceptual biases: ability to replay, slow down, recording should reduce biases, more representative sample of actually occurring errors
• Mistakes and missed errors: expect fewer mistakes (can replay) and fewer missed errors; two levels of verification (collector & analyst)
• Symbolic categories: adopt a method used in language acquisition, assign gradient phonetic sound categories (ambiguous, transitional, and intrusive classes)
15
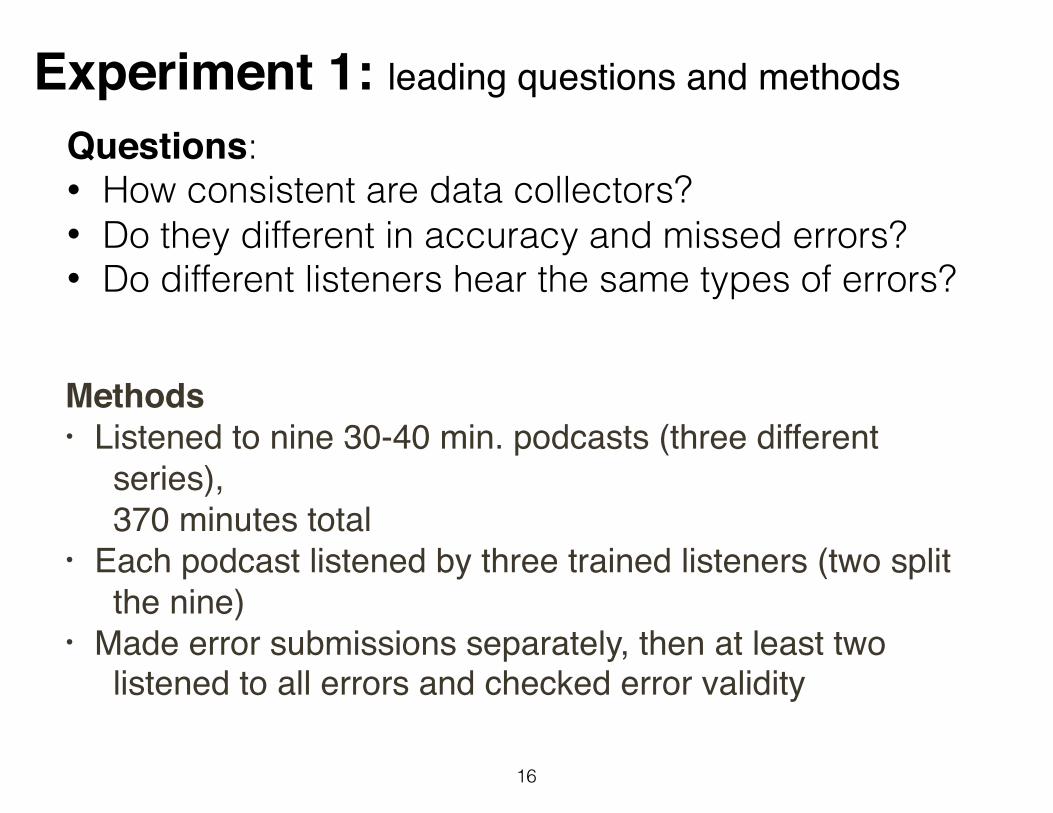
Experiment 1: leading questions and methods
Methods• Listened to nine 30-40 min. podcasts (three different
series), 370 minutes total
• Each podcast listened by three trained listeners (two split the nine)
• Made error submissions separately, then at least two listened to all errors and checked error validity
16
Questions: • How consistent are data collectors? • Do they different in accuracy and missed errors? • Do different listeners hear the same types of errors?

Experiment 1: basic results
17
Number of listeners Counts
Heard by just one person 193 (67.48%)
Heard by just two people 53 (18.53%)
Heard by all three people 40 (13.99%)
Heard by more than one 93 (32.52%)
Basic results• 370 minutes of spontaneous speech: 380 speech errors, an
error every 58 seconds• 94 errors didn’t meet definition of a speech error, 24.74% false
positives• Valid errors: 286, on average, an error every 1 min. 17 seconds• MPE = ‘Minutes Per Error’ = 1.29• Most errors heard by just one listener

Experiment 1: accuracy and rate by listener
18
Total False positives % correct MPE
Listener 1 50 16 68% 4.85
Listener 2 85 18 78.82% 3.21
Listener 3 177 33 81.36% 2.64
Listener 4 206 32 84.47% 2.18
Accuracy and MPE (minutes per error)
While some listeners make more mistakes, and catch fewer errors, results are broadly consistent.

Experiment 1: error types
19
Sound Word Other Total
Listener 1 17 (50%) 14 (41.18%) 4 (11.76%) 34
Listener 2 38 (56.72%) 15 (22.39%) 15 (22.39%) 67
Listener 3 89 (61.38%) 40 (27.59%) 16 (11.03%) 145
Listener 4 100 (57.80%) 46 (26.59%) 27 (15.61%) 173
Observation: while there are some differences, there is no significant association between listener and error type (X2 = 7.84, P = 0.2501); similar results below.
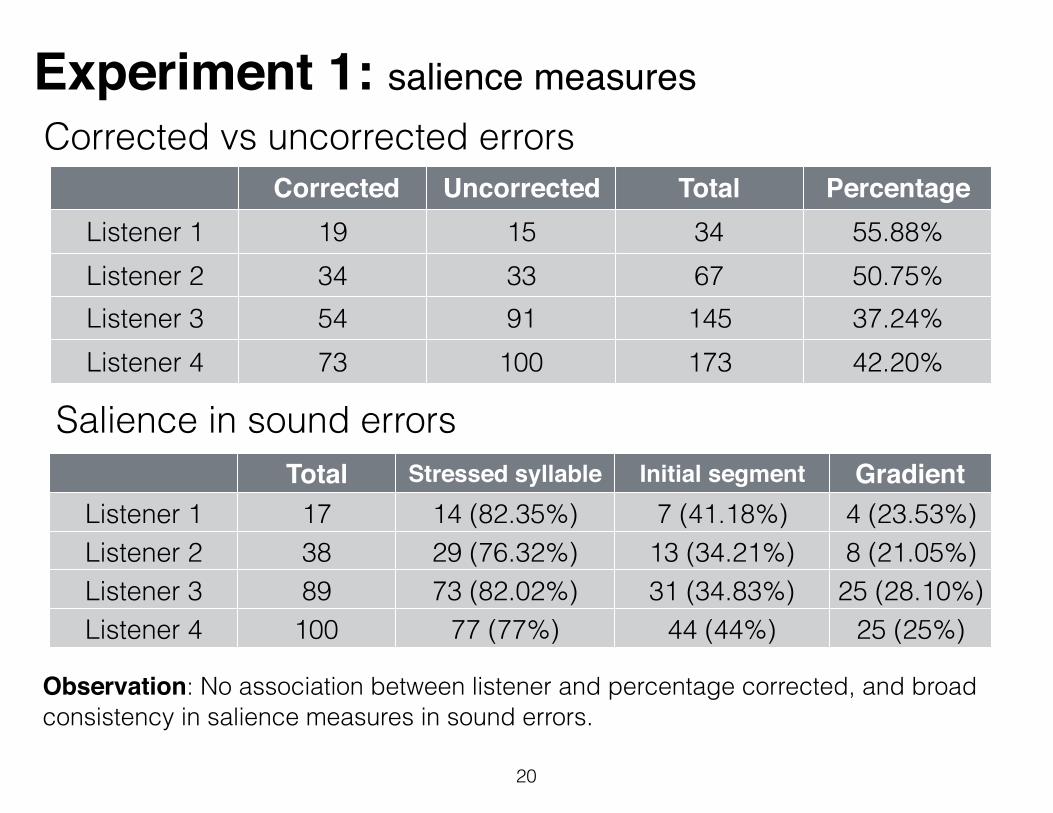
Experiment 1: salience measures
20
Corrected vs uncorrected errors
Observation: No association between listener and percentage corrected, and broad consistency in salience measures in sound errors.
Corrected Uncorrected Total Percentage correctedListener 1 19 15 34 55.88%
Listener 2 34 33 67 50.75%Listener 3 54 91 145 37.24%Listener 4 73 100 173 42.20%
Total Stressed syllable Initial segment Gradient errorsListener 1 17 14 (82.35%) 7 (41.18%) 4 (23.53%)
Listener 2 38 29 (76.32%) 13 (34.21%) 8 (21.05%)Listener 3 89 73 (82.02%) 31 (34.83%) 25 (28.10%)Listener 4 100 77 (77%) 44 (44%) 25 (25%)
Salience in sound errors

Experiment 1: summary and conclusions
21
1. Many false positives: 25%Require a second check on error validity and accuracy
2. Data collectors find different errorsApprox. 2/3rds of all errors heard by just one data collector, so potential for variation.
3. Different specific errors, but types and contexts broadly consistentSound errors 50-61%, closer to 60% for experienced listenersWord errors 26%, with one getting 41%Corrected errors: 37-56%, closer to 40% for experienced listenersGradient errors: 12-17%Errors in stressed syllables: 76-82%Errors in initial segments: 34-44%

Experiment 2: methods and expectations
• Question: does collection method affect data composition?
• Expectation: given ability to replay and listen at slower rate, expect that data collectors will be less susceptible to perceptual bias and will be able to collect speech errors produced at faster rates
• Methods: 100-215 errors collected using online and offline methods from multiple collectors at comparable experience levels (after training and first 30 errors).
22
# collectors # errors
offline 4 533
online 6 839

Experiment 2: basic findings — similarities
23
• Linguistic levels comparable: 59% sound errors 32% word errors9% other errors
• Sound errors: similar error types 70% substitutions 15% additions6% deletions8% other
• General salience: • approx. 74% all errors in stressed syllables • corrected/online > corrected/offline (3%),
but non-significant (perhaps due to lack of reporting in online collection)

Experiment 2: speech rate effects
24
Offline Online ExampleRepeated phoneme 51 (16.19%) 122 (24.11%) …they’re plas=, passing over the plains (10)
No repeated phoneme 264 (83.81%) 384 (75.89%) …they’re plas=, passing over the line.
Offline Online Example
Lexical 39 (19.40%) 104 (27.23%) … we have on the line leather (Heather → leather, 1923)
Non-lexical 104 (51.74%) 245 64.14%) Yeah, gla[θ]es and a beard (glasses → gla[θ]es, 2865)
Clipped 58 (28.86%) 33 (8.64%)
• Two important differences in effects known to be correlated with speech rate • repeated phoneme effect (Dell 1984): intruder sound is next to an identical
phoneme in both the error and source words • lexical bias (Baars et al. 1975): tendency for errors to result in actual words
rather than non-lexical words (trend fits, non-significant)
• Conclusion: more errors collected from fast speech in offline collection (ability to relisten, slow down speech)

Experiment 2: sound errors contextual/non-contextual
25
In contextual errors, the intruder sound is identical to a sound in a nearby word.
Example: … what’s in each pixel run row at a time. (one → run, 27)
Offline Online
Contextual 192 (60.95%) 389 (76.88%)
Non-contextual 123 (39.05%) 117 (23.12%)

Experiment 2: sound errors by direction types
26
Offline Online Examples
Anticipation 54 (27.98%) 119 (30.36%) … I have nice-cream on my nose. (ice → nice, 1604)
Anticipation & Perseveration 53 (27.46%) 52 (13.27%) We don’t have [doʊtə] to show that. (data → d[oʊ]ta,
1744)
Incompletes 29 (15.03%) 47 (11.99%) I would definitely [rɑtʃ] xxx watch The Rock. (watch → ratch, 59)
Perseveration 56 (29.02%) 149 (38.01%) When the next census techs place. (takes → techs, 1867)
Exchange 1 (0.52%) 25 (6.38%) Miranda is much more of a wight leight. (light weight → wight leight, 1726)
Contextual sound errors can be contrasted by direction, or the relation between the source sound and the error.
Interpretation: could write off the difference in perseverations b/c balanced by opposite difference in anticipations & perseverations (limitation of online data). However difference in exchanges is striking. Likely due to their salience: exchanges are impossible to miss.

Experiment 2: all exchanges
27
Offline Online
Morphemes 6
Phrases 1
Sounds 1 25
Words 1 15
Totals 2 (0.38% of 533) 47 (5.6% of 839)
Exchanges at all linguistic levels are rather rare, but much more common in data collected online.
Comparison: the 5.6% exchanges in the online dataset compares with other speech error collections (Boomer & Laver 1968, Nooteboom 1969), but far undershoots some collections using large numbers of untrained data collectors with an online method (Pérez et al. 2007)
Interpretation: the most likely account of this difference is that exchanges are more salient because they have two intruders, and in practice impede significantly on comprehension; online data collectors have fewer attentional resources and are bound by a practice that requires absolute certainty, so have a higher tendency to collect these obvious errors over less obvious ones.
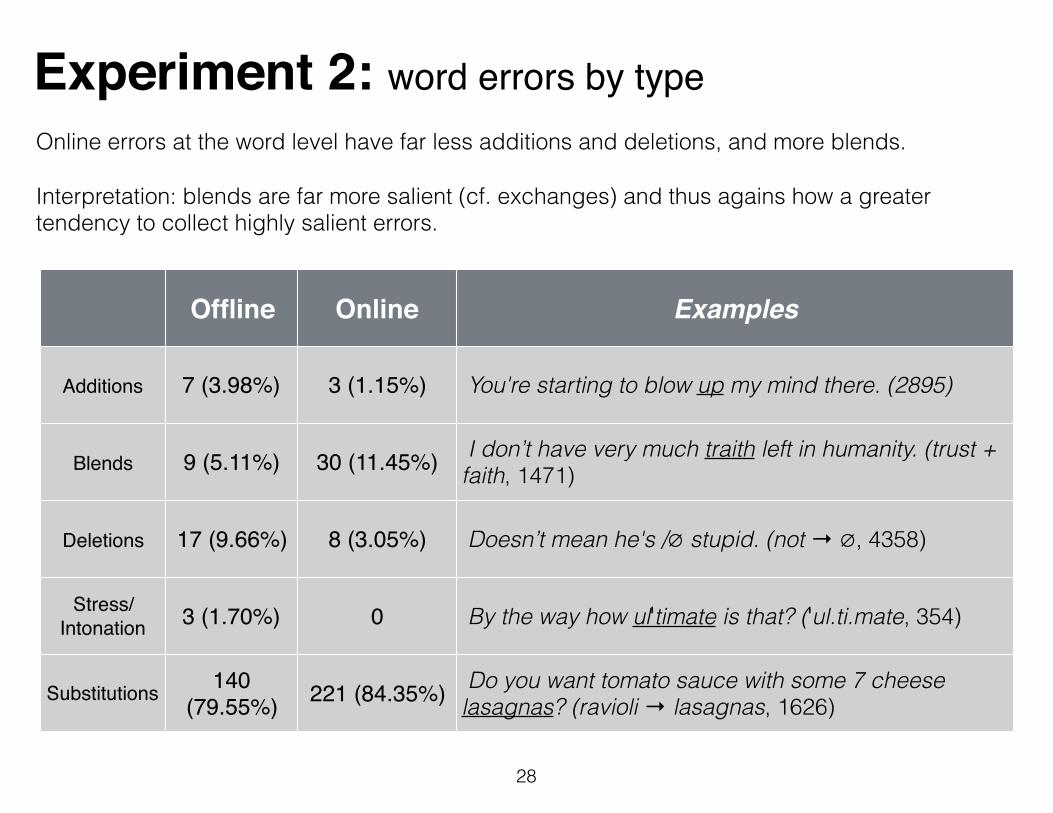
Experiment 2: word errors by type
28
Offline Online Examples
Additions 7 (3.98%) 3 (1.15%) You're starting to blow up my mind there. (2895)
Blends 9 (5.11%) 30 (11.45%) I don’t have very much traith left in humanity. (trust + faith, 1471)
Deletions 17 (9.66%) 8 (3.05%) Doesn’t mean he's /∅ stupid. (not → ∅, 4358)
Stress/Intonation 3 (1.70%) 0 By the way how ulˈtimate is that? (ˈul.ti.mate, 354)
Substitutions 140 (79.55%) 221 (84.35%) Do you want tomato sauce with some 7 cheese
lasagnas? (ravioli → lasagnas, 1626)
Online errors at the word level have far less additions and deletions, and more blends.
Interpretation: blends are far more salient (cf. exchanges) and thus agains how a greater tendency to collect highly salient errors.

Experiment 2: word errors by part of speech
29
Offline Online
Nouns 27 (27.27%) 101 (51.53%)
Verbs 25 (25.25%) 50 (25.51%)
Adjectives 9 (9.09%) 19 (9.69%)
Names 16 (16.16%) 13 (6.63%)
Pronouns 15 (15.15%) 10 (5.10%)Prepositions 7 (7.07%) 3 (1.53%)
Totals 99 196
• Online word errors are less balanced than offline errors across part of speech categories, with a majority of nouns.
• Online errors also seem to obey the category constraint to a greater degree (88.78%) than offline errors (84.85%), not sig.

Experiment 2: summary of important differences
30
Sound errors• Online errors have more corrected errors than offline errors. • Online has a stronger repeated phoneme effect than offline errors.* • Online errors have a stronger lexical bias than offline errors.(*) • Online errors have a weaker word-onset effect than offline errors.* • Online errors are more likely to be contextual than offline errors.* • Online errors have more perseverations and exchanges than offline
errors.* • Online sound substitutions are more symmetric and more concentrated in
a small number of substitutions than offline errors, which are more diffuse and asymmetrical.*
Word errors• Online errors have less additions and deletions and more blends than
offline errors.* • Online word substitutions are much more likely to be in nouns than offline
errors, which are more diffuse across lexical and function categories.* • Online errors tend to respect the category constraint more than offline
errors. * = significant association from chi square test

Does it matter?
31
Sound substitutionsExample: s →z… pulled back the /[zlip]= sleeping bag. (4708)
Different models make very different predictions:
Shattuck-Hufnagel & Klatt (1979), symmetric: s → z = z → s
Dell (1986), asymmetric, frequency bias: z → s > s → z
Stemberger (1991), asymmetric, frequency and anti-frequency biases: s → z > z → s
Goldrick and Larson (2010), asymmetric, frequency and markedness

Sound substitutions: online vs. offline top tens
32
Offline (n =140) Online (n = 257)p → b 7 r → l 24s → ʃ 7 s → ʃ 14k → t 5 l → r 13n → d 4 m → n 9k → g 4 n → m 6w → r 4 ʃ → s 6z → s 4 k → t 6m → b 3 p → b 5m → n 3 b → d 5p → t 3 n → l 5
31.43% of total 36.17% of total
Differences: • Online substitutions are more
symmetric; three of online top ten have symmetric counterparts (with color labels), but offline top ten has none, as is thus more asymmetrical
• Online top ten is more concentrated in certain substitutions, offline top ten is more diffuse, with a greater percentage of substitutions outside the top ten
Take home: collection methodology has potential for providing new evidence about output biases, and the theories built on these biases.

Data discovery: new directions
33
Question: what new directions might the SFUSED methodology lead speech error research into?
Common complaint: “there’s not enough context to evaluate this claim” • MacDonald 2016: need more context to determine if more errors in longer/more
complex speech • Bock 2011: need acoustic record to determine if syntactic shifts preserve phrase stress • Details of pause durations to understand editing terms
Speech rate effectsExistence of actual recordings supports measures of speech rate, can therefore test myriad of claims about speech rate and error patterns:
• repeated phoneme effect • lexical bias • relative frequency of error types • trade-off between accuracy and speech rate
Exploration of phonetic structureRecent research has shown that fine-grained phonetic detail is necessary to understand the distinction between phonetic and phonological speech errors (e.g., Frisch & Wright 2002). Audio recordings support some of this research.

Data discovery: the frequency of speech errors
34
Question: how common are speech errors? Are they an odd pre-occupation of a few psycholinguists or a valid source of evidence?
Study Minutes Per Error
Garnham et al. 1981 5.93
Chen 1999, 2000 4.86
Ferber 1991 0.88
Garnham et al. 1981: “There is no pretence that all slips of tongue in the corpus have been listed. Thus the estimate of the frequency of speech errors in conversation is a conservative one.”
Insight: prior estimates are based on found errors, but no effort is made to calculate missed errors, which are abundant.

Data discovery: capture-recapture
35
Capture-recapture methods (Chao 2001): common tool used in ecology to estimate animal populations when exhaustive search is impossible or impractical. Involves multiple samples, marking of individuals, and calculating population size as a function of sample convergence.
Parallel: speech errors are just like intractable ecology problems; too time-consuming (impossible?) to catch them all, thus need some way to calculate missed errors; many statistical problems in capture-recapture resemble the problem with speech errors.
Problem: calculations of a population size requires homogeneity, but speech errors are not homogeneous, so can only estimate the lower bound (Mao et al. to appear)
→ Using Mao et al’s formula, can estimate missed errors, and make a more realistic estimate of actual occurrence of speech errors.

Data discovery: capture-recapture, results
36
Seconds A B C AB AC BC ABC n m̃ ṽ SPE
2,100 2 18 3 2 0 3 5 33 16.3 49.3 42.60
1,690 6 5 4 5 0 2 9 31 13.48 44.48 38.00
1,993 2 9 5 1 0 1 5 23 20.08 43.08 46.26
2,385 6 6 5 8 2 1 5 33 11.7 44.70 53.36
4,143 24 9 1 5 1 1 3 44 21.84 65.84 62.93
3,000 9 2 7 3 5 1 2 29 10.63 39.63 75.70
1,800 9 9 3 2 0 1 1 25 29.87 54.87 32.81
2,377 15 2 4 3 2 1 3 30 13.39 43.39 54.78
2,400 18 4 6 1 2 0 7 38 41.93 79.93 30.03
Finding: using the three independent samples from experiment 1 yields a set of SPE (seconds per error) lower bound values, averaging across all nine values gives an SPE of 48.5 seconds. But this is a lower bound estimate, and indeed, additional data on some of these recordings shows actual count is higher, so SPE must be lower.
Up-shot: this is the first study to ever estimate ‘missed errors’, so more realistic estimate. Strongly suggests that speech errors are not aberrant behaviour that can be ignored, but part regular and important of spontaneous speech.

Thank you!
37
Data collectors: Rebecca Cho, Gloria Fan, Holly Wilbee, Jennifer
Williams, and two other research assistants.
Comments welcome: PDF of this paper is available at:
anderei.net/publications