investigating factors impacting on restaurants' competitive
TRANSCRIPT
Kuwait Chapter of Arabian Journal of Business and Management Review Vol. 4, No.8; April. 2015
1
INVESTIGATING FACTORS IMPACTING ON RESTAURANTS’ COMPETITIVE POSITIONING: A STUDY OF 3 FOOD OUTLETS AT
O.R. TAMBO INTERNATIONAL AIRPORT, JOHANNESBURG
Sithembile Dube
Graduate of the Regent Business School, Durban, Republic of South Africa Xolelwa Linganiso
Academic and Dissertation Supervisor, Regent Business School, Durban, Republic of South Africa Anis Mahomed Karodia (PhD)
Professor, Senior Academic and Researcher, Regent Business School, Durban, Republic of South Africa
ABSTRACT Competitive positioning has become an important facet of any 21st century contemporary organization that seeks to not only survival but be sustainable. There is fierce competition from the business environment both locally and globally and those organizations that position themselves well will thrive. This study was primarily conducted to evaluate factors that were responsible for the competitive positioning of Capello, KFC, and Piece-a-pizza restaurant outlets situated at OR Tambo International Airport. A survey approach was adopted for this study which utilized a quantitative method of collection and analysis of data. The research gave out 90 questionnaires to respondents, who were primarily drawn from the respective restaurant outlets, and a total of 80 questionnaires were returned, and 8 were spoilt hence excluded from this study. The study realized 80% response rate which was sufficient to reach the conclusions of this study. This study revealed that food quality and speed of service were predominantly critical attributes responsible for customer selection of the restaurant outlets at the OR Tambo International terminal. It was recommended that management of the three restaurant outlets should act without further delay to ensure that its food quality and speed of service are prioritized as key drivers of competitive positioning and that focus should also be placed on employee engagement. Key Words: Factors, Restaurants, Competitive Positioning, Outlets, Airport, Management
INTRODUCTION Capello, Kentucky Fried Chicken (KFC), and Piece-a-pizza are restaurants located at OR Tambo international airport. These restaurants form a consortium of franchised firms operating under the auspices of one company known as Kasamira Trading 60 Pvt Ltd. Capello franchise was established in 2000. Capello envisages a subtle casual and delicious atmosphere. The divine delicacy and chemistry of both its feminine flair and macho ambition creates a tantalizing social arena. Capello seeks to intrigue and stir elegance and enchantment of an era that is enticed by sandwiches, pastas, grills and burgers. Kentucky Fried Chicken (KFC) is a popular fast-food restaurant, which originated in the United States of America (USA), and has been operating in South Africa for the past four
Kuwait Chapter of Arabian Journal of Business and Management Review Vol. 4, No.8; April. 2015
2
decades. The strengths of this restaurant are that it is a well-known and popular brand, with a sizeable loyal customer group. However, KFC’s main challenge is that it is failing to break even as a strategic business unit. Hence it is not a profitable operation at present. Like KFC, Piece-a-pizza is a restaurant franchise with origins in the USA. It specialises in making various flavours of pizza. This restaurant specialises in gourmet style pizzas; and the menu features a variety of pizza, an assortment of muffins, toasted sandwiches, sweets, and drinks. Its main challenges include the franchise agreement, fluctuating turnover, high airport rentals, loss of market share, pricing and customers, inconsistent government policy through Airports Company of South Africa (ACSA), and undefined customer base. This study reviews the competitive positioning of these three restaurants within their industry and location. In so doing, it determines their performance and underlying causes. Furthermore, it proposes strategies for improving their performance. This introductory chapter introduces the study; it provides the background, the purpose of the study, the objectives and the questions underpinning the study, the statement of the problem and also the theoretical foundation of the study. Aim of the Study The aim of this study to investigate the factors that impact on the competitive position of selected restaurant outlets, Capello, KFC, and Piece-a-pizza, at OR Tambo international airport so as to help develop strategies that ensure their survival and sustainable competitive advantage. Objectives of the Study The objectives of the study are:
1) To examine the factors that impact on competitive position of Capello, KFC, and Piece-a-pizza at OR Tambo International Airport;
2) to determine the challenge of competitive positioning of Capello, KFC, and Piece-a-pizza at OR Tambo International Airport;
3) to examine employee willingness and efforts to attract more customers; and 4) To recommend approaches to enhance competitive positioning of Capello, KFC, and
Piece-a-pizza at OR Tambo International Airport.
LITERATURE REVIEW Conceptual Framework This section presents the conceptual framework to this study, in which the independent and dependent variables and resultant impacts are identified.

Kuwait Chapter of Arabian Journal of Business and Management Review Vol. 4, No.8; April. 2015
3
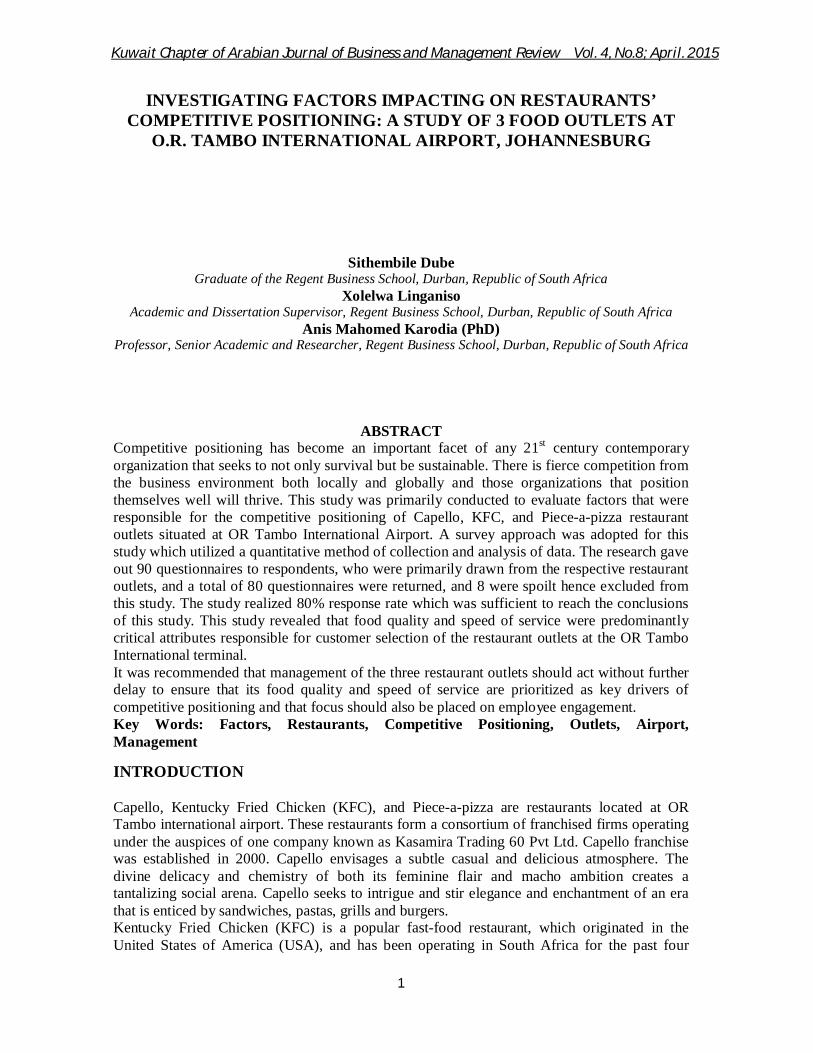
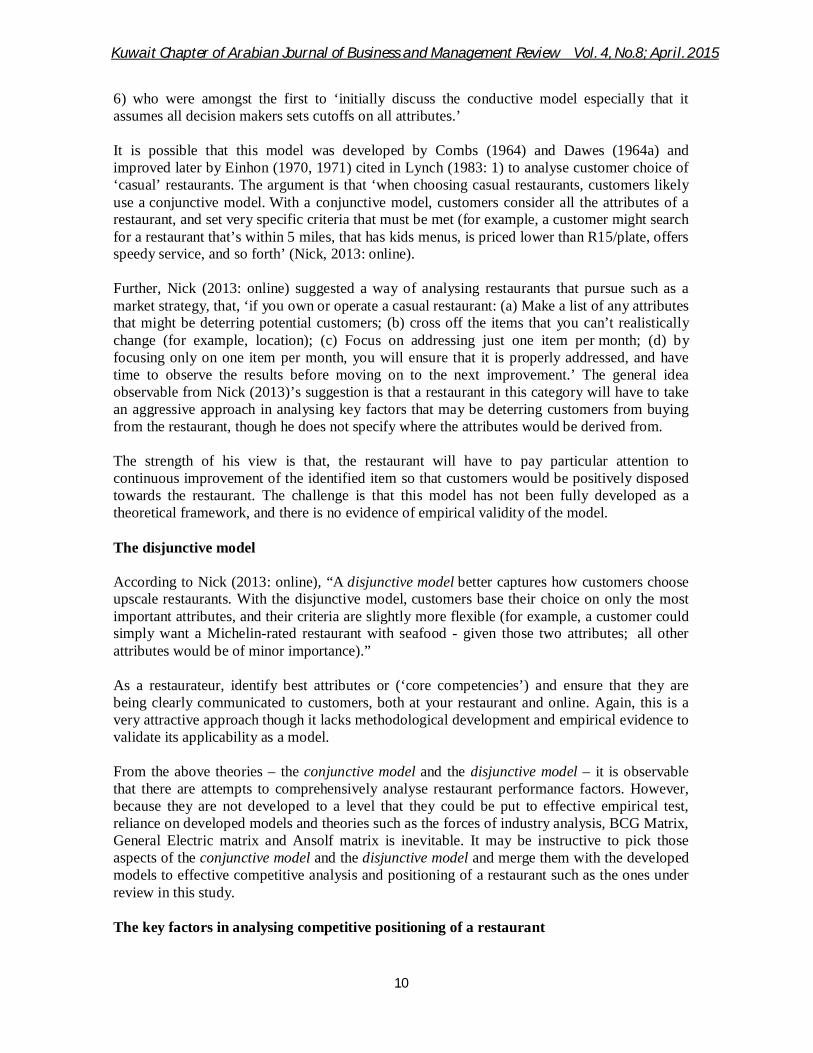
Figure 2.1 Theoretical framework – competitive positioning of a restaurant establishment
Dependent Variables Independent Variables Impact
As illustrated in figure 2.1, in which the independent and dependent variables and resultant impacts are identified. This study’s conceptual model identified dependent variables to include the following factors: industry analysis and attractiveness, business planning, relationship marketing, product quality, service quality, product pricing, restaurant atmosphere, restaurant location, promotional strategies, and community engagement. The independent variables include restaurant competitiveness, employee motivation, customer satisfaction and loyalty, market leadership and profitability, and finally the impacts of both dependent and independent variables include: business growth, market share, business survival and business sustainability. According to Du Plooy-Colliers et al. (2014: 87), ‘independent variables are likely to cause an effect, and in essence of an independent variable which is manipulated by the researcher to test the effect this change or manipulation will have on the dependent variable. The dependent variable is affected by the independent variable, and as such, a dependent variable will change as a result of the independent variable being manipulated by the researcher.
Industry analysis and attractiveness
Business planning
Relationship marketing
Product quality
Service quality
Restaurant
competitiveness
Employee motivation
Customer satisfaction
Market leadership
Profitability
Business
growth
Market share
Business
survival
Business sustainability
Product pricing
Restaurant atmosphere
Restaurant location
Promotional strategies
Community engagement
Source: Adapted from Paulrajan and Rajkumar (2011:41)
Kuwait Chapter of Arabian Journal of Business and Management Review Vol. 4, No.8; April. 2015
4
The conceptual framework illustrates those elements which are responsible for the establishment of a competitive restaurant facility. Conducting this study will ensure the following output: (i) show the causes of low business in restaurants at the airport; (ii) bring out a comprehensive list of factors that are responsible for developing a competitive position for restaurant businesses at the airport; (iii) show a comparative picture of those factors that are specific to each of the restaurants, that is, Capello, KFC, and Piece-a-pizza; (iv) Enhance the development of a competitive position for the selected restaurants after an in-depth analysis of the factors that will emerge from the data and findings of this study, and (v) contribute to the body of knowledge on literature relating to competitive positioning of restaurants, in a busy airport like OR Tambo International Airport. This study also provides a comprehensive set of recommendations that may be useful for the development of business strategy for the business leaders in charge of Capello, KFC, and Piece-a-pizza restaurant outlets.
Competitive Positioning of Restaurant Establishments There is a lack of a universally accepted definition of concepts such as competitive positioning and an established methodological framework for conducting a comprehensive analysis of the performance of restaurant establishments. As such the models adopted for this study are chosen because they are not too remote from the subject under consideration, and they are more appropriate in aiding the unravelling of the key considerations on competitive positioning. Drawing on Porter’(1980), cited in Thompson, Strickland and Gamble (2008: 54) the five competitive forces model, BCG matrix, the General electric and Ansolf matrix are the general models that are reviewed in this study. This follows an analysis of two models of consumer behaviour which have been used to analyse factors influencing customer choice of a restaurant: the conjunctive model and the disjunctive model. A combination of these sets of models may shed light on factors responsible for competitive positioning of a restaurant. It is anticipated that considering such models in this study will lead to the discovery of those that specifically influence a change in the fortunes of Capello, KFC, and Piece-a-pizza outlets which are currently in dire straits.
According Thompson et al. (2008: 96), competitive positioning could also be a demonstration of how well a company’s strategy is working. It in fact gives rise to the following indicators, amongst others: Whether the firm’s sales are growing faster, slower, or about the same pace as the market as
a whole thus resulting in a rising, eroding, or stable market share; whether the company is acquiring new customers at an attractive rate as well as retaining
existing customers; whether the firm’s profit margins are increasing or decreasing and how well its margins
compare to rival firms’ margins; trends in the firm’s net profits and return on investment and how these compare to the same
trends for other companies in the industry; whether the company’s financial strength and credit rating are improving or on the decline; whether the company can demonstrate continuous improvement in such internal
performance measures as days of inventory, employee productivity, unit cost, defect rate, wastage rate, misfiled orders, delivery times, warrant costs and so on;
how the shareholders view the company based on trends in the company’s stock price and shareholder value (relative to the stock price of trends at other companies in the industry;
the firm’s image and reputation with its customers;
Kuwait Chapter of Arabian Journal of Business and Management Review Vol. 4, No.8; April. 2015
5
how well the company stacks up against rivals on technology, product innovation, customer service, product quality, delivery time, price, getting newly developed products to market quickly and other relevant factors on which buyers base their choice of brands.’
Looking closely at the foregoing list one can envisage an inevitable link between what a company does in terms of its strategy and the outcomes it generates through its strategy. It can be concluded that when a company is doing badly on any of the above items, it has a weak strategy and may require radical changes in the corporate formulations. An example in this study is Piece-a-Pizza performing below the target on its sales, falling below the planned targets relative to other competing firms at OR Tambo International Airport over a period of three subsequent years since 2011. Thompson et al. (2008:97), actually posit that ‘the stronger the company’s current overall performance, the less likely the need for radical changes in strategy. Consequently, the weaker a company’s financial performance and market standing, the more its current strategy must be questioned. Weak performance is almost a sign of a weak strategy, weak execution or both.’ The latter description may be in line with the current performance of Capello, KFC, and Piece-a-Pizza restaurants and, as such, it may be instructive for the management of these restaurant establishments to engage in extensive business analysis and planning that should end with radical changes in corporate strategy. This is the only way of ensuring not only better competitive positioning but also improved or turn around in financial performance and market standing. Factors that impact on competitive position of restaurant establishments The main challenge in this study is that there is no list of factors that are generally accepted as responsible for competitive positioning of a restaurant. This study therefore relies on studies conducted by prominent experts in the field of competitive strategy such as Michael Porter, the BCG matrix, Ansolf matrix model and General electric models to try and unearth those factors which may be applicable to the restaurant industry. The restaurants under discussion are facing enormous competition from some well-placed brands such as Nandos, Mug n Bean, and Wimpy, which target the same market space. To operate competitively in such a set up requires not only industry level competitiveness but also business strategy and robust product positioning. These are discussed in light of the above mentioned theoretical frameworks beginning with Porter.
On record “since 1998 Debonnairs Pizza was awarded the prestigious industry award of Franchisor of the year FASA (Franchising Association of Southern Africa), subsequently in 1999 Debonnairs Pizza won the FASA Brand Builder of the year award. At this point the brand was ranked amongst the top 10 in the country and had experienced growth of more than 203% a year. Again in 2000 Debonnairs Pizza was awarded the FASA Franchisor of the year and in 2001 Debonnairs again won FASA Brand Builder of the year (Cant and Machado, 2009:76). With such a record it is highly likely that when South Africans think of Pizza, Debonnairs and not Piece-a-pizza comes to mind. The Industry Attractiveness/Business Strength matrix The General Electric matrix also known as “The industry attractiveness/Business Strength” matrix or the “Directional Policy” matrix overcomes some of the disadvantages of the Boston matrix by incorporating more factors and allowing three levels for each dimension. This matrix has two composite dimensions: “industry attractiveness” and “business strength” (Smith, 2011:332). ‘The General Electric matrix’s five dimensions under industry attractiveness: (1) market forces includes size, growth, price sensitivity, and bargaining position; (2) competition incorporates types of competitors or substitution by new technology; (3) financial and economic factors which includes economies of scale, profits, entry and exit barriers; (4)
Kuwait Chapter of Arabian Journal of Business and Management Review Vol. 4, No.8; April. 2015
6
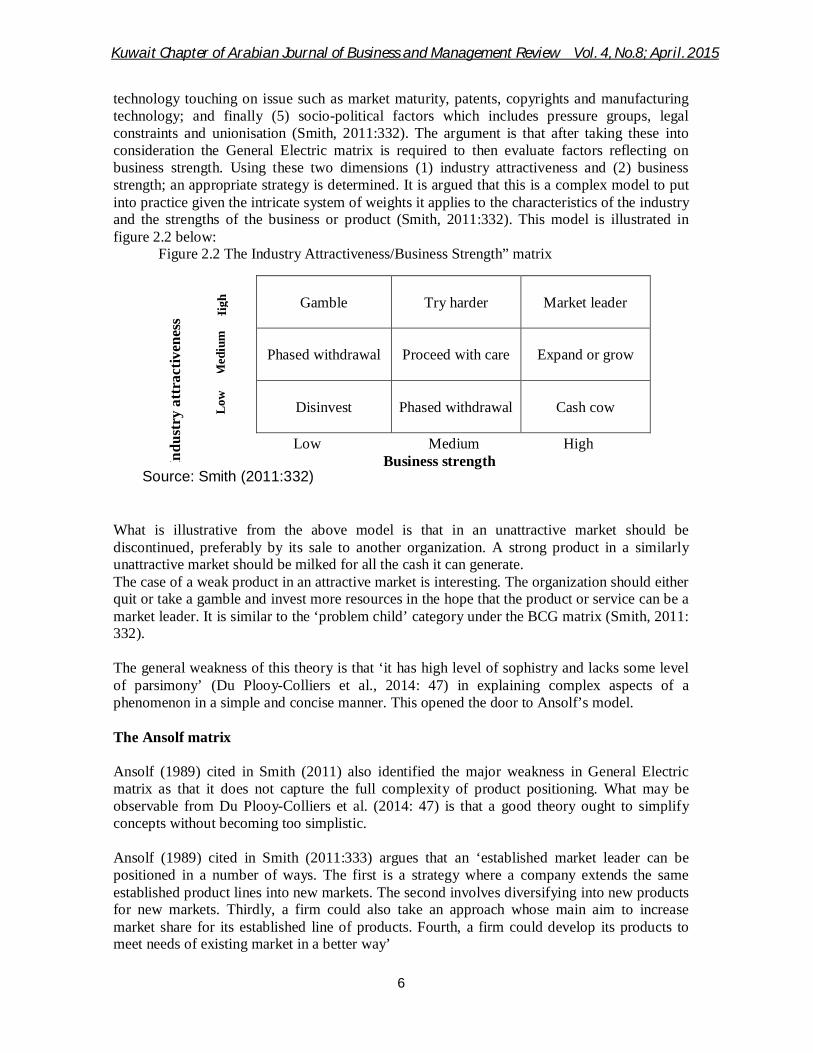
technology touching on issue such as market maturity, patents, copyrights and manufacturing technology; and finally (5) socio-political factors which includes pressure groups, legal constraints and unionisation (Smith, 2011:332). The argument is that after taking these into consideration the General Electric matrix is required to then evaluate factors reflecting on business strength. Using these two dimensions (1) industry attractiveness and (2) business strength; an appropriate strategy is determined. It is argued that this is a complex model to put into practice given the intricate system of weights it applies to the characteristics of the industry and the strengths of the business or product (Smith, 2011:332). This model is illustrated in figure 2.2 below:
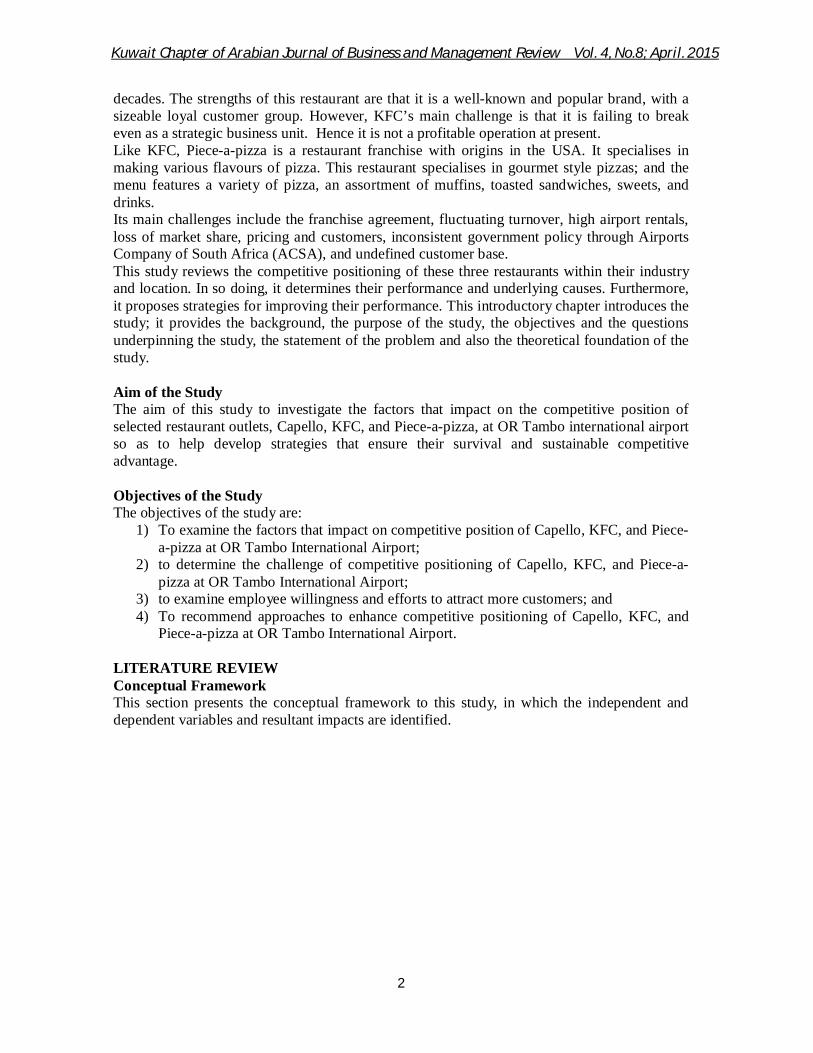
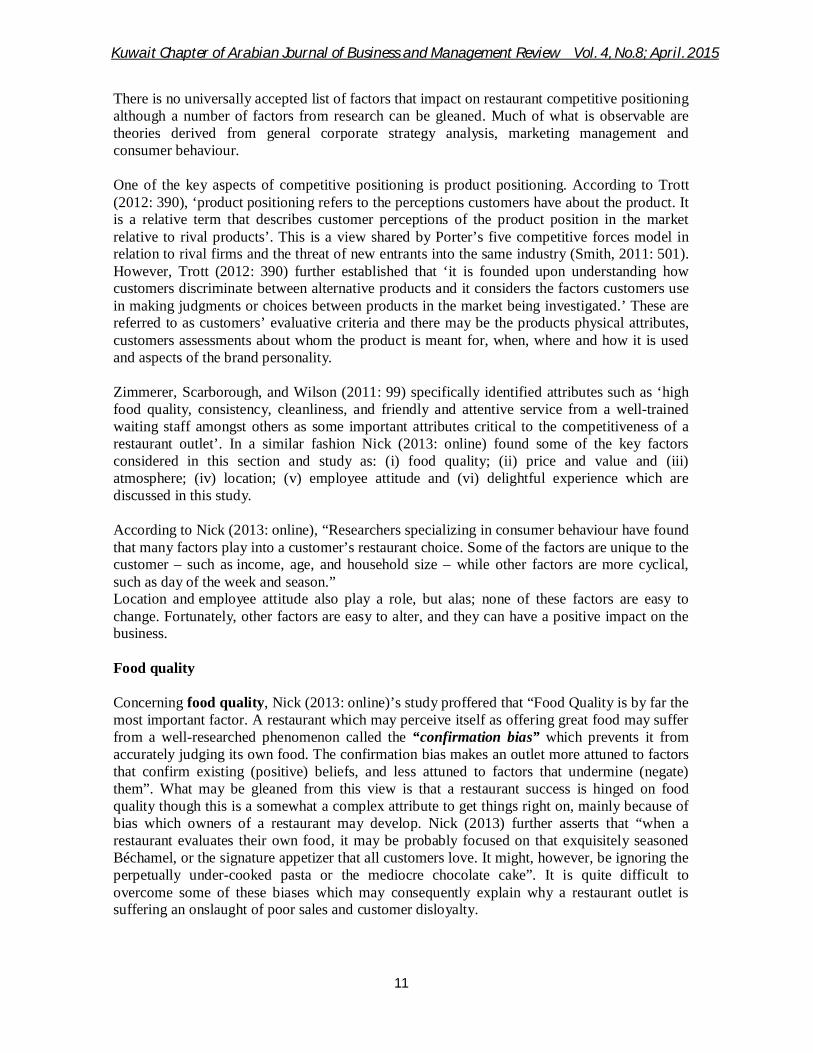
Figure 2.2 The Industry Attractiveness/Business Strength” matrix
Low Medium High Business strength
What is illustrative from the above model is that in an unattractive market should be discontinued, preferably by its sale to another organization. A strong product in a similarly unattractive market should be milked for all the cash it can generate. The case of a weak product in an attractive market is interesting. The organization should either quit or take a gamble and invest more resources in the hope that the product or service can be a market leader. It is similar to the ‘problem child’ category under the BCG matrix (Smith, 2011: 332).
The general weakness of this theory is that ‘it has high level of sophistry and lacks some level of parsimony’ (Du Plooy-Colliers et al., 2014: 47) in explaining complex aspects of a phenomenon in a simple and concise manner. This opened the door to Ansolf’s model. The Ansolf matrix
Ansolf (1989) cited in Smith (2011) also identified the major weakness in General Electric matrix as that it does not capture the full complexity of product positioning. What may be observable from Du Plooy-Colliers et al. (2014: 47) is that a good theory ought to simplify concepts without becoming too simplistic. Ansolf (1989) cited in Smith (2011:333) argues that an ‘established market leader can be positioned in a number of ways. The first is a strategy where a company extends the same established product lines into new markets. The second involves diversifying into new products for new markets. Thirdly, a firm could also take an approach whose main aim to increase market share for its established line of products. Fourth, a firm could develop its products to meet needs of existing market in a better way’
Gamble
Try harder
Market leader
Phased withdrawal
Proceed with care
Expand or grow
Disinvest
Phased withdrawal
Cash cow
Hig
h
Indu
stry
att
ract
iven
ess
Med
ium
Lo
w
Source: Smith (2011:332)
Kuwait Chapter of Arabian Journal of Business and Management Review Vol. 4, No.8; April. 2015
7
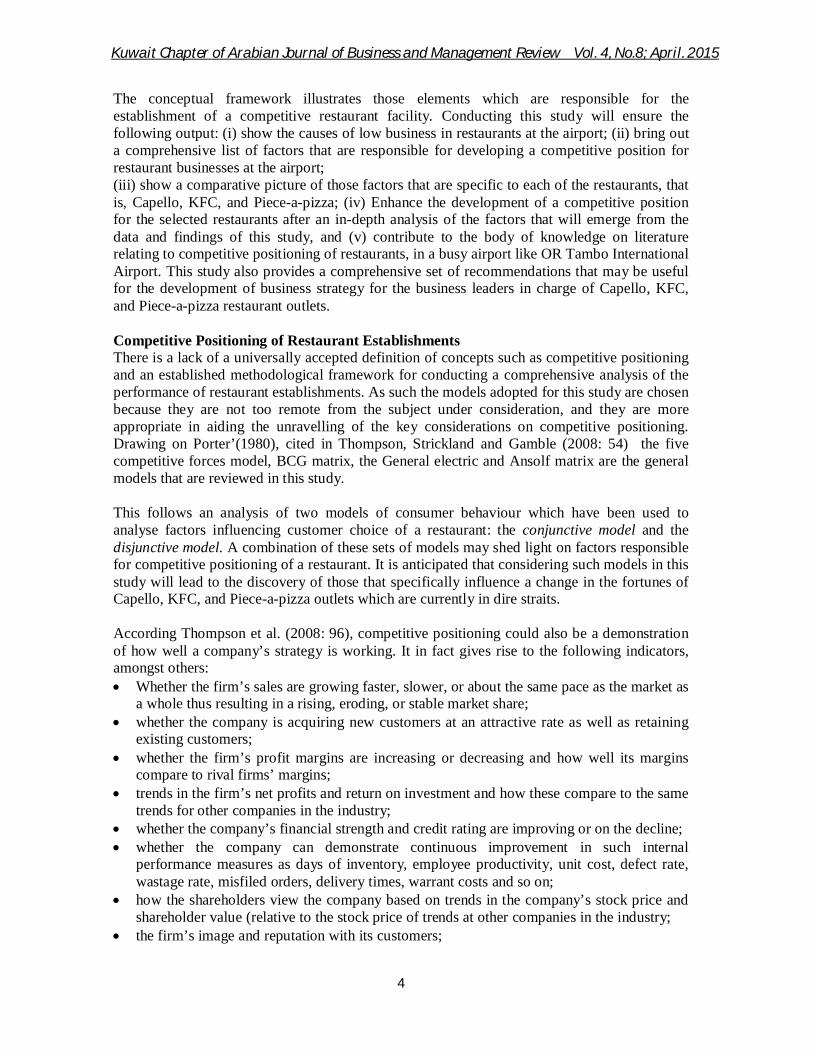
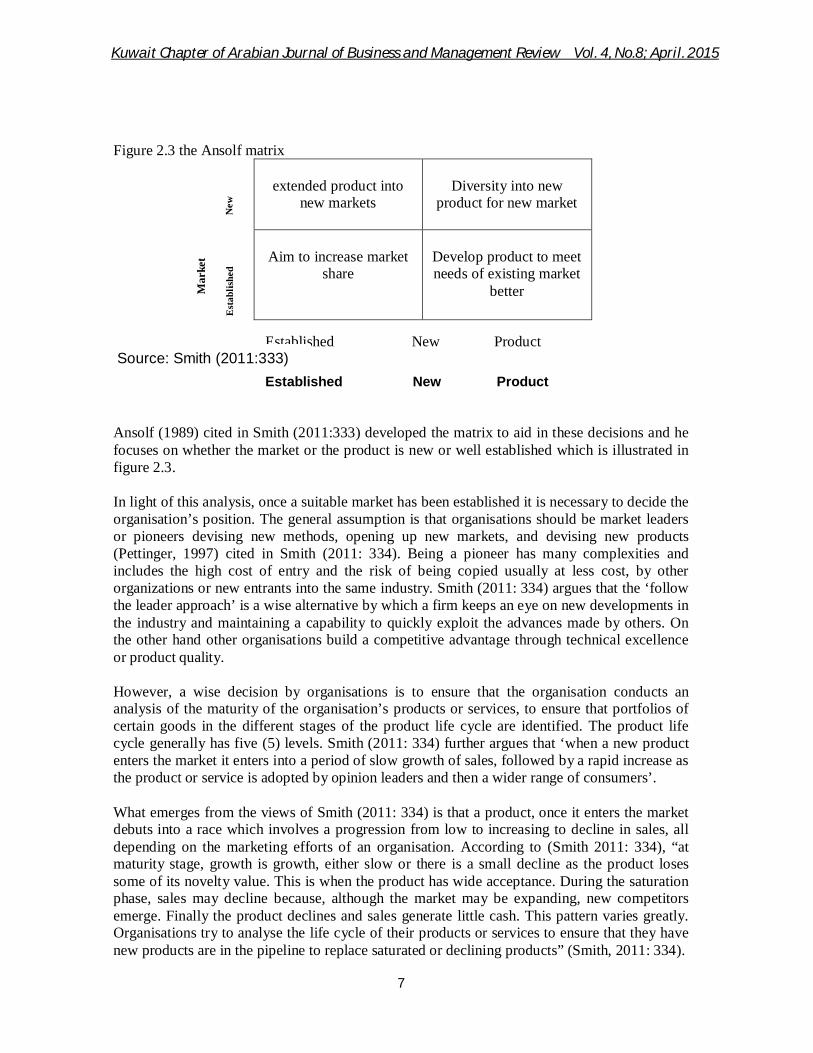
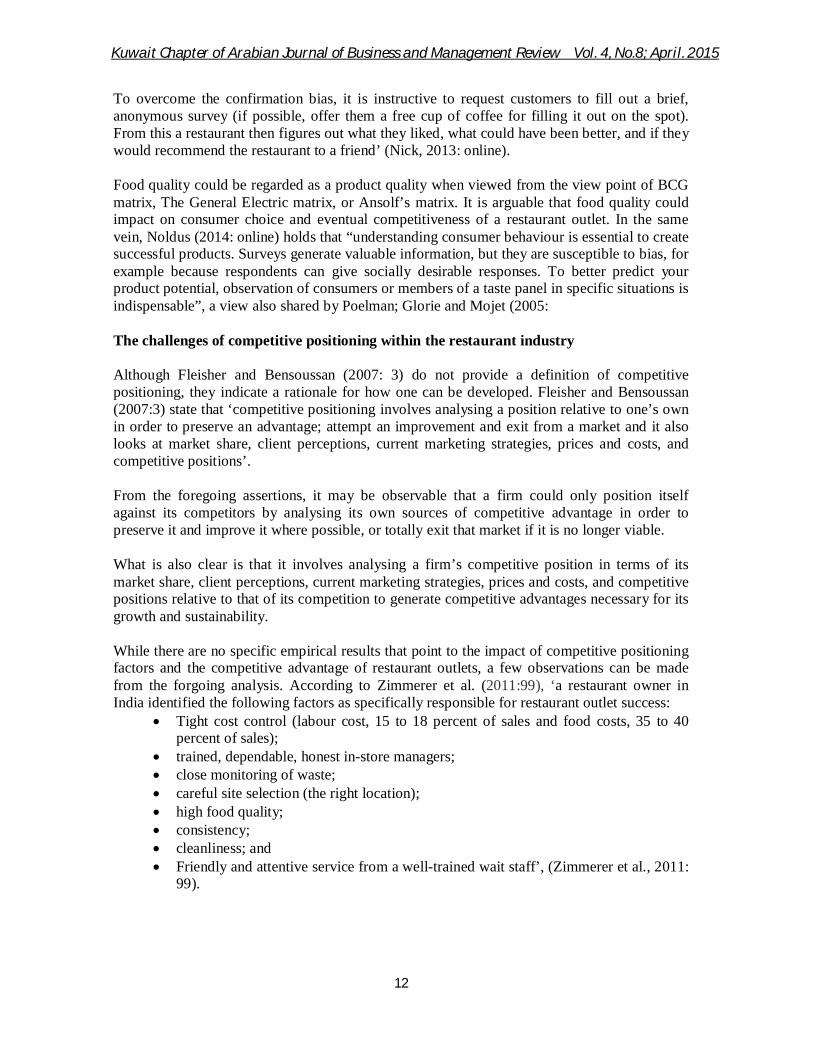
Figure 2.3 the Ansolf matrix
extended product into
new markets
Diversity into new
product for new market
Aim to increase market
share
Develop product to meet needs of existing market
better
Ansolf (1989) cited in Smith (2011:333) developed the matrix to aid in these decisions and he focuses on whether the market or the product is new or well established which is illustrated in figure 2.3. In light of this analysis, once a suitable market has been established it is necessary to decide the organisation’s position. The general assumption is that organisations should be market leaders or pioneers devising new methods, opening up new markets, and devising new products (Pettinger, 1997) cited in Smith (2011: 334). Being a pioneer has many complexities and includes the high cost of entry and the risk of being copied usually at less cost, by other organizations or new entrants into the same industry. Smith (2011: 334) argues that the ‘follow the leader approach’ is a wise alternative by which a firm keeps an eye on new developments in the industry and maintaining a capability to quickly exploit the advances made by others. On the other hand other organisations build a competitive advantage through technical excellence or product quality.
However, a wise decision by organisations is to ensure that the organisation conducts an analysis of the maturity of the organisation’s products or services, to ensure that portfolios of certain goods in the different stages of the product life cycle are identified. The product life cycle generally has five (5) levels. Smith (2011: 334) further argues that ‘when a new product enters the market it enters into a period of slow growth of sales, followed by a rapid increase as the product or service is adopted by opinion leaders and then a wider range of consumers’.
What emerges from the views of Smith (2011: 334) is that a product, once it enters the market debuts into a race which involves a progression from low to increasing to decline in sales, all depending on the marketing efforts of an organisation. According to (Smith 2011: 334), “at maturity stage, growth is growth, either slow or there is a small decline as the product loses some of its novelty value. This is when the product has wide acceptance. During the saturation phase, sales may decline because, although the market may be expanding, new competitors emerge. Finally the product declines and sales generate little cash. This pattern varies greatly. Organisations try to analyse the life cycle of their products or services to ensure that they have new products are in the pipeline to replace saturated or declining products” (Smith, 2011: 334).
New
Mar
ket
Est
ablis
hed
Established New Product
Established New Product Source: Smith (2011:333) (2011:333) (2011:333)
Kuwait Chapter of Arabian Journal of Business and Management Review Vol. 4, No.8; April. 2015
8
Constant analysis of product performance is required alongside other concepts like BCG matrix to ascertain what stage a product is in. It could be where a product has reached a stage of being a ‘dog’ which is basically decline, because of saturation, where it is required to may be divest out of such a product. This may be required by organisations in the restaurants sub-industry such as Capello, KFC, and Piece-a-pizza to become more sustainable. The BCG matrix model
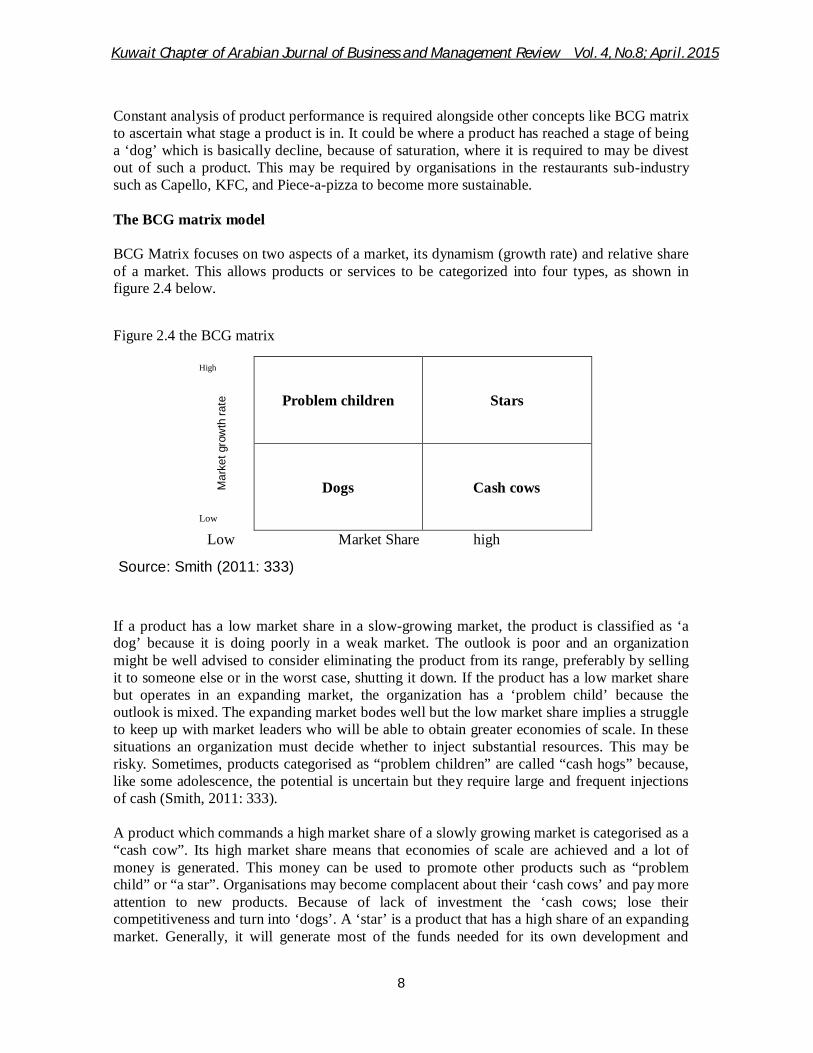
BCG Matrix focuses on two aspects of a market, its dynamism (growth rate) and relative share of a market. This allows products or services to be categorized into four types, as shown in figure 2.4 below.
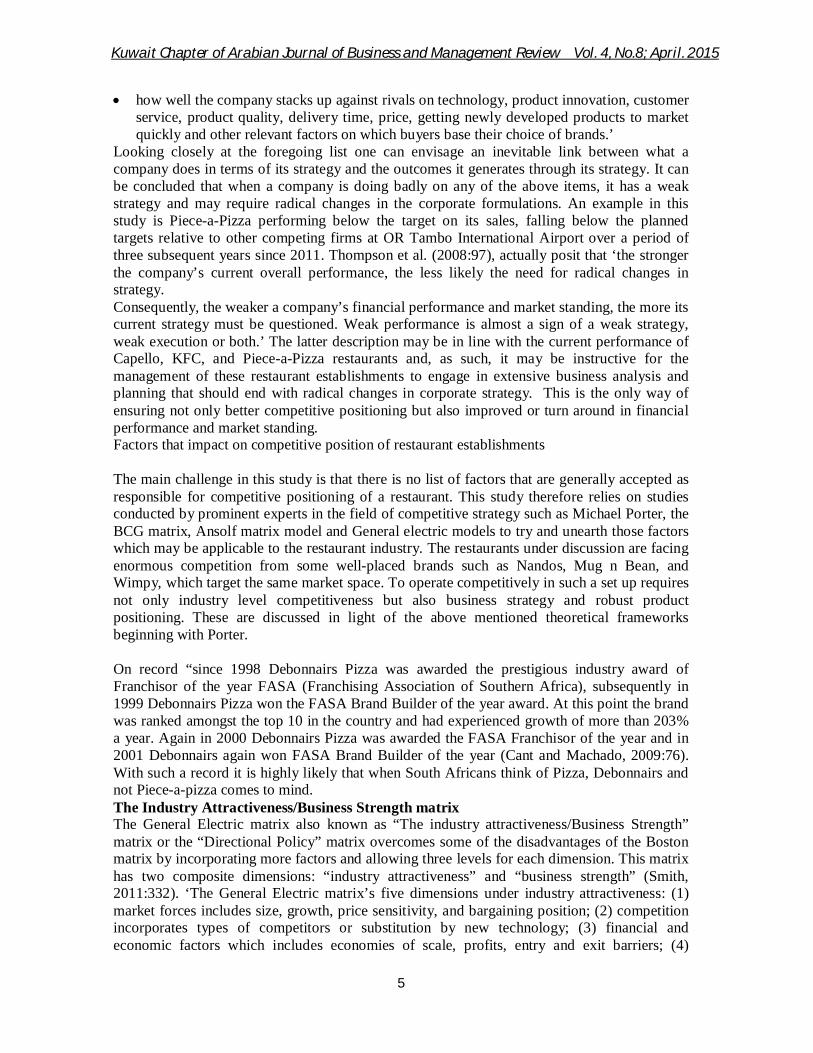
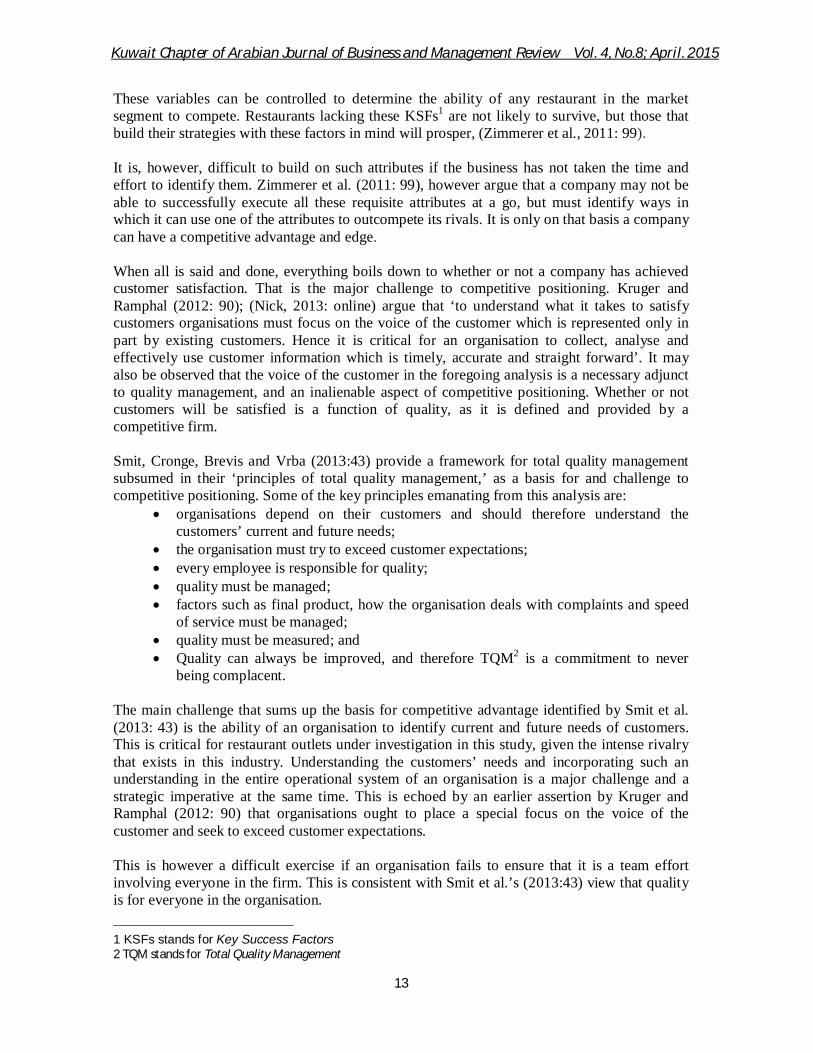
Figure 2.4 the BCG matrix
Problem children
Stars
Dogs
Cash cows
Low Market Share high
If a product has a low market share in a slow-growing market, the product is classified as ‘a dog’ because it is doing poorly in a weak market. The outlook is poor and an organization might be well advised to consider eliminating the product from its range, preferably by selling it to someone else or in the worst case, shutting it down. If the product has a low market share but operates in an expanding market, the organization has a ‘problem child’ because the outlook is mixed. The expanding market bodes well but the low market share implies a struggle to keep up with market leaders who will be able to obtain greater economies of scale. In these situations an organization must decide whether to inject substantial resources. This may be risky. Sometimes, products categorised as “problem children” are called “cash hogs” because, like some adolescence, the potential is uncertain but they require large and frequent injections of cash (Smith, 2011: 333).
A product which commands a high market share of a slowly growing market is categorised as a “cash cow”. Its high market share means that economies of scale are achieved and a lot of money is generated. This money can be used to promote other products such as “problem child” or “a star”. Organisations may become complacent about their ‘cash cows’ and pay more attention to new products. Because of lack of investment the ‘cash cows; lose their competitiveness and turn into ‘dogs’. A ‘star’ is a product that has a high share of an expanding market. Generally, it will generate most of the funds needed for its own development and
High
Mar
ket g
row
th ra
te
Low
Source: Smith (2011: 333)
Kuwait Chapter of Arabian Journal of Business and Management Review Vol. 4, No.8; April. 2015
9
promotion, but from time to time, this may need supplementing by injections of resources from a ‘cash cow’ (Smith, 2011: 333).
What is also observable from the BCG matrix is that an organisation needs to analyse the competitive position of its products, and categorise them into ‘dogs’, ‘cash cows’, ‘stars’ and ‘problem children’. This implies that strategic decisions taken by the company are based on whether the product is in a high growth rate and also has high market share. If it is losing market share and not growing, it is not worth keeping. Dogs for instance ought to be disengaged and disregarded. Despite the popularity of the BCG matrix it has not gone unchallenged or un-scrutinised. According to Morrison and Wensley (1991) cited in Smith (2011: 332) the Boston matrix provides a reasonable basis for the allocation of development funds, though it has its own disadvantages. It oversimplifies markets by focusing upon just two aspects: market growth and market share. This may lead an organisation to ignore important aspects. Moreover the Boston matrix simplifies the two dimensions into just two crude categories: high and low (Smith, 2011: 332). While the criticism shed light on some of the weaknesses in theories like Boston matrix the downside of such analysis is that it does not proffer alternative approaches, which is equally a weak approach. As a basis for conclusion, Morrison and Wensley (1991) and (Haspeslagh, 1982) both cited in Smith (2011: 332) never suggest more dimensions beyond just ‘market growth’ and ‘market share’ and the so called crude categories: high and low and this leaves any analysis lope sided and weak. What may be observable is that for a product amongst those of Capello, KFC, and Piece-a-pizza, it may be critical for senior managers to subject them to a review that tests whether or not they still have high or low market share and also high and low growth rate so as to determine what strategic decision to take regarding each of them. If any have reached a ‘dog’ status then it may be wise to disinvest in them, and if they have reached a ‘problem child’ status, one decides whether they are worth injecting funds to promote them to gain more market share.
Capello, KFC, and Piece-a-pizza’s key products should be put to the test utilising the BCG matrix. Piece-a-pizza can be analysed in terms of market share and growth potential compared to brands such as Debonnairs which are well established in the South Africans’ minds. Another factor is analysing the organisations themselves, that is, Capello, KFC, and Piece-a-pizza, and sees how they fare on the Porter’s competitive scale. In reviewing specific literature regarding competitive positioning factors of a restaurant, two broad theories emerged in this study, namely: the conjunctive model and the disjunctive model. These focus on consumer behaviour which leads to the choice of a restaurant, without looking at what causes competitive positioning within an industry and also do not look at business level analysis. They however shed light on product level positioning in a restaurant, which is why this study considered them worthwhile to review. These are discussed with a view to review their role in bringing out the factors attendant to the competitive positioning of restaurants, and in particular, which of those would be more applicable to the subject under discussion in this study.
The conjunctive model There is no evidence as to the original author of the conjunctive model though inferential suggestions by Lynch (1983) point to Combs (1964) and Dawes (1964a) cited in Lynch (1983:
Kuwait Chapter of Arabian Journal of Business and Management Review Vol. 4, No.8; April. 2015
10
6) who were amongst the first to ‘initially discuss the conductive model especially that it assumes all decision makers sets cutoffs on all attributes.’
It is possible that this model was developed by Combs (1964) and Dawes (1964a) and improved later by Einhon (1970, 1971) cited in Lynch (1983: 1) to analyse customer choice of ‘casual’ restaurants. The argument is that ‘when choosing casual restaurants, customers likely use a conjunctive model. With a conjunctive model, customers consider all the attributes of a restaurant, and set very specific criteria that must be met (for example, a customer might search for a restaurant that’s within 5 miles, that has kids menus, is priced lower than R15/plate, offers speedy service, and so forth’ (Nick, 2013: online).
Further, Nick (2013: online) suggested a way of analysing restaurants that pursue such as a market strategy, that, ‘if you own or operate a casual restaurant: (a) Make a list of any attributes that might be deterring potential customers; (b) cross off the items that you can’t realistically change (for example, location); (c) Focus on addressing just one item per month; (d) by focusing only on one item per month, you will ensure that it is properly addressed, and have time to observe the results before moving on to the next improvement.’ The general idea observable from Nick (2013)’s suggestion is that a restaurant in this category will have to take an aggressive approach in analysing key factors that may be deterring customers from buying from the restaurant, though he does not specify where the attributes would be derived from.
The strength of his view is that, the restaurant will have to pay particular attention to continuous improvement of the identified item so that customers would be positively disposed towards the restaurant. The challenge is that this model has not been fully developed as a theoretical framework, and there is no evidence of empirical validity of the model.
The disjunctive model According to Nick (2013: online), “A disjunctive model better captures how customers choose upscale restaurants. With the disjunctive model, customers base their choice on only the most important attributes, and their criteria are slightly more flexible (for example, a customer could simply want a Michelin-rated restaurant with seafood - given those two attributes; all other attributes would be of minor importance).” As a restaurateur, identify best attributes or (‘core competencies’) and ensure that they are being clearly communicated to customers, both at your restaurant and online. Again, this is a very attractive approach though it lacks methodological development and empirical evidence to validate its applicability as a model.
From the above theories – the conjunctive model and the disjunctive model – it is observable that there are attempts to comprehensively analyse restaurant performance factors. However, because they are not developed to a level that they could be put to effective empirical test, reliance on developed models and theories such as the forces of industry analysis, BCG Matrix, General Electric matrix and Ansolf matrix is inevitable. It may be instructive to pick those aspects of the conjunctive model and the disjunctive model and merge them with the developed models to effective competitive analysis and positioning of a restaurant such as the ones under review in this study. The key factors in analysing competitive positioning of a restaurant
Kuwait Chapter of Arabian Journal of Business and Management Review Vol. 4, No.8; April. 2015
11
There is no universally accepted list of factors that impact on restaurant competitive positioning although a number of factors from research can be gleaned. Much of what is observable are theories derived from general corporate strategy analysis, marketing management and consumer behaviour. One of the key aspects of competitive positioning is product positioning. According to Trott (2012: 390), ‘product positioning refers to the perceptions customers have about the product. It is a relative term that describes customer perceptions of the product position in the market relative to rival products’. This is a view shared by Porter’s five competitive forces model in relation to rival firms and the threat of new entrants into the same industry (Smith, 2011: 501). However, Trott (2012: 390) further established that ‘it is founded upon understanding how customers discriminate between alternative products and it considers the factors customers use in making judgments or choices between products in the market being investigated.’ These are referred to as customers’ evaluative criteria and there may be the products physical attributes, customers assessments about whom the product is meant for, when, where and how it is used and aspects of the brand personality.
Zimmerer, Scarborough, and Wilson (2011: 99) specifically identified attributes such as ‘high food quality, consistency, cleanliness, and friendly and attentive service from a well-trained waiting staff amongst others as some important attributes critical to the competitiveness of a restaurant outlet’. In a similar fashion Nick (2013: online) found some of the key factors considered in this section and study as: (i) food quality; (ii) price and value and (iii) atmosphere; (iv) location; (v) employee attitude and (vi) delightful experience which are discussed in this study.
According to Nick (2013: online), “Researchers specializing in consumer behaviour have found that many factors play into a customer’s restaurant choice. Some of the factors are unique to the customer – such as income, age, and household size – while other factors are more cyclical, such as day of the week and season.” Location and employee attitude also play a role, but alas; none of these factors are easy to change. Fortunately, other factors are easy to alter, and they can have a positive impact on the business.
Food quality
Concerning food quality, Nick (2013: online)’s study proffered that “Food Quality is by far the most important factor. A restaurant which may perceive itself as offering great food may suffer from a well-researched phenomenon called the “confirmation bias” which prevents it from accurately judging its own food. The confirmation bias makes an outlet more attuned to factors that confirm existing (positive) beliefs, and less attuned to factors that undermine (negate) them”. What may be gleaned from this view is that a restaurant success is hinged on food quality though this is a somewhat a complex attribute to get things right on, mainly because of bias which owners of a restaurant may develop. Nick (2013) further asserts that “when a restaurant evaluates their own food, it may be probably focused on that exquisitely seasoned Béchamel, or the signature appetizer that all customers love. It might, however, be ignoring the perpetually under-cooked pasta or the mediocre chocolate cake”. It is quite difficult to overcome some of these biases which may consequently explain why a restaurant outlet is suffering an onslaught of poor sales and customer disloyalty.
Kuwait Chapter of Arabian Journal of Business and Management Review Vol. 4, No.8; April. 2015
12
To overcome the confirmation bias, it is instructive to request customers to fill out a brief, anonymous survey (if possible, offer them a free cup of coffee for filling it out on the spot). From this a restaurant then figures out what they liked, what could have been better, and if they would recommend the restaurant to a friend’ (Nick, 2013: online).
Food quality could be regarded as a product quality when viewed from the view point of BCG matrix, The General Electric matrix, or Ansolf’s matrix. It is arguable that food quality could impact on consumer choice and eventual competitiveness of a restaurant outlet. In the same vein, Noldus (2014: online) holds that “understanding consumer behaviour is essential to create successful products. Surveys generate valuable information, but they are susceptible to bias, for example because respondents can give socially desirable responses. To better predict your product potential, observation of consumers or members of a taste panel in specific situations is indispensable”, a view also shared by Poelman; Glorie and Mojet (2005: The challenges of competitive positioning within the restaurant industry Although Fleisher and Bensoussan (2007: 3) do not provide a definition of competitive positioning, they indicate a rationale for how one can be developed. Fleisher and Bensoussan (2007:3) state that ‘competitive positioning involves analysing a position relative to one’s own in order to preserve an advantage; attempt an improvement and exit from a market and it also looks at market share, client perceptions, current marketing strategies, prices and costs, and competitive positions’.
From the foregoing assertions, it may be observable that a firm could only position itself against its competitors by analysing its own sources of competitive advantage in order to preserve it and improve it where possible, or totally exit that market if it is no longer viable. What is also clear is that it involves analysing a firm’s competitive position in terms of its market share, client perceptions, current marketing strategies, prices and costs, and competitive positions relative to that of its competition to generate competitive advantages necessary for its growth and sustainability.
While there are no specific empirical results that point to the impact of competitive positioning factors and the competitive advantage of restaurant outlets, a few observations can be made from the forgoing analysis. According to Zimmerer et al. (2011:99), ‘a restaurant owner in India identified the following factors as specifically responsible for restaurant outlet success:
Tight cost control (labour cost, 15 to 18 percent of sales and food costs, 35 to 40 percent of sales);
trained, dependable, honest in-store managers; close monitoring of waste; careful site selection (the right location); high food quality; consistency; cleanliness; and Friendly and attentive service from a well-trained wait staff’, (Zimmerer et al., 2011:
99).
Kuwait Chapter of Arabian Journal of Business and Management Review Vol. 4, No.8; April. 2015
13
These variables can be controlled to determine the ability of any restaurant in the market segment to compete. Restaurants lacking these KSFs1 are not likely to survive, but those that build their strategies with these factors in mind will prosper, (Zimmerer et al., 2011: 99).
It is, however, difficult to build on such attributes if the business has not taken the time and effort to identify them. Zimmerer et al. (2011: 99), however argue that a company may not be able to successfully execute all these requisite attributes at a go, but must identify ways in which it can use one of the attributes to outcompete its rivals. It is only on that basis a company can have a competitive advantage and edge. When all is said and done, everything boils down to whether or not a company has achieved customer satisfaction. That is the major challenge to competitive positioning. Kruger and Ramphal (2012: 90); (Nick, 2013: online) argue that ‘to understand what it takes to satisfy customers organisations must focus on the voice of the customer which is represented only in part by existing customers. Hence it is critical for an organisation to collect, analyse and effectively use customer information which is timely, accurate and straight forward’. It may also be observed that the voice of the customer in the foregoing analysis is a necessary adjunct to quality management, and an inalienable aspect of competitive positioning. Whether or not customers will be satisfied is a function of quality, as it is defined and provided by a competitive firm. Smit, Cronge, Brevis and Vrba (2013:43) provide a framework for total quality management subsumed in their ‘principles of total quality management,’ as a basis for and challenge to competitive positioning. Some of the key principles emanating from this analysis are:
organisations depend on their customers and should therefore understand the customers’ current and future needs;
the organisation must try to exceed customer expectations; every employee is responsible for quality; quality must be managed; factors such as final product, how the organisation deals with complaints and speed
of service must be managed; quality must be measured; and Quality can always be improved, and therefore TQM2 is a commitment to never
being complacent.
The main challenge that sums up the basis for competitive advantage identified by Smit et al. (2013: 43) is the ability of an organisation to identify current and future needs of customers. This is critical for restaurant outlets under investigation in this study, given the intense rivalry that exists in this industry. Understanding the customers’ needs and incorporating such an understanding in the entire operational system of an organisation is a major challenge and a strategic imperative at the same time. This is echoed by an earlier assertion by Kruger and Ramphal (2012: 90) that organisations ought to place a special focus on the voice of the customer and seek to exceed customer expectations.
This is however a difficult exercise if an organisation fails to ensure that it is a team effort involving everyone in the firm. This is consistent with Smit et al.’s (2013:43) view that quality is for everyone in the organisation. 1 KSFs stands for Key Success Factors 2 TQM stands for Total Quality Management
Kuwait Chapter of Arabian Journal of Business and Management Review Vol. 4, No.8; April. 2015
14
Review he or she fulfils in the organisation, and taps into employees’ motivation to try harder and put in extra-effort. Engaged employees express themselves physically, cognitively and emotionally while they perform their jobs and roles.’ Engagement is important because it has positive outcomes for both the individual and the organisation. The key elements of engagement are having the right employees in the right jobs, right skills, and supportive systems and strategies, (Phelps and Brossoit, 2007: online). To enhance such practices an organisation may
Strategies for the competitive positioning of restaurant establishments From the review of literature above it can be observed that (1) food quality; (2) price and value and (3) atmosphere; (4) location; (5) employee attitude are critical elements to the achievement of competitive advantage within the restaurant industry. It may indicate that when a restaurant performs badly on any one of these elements, it becomes difficult to establish a distinctive competitive position.
Based on the views of Kotler and Keller, (2009: 309) who argue that customers prefer to buy a product because they see it as distinct, in their minds, one might observe that the total product constitutes all the elements including the location of the restaurant, the employees’ attitudes with which they serve customers, food quality, the atmosphere of the restaurant and further the price and value of the products. These elements may further determine whether any of the products of the restaurant will have market share and growth based on BCG matrix determinations (Smith, 2011: 333). RESEARCH METHODOLOGY Target Population and Sample Population is defined as ‘the total group of people or entities [social artefacts] from whom information is required’ (Wild and Diggines, 2013: 186, cited in Du Plooy-Cilliers et al., 2014:132). Information is collected from a population to answer research questions. The population must be relevant to the research questions. When considering a target population there are population parameters to be considered. These include the nature of the population, which deals with questions such as (a) are they involved in the subject and (b) do they have answers to the subject and questions under investigation. In addition, the size of population addresses questions such as (a) approximately how many respondents? (b) are they many enough to address the issues under investigation? Finally, population parameters deal with the unique characteristics of population as illustrated in the following questions (a) what do they have in common?, and (b) are they homogeneous enough to ensure that the sample from which data are collected is representative (Du Plooy-Cilliers et al., 2014:132). The target population for this study includes 120 employees who are employed at Capello, KFC, and Piece-a-pizza restaurant establishments, all situated at OR Tambo International Airport. Sampling Strategy
This study employed a random sampling technique to survey 30 employees from Capello, 30 employees from KFC and 30 employees from Piece-a-Pizza. The selected sample totaled 90 respondents. In selecting the sample this study was informed by the principle of
Kuwait Chapter of Arabian Journal of Business and Management Review Vol. 4, No.8; April. 2015
15
representativeness as demonstrated by the views of Du Plooy-Cilliers et al. (2014:135), who stated that ‘quantitative research usually requires us to draw a representative sample. ‘A representative sample shares the characteristics of the larger population’. In selecting the employees of the respective restaurant outlets it was evident that they could provide valuable insight into the issues that matter in competitively positioning the restaurants given their direct involvement with the restaurant’s operations.
Limitations of the study There are a number of factors that may act to determine the quality of the findings of this study. First, the findings of this research was largely based on survey questionnaires whose responses were not further probed for an ‘in-depth’ understanding of issues, as would have been the case with purely qualitative studies. The other problem was compounded by the size of the sample interviewed for the study. Because of time and financial resources limitations, the study only covered a small sample of 120 respondents and limited to a few of the major stakeholders in the restaurant industry. A sample of 120 respondents is too small to represent the opinions of the whole population of people who have an interest in restaurants in South Africa, or let alone Gauteng Province. Given the small sample size, the results of the study may not represent a true reflection of the situation obtaining in the restaurant sector in South Africa as a whole. Finance and time limitations also impacted on the level of analysis conducted by the study. As indicated earlier, data analysis mainly utilised descriptive frequencies, relative frequencies, means and standard deviations, no inferential statistical analysis were conducted.
Another limitation of the study may be the reluctance of informants to provide information. Since the researcher is not a direct participant in the restaurant industry, she had to rely on personal contacts as well as random visits to organizations to solicit information from various persons which include professionals such as agents, tourists and airport users, among others. This may also evoke suspicion with the outcome that most potential informants may not want to participate in research. Some may be categorical that they did not see any direct benefits accruing to their own lives. In other cases participants may be suspicious that they are being investigated or being asked to disclose their business secrets to competing companies. Such sentiments and feelings no doubt would have bearings on the quality of information divulged by the respondents. However, the researcher took time to explain the non-threatening nature of the research. Data Analysis and Measurement
The data collected by the study were analysed utilising the SSPS quantitative data analysis software. The analysis generated descriptive results. It involved the computation and utilisation of descriptive statistics especially frequency distributions, percentages and means. These were used to construct a descriptive profile of the respondents studied and their views about the subject of the study.
RESULTS, DISCUSSION AND INTERPRETATION OF FINDINGS
Presentation of findings This section is a presentation of the findings from the study. Demographic characteristics of the respondents
Kuwait Chapter of Arabian Journal of Business and Management Review Vol. 4, No.8; April. 2015
16
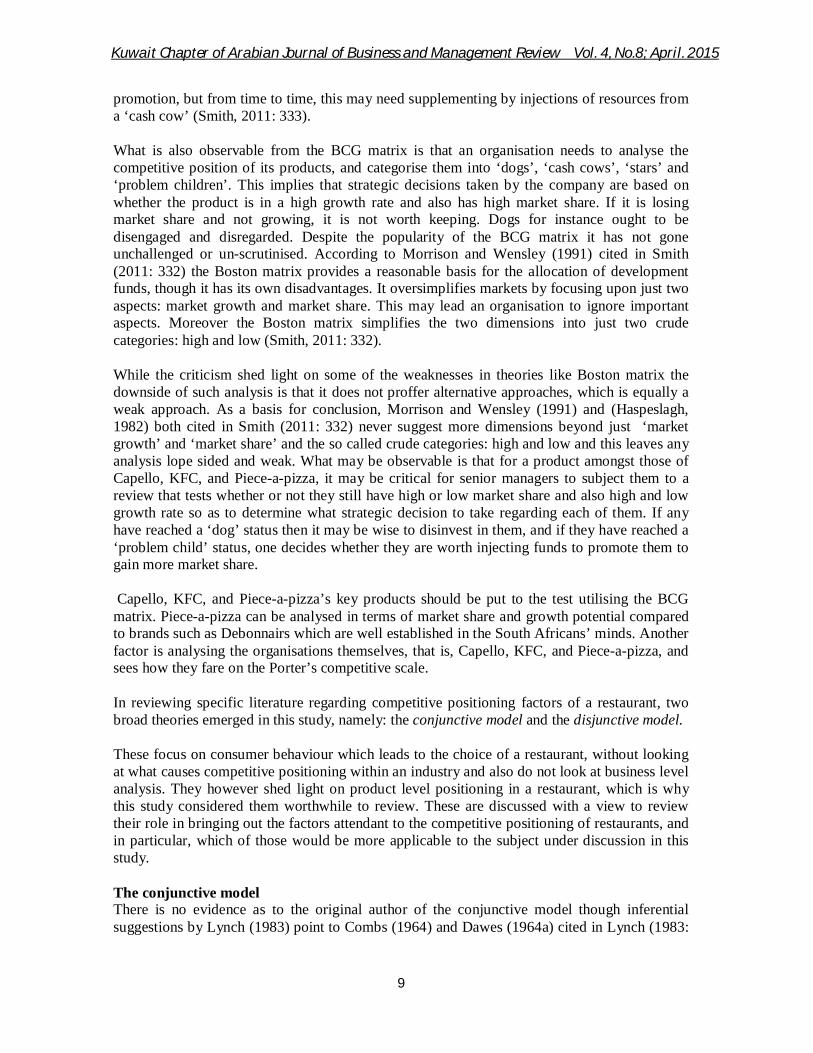
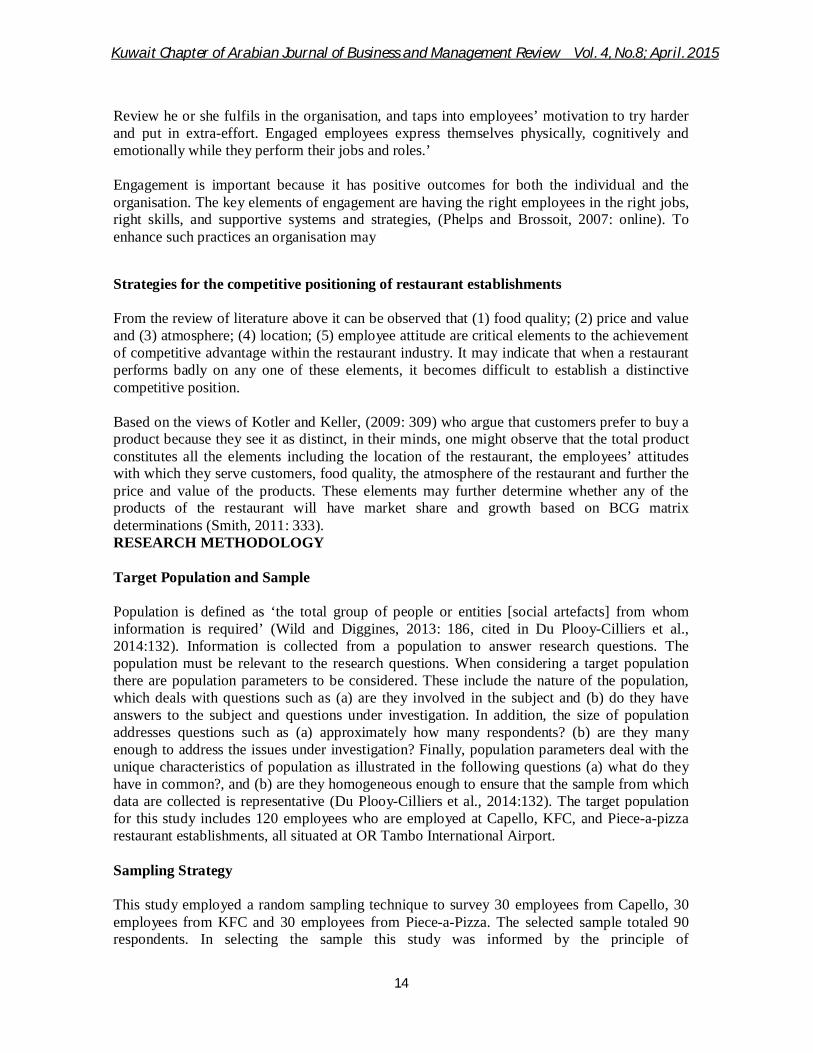
Figure 4.1 Distributions by Title of Respondents
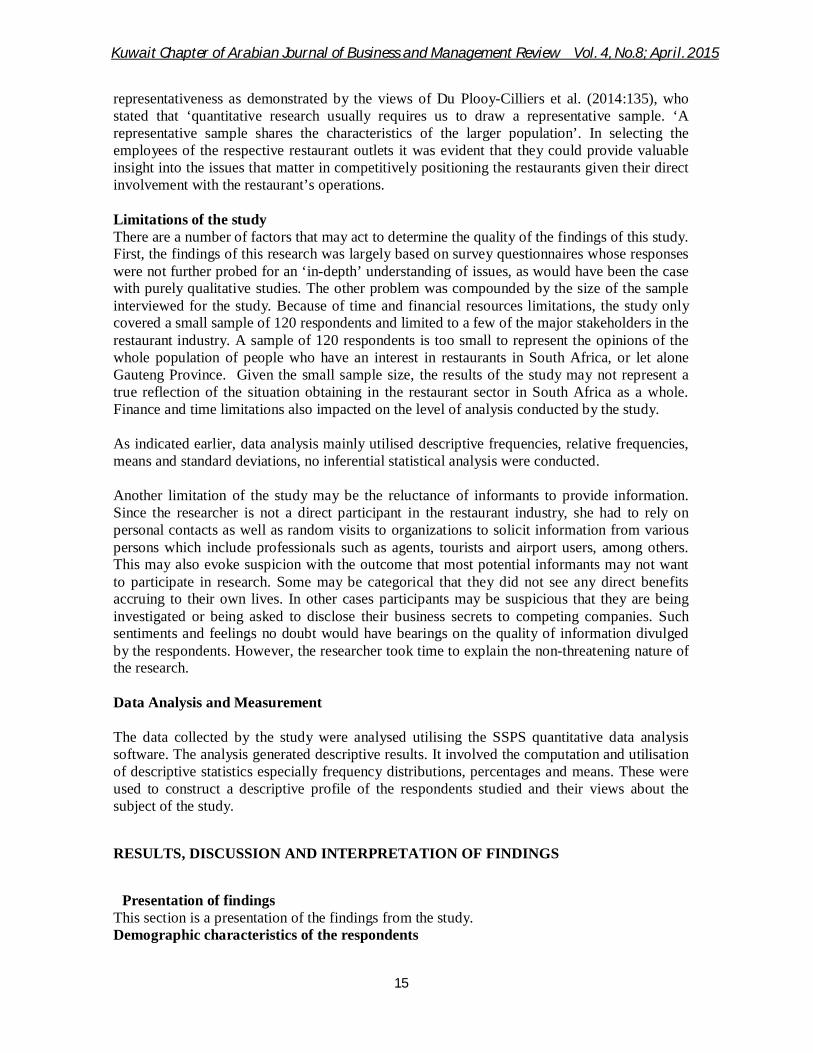
As indicated figure 4.1 above, 5.6% of the respondents were managers, 4.2% shift supervisors and 45.8% were waiters, 11.1% kitchen employees, 11.1% were barmen, 9.6% were Pizza men and 9.7% were cashiers. The remaining 2.8 % were categorised as runners- table cleaners. Figure 4.2 Gender of respondents
As indicated in Figure 4.2, 53%of the respondents were males and 47% were females. Figure 4.3 Marital statuses of respondents
0.0%5.0%
10.0%15.0%20.0%25.0%30.0%35.0%40.0%45.0%50.0%
5.6% 4.2%
45.8%
11.1% 11.1% 9.7% 9.7%2.8%
Perc
enta
ge
Male53%
Female47%
Kuwait Chapter of Arabian Journal of Business and Management Review Vol. 4, No.8; April. 2015
17
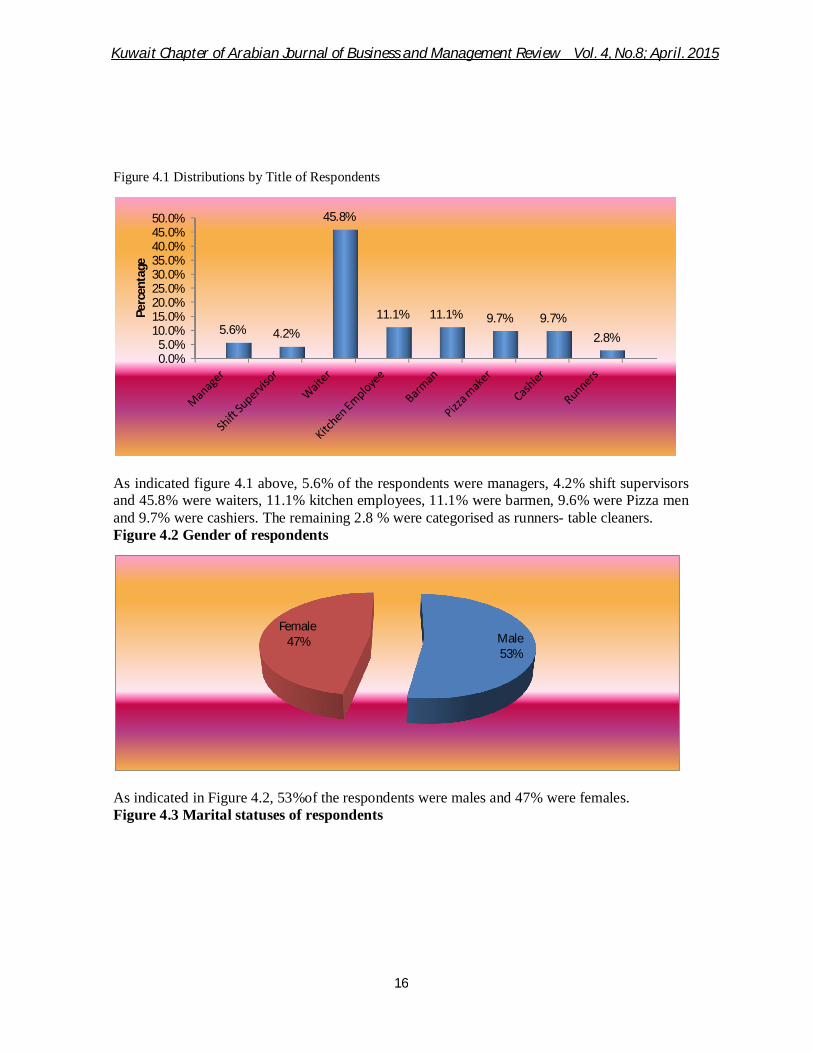
As illustrated in figure 4.3 above, the majority (73.6%) of the respondents were single (never married) compared to only 13.9% who were married, 9.7% were engaged in a life partnership while 1.4 % were separated and the remaining 1.4% were divorced. Figure 4.4: Highest level of education of respondents
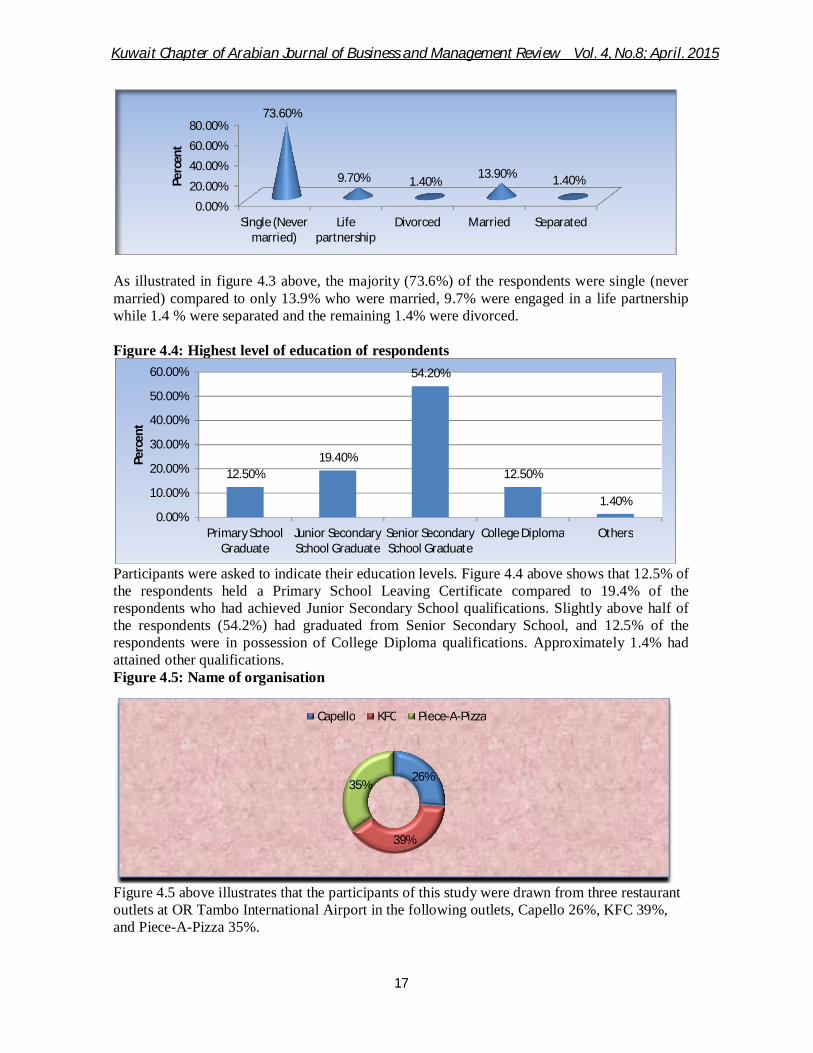
Participants were asked to indicate their education levels. Figure 4.4 above shows that 12.5% of the respondents held a Primary School Leaving Certificate compared to 19.4% of the respondents who had achieved Junior Secondary School qualifications. Slightly above half of the respondents (54.2%) had graduated from Senior Secondary School, and 12.5% of the respondents were in possession of College Diploma qualifications. Approximately 1.4% had attained other qualifications. Figure 4.5: Name of organisation
Figure 4.5 above illustrates that the participants of this study were drawn from three restaurant outlets at OR Tambo International Airport in the following outlets, Capello 26%, KFC 39%, and Piece-A-Pizza 35%.
0.00%
20.00%
40.00%
60.00%
80.00%
Single (Never married)
Life partnership
Divorced Married Separated
73.60%
9.70% 1.40%13.90% 1.40%Pe
rcen
t
12.50%19.40%
54.20%
12.50%
1.40%0.00%
10.00%
20.00%
30.00%
40.00%
50.00%
60.00%
Primary School Graduate
Junior Secondary School Graduate
Senior Secondary School Graduate
College Diploma Others
Perc
ent
26%
39%
35%
Capello KFC Piece-A-Pizza
Kuwait Chapter of Arabian Journal of Business and Management Review Vol. 4, No.8; April. 2015
18
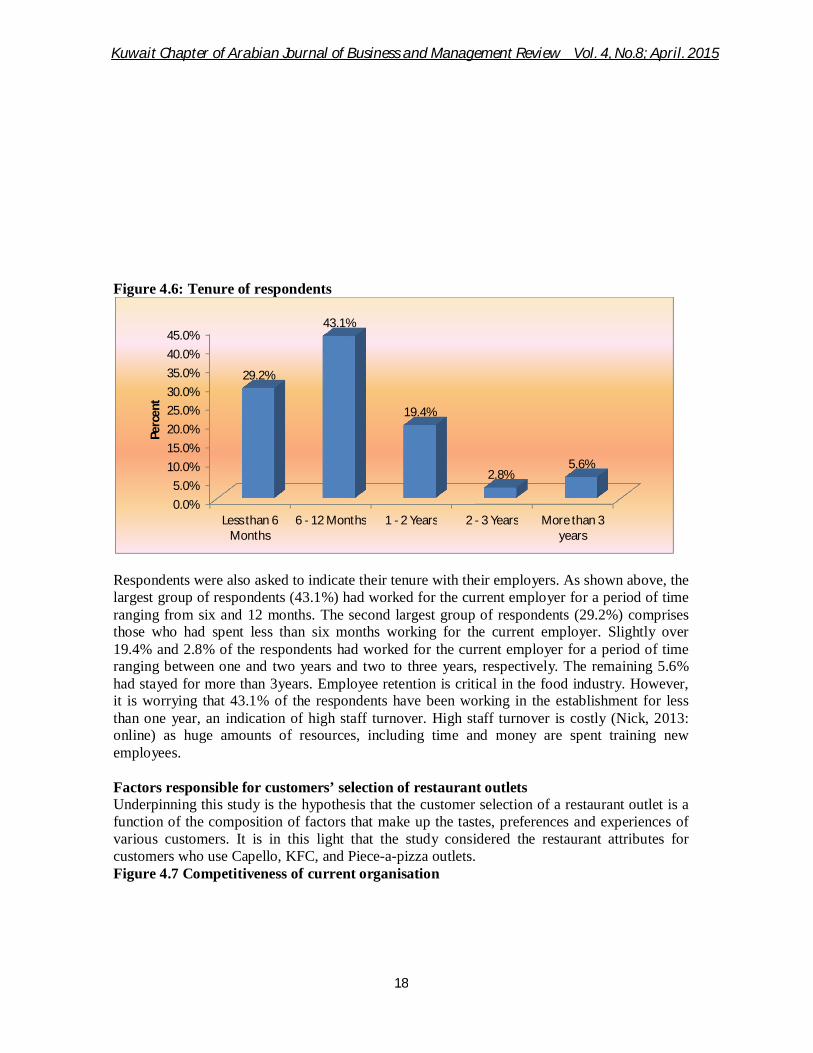
Figure 4.6: Tenure of respondents
Respondents were also asked to indicate their tenure with their employers. As shown above, the largest group of respondents (43.1%) had worked for the current employer for a period of time ranging from six and 12 months. The second largest group of respondents (29.2%) comprises those who had spent less than six months working for the current employer. Slightly over 19.4% and 2.8% of the respondents had worked for the current employer for a period of time ranging between one and two years and two to three years, respectively. The remaining 5.6% had stayed for more than 3years. Employee retention is critical in the food industry. However, it is worrying that 43.1% of the respondents have been working in the establishment for less than one year, an indication of high staff turnover. High staff turnover is costly (Nick, 2013: online) as huge amounts of resources, including time and money are spent training new employees. Factors responsible for customers’ selection of restaurant outlets Underpinning this study is the hypothesis that the customer selection of a restaurant outlet is a function of the composition of factors that make up the tastes, preferences and experiences of various customers. It is in this light that the study considered the restaurant attributes for customers who use Capello, KFC, and Piece-a-pizza outlets. Figure 4.7 Competitiveness of current organisation
0.0%5.0%
10.0%15.0%20.0%25.0%30.0%35.0%40.0%45.0%
Less than 6 Months
6 - 12 Months 1 - 2 Years 2 - 3 Years More than 3 years
29.2%
43.1%
19.4%
2.8%5.6%
Perc
ent
Kuwait Chapter of Arabian Journal of Business and Management Review Vol. 4, No.8; April. 2015
19
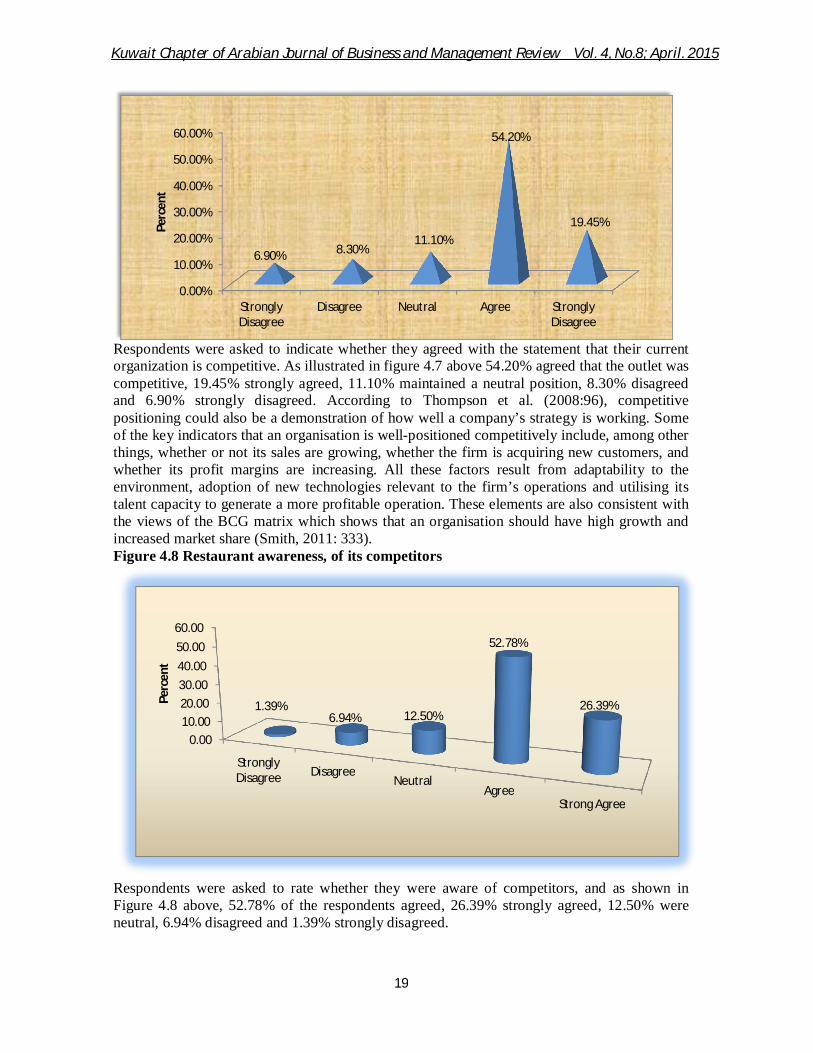
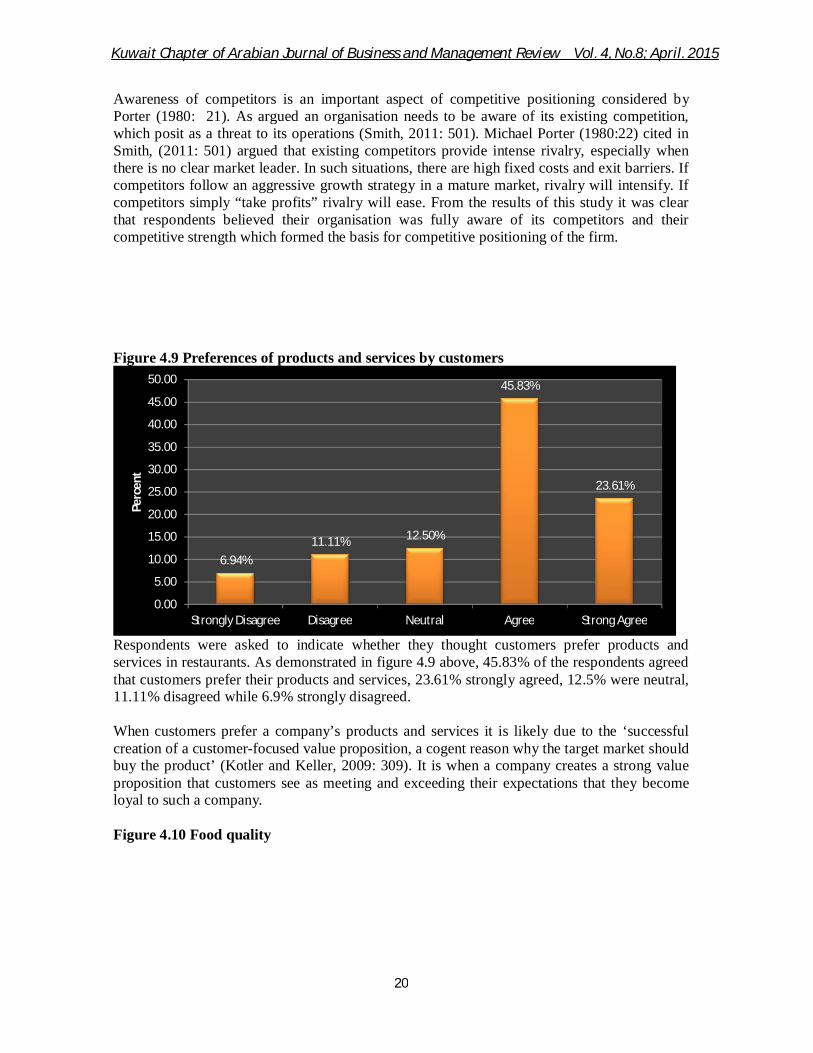
Respondents were asked to indicate whether they agreed with the statement that their current organization is competitive. As illustrated in figure 4.7 above 54.20% agreed that the outlet was competitive, 19.45% strongly agreed, 11.10% maintained a neutral position, 8.30% disagreed and 6.90% strongly disagreed. According to Thompson et al. (2008:96), competitive positioning could also be a demonstration of how well a company’s strategy is working. Some of the key indicators that an organisation is well-positioned competitively include, among other things, whether or not its sales are growing, whether the firm is acquiring new customers, and whether its profit margins are increasing. All these factors result from adaptability to the environment, adoption of new technologies relevant to the firm’s operations and utilising its talent capacity to generate a more profitable operation. These elements are also consistent with the views of the BCG matrix which shows that an organisation should have high growth and increased market share (Smith, 2011: 333). Figure 4.8 Restaurant awareness, of its competitors
Respondents were asked to rate whether they were aware of competitors, and as shown in Figure 4.8 above, 52.78% of the respondents agreed, 26.39% strongly agreed, 12.50% were neutral, 6.94% disagreed and 1.39% strongly disagreed.
0.00%
10.00%
20.00%
30.00%
40.00%
50.00%
60.00%
Strongly Disagree
Disagree Neutral Agree Strongly Disagree
6.90% 8.30%11.10%
54.20%
19.45%Perc
ent
0.0010.0020.0030.0040.0050.0060.00
Strongly Disagree Disagree
NeutralAgree
Strong Agree
1.39%6.94% 12.50%
52.78%
26.39%Perc
ent
Kuwait Chapter of Arabian Journal of Business and Management Review Vol. 4, No.8; April. 2015
20
Awareness of competitors is an important aspect of competitive positioning considered by Porter (1980: 21). As argued an organisation needs to be aware of its existing competition, which posit as a threat to its operations (Smith, 2011: 501). Michael Porter (1980:22) cited in Smith, (2011: 501) argued that existing competitors provide intense rivalry, especially when there is no clear market leader. In such situations, there are high fixed costs and exit barriers. If competitors follow an aggressive growth strategy in a mature market, rivalry will intensify. If competitors simply “take profits” rivalry will ease. From the results of this study it was clear that respondents believed their organisation was fully aware of its competitors and their competitive strength which formed the basis for competitive positioning of the firm. Figure 4.9 Preferences of products and services by customers
Respondents were asked to indicate whether they thought customers prefer products and services in restaurants. As demonstrated in figure 4.9 above, 45.83% of the respondents agreed that customers prefer their products and services, 23.61% strongly agreed, 12.5% were neutral, 11.11% disagreed while 6.9% strongly disagreed. When customers prefer a company’s products and services it is likely due to the ‘successful creation of a customer-focused value proposition, a cogent reason why the target market should buy the product’ (Kotler and Keller, 2009: 309). It is when a company creates a strong value proposition that customers see as meeting and exceeding their expectations that they become loyal to such a company. Figure 4.10 Food quality
6.94%11.11% 12.50%
45.83%
23.61%
0.00
5.00
10.00
15.00
20.00
25.00
30.00
35.00
40.00
45.00
50.00
Strongly Disagree Disagree Neutral Agree Strong Agree
Perc
ent
Kuwait Chapter of Arabian Journal of Business and Management Review Vol. 4, No.8; April. 2015
21
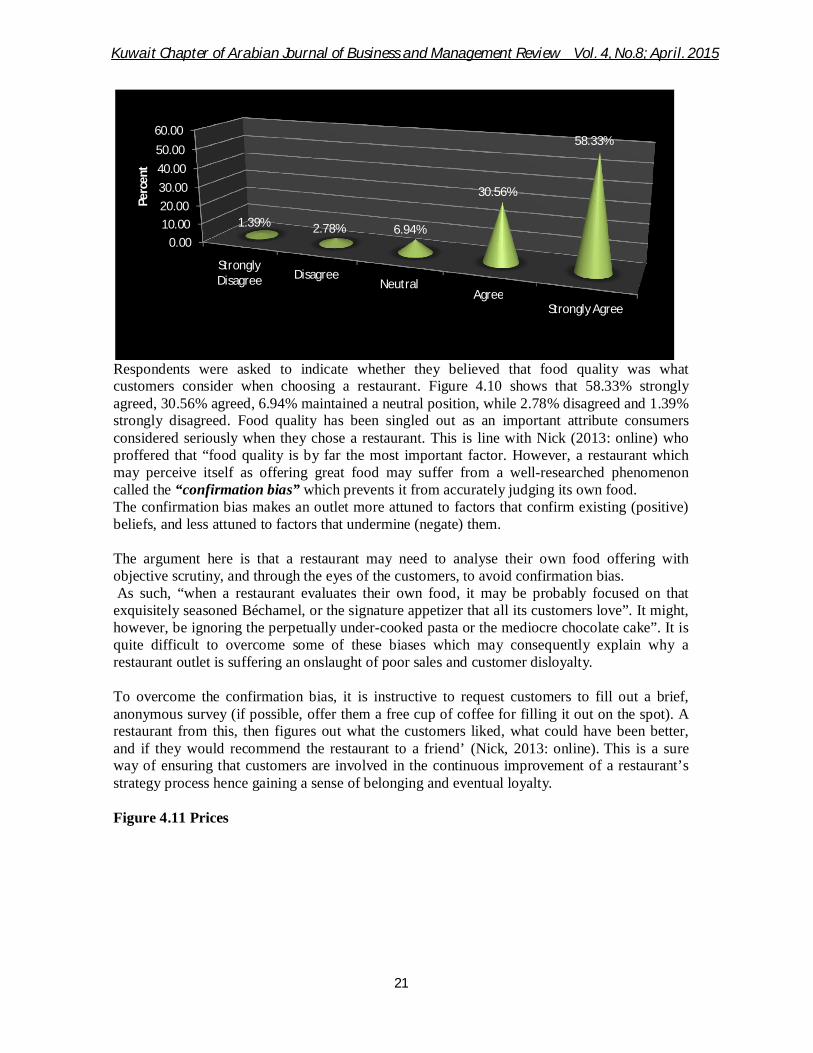
Respondents were asked to indicate whether they believed that food quality was what customers consider when choosing a restaurant. Figure 4.10 shows that 58.33% strongly agreed, 30.56% agreed, 6.94% maintained a neutral position, while 2.78% disagreed and 1.39% strongly disagreed. Food quality has been singled out as an important attribute consumers considered seriously when they chose a restaurant. This is line with Nick (2013: online) who proffered that “food quality is by far the most important factor. However, a restaurant which may perceive itself as offering great food may suffer from a well-researched phenomenon called the “confirmation bias” which prevents it from accurately judging its own food. The confirmation bias makes an outlet more attuned to factors that confirm existing (positive) beliefs, and less attuned to factors that undermine (negate) them. The argument here is that a restaurant may need to analyse their own food offering with objective scrutiny, and through the eyes of the customers, to avoid confirmation bias. As such, “when a restaurant evaluates their own food, it may be probably focused on that exquisitely seasoned Béchamel, or the signature appetizer that all its customers love”. It might, however, be ignoring the perpetually under-cooked pasta or the mediocre chocolate cake”. It is quite difficult to overcome some of these biases which may consequently explain why a restaurant outlet is suffering an onslaught of poor sales and customer disloyalty. To overcome the confirmation bias, it is instructive to request customers to fill out a brief, anonymous survey (if possible, offer them a free cup of coffee for filling it out on the spot). A restaurant from this, then figures out what the customers liked, what could have been better, and if they would recommend the restaurant to a friend’ (Nick, 2013: online). This is a sure way of ensuring that customers are involved in the continuous improvement of a restaurant’s strategy process hence gaining a sense of belonging and eventual loyalty. Figure 4.11 Prices
0.0010.0020.0030.0040.0050.0060.00
Strongly Disagree Disagree
NeutralAgree
Strongly Agree
1.39% 2.78% 6.94%
30.56%
58.33%Pe
rcen
t
Kuwait Chapter of Arabian Journal of Business and Management Review Vol. 4, No.8; April. 2015
22
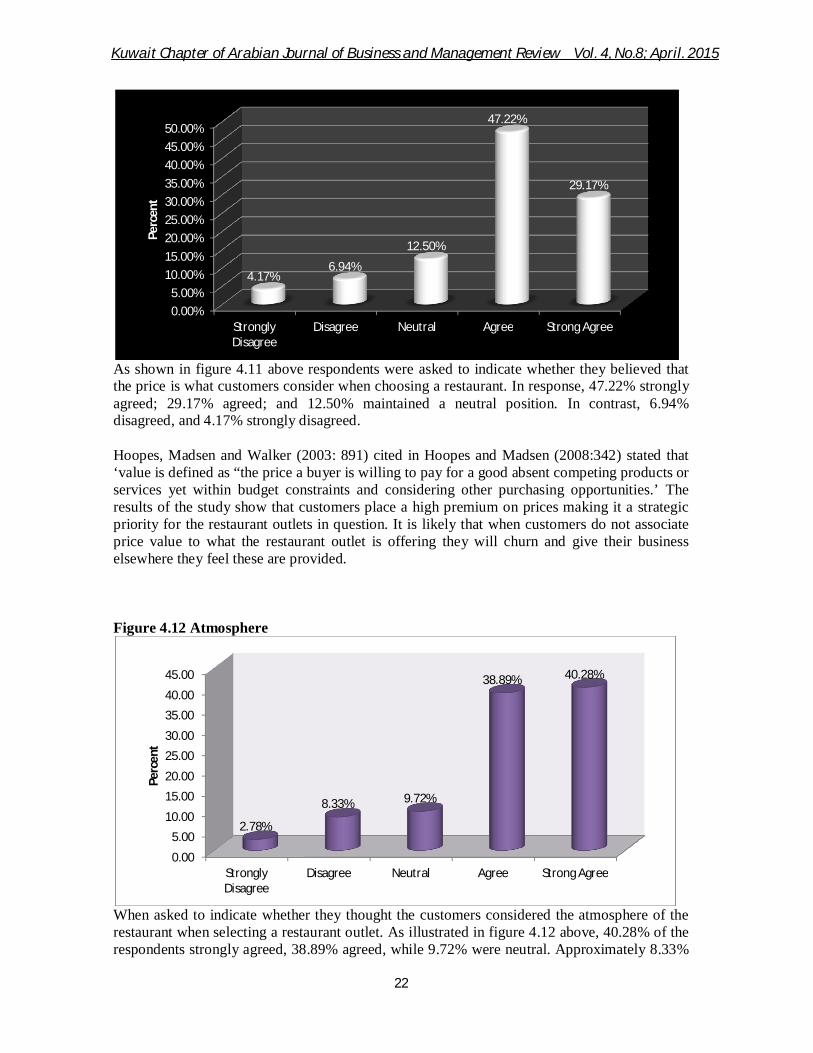
As shown in figure 4.11 above respondents were asked to indicate whether they believed that the price is what customers consider when choosing a restaurant. In response, 47.22% strongly agreed; 29.17% agreed; and 12.50% maintained a neutral position. In contrast, 6.94% disagreed, and 4.17% strongly disagreed. Hoopes, Madsen and Walker (2003: 891) cited in Hoopes and Madsen (2008:342) stated that ‘value is defined as “the price a buyer is willing to pay for a good absent competing products or services yet within budget constraints and considering other purchasing opportunities.’ The results of the study show that customers place a high premium on prices making it a strategic priority for the restaurant outlets in question. It is likely that when customers do not associate price value to what the restaurant outlet is offering they will churn and give their business elsewhere they feel these are provided. Figure 4.12 Atmosphere
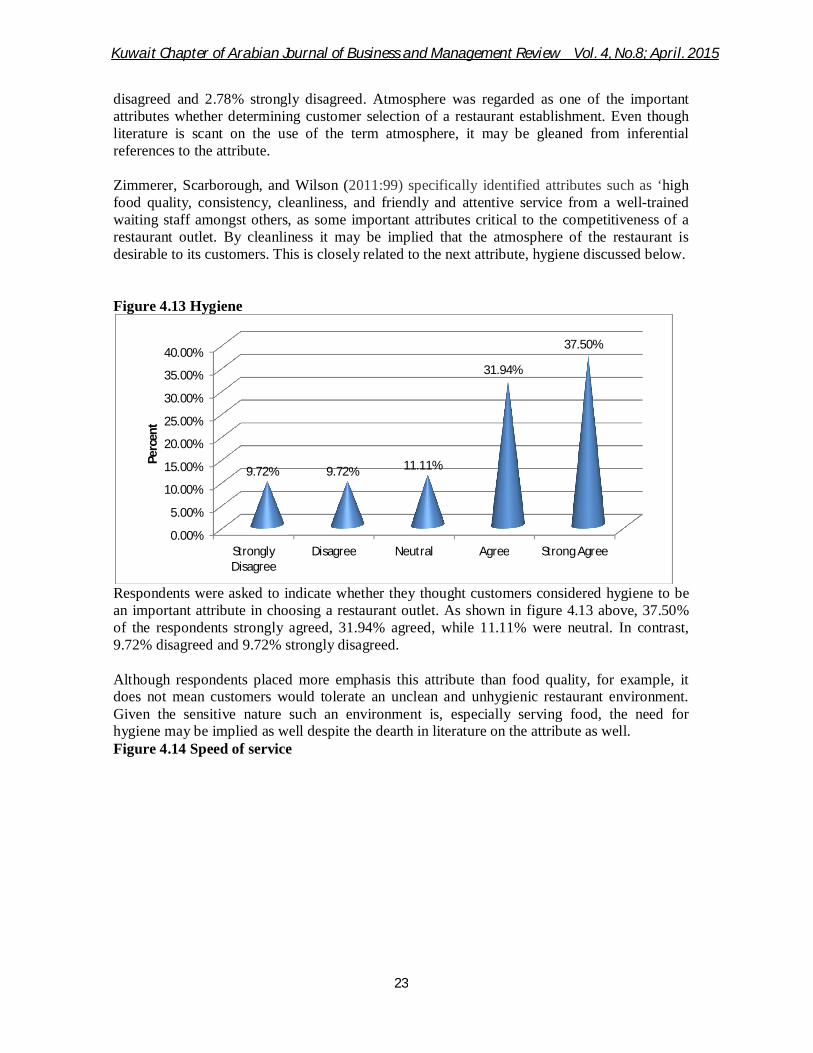
When asked to indicate whether they thought the customers considered the atmosphere of the restaurant when selecting a restaurant outlet. As illustrated in figure 4.12 above, 40.28% of the respondents strongly agreed, 38.89% agreed, while 9.72% were neutral. Approximately 8.33%
0.00%5.00%
10.00%15.00%20.00%25.00%30.00%35.00%40.00%45.00%50.00%
Strongly Disagree
Disagree Neutral Agree Strong Agree
4.17%6.94%
12.50%
47.22%
29.17%
Perc
ent
0.00
5.00
10.00
15.00
20.00
25.00
30.00
35.00
40.00
45.00
Strongly Disagree
Disagree Neutral Agree Strong Agree
2.78%
8.33% 9.72%
38.89% 40.28%
Perc
ent
Kuwait Chapter of Arabian Journal of Business and Management Review Vol. 4, No.8; April. 2015
23
disagreed and 2.78% strongly disagreed. Atmosphere was regarded as one of the important attributes whether determining customer selection of a restaurant establishment. Even though literature is scant on the use of the term atmosphere, it may be gleaned from inferential references to the attribute. Zimmerer, Scarborough, and Wilson (2011:99) specifically identified attributes such as ‘high food quality, consistency, cleanliness, and friendly and attentive service from a well-trained waiting staff amongst others, as some important attributes critical to the competitiveness of a restaurant outlet. By cleanliness it may be implied that the atmosphere of the restaurant is desirable to its customers. This is closely related to the next attribute, hygiene discussed below. Figure 4.13 Hygiene
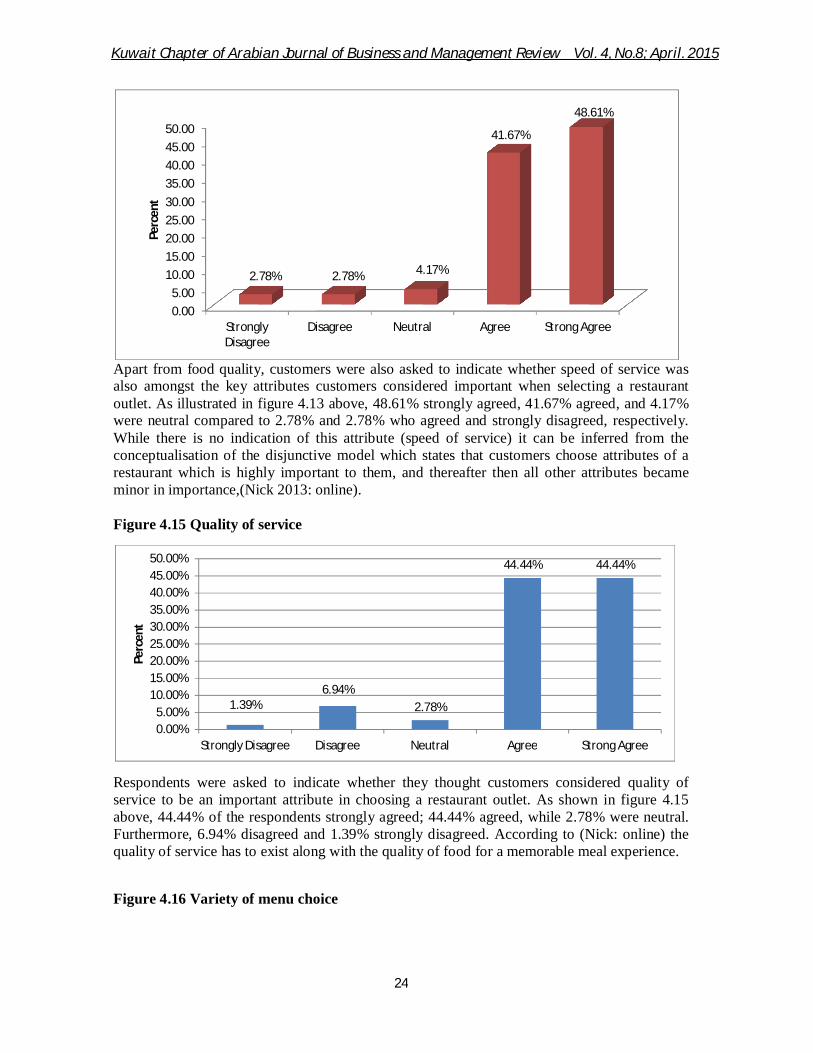
Respondents were asked to indicate whether they thought customers considered hygiene to be an important attribute in choosing a restaurant outlet. As shown in figure 4.13 above, 37.50% of the respondents strongly agreed, 31.94% agreed, while 11.11% were neutral. In contrast, 9.72% disagreed and 9.72% strongly disagreed. Although respondents placed more emphasis this attribute than food quality, for example, it does not mean customers would tolerate an unclean and unhygienic restaurant environment. Given the sensitive nature such an environment is, especially serving food, the need for hygiene may be implied as well despite the dearth in literature on the attribute as well. Figure 4.14 Speed of service
0.00%
5.00%
10.00%
15.00%
20.00%
25.00%
30.00%
35.00%
40.00%
Strongly Disagree
Disagree Neutral Agree Strong Agree
9.72% 9.72% 11.11%
31.94%
37.50%
Perc
ent
Kuwait Chapter of Arabian Journal of Business and Management Review Vol. 4, No.8; April. 2015
24
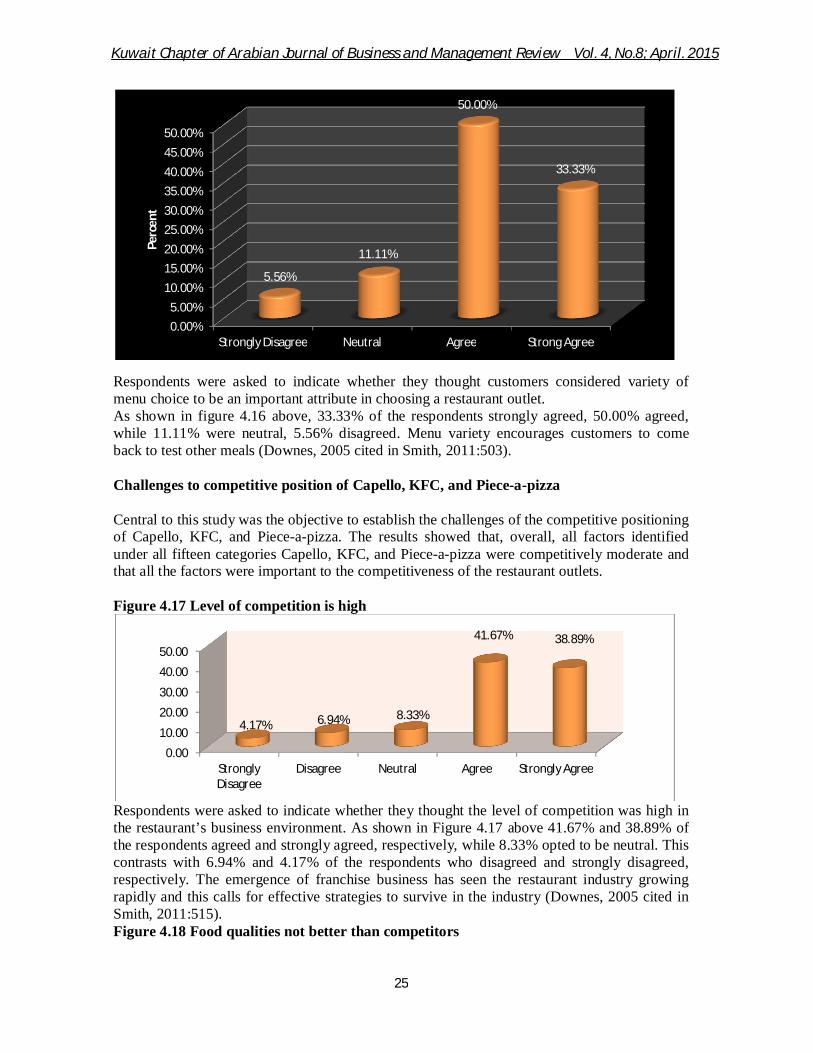
Apart from food quality, customers were also asked to indicate whether speed of service was also amongst the key attributes customers considered important when selecting a restaurant outlet. As illustrated in figure 4.13 above, 48.61% strongly agreed, 41.67% agreed, and 4.17% were neutral compared to 2.78% and 2.78% who agreed and strongly disagreed, respectively. While there is no indication of this attribute (speed of service) it can be inferred from the conceptualisation of the disjunctive model which states that customers choose attributes of a restaurant which is highly important to them, and thereafter then all other attributes became minor in importance,(Nick 2013: online). Figure 4.15 Quality of service
Respondents were asked to indicate whether they thought customers considered quality of service to be an important attribute in choosing a restaurant outlet. As shown in figure 4.15 above, 44.44% of the respondents strongly agreed; 44.44% agreed, while 2.78% were neutral. Furthermore, 6.94% disagreed and 1.39% strongly disagreed. According to (Nick: online) the quality of service has to exist along with the quality of food for a memorable meal experience.
Figure 4.16 Variety of menu choice
0.005.00
10.0015.0020.0025.0030.0035.0040.0045.0050.00
Strongly Disagree
Disagree Neutral Agree Strong Agree
2.78% 2.78% 4.17%
41.67%
48.61%
Perc
ent
1.39%6.94%
2.78%
44.44% 44.44%
0.00%5.00%
10.00%15.00%20.00%25.00%30.00%35.00%40.00%45.00%50.00%
Strongly Disagree Disagree Neutral Agree Strong Agree
Perc
ent
Kuwait Chapter of Arabian Journal of Business and Management Review Vol. 4, No.8; April. 2015
25
Respondents were asked to indicate whether they thought customers considered variety of menu choice to be an important attribute in choosing a restaurant outlet. As shown in figure 4.16 above, 33.33% of the respondents strongly agreed, 50.00% agreed, while 11.11% were neutral, 5.56% disagreed. Menu variety encourages customers to come back to test other meals (Downes, 2005 cited in Smith, 2011:503). Challenges to competitive position of Capello, KFC, and Piece-a-pizza Central to this study was the objective to establish the challenges of the competitive positioning of Capello, KFC, and Piece-a-pizza. The results showed that, overall, all factors identified under all fifteen categories Capello, KFC, and Piece-a-pizza were competitively moderate and that all the factors were important to the competitiveness of the restaurant outlets. Figure 4.17 Level of competition is high
Respondents were asked to indicate whether they thought the level of competition was high in the restaurant’s business environment. As shown in Figure 4.17 above 41.67% and 38.89% of the respondents agreed and strongly agreed, respectively, while 8.33% opted to be neutral. This contrasts with 6.94% and 4.17% of the respondents who disagreed and strongly disagreed, respectively. The emergence of franchise business has seen the restaurant industry growing rapidly and this calls for effective strategies to survive in the industry (Downes, 2005 cited in Smith, 2011:515). Figure 4.18 Food qualities not better than competitors
0.00%5.00%
10.00%15.00%20.00%25.00%30.00%35.00%40.00%45.00%50.00%
Strongly Disagree Neutral Agree Strong Agree
5.56%
11.11%
50.00%
33.33%Pe
rcen
t
0.00
10.00
20.00
30.00
40.00
50.00
Strongly Disagree
Disagree Neutral Agree Strongly Agree
4.17% 6.94% 8.33%
41.67% 38.89%
Kuwait Chapter of Arabian Journal of Business and Management Review Vol. 4, No.8; April. 2015
26
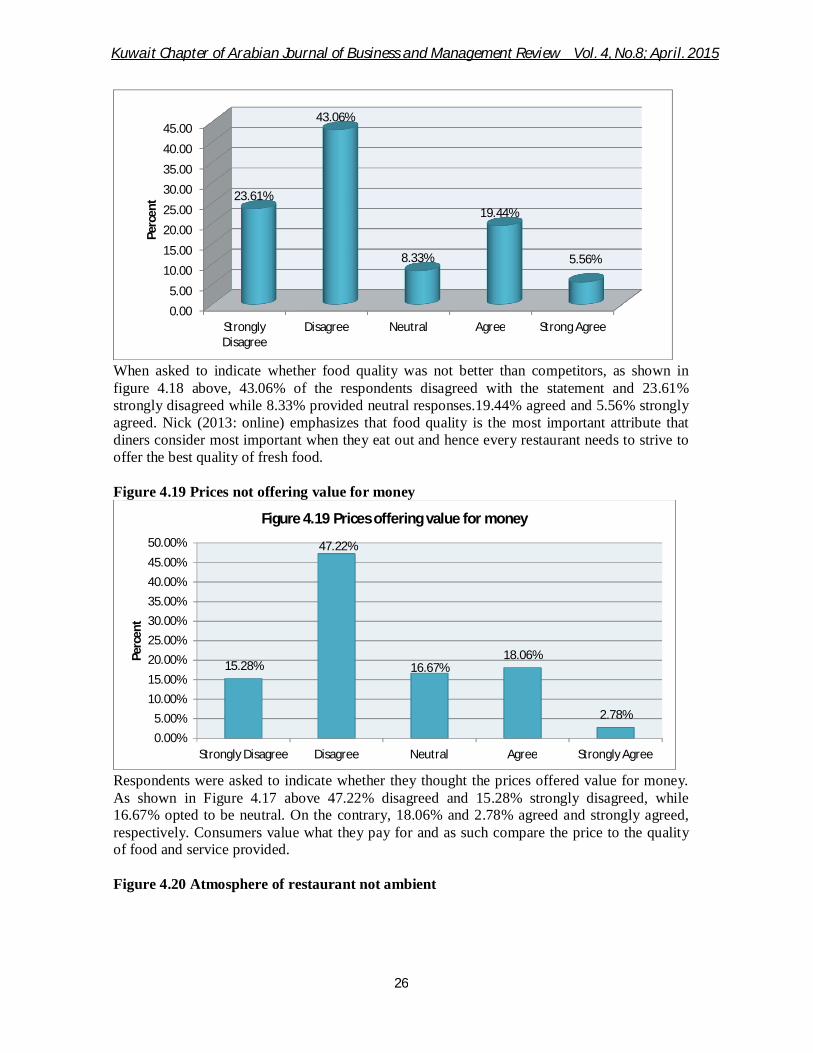
When asked to indicate whether food quality was not better than competitors, as shown in figure 4.18 above, 43.06% of the respondents disagreed with the statement and 23.61% strongly disagreed while 8.33% provided neutral responses.19.44% agreed and 5.56% strongly agreed. Nick (2013: online) emphasizes that food quality is the most important attribute that diners consider most important when they eat out and hence every restaurant needs to strive to offer the best quality of fresh food. Figure 4.19 Prices not offering value for money
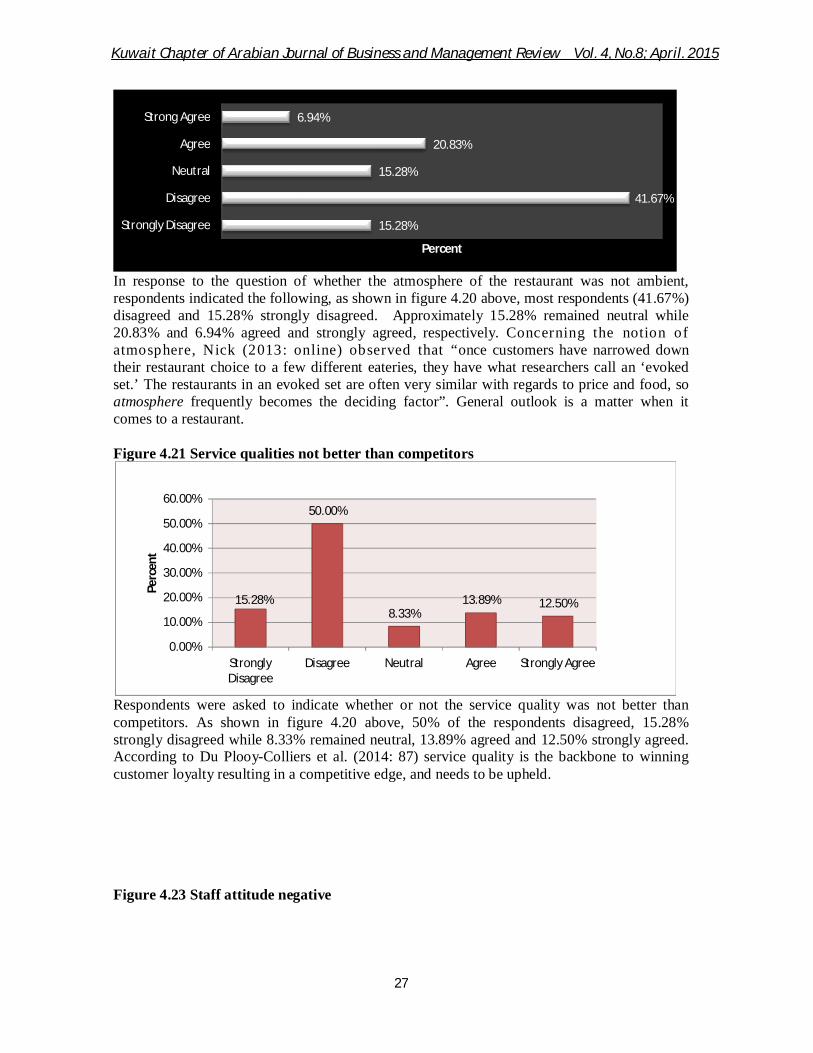
Respondents were asked to indicate whether they thought the prices offered value for money. As shown in Figure 4.17 above 47.22% disagreed and 15.28% strongly disagreed, while 16.67% opted to be neutral. On the contrary, 18.06% and 2.78% agreed and strongly agreed, respectively. Consumers value what they pay for and as such compare the price to the quality of food and service provided. Figure 4.20 Atmosphere of restaurant not ambient
0.00
5.00
10.00
15.00
20.00
25.00
30.00
35.00
40.00
45.00
Strongly Disagree
Disagree Neutral Agree Strong Agree
23.61%
43.06%
8.33%
19.44%
5.56%
Perc
ent
15.28%
47.22%
16.67%18.06%
2.78%
0.00%5.00%
10.00%15.00%20.00%25.00%30.00%35.00%40.00%45.00%50.00%
Strongly Disagree Disagree Neutral Agree Strongly Agree
Perc
ent
Figure 4.19 Prices offering value for money
Kuwait Chapter of Arabian Journal of Business and Management Review Vol. 4, No.8; April. 2015
27
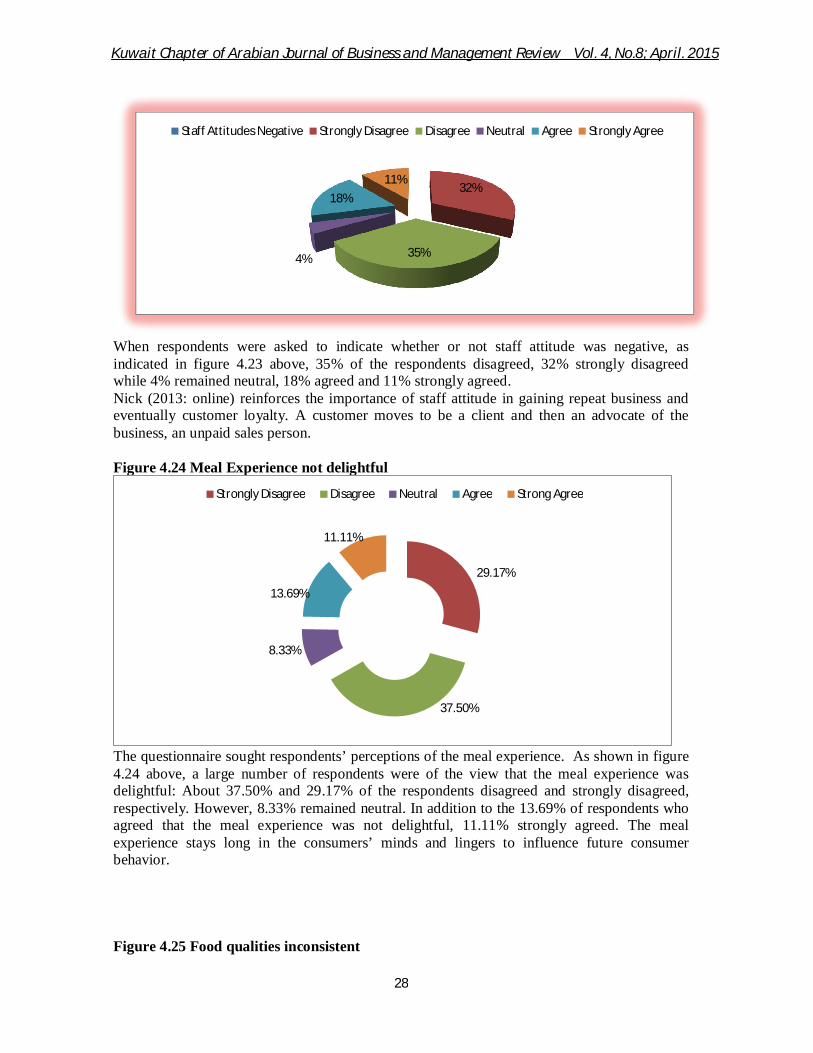
In response to the question of whether the atmosphere of the restaurant was not ambient, respondents indicated the following, as shown in figure 4.20 above, most respondents (41.67%) disagreed and 15.28% strongly disagreed. Approximately 15.28% remained neutral while 20.83% and 6.94% agreed and strongly agreed, respectively. Concerning the notion of atmosphere, Nick (2013: online) observed that “once customers have narrowed down their restaurant choice to a few different eateries, they have what researchers call an ‘evoked set.’ The restaurants in an evoked set are often very similar with regards to price and food, so atmosphere frequently becomes the deciding factor”. General outlook is a matter when it comes to a restaurant. Figure 4.21 Service qualities not better than competitors
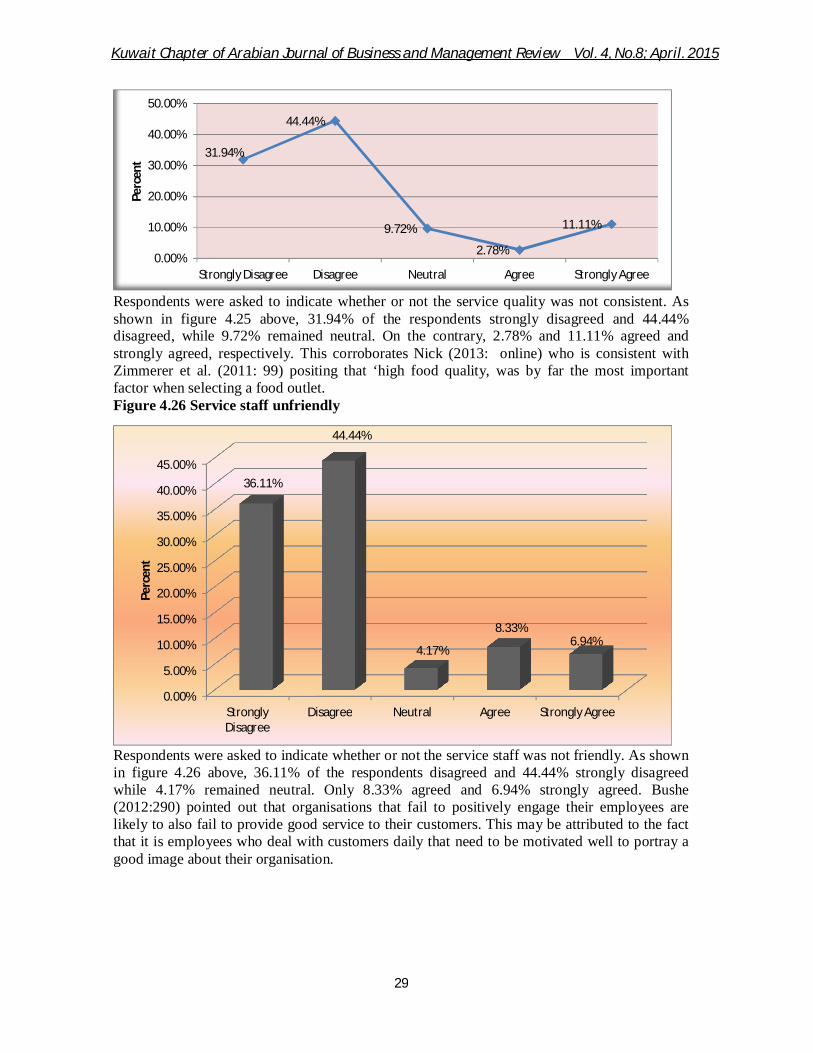
Respondents were asked to indicate whether or not the service quality was not better than competitors. As shown in figure 4.20 above, 50% of the respondents disagreed, 15.28% strongly disagreed while 8.33% remained neutral, 13.89% agreed and 12.50% strongly agreed. According to Du Plooy-Colliers et al. (2014: 87) service quality is the backbone to winning customer loyalty resulting in a competitive edge, and needs to be upheld. Figure 4.23 Staff attitude negative
15.28%
41.67%
15.28%
20.83%
6.94%
Strongly Disagree
Disagree
Neutral
Agree
Strong Agree
Percent
15.28%
50.00%
8.33%13.89% 12.50%
0.00%
10.00%
20.00%
30.00%
40.00%
50.00%
60.00%
Strongly Disagree
Disagree Neutral Agree Strongly Agree
Perc
ent
Kuwait Chapter of Arabian Journal of Business and Management Review Vol. 4, No.8; April. 2015
28
When respondents were asked to indicate whether or not staff attitude was negative, as indicated in figure 4.23 above, 35% of the respondents disagreed, 32% strongly disagreed while 4% remained neutral, 18% agreed and 11% strongly agreed. Nick (2013: online) reinforces the importance of staff attitude in gaining repeat business and eventually customer loyalty. A customer moves to be a client and then an advocate of the business, an unpaid sales person. Figure 4.24 Meal Experience not delightful
The questionnaire sought respondents’ perceptions of the meal experience. As shown in figure 4.24 above, a large number of respondents were of the view that the meal experience was delightful: About 37.50% and 29.17% of the respondents disagreed and strongly disagreed, respectively. However, 8.33% remained neutral. In addition to the 13.69% of respondents who agreed that the meal experience was not delightful, 11.11% strongly agreed. The meal experience stays long in the consumers’ minds and lingers to influence future consumer behavior. Figure 4.25 Food qualities inconsistent
32%
35%4%
18%11%
Staff Attitudes Negative Strongly Disagree Disagree Neutral Agree Strongly Agree
29.17%
37.50%
8.33%
13.69%
11.11%
Strongly Disagree Disagree Neutral Agree Strong Agree
Kuwait Chapter of Arabian Journal of Business and Management Review Vol. 4, No.8; April. 2015
29
Respondents were asked to indicate whether or not the service quality was not consistent. As shown in figure 4.25 above, 31.94% of the respondents strongly disagreed and 44.44% disagreed, while 9.72% remained neutral. On the contrary, 2.78% and 11.11% agreed and strongly agreed, respectively. This corroborates Nick (2013: online) who is consistent with Zimmerer et al. (2011: 99) positing that ‘high food quality, was by far the most important factor when selecting a food outlet. Figure 4.26 Service staff unfriendly
Respondents were asked to indicate whether or not the service staff was not friendly. As shown in figure 4.26 above, 36.11% of the respondents disagreed and 44.44% strongly disagreed while 4.17% remained neutral. Only 8.33% agreed and 6.94% strongly agreed. Bushe (2012:290) pointed out that organisations that fail to positively engage their employees are likely to also fail to provide good service to their customers. This may be attributed to the fact that it is employees who deal with customers daily that need to be motivated well to portray a good image about their organisation.
31.94%
44.44%
9.72%
2.78%
11.11%
0.00%
10.00%
20.00%
30.00%
40.00%
50.00%
Strongly Disagree Disagree Neutral Agree Strongly Agree
Perc
ent
0.00%
5.00%
10.00%
15.00%
20.00%
25.00%
30.00%
35.00%
40.00%
45.00%
Strongly Disagree
Disagree Neutral Agree Strongly Agree
36.11%
44.44%
4.17%
8.33%6.94%
Perc
ent
Kuwait Chapter of Arabian Journal of Business and Management Review Vol. 4, No.8; April. 2015
30
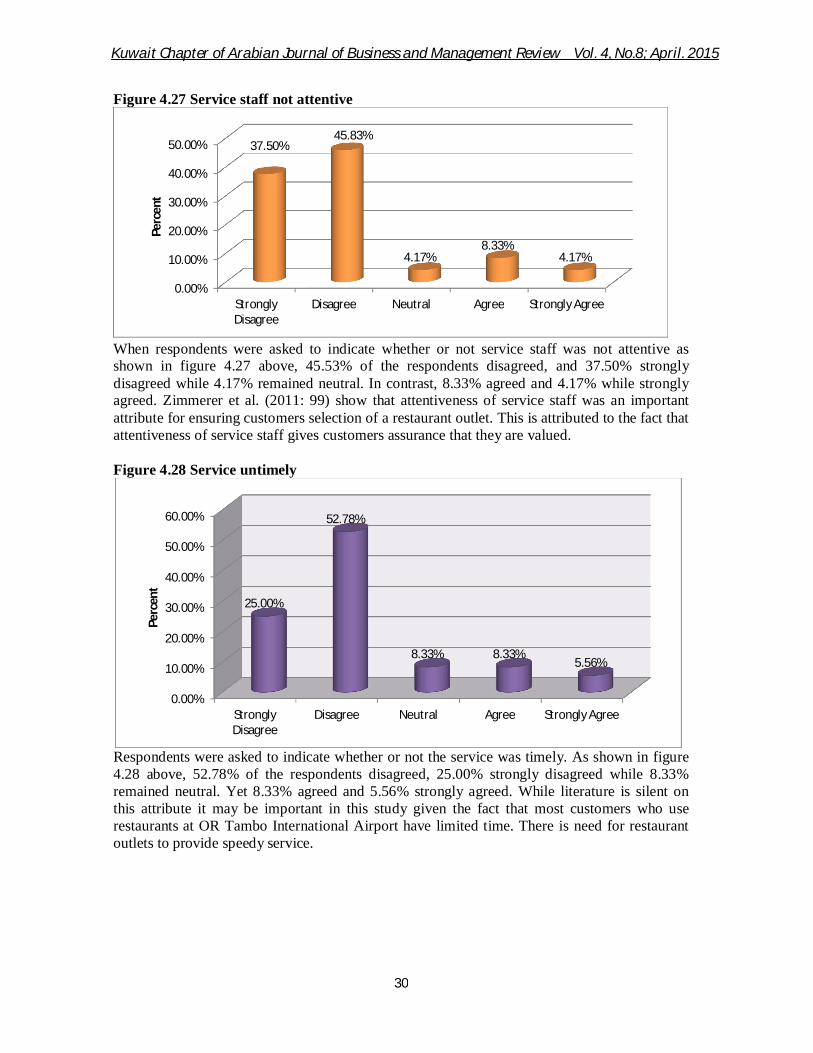
Figure 4.27 Service staff not attentive
When respondents were asked to indicate whether or not service staff was not attentive as shown in figure 4.27 above, 45.53% of the respondents disagreed, and 37.50% strongly disagreed while 4.17% remained neutral. In contrast, 8.33% agreed and 4.17% while strongly agreed. Zimmerer et al. (2011: 99) show that attentiveness of service staff was an important attribute for ensuring customers selection of a restaurant outlet. This is attributed to the fact that attentiveness of service staff gives customers assurance that they are valued. Figure 4.28 Service untimely
Respondents were asked to indicate whether or not the service was timely. As shown in figure 4.28 above, 52.78% of the respondents disagreed, 25.00% strongly disagreed while 8.33% remained neutral. Yet 8.33% agreed and 5.56% strongly agreed. While literature is silent on this attribute it may be important in this study given the fact that most customers who use restaurants at OR Tambo International Airport have limited time. There is need for restaurant outlets to provide speedy service.
0.00%
10.00%
20.00%
30.00%
40.00%
50.00%
Strongly Disagree
Disagree Neutral Agree Strongly Agree
37.50%45.83%
4.17%8.33%
4.17%
Perc
ent
0.00%
10.00%
20.00%
30.00%
40.00%
50.00%
60.00%
Strongly Disagree
Disagree Neutral Agree Strongly Agree
25.00%
52.78%
8.33% 8.33%5.56%
Perc
ent
Kuwait Chapter of Arabian Journal of Business and Management Review Vol. 4, No.8; April. 2015
31
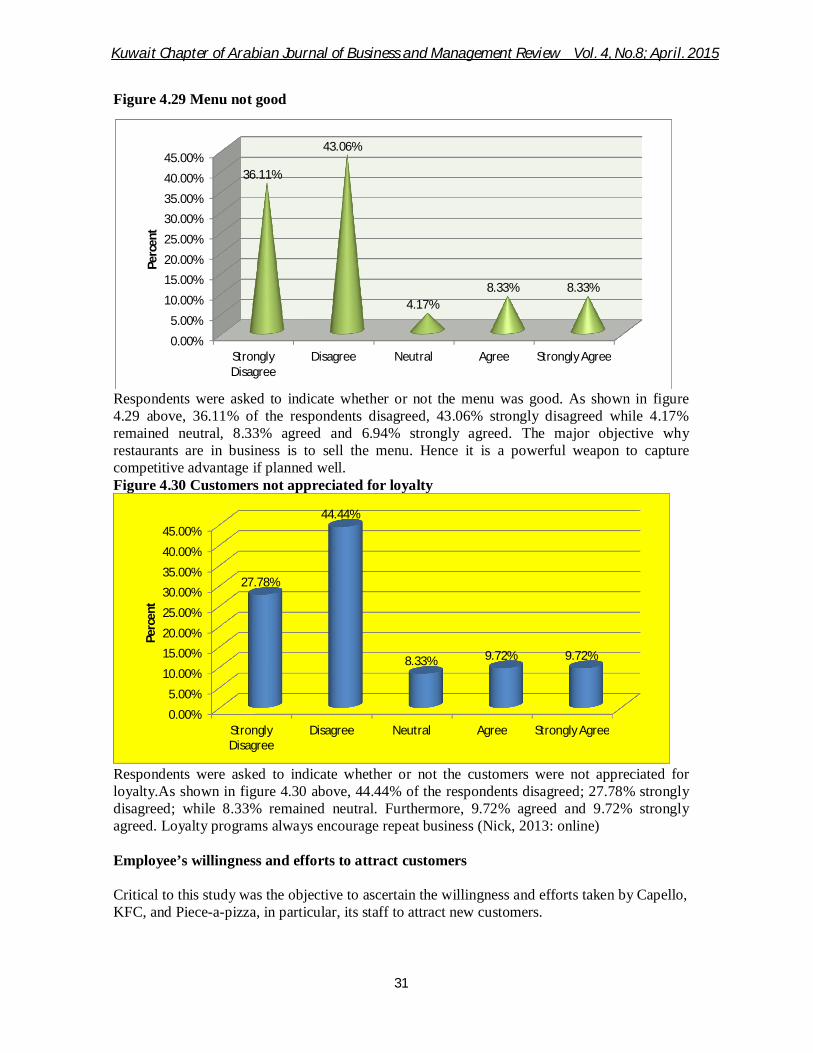
Figure 4.29 Menu not good
Respondents were asked to indicate whether or not the menu was good. As shown in figure 4.29 above, 36.11% of the respondents disagreed, 43.06% strongly disagreed while 4.17% remained neutral, 8.33% agreed and 6.94% strongly agreed. The major objective why restaurants are in business is to sell the menu. Hence it is a powerful weapon to capture competitive advantage if planned well. Figure 4.30 Customers not appreciated for loyalty
Respondents were asked to indicate whether or not the customers were not appreciated for loyalty.As shown in figure 4.30 above, 44.44% of the respondents disagreed; 27.78% strongly disagreed; while 8.33% remained neutral. Furthermore, 9.72% agreed and 9.72% strongly agreed. Loyalty programs always encourage repeat business (Nick, 2013: online) Employee’s willingness and efforts to attract customers Critical to this study was the objective to ascertain the willingness and efforts taken by Capello, KFC, and Piece-a-pizza, in particular, its staff to attract new customers.
0.00%
5.00%
10.00%
15.00%
20.00%
25.00%
30.00%
35.00%
40.00%
45.00%
Strongly Disagree
Disagree Neutral Agree Strongly Agree
36.11%
43.06%
4.17%8.33% 8.33%
Perc
ent
0.00%
5.00%
10.00%
15.00%
20.00%
25.00%
30.00%
35.00%
40.00%
45.00%
Strongly Disagree
Disagree Neutral Agree Strongly Agree
27.78%
44.44%
8.33% 9.72% 9.72%
Perc
ent
Kuwait Chapter of Arabian Journal of Business and Management Review Vol. 4, No.8; April. 2015
32
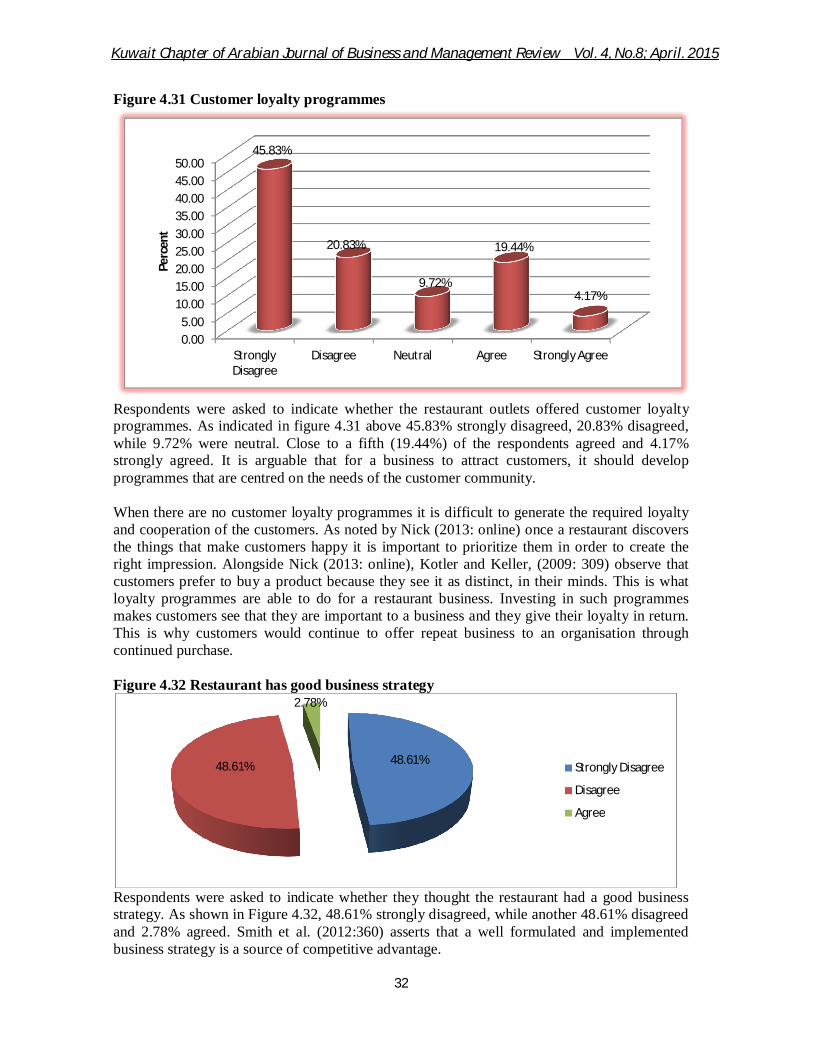
Figure 4.31 Customer loyalty programmes
Respondents were asked to indicate whether the restaurant outlets offered customer loyalty programmes. As indicated in figure 4.31 above 45.83% strongly disagreed, 20.83% disagreed, while 9.72% were neutral. Close to a fifth (19.44%) of the respondents agreed and 4.17% strongly agreed. It is arguable that for a business to attract customers, it should develop programmes that are centred on the needs of the customer community. When there are no customer loyalty programmes it is difficult to generate the required loyalty and cooperation of the customers. As noted by Nick (2013: online) once a restaurant discovers the things that make customers happy it is important to prioritize them in order to create the right impression. Alongside Nick (2013: online), Kotler and Keller, (2009: 309) observe that customers prefer to buy a product because they see it as distinct, in their minds. This is what loyalty programmes are able to do for a restaurant business. Investing in such programmes makes customers see that they are important to a business and they give their loyalty in return. This is why customers would continue to offer repeat business to an organisation through continued purchase. Figure 4.32 Restaurant has good business strategy
Respondents were asked to indicate whether they thought the restaurant had a good business strategy. As shown in Figure 4.32, 48.61% strongly disagreed, while another 48.61% disagreed and 2.78% agreed. Smith et al. (2012:360) asserts that a well formulated and implemented business strategy is a source of competitive advantage.
0.005.00
10.0015.0020.0025.0030.0035.0040.0045.0050.00
Strongly Disagree
Disagree Neutral Agree Strongly Agree
45.83%
20.83%
9.72%
19.44%
4.17%
Perc
ent
48.61%48.61%
2.78%
Strongly Disagree
Disagree
Agree
Kuwait Chapter of Arabian Journal of Business and Management Review Vol. 4, No.8; April. 2015
33
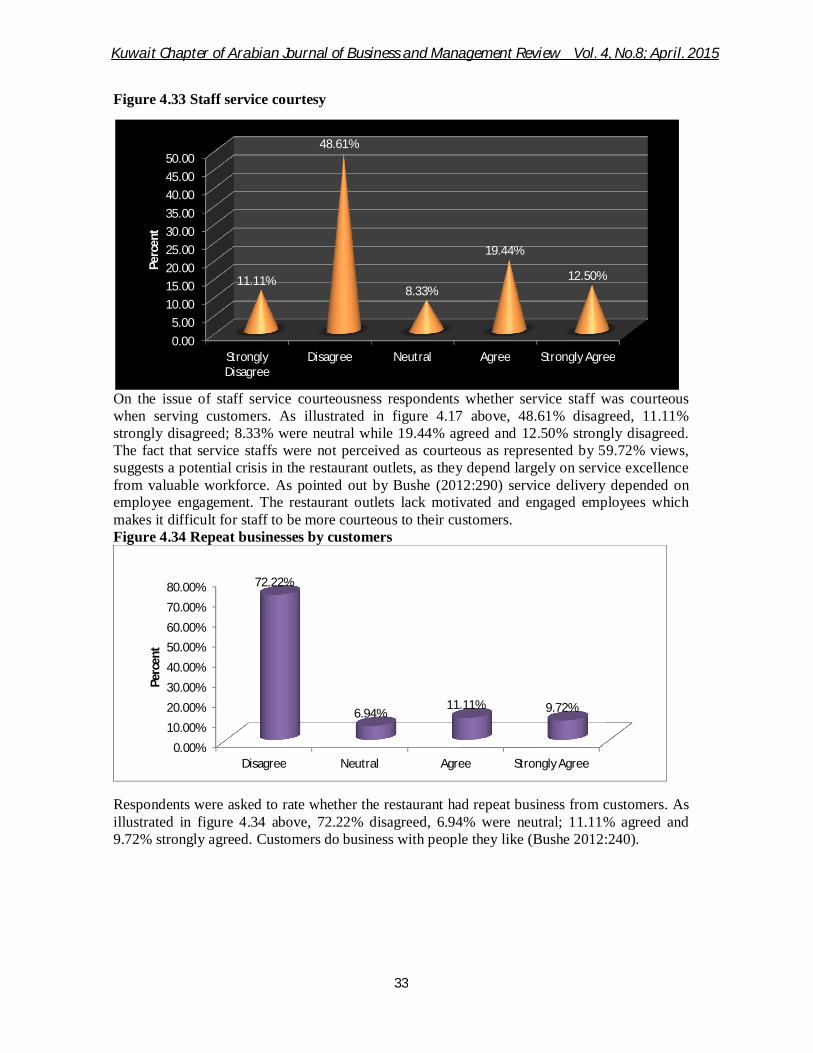
Figure 4.33 Staff service courtesy
On the issue of staff service courteousness respondents whether service staff was courteous when serving customers. As illustrated in figure 4.17 above, 48.61% disagreed, 11.11% strongly disagreed; 8.33% were neutral while 19.44% agreed and 12.50% strongly disagreed. The fact that service staffs were not perceived as courteous as represented by 59.72% views, suggests a potential crisis in the restaurant outlets, as they depend largely on service excellence from valuable workforce. As pointed out by Bushe (2012:290) service delivery depended on employee engagement. The restaurant outlets lack motivated and engaged employees which makes it difficult for staff to be more courteous to their customers. Figure 4.34 Repeat businesses by customers
Respondents were asked to rate whether the restaurant had repeat business from customers. As illustrated in figure 4.34 above, 72.22% disagreed, 6.94% were neutral; 11.11% agreed and 9.72% strongly agreed. Customers do business with people they like (Bushe 2012:240).
0.005.00
10.0015.0020.0025.0030.0035.0040.0045.0050.00
Strongly Disagree
Disagree Neutral Agree Strongly Agree
11.11%
48.61%
8.33%
19.44%
12.50%
Perc
ent
0.00%
10.00%
20.00%
30.00%
40.00%
50.00%60.00%
70.00%
80.00%
Disagree Neutral Agree Strongly Agree
72.22%
6.94%11.11% 9.72%
Perc
ent
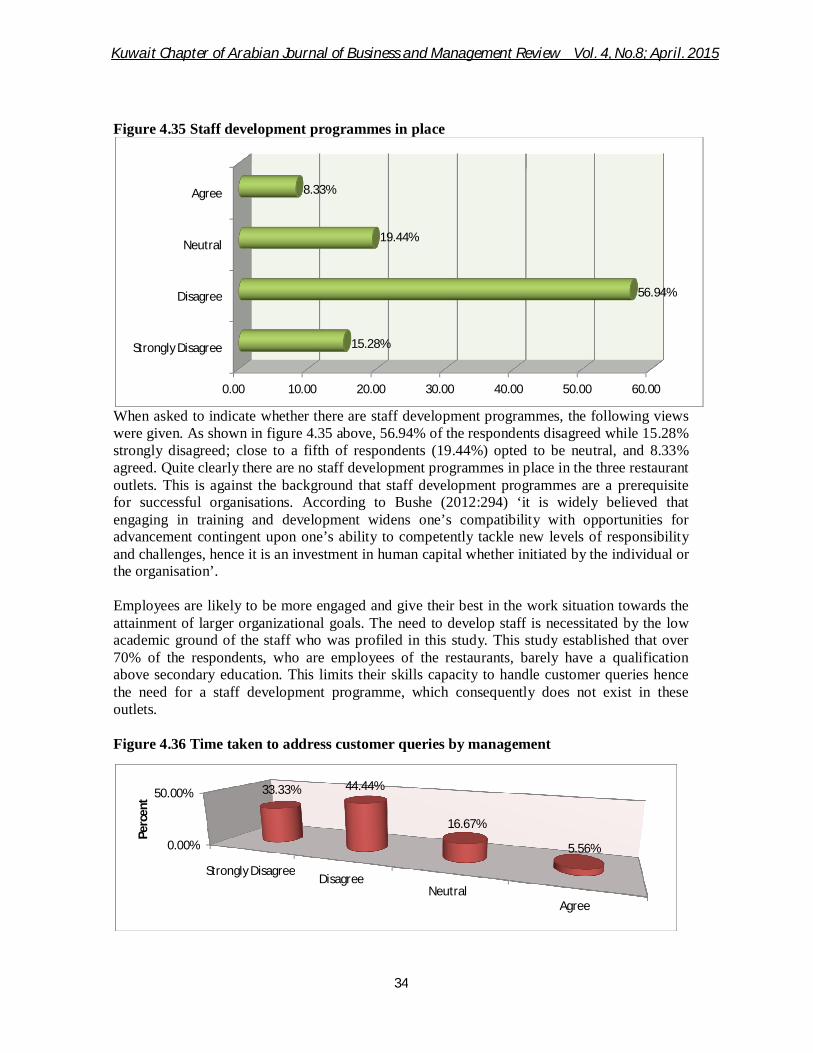
Kuwait Chapter of Arabian Journal of Business and Management Review Vol. 4, No.8; April. 2015
34
Figure 4.35 Staff development programmes in place
When asked to indicate whether there are staff development programmes, the following views were given. As shown in figure 4.35 above, 56.94% of the respondents disagreed while 15.28% strongly disagreed; close to a fifth of respondents (19.44%) opted to be neutral, and 8.33% agreed. Quite clearly there are no staff development programmes in place in the three restaurant outlets. This is against the background that staff development programmes are a prerequisite for successful organisations. According to Bushe (2012:294) ‘it is widely believed that engaging in training and development widens one’s compatibility with opportunities for advancement contingent upon one’s ability to competently tackle new levels of responsibility and challenges, hence it is an investment in human capital whether initiated by the individual or the organisation’. Employees are likely to be more engaged and give their best in the work situation towards the attainment of larger organizational goals. The need to develop staff is necessitated by the low academic ground of the staff who was profiled in this study. This study established that over 70% of the respondents, who are employees of the restaurants, barely have a qualification above secondary education. This limits their skills capacity to handle customer queries hence the need for a staff development programme, which consequently does not exist in these outlets. Figure 4.36 Time taken to address customer queries by management
0.00 10.00 20.00 30.00 40.00 50.00 60.00
Strongly Disagree
Disagree
Neutral
Agree
15.28%
56.94%
19.44%
8.33%
0.00%
50.00%
Strongly DisagreeDisagree
NeutralAgree
33.33% 44.44%
16.67%
5.56%
Perc
ent
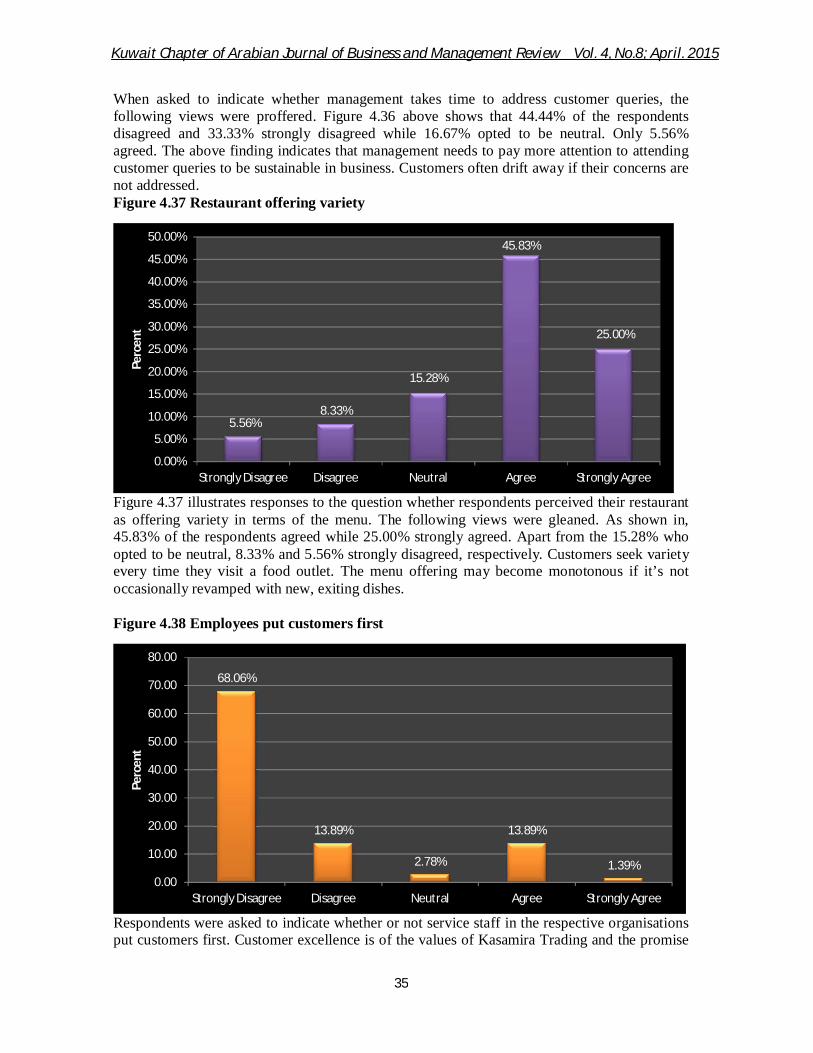
Kuwait Chapter of Arabian Journal of Business and Management Review Vol. 4, No.8; April. 2015
35
When asked to indicate whether management takes time to address customer queries, the following views were proffered. Figure 4.36 above shows that 44.44% of the respondents disagreed and 33.33% strongly disagreed while 16.67% opted to be neutral. Only 5.56% agreed. The above finding indicates that management needs to pay more attention to attending customer queries to be sustainable in business. Customers often drift away if their concerns are not addressed. Figure 4.37 Restaurant offering variety
Figure 4.37 illustrates responses to the question whether respondents perceived their restaurant as offering variety in terms of the menu. The following views were gleaned. As shown in, 45.83% of the respondents agreed while 25.00% strongly agreed. Apart from the 15.28% who opted to be neutral, 8.33% and 5.56% strongly disagreed, respectively. Customers seek variety every time they visit a food outlet. The menu offering may become monotonous if it’s not occasionally revamped with new, exiting dishes. Figure 4.38 Employees put customers first
Respondents were asked to indicate whether or not service staff in the respective organisations put customers first. Customer excellence is of the values of Kasamira Trading and the promise
5.56%8.33%
15.28%
45.83%
25.00%
0.00%
5.00%
10.00%
15.00%
20.00%
25.00%
30.00%
35.00%
40.00%
45.00%
50.00%
Strongly Disagree Disagree Neutral Agree Strongly Agree
Perc
ent
68.06%
13.89%
2.78%
13.89%
1.39%0.00
10.00
20.00
30.00
40.00
50.00
60.00
70.00
80.00
Strongly Disagree Disagree Neutral Agree Strongly Agree
Perc
ent

Kuwait Chapter of Arabian Journal of Business and Management Review Vol. 4, No.8; April. 2015
36
is to uphold that value. As illustrated in figure 4.38 above, 68.06% strongly disagreed and 13.89% disagreed 2.78% whereas remained neutral; and 13.89% agreed and 1.39% strongly agreed. It is arguable that putting customers first is a priority factor under total quality management. If customers do not see that they are being given priority attention they shift and give their business elsewhere (Smit et al., 2013:43). Figure 4.39 Up-selling by service staff
When asked whether respondents were willing to engage in up-selling, as shown in figure 4.39 above, 56.94% strongly disagreed, 27.28% of the respondents disagreed, 12.50% opted to be neutral while 2.78% agreed. This is implies that the level of enthusiasm to sell the restaurant outlet’s products and services to customers by employees is very low. Yet up-selling is critical to the success of any business is the motivation of staff, as they are the ones who interact with customers and sell the firm’s products and services. Failure to up-sell a restaurant’s products and services by employees could be attributed to low employee engagement emanating from low levels of motivation. Kahn (1990: 694) cited in Bushe (2012:290) defines employee engagement as “the harnessing of organisation members’ to their work roles; in engagement, people employ and express themselves physically, cognitively, and emotionally during role performances”. The cognitive aspect of employee engagement concerns employees’ beliefs about the organisation, its leaders and working conditions. It is important to note that the emotional aspect concerns how employees feel about each of those three factors and whether they have positive or negative attitudes toward the organisation and its leaders, (Kular et al., 2008: 220). The physical aspect of employee engagement concerns the physical energies exerted by individuals to accomplish their roles. Thus, according to Kahn (1990) cited in Bushe (2012:290), engagement means to be psychologically as well as physically present when occupying and performing an organisational role. Efforts to engage employees will benefit the restaurant outlets in enhancing employees ability to engage in efforts to up-sell their organisation’s products and services.
56.94%
27.78%
12.50%
2.78%
0.00
10.00
20.00
30.00
40.00
50.00
60.00
Strongly Disagree Disagree Neutral Agree
Perc
ent
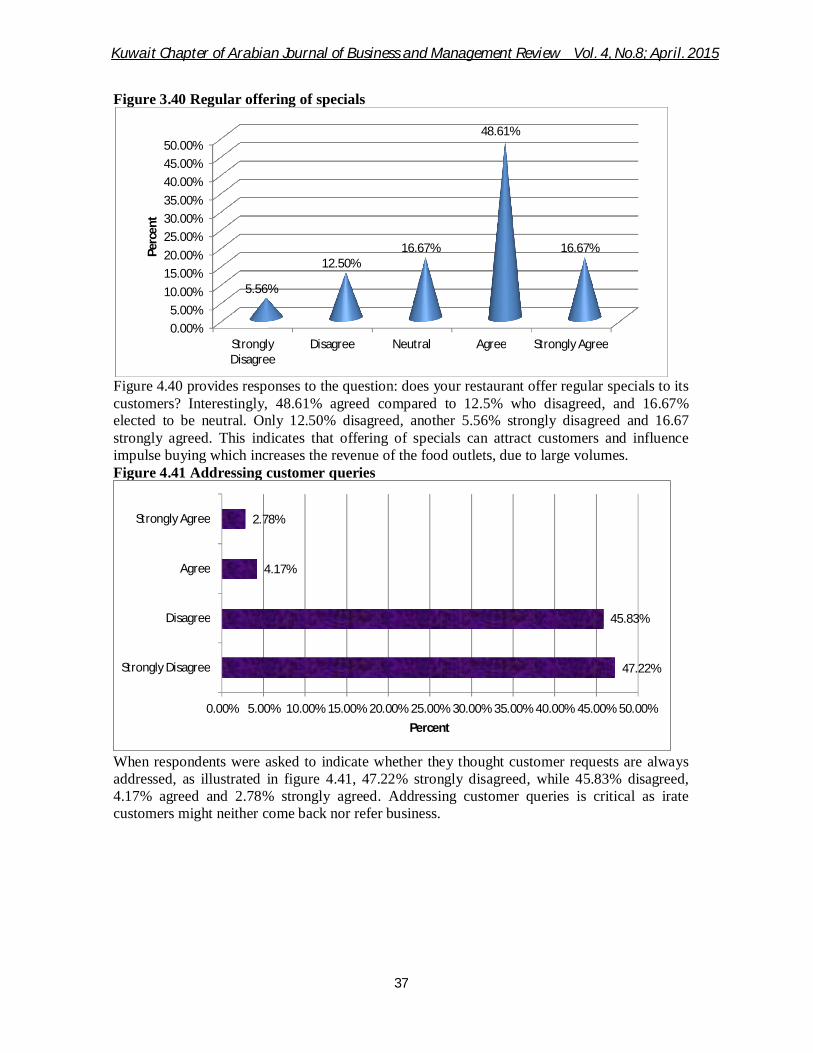
Kuwait Chapter of Arabian Journal of Business and Management Review Vol. 4, No.8; April. 2015
37
Figure 3.40 Regular offering of specials
Figure 4.40 provides responses to the question: does your restaurant offer regular specials to its customers? Interestingly, 48.61% agreed compared to 12.5% who disagreed, and 16.67% elected to be neutral. Only 12.50% disagreed, another 5.56% strongly disagreed and 16.67 strongly agreed. This indicates that offering of specials can attract customers and influence impulse buying which increases the revenue of the food outlets, due to large volumes. Figure 4.41 Addressing customer queries
When respondents were asked to indicate whether they thought customer requests are always addressed, as illustrated in figure 4.41, 47.22% strongly disagreed, while 45.83% disagreed, 4.17% agreed and 2.78% strongly agreed. Addressing customer queries is critical as irate customers might neither come back nor refer business.
0.00%5.00%
10.00%15.00%20.00%25.00%30.00%35.00%40.00%45.00%50.00%
Strongly Disagree
Disagree Neutral Agree Strongly Agree
5.56%
12.50%16.67%
48.61%
16.67%Perc
ent
47.22%
45.83%
4.17%
2.78%
0.00% 5.00% 10.00% 15.00% 20.00% 25.00% 30.00% 35.00% 40.00% 45.00% 50.00%
Strongly Disagree
Disagree
Agree
Strongly Agree
Percent
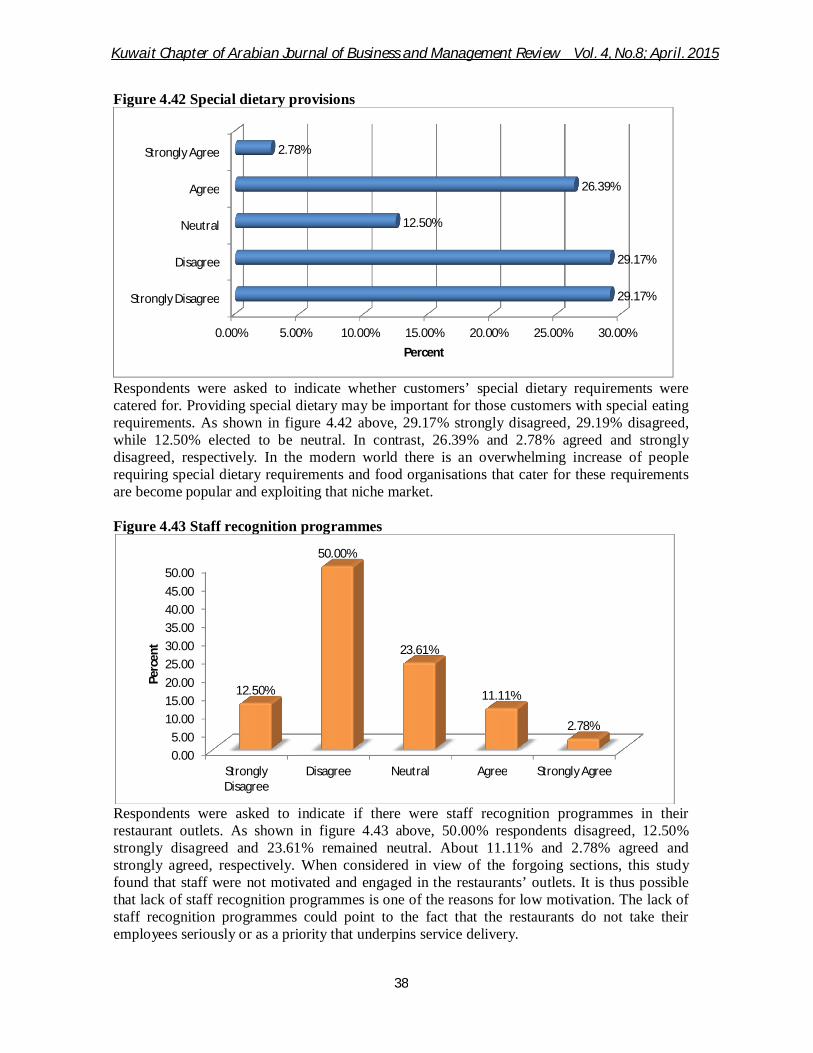
Kuwait Chapter of Arabian Journal of Business and Management Review Vol. 4, No.8; April. 2015
38
Figure 4.42 Special dietary provisions
Respondents were asked to indicate whether customers’ special dietary requirements were catered for. Providing special dietary may be important for those customers with special eating requirements. As shown in figure 4.42 above, 29.17% strongly disagreed, 29.19% disagreed, while 12.50% elected to be neutral. In contrast, 26.39% and 2.78% agreed and strongly disagreed, respectively. In the modern world there is an overwhelming increase of people requiring special dietary requirements and food organisations that cater for these requirements are become popular and exploiting that niche market. Figure 4.43 Staff recognition programmes
Respondents were asked to indicate if there were staff recognition programmes in their restaurant outlets. As shown in figure 4.43 above, 50.00% respondents disagreed, 12.50% strongly disagreed and 23.61% remained neutral. About 11.11% and 2.78% agreed and strongly agreed, respectively. When considered in view of the forgoing sections, this study found that staff were not motivated and engaged in the restaurants’ outlets. It is thus possible that lack of staff recognition programmes is one of the reasons for low motivation. The lack of staff recognition programmes could point to the fact that the restaurants do not take their employees seriously or as a priority that underpins service delivery.
0.00% 5.00% 10.00% 15.00% 20.00% 25.00% 30.00%
Strongly Disagree
Disagree
Neutral
Agree
Strongly Agree
29.17%
29.17%
12.50%
26.39%
2.78%
Percent
0.005.00
10.0015.0020.0025.0030.0035.0040.0045.0050.00
Strongly Disagree
Disagree Neutral Agree Strongly Agree
12.50%
50.00%
23.61%
11.11%
2.78%
Perc
ent

Kuwait Chapter of Arabian Journal of Business and Management Review Vol. 4, No.8; April. 2015
39
Figure 4.44 Opening and closing time convenient
When respondents were asked to indicate whether they thought the restaurant’s opening and closing times were convenient, as illustrated in figure 4.44 above, 41.67% agreed, while 26.39% strongly agreed, 11.11% opted to be neutral, while 12.50% disagreed and 8.33% strongly disagreed. The airport is a busy place that opens 24 hours a day and it is crucial for food outlets in that vicinity to open and close at convenient times for the customers. Figure 4.45 Level of staff motivation
As indicated in figure 4.45 above, 45.83% of the respondents strongly disagreed that staff were motivated, and 30.56% disagreed while 8.33% opted to remain neutral. On the contrary, 13.89% and 1.39% agreed and strongly agreed, respectively. When staff are not engaged they also withhold their physical energies from giving their best in the work situation. This is consistent with the views of Kular et al. (2008) who clear stated that ‘the physical aspect of employee engagement concerns the physical energies exerted by individuals to accomplish their roles’.
0.00% 5.00% 10.00% 15.00% 20.00% 25.00% 30.00% 35.00% 40.00% 45.00%
Strongly Disagree
Disagree
Neutral
Agree
Strongly Agree
8.33%
12.50%
11.11%
41.67%
26.39%
Percent
0.00
10.00
20.00
30.00
40.00
50.00
Strongly Disagree Disagree
NeutralAgree
Strongly Agree
45.83%
30.56%
8.33% 13.89%
1.39%
Perc
ent
Kuwait Chapter of Arabian Journal of Business and Management Review Vol. 4, No.8; April. 2015
40
CONCLUSIONS AND RECOMMENDATIONS
Objectives of the study are: 1) To examine the factors that impact on competitive position of Capello, KFC, and
Piece-a-pizza at OR Tambo International Airport; 2) To determine the challenge of competitive positioning of Capello, KFC, and Piece-
a-pizza at OR Tambo International Airport; 3) To examine employee willingness and efforts to attract more customers; 4) To recommend approaches to enhance competitive positioning of Capello, KFC,
and Piece-a-pizza at OR Tambo International Airport.
Findings from the study The findings from the research study are discussed under two headings namely; key findings from the literature review and key findings from the primary research. Key findings from the literature review are as follows:
Customers use certain criteria consisting of key attributes in selecting their choice of a restaurant outlet (Nick 2013: online).
Some of the attributes identified as critical to the competitiveness of a restaurant outlet include ‘high food quality, consistency, cleanliness, and friendly and attentive service from a well-trained wait staff amongst others’ (Zimmerer et al., 2011:99).
The ability to determine the attributes, which may also be defined as key success factors, was in itself regarded as a source of competitive advantage, and more so it was established that a restaurant needs to build on at one of the attributes in competing with its rival firms (Zimmerer et al., 2011:99).
It is important for an organisation to have a thorough understanding of its competitors as a basis for developing its own business strategy (Thompson et al., 2008:97).
The main challenge in competitively positioning a restaurant, as well as any other business organisation is three pronged. First, understanding the current and future needs of customers is a major challenge given the constantly changing business environment and tastes and preferences of customers and non-static trends. Second, satisfying customers’ requirements is not an easy challenge that every organisation must work with. Finally, ensuring that quality is everyone’s responsibility in an organisation is even more challenging, (Zimmerer et al., 2011: 99, Kruger and Ramphal, 2012:90 and Smit et al., 2013:43).
Getting every employee to own the quality process is a serious challenge in a restaurant environment, as this largely depends both on employee motivation, attitude and possession of the right competences. It is, however, critical that the quality process becomes the responsibility of everyone in the restaurant, in particular, contact customer service personnel or front-end employees who deal with customers directly (Smit et al., 2013:43).
When employees have the set of right skills (cognitive elements), and motivation they are highly likely to effectively represent an organisation to its external stakeholders including customers (Bushe 2012:290).
The ability to attract more customers hinges upon the employee’s ability to sell the organisation’s products and services. It is however difficult to achieve this goal with a lowly motivated workforce. The goal of the firm is to ensure that its employees are engaged. Employee engagement is an important principle in staff

Kuwait Chapter of Arabian Journal of Business and Management Review Vol. 4, No.8; April. 2015
41
motivation as engaged employees express themselves physically, cognitively and emotionally while they perform their jobs and roles (Smith, 2011:333).
Engagement is important because it has positive outcomes for both the individual and the organisation. The key elements of engagement are having the right employees in the right jobs, right skills, and supportive systems and strategies (Phelps and Brossoit, 2007: online).
An organisation ought to constantly engage in staff development to ensure that its workforce has the requisite skills set to address its customers’ needs (Phelps and Brossoit, 2007: online).
Failure to develop employees may spell challenges for an organisation as it may fail to meet its obligations because its employees are not motivated enough to contribute to the organisation’s goals (Phelps and Brossoit, 2007: online).
Key findings from the primary research are as follows: A sizeable number of 12.5% of the respondents only held Primary School
Leaving Certificate; and 19.4% of the respondents held Junior Secondary School qualifications, suggesting low levels of education among the employees of the three outlets. In terms of completing secondary level education, 54.2% of the respondents had graduated from Senior Secondary School. A considerable number of respondents (12.5%) held post-secondary qualifications including College Diplomas. Approximately 1.4% had attained other qualifications. From this data it can be ascertained that the skills levels of the respondents is low because of the poor educational levels of attainment.
Based on the findings of this study, a total of 43.1% had worked for the current employer for between six to 12 months followed by 29.2% who had less than 6 months working for the current employer and 19.4% had stayed between one and two years. Only 2.8% stayed with the current employer for between two to three years and the remaining 5.6% had stayed for more than 3years. A majority, almost half of the employees, had spent less than a year in their organisation, which signifies a high staff turnover.
Findings indicated that, of all the fundamental attributes measured, food quality and speed of service emerged as pre-dominantly strong and important.
Respondents were asked to indicate the factors that influence customers section of a restaurant and 88.99% agreed that food quality was the most important attribute as the basis of which customers use when selecting a restaurant.
Research shows 80.56% of the respondents were aware that the restaurant outlets were operating in a highly competitive environment and faced with stiff competition from rival firms.
The study revealed that 76.39% of the respondents disagreed that staff was motivated. This is a cause for concern for management as staff motivation is critical to the effective operation of a restaurant outlet.
The study revealed that 72.22% of the respondents disagreed that there was a staff development programme in place.
The research revealed that 62.50% of the respondents disagreed that there were staff recognition programmes in place to enhance employee engagement. This should be a cause for concern for management as it seeks to retain and engage staff.
Kuwait Chapter of Arabian Journal of Business and Management Review Vol. 4, No.8; April. 2015
42
Conclusions The primary findings assisted the researcher in answering the research questions that was formulated for this study. The study concluded that the food quality and speed of service were critical attributes to customer selection of a restaurant outlet at OR Tambo International Airport. Employee engagement is an important factor in achieving competitive positioning of a restaurant outlet. This study revealed that employees at Capello, KFC, and Piece-a-pizza were lowly motivated and therefore not fully engaged. This is further exacerbated by the lack of staff development and staff recognition programmes. Recommendations Guided by the findings of this study and the conclusions drawn by it, the following policy recommendations are offered: Management should act without further delay to address the competitiveness factors
problem facing Capello, KFC and Piece-a-Pizza. When doing so, management should pay attention to all categories of factors specified under this study. However, they must prioritize food quality, speed of service and quality of service, menu choice and atmosphere of the restaurant outlet. These categories of factors emerged as the top ranked needs in terms of importance for the competitiveness of Capello, KFC, and Piece-a-pizza. In particular, customers need to be guaranteed their food quality, speed of service given that their often use these restaurant while on the run in between check-in-periods.
Management at Capello, KFC, and Piece-a-pizza should broaden and entrench its
competitiveness strategy. This is important to address a number of competitiveness challenges revealed in this study, namely staff motivation, management addresses customer queries, addressing customer requests, employees put customers, up-selling by service staff, restaurant has good business strategy and staff development programme. Not only did the respondents consider elements to be the poorest competitiveness challenges at Capello, KFC, and Piece-a-pizza, they were also critical to ensure that these outlets compete effectively.
Management should keep abreast with the changes in tastes and preferences of customers, as well as trends in the hospitality industry and business environment to compete effectively. It is imperative for management to constantly survey the stakeholders, in particular the customer segments to establish their needs and decision factors so as to develop products and services to the satisfaction of their target markets.
To understand customer needs and satisfy them, management needs to increase customer
surveys and engagement through relationship marketing to ensure that they improve the service levels and product lines to the satisfaction of their target markets.
Areas for Further Research Whereas business competitiveness is one of the most widely studied concepts in areas such as strategic management, corporate strategy, and business administration, little research has been conducted around the subject in South Africa, especially in the context of hospitality establishments. Therefore, there is a cogent need for more studies that seek to apply and develop competitive models such as Porter five forces model, BCG, Ansolf, in the analysis of competitiveness of restaurants establishments. Future studies should also attempt a cross-sector comparison, form example comparing the restaurant to other retail, wholesale or manufacturing sector work settings. There is also a need for studies that transcend the assessment of factors
Kuwait Chapter of Arabian Journal of Business and Management Review Vol. 4, No.8; April. 2015
43
that influences competitiveness, to include a causal analysis in which the most important determinants of competitiveness are isolated. One of the major limitations of this study was resource availability, both time and money. The researcher had limited financial resources to facilitate the completion of this study and this affected the size of sample analyzed as well as number of organizations incorporated. There is need for more comprehensive studies that focus on customer groups as well as competing firms. Such studies could also adopt a cross-sectoral and/or cross-organizational comparative approach. Conclusion This chapter presented and discussed the findings of this study. While the first section addressed the key findings from literature review the second dealt with key findings from primary research leading to a conclusion and recommendation. This chapter also alluded to suggested areas for future research.
Bibliography Auty, S. (1992). Consumer choice and segmentation in the restaurant industry. Service Industries Journal, 12 (3), p. 324-339. Bushe, B. (2012). Factors that determine academic staff retention and commitment in private tertiary institutions in Botswana: Empirical Review, Global Advanced Vol. 1(9) pp. 278-299, October, 2012 Research Journals, Available online: http://garj.org/garjbb/index.htm Cant, M. and Machado, R. (2009). Marketing success stories. Cape Town: Oxford University Press Southern Africa Carter, P. L. (1999). spatial consumption decision-making: Six studies of restaurant choice. Dissertation Abstracts International Section A: Humanities and Social Sciences, (619439230; 1999-95003-038). Clark, M. A., and Wood, R. C. (1998). Consumer loyalty in the restaurant industry – a preliminary exploration of the issues. International Journal of Contemporary Hospitality Management, 10(4), p.139. DeNisi, A. S., Hitt, M. A., and Jackson, S. E. (2003). The knowledge based approach to sustainable competitive advantage. New York: Oxford University press. Du Plooy-Colliers, F., Davis C., and Bezuidenbout R.M., (2014). Research matters Cape Town: Juta. Einhon, H.J. (1970, 1971). Use of non-linear, non-compensatory models in decision making Psychological Bulletin. Einhon, H.J. (1971). Use of Non-linear, non-compensatory models as a function of task and amount of information Organisational Behavior and Human Performance, 6, p.1-27 Eun-jung, K, H. G. and Geistfeld, L. V. (2003). Consumers’ restaurant choice behavior and the impact of socio-economic and demographic factors. Journal of Foodservice Business Research, 6(1), p.3-24. Fleisher, G. and Bensoussan, C. (2007). Business and Competitive Analysis, New Jersey: FT Press. Gregory, S., and Kim, J. (2004). Restaurant choice: The role of information. Journal of Foodservice Business Research, 7(1), p 81-95. Herpen Van, E., Van Trijp, H., Kuipers, T. (2005). The influence of assortment organization on product comparisons and choice. Proceedings of Measuring Behavior 2005, 5th International Conference on Methods and Techniques in Behavioral Research (Wageningen, the Netherlands, 30 August - 2 September 2005), p. 595-596.
Kuwait Chapter of Arabian Journal of Business and Management Review Vol. 4, No.8; April. 2015
44
Heung, V. C. S. (2002). American theme restaurants: A study of consumer’s perceptions of the important attributes in restaurant selection. Asia Pacific Journal of Tourism Research, 7(1), p19-28. Hoopes, D.G. and Madsen, T.L. (2008). A capability-based view of competitive heterogeneity industrial and corporate change, p. 1-34 doi:10.1093/icc/dtn008. Hoopes, D.G., Madsen, T. L. and Walker, L.G. (2003). Why is there a resource-based view? Toward a theory of competitive heterogeneity,’ Strategic Management Journal, 24(10), p.889–902. Kasamira Trading (2013). Annual Report Johannesburg: Kasamira Trading Koo, L. C., Tao, F. K. C., and Yeung, J. H. C. (1999). Preferential segmentation of restaurant attributes through conjoint analysis. International Journal of Contemporary Hospitality Management, 11(5), p.242. Kotler, P. and Keller, K.L. (2009). Marketing Management, 13th Edition, New Jersey: Pearson Educational International. Kriegel, J. and Saelens, B.E. (2013). Impact of menu labelling on consumer behavior, Robert Wood Johnson Foundationonline [Accessed: 24.04.14] http://www.rwjf.org/en/research-publications/find-rwjf-research.html?pr=Robert+Wood+Johnson+Foundation. Kruger, D. and Ramphal, R. (2012). Operations management, 2nd Ed, Cape Town: Oxford University Press. Kular, S., Gatenby, M., Rees, C., Soane, E., Trus, K. (2008). Employee engagement: a literature review, Working Paper Series No 19, Kingston Business School, Kingston University. Lewis, R. (1981). Restaurant advertising: appeals and consumers’ intentions. Journal of Advertising Research, 21(5), p.69-74. Lynch, J.G. (1983). Looking for confirming evidence: the case of the elusive conjunctive decision process Florida: University of Florida. Maree, K. (2008). First Steps in research. 2nd Edition. Pretoria: Van Schaik Publishers. Nel, P.S., Werner A., Haasbroek G.D., Poisat P., Sono, T. and Schultz, H.B. (2009). Human resource management, 7th Ed, Cape Town: Oxford University Press. Neuman, W. L. (2007). Basics of social research: qualitative and quantitative approaches, New York: Pearson Education. Nick, (2013). Restaurant Choice and Consumer Behavior: What Motivates Your Customer online [accessed 24.04.14] http://www.tvidesigns.com/marketing/restaurant-choice-consumer-behavior-what-motivates-your-customer/ Njuguna, J.I. (2009), Strategic positioning for sustainable competitive advantage: an organizational learning approach, KCA Journal of Business Management: VOL. 2, Issue 1 (2009). p. 33-43. Noldus Information Technology (2014). Consumer behavior research and the observer xt, online [accessed: 23.04.14] http://www.noldus.com Njite, D., Dunn, G., and Hyunjung, K. L. (2008). Beyond good food: What other attributes influence consumer preference and selection of fine dining restaurants? Journal of Foodservice Business Research, 11(2), p. 237-266. Paulrajan, R. and Rajkumar, H. (2011). Service quality and customers preference of cellular mobile service providers. Journal of Technology Management & Innovation, 6(1), p. 38-45. Parasuraman, A, Berry, L.L. and Zeithaml, V.A. (2006). SERVQUAL.A multiple items scale for measuring consumer perceptions of service quality. Journal of Retailing.64:1 p.12-40. Accessed: 2014.07.07, Available:http://areas.kenan-flagler.unc.edu/Marketing/FacultyStaff/zeithaml/Selected%20Publications/SERVQUAL%20A%20MultipleItem%20Scale%20for%20Measuring%20Consumer%20Perceptions%20of%20Service%20Quality.pdf
Kuwait Chapter of Arabian Journal of Business and Management Review Vol. 4, No.8; April. 2015
45
Phelps, M. and Brossoit, K. (2007). Key drivers of employee engagement in today are manufacturing organisations, Industry Week. (Online) Accessed on: 2014.07.10, Available on: http://www.industryweek.com Poelman, A.A.M., Glorie, C., Mojet, J. (2005). Observation of food choice in catering before and after introduction of organic cheese and meat slices. Proceedings of Measuring Behavior 2005, 5th International Conference on Methods and Techniques in Behavioral Research (Wageningen, the Netherlands, 30 August - 2 September 2005), p. 561-562. Porter, M.E. (1980). Competitive strategy, New York: Free Press Saunders, M., Lewis, P. and Thornhill, A. (2007). Research methods for business students, 4th edition, Essex: Prentice Hall. Smit, P.J., Cronge, G.J., Brevis, T. and Vrba, M.J (2013). Management principles a contemporary Edition for Africa Cape Town: Juta and Company. Smith, A. (2011). Fundamentals of management, 2nd Edition, London: McGraw-Hill Higher Education. Thompson, A.A., Strickland, A.J. and Gamble, J.E. (2008). Crafting and executing strategy, Boston: McGraw-Hill. Trott, P. (2012). Innovation management and new product development, 5th Ed, Essex: Pearson. Wegner, P. (2012). Applied business statistics: methods and excel-based applications, 3rd edition, Cape Town: Juta and Company.