investigating community, reliability and usability of cfengine, chef
TRANSCRIPT

UNIVERSITY OF OSLODepartment of Informatics
InvestigatingCommunity, Reliabilityand Usability ofCFEngine, Chef andPuppet
Sudhir Pandey
Network and System Administration
Oslo and Akershus University College
May 22, 2012

1

Investigating Community, Reliability andUsability of CFEngine, Chef and Puppet
Sudhir Pandey
Network and System AdministrationOslo and Akershus University College
May 22, 2012

Abstract
An investigative study on community, reliability and usability of CFEngine,Chef and Puppet is represented in this paper. This research study attempts toquantify software qualities like community, reliability and usability of theseproducts and analyses the result to figure out if any product stands out in anyof these qualities. Comprehending software characteristics like community ,usability and reliability is complex operation often making it challenging tomake a quantifiable measurement on them. Research is made in this paper toexplore and make these qualities measurable and quantifiable through the ap-plication of different statistical and mathematical model. Product popularitytrend, resources available for product, community structure as well as it’s fieldsupport is studied utilizing different sources like Google, Hackers news andusers mailing list. Reliability growth in latest three version of these productis examined by application of Weibull distribution on data obtained from in-dividual bug repository. Finally the usability test is conducted to cover bothsubjective and objective aspect of user experience on these product to measureeach product’s usability and study the difference in usability offered by each.This research hopes to pave the way for future research into this area and helppeople to comprehend community ,reliability and usability of these products.

Acknowledgments
Foremost, I would like to express my sincere appreciation towards my super-visor Ismail Hassan for his support , motivation and encouragement. He hasbeen very supportive and constant source of encouragement through out theproject and course. I couldn’t have imagined a better advisor and mentor formy masters thesis.
My gratitude to Professor Mark Burgess for his guidance, inspiration and con-versation providing much valued inputs on everything regarding the project.His continuous guidance helped me during the time of research and writingof this thesis and I am very proud to be his advisee.
Thanks to Hrek Haugerud and Kyrre M. Begnum for their guidance and theirexcellent efforts to overcome the challenges faced through out the course. Ihave learned much from them and the program as a whole.
My sincere thank also goes to Mr Amir Maqbool Ahmed, my fellow classmateVangelis Tasoulas and my seniors Mr Issac linley, Mr Bishwa Shrestha for tak-ing their time to carry out the usability test which is part of this research. Ithas certainly been an wonderful learning experience for me.
I am also very grateful to be in a good company of fellow classmates. Theyhave been an excellent companions throughout the course. I would to likethank them for their good will and collaboration.
Last but not least ,my friends and family have always been there for me. Thankyou for your support.

Contents
1 Introduction 31.1 Configuration Management Tool . . . . . . . . . . . . . . . . . . 41.2 Motivation . . . . . . . . . . . . . . . . . . . . . . . . . . . . . . . 51.3 Problem Statements . . . . . . . . . . . . . . . . . . . . . . . . . . 6
2 Background and literature 72.1 Open source Assessment Methodologies . . . . . . . . . . . . . . 72.2 Literature overview . . . . . . . . . . . . . . . . . . . . . . . . . . 9
2.2.1 Leuven university site and paper . . . . . . . . . . . . . . 92.2.2 Comparison by Jarle Bjorgeengen . . . . . . . . . . . . . 162.2.3 University of Netherlands . . . . . . . . . . . . . . . . . . 18
2.3 Software overview . . . . . . . . . . . . . . . . . . . . . . . . . . 182.3.1 CFEngine . . . . . . . . . . . . . . . . . . . . . . . . . . . 192.3.2 Puppet . . . . . . . . . . . . . . . . . . . . . . . . . . . . . 252.3.3 Chef . . . . . . . . . . . . . . . . . . . . . . . . . . . . . . 29
2.4 Community . . . . . . . . . . . . . . . . . . . . . . . . . . . . . . 352.5 Reliability . . . . . . . . . . . . . . . . . . . . . . . . . . . . . . . 37
2.5.1 Models for Reliability . . . . . . . . . . . . . . . . . . . . 372.5.2 Theory . . . . . . . . . . . . . . . . . . . . . . . . . . . . . 38
2.6 Usability . . . . . . . . . . . . . . . . . . . . . . . . . . . . . . . . 392.6.1 Usability as Quality . . . . . . . . . . . . . . . . . . . . . 392.6.2 User Experience Measurement . . . . . . . . . . . . . . . 402.6.3 Objective Method . . . . . . . . . . . . . . . . . . . . . . . 412.6.4 Subjective Method . . . . . . . . . . . . . . . . . . . . . . 43
3 Approach 473.1 Community . . . . . . . . . . . . . . . . . . . . . . . . . . . . . . 47
3.1.1 Popularity analysis . . . . . . . . . . . . . . . . . . . . . . 483.1.2 Community and Support analysis . . . . . . . . . . . . . 49
3.2 Reliability . . . . . . . . . . . . . . . . . . . . . . . . . . . . . . . 523.3 Usability . . . . . . . . . . . . . . . . . . . . . . . . . . . . . . . . 53
3.3.1 Sample size and Test Conduction . . . . . . . . . . . . . . 543.3.2 Tasks and Metric Collection . . . . . . . . . . . . . . . . . 55
4 Data Collection and Results 594.1 Market share and Resource availability . . . . . . . . . . . . . . 59
4.1.1 Usage trends . . . . . . . . . . . . . . . . . . . . . . . . . 59
1

CONTENTS
4.1.2 Web site Popularity . . . . . . . . . . . . . . . . . . . . . . 604.1.3 Social discussion . . . . . . . . . . . . . . . . . . . . . . . 61
4.2 Mailing list . . . . . . . . . . . . . . . . . . . . . . . . . . . . . . . 614.3 Bug Repository . . . . . . . . . . . . . . . . . . . . . . . . . . . . 66
4.3.1 Data gathering . . . . . . . . . . . . . . . . . . . . . . . . 664.3.2 Data Filtering . . . . . . . . . . . . . . . . . . . . . . . . . 684.3.3 Results . . . . . . . . . . . . . . . . . . . . . . . . . . . . . 69
4.4 Usability test . . . . . . . . . . . . . . . . . . . . . . . . . . . . . . 694.4.1 Completion rate and Task times . . . . . . . . . . . . . . 714.4.2 Task difficulty level . . . . . . . . . . . . . . . . . . . . . . 714.4.3 Usability Problems . . . . . . . . . . . . . . . . . . . . . . 734.4.4 SUS scores . . . . . . . . . . . . . . . . . . . . . . . . . . . 73
5 Analysis 755.1 Community trends . . . . . . . . . . . . . . . . . . . . . . . . . . 75
5.1.1 Popularity and Resources available . . . . . . . . . . . . 765.2 Community Structure . . . . . . . . . . . . . . . . . . . . . . . . . 78
5.2.1 Analysis from mailing trends . . . . . . . . . . . . . . . . 785.2.2 Analysis of seekers group . . . . . . . . . . . . . . . . . . 785.2.3 Analysis of seekers providers group . . . . . . . . . . . . 795.2.4 Load distribution . . . . . . . . . . . . . . . . . . . . . . . 795.2.5 Analysis of Data miner script output . . . . . . . . . . . . 83
5.3 Reliability . . . . . . . . . . . . . . . . . . . . . . . . . . . . . . . 855.3.1 Distribution Fitting . . . . . . . . . . . . . . . . . . . . . . 855.3.2 Reliability growth . . . . . . . . . . . . . . . . . . . . . . 87
5.4 User experience . . . . . . . . . . . . . . . . . . . . . . . . . . . . 915.4.1 Task time and Perceived Easiness . . . . . . . . . . . . . . 955.4.2 Over all product usability . . . . . . . . . . . . . . . . . . 98
6 Conclusion and Future work 100
A HTML Parser and Crawler 106A.1 For Puppet’s Mailing List . . . . . . . . . . . . . . . . . . . . . . 106A.2 For Chef’s Mailing List . . . . . . . . . . . . . . . . . . . . . . . . 110
B Data Miner and tokeniser 117
C Glossary 122
2

Chapter 1
Introduction
Machines needed to be configured in one way or another in order to makethem useful for doing tasks. By configured it basically means installation ofof services and application and many more and this is only the most basicoperation needed to be performed in a single machine. For example to geta machine connected to the network it needs to be assigned an IP, i.e. it’snetwork card needs to be configured. In another scenario, if a computer is in anetwork and it needs to play a certain role for example DHCP server, a dhcpservice needs to be running on it and for that a set of files is required by thisservice should be configured.
If it is a single machine and the task doesn’t need to be done repeatedlythen it is feasible to carry out such things manually but it is not ideal at leastin the real world as task described above it needs to be done over and overagain. It may be due to machine failure or addition of identical machines inthe network. More organization have machines with different operating sys-tem and various applications on network thus resulting a heterogeneous envi-ronment to manage. One has to spend a huge amount of time doing differentadjustment and configuration to make these different system cooperate andachieve an operational network of machines playing their part. If it is the firsttime of set up these things are usually done manually. But what if it is to bedone again and again when new machine gets added to this network and itbreaks the whole set up because of different reason i.e. human errors, hard-ware failure etc. Hence, not only setting up such environment is difficult andtime consuming but managing them can be a daunting task if it is carried outmanually. More over it is a known fact that IT environment of organizationis dynamic in nature and it is impossible to manage it without some kind ofautomation.
With manual way of managing configuration files of machines we havetwo problems, the documentation end up in the heads of people and it is notscalable. Also if a same task to is be done multiple times , it is highly prone tohuman error. Even with most careful approach while following the explana-tory notes , it is always easy to miss the details thus resulting a miss configuredsystem. So to avoid such problems scripting was used to automate the task ofdoing configuration. But the scripting had problem that it was not scalable
3

1.1. CONFIGURATION MANAGEMENT TOOL
when the network grew as it needs to be modified every now and then to donew things and was difficult to track as they tend to be scattered all over theplace. The scripts thus introduced the new challenge of itself , that was tomanage the scripts which were meant to manage the different configurationfiles. Hence configuration management tools like CFEngine , Puppet and Chefcame into existence to get the job done and make life easier.
1.1 Configuration Management Tool
A configuration management (CM) tool is a robot that does work for you,keeping track of the files, packages, services, and other pieces of machines inyour environment and keeping them up-to-date for you [1]. These tool worksby reading a blueprint document that states how our system should look likeand how individual host in network should be configured. What goes insideblue print document is dependency analysis and this is further applied by con-figuration tool on runtime known as runtime configuration.
Dependency analysis means the task of knowing what things are neces-sary to get something done. In context of infrastructure architecture it meansputting together the layers of services and make a piece of software componentworking in the whole context. For example, a typical web application mightrequire a running database service and the web service available on a networketc. The runtime configuration relates to the process of taking all the infor-mation gathered from the dependency analysis and implementing them in thesystem. It involves populating correct configuration files , installing softwares, starting process etc. And more importantly all of this should be working evenafter the system reboot.
By gathering all the information about host configuration in a central repos-itory, it is trivial task to get the exact copy of such host. Just firing up the con-figuration management tool leads it go through the blue print document andapply minimal changes required for the new hardware and finally get the jobdone. Same process applies for the disaster recovery as well. For example incase of hardware failure, bringing on the new piece of hardware and lettinga configuration management tool do the rest will put the machine back intobusiness without much work from us. In case of software failure next run ofconfiguration management tool is enough to get everything back to the desiredstate. With the help of these tool greater flexibility is achieved as everythingdoes not need to be carried out from scratch once it is done. These tools are de-signed to automate much things as possible and reduces the amount of workneeded to be done by the human.
Configuration management tool also facilitates documentation. Since wehave configuration of each and every thing in a single repository a lot of thework is already done. We can get a list of machines ,tell what jobs they do, andexactly how each of them are configured just by inspecting the configurationfiles in repository. New hires can have a complete view of our network in it’scurrent state without tracking down every machine owner to find out whatexists. Similarly, it is also possible for system administrators to tell the auditors
4

1.2. MOTIVATION
about the current stage of their network at any time instead of scratching thehead and telling them about installed packages and configurations. It helpsto show what is exactly there within the system, completely eliminating theguess work to find out retired machines.
1.2 Motivation
Configuration management is essential part of system administration. Au-tomation of system administration is a must to handle the deluge; else swarmsof system administrators would be needed to handle all these systems [2].There is a rising demand for configuration management software from largecorporation to small business. An infrastructure based in configuration man-agement tool helps to layout a solid foundation which enables companies toachieve faster machine deployment, faster disaster recovery and increasedflexibility. Hence it is essential for these organization to have configurationmanagement tool to keep their IT infrastructure up and running 24/7 andachieve agility.
But for implementing the configuration management tool one must firstovercome the initial problem of choosing the right tool. Since adoption of con-figuration management tool is an investment of time and money into future, itis desired that our investment to be fruitful and well paid. We want to be surethat we picked up the right tool that meets the current need and obviouslybe usable and useful in future no matter what the circumstances are. Peoplewant to pick up right technology that can cope up with the changes likely to bemade in their IT infrastructure in future. It will be a pity if we have to make aswitch on to another tool down the road after two years of usage , additionallyat that time it will be virtually impossible and a painful task of switching onto another configuration management tool as everything in the infrastructurewill be based on it.
Large variety of configuration management tool are available to this date atvarious maturity level with different characteristics targeted for different usergroups. But it is easier to name the ”big three” in terms of their developmentstage and install base. Namely they are ”CFEngine , Chef and Puppet”. Allof them are mature product and is capable of completely handling an IT en-vironment. Making a choice between one of these is often difficult for a newuser and involves a lot of time and effort in trying to evaluate these productsfollowing different criteria. A number of things are considered by a commonusers before being committed to the product and they wonder around in in-ternet to find their answers. Thus the motivation of this thesis is to examinevarious frontiers like Community, Reliability and Usability of these productsproviding much information on these topics to users and helping them see thedifference if there is any.
5

1.3. PROBLEM STATEMENTS
1.3 Problem Statements
Number of articles and papers have been published comparing these productsthat can help the user to adopt a configuration management system [3] [4].There are also papers that guides the users to make a choice from the productsavailable [5] on basis of various features they provide and the technology theyare build upon. Apart from the underlying technology and features about theproduct, users are always keen on knowing the product’s popularity, how bigis it’s community , can they get their job done using the product , how willthey get support in case of trouble. In addition to these queries users oftenhave questions about community support, complains about the products andit’s impact on i.e. on scalability , usability or reliability etc. So there are variousquestion that comes on a mind of users when it comes to product selection.They try to find the answer to these kind of question going through forum,discussion sites , benchmarking and testing the products on their own andderive conclusion. But every investigation on these products are adhoc processthat ends up in the company documents, kept as private assets which are notaccepted as reliable source of information. Thus the target of this thesis isto investigate the community, reliability and usability of CFEngine, Chef andPuppet which can answers majority of the questions, as well as help users tohave a insight into those aspects of these products that has never been exposedand analyzed before.
6
Chapter 2
Background and literature
Today the field of configuration management and automation of infrastruc-ture is a hot topic. It tends to create a heated discussion between the usersthat have been exposed to the various tools and loyal to it. Also we can seea growing number of new solution to address the problem in the field. Fordecades this has been the field where the system administrator has been im-plementing their ad hoc solution to fulfill their need. By inspection of reviewson the web and papers published we can find out that there exist top threeopen source solution that are widely used and popular. These solution areable to meet the various requirement of infrastructure management as claimedby their sources and users, also there are active company behind the develop-ment of these products. Hence we can focus our attention on these products todo the job of infrastructure management. When it comes to the task of pickingone from these products ,it becomes tricker and often daunting task for systemadministrators. It is time consuming process to study their pros and cons anddetermine which one best meet the need. Often by a quick search on web pro-vides the result that are the outcome of individual evaluation technique andcriteria which are some what ad-hoc in nature. Also these results seems to beheavily influenced by individual requirement and experience. So one cannotmake decisions based in these results, as the broad view in analyzing theseproducts is not taken into account.
It becomes even more increasingly frustrating when you see contradictingpieces of information from various source about the same product. Previouswork done on analyzing these products like comparison of the performanceand resource usage [4] or analysis of usability [3] are either too focused innature or not following a scientific mechanism that accounts all the aspectsof the product. Since these products are open source, various things can andneed to be in consideration on making a successful evaluation and analysis ofthese products.
2.1 Open source Assessment Methodologies
The process to keep a list of criteria on which a open source can to be evaluateddates back to 2003 which was started by David Wheeler[6]. Since then a num-
7

2.1. OPEN SOURCE ASSESSMENT METHODOLOGIES
ber of work has been done on this area that resulted various methodologiesfor analyzing the open source software. David revised the list in 2011 whichcan be found in [7]. At present there exist a lot of methodologies discussedin wikipedia[8]. The wiki also shows comparison chart between the variousmethods. Later ones were developed for addressing the limitation of the olderones. Among the different methods, the methods like QSOS[9] and OpenBRR[10] seemed to be consider broad range of software aspects organized in hier-archical manner. But these also have limitation and not perfect thus the criteriaare constantly revised and updated. At the time of writing the thesis OpenBRRwas being revised to get new list of criteria for analyzing the software whichis a strong evidence a single given methodology cannot be applied in all thecircumstances and methodology must be generic thoroughly revised to meetthe need of dynamic IT industry. Therefore a research was conducted as partof The European commission funded project named Qualoss [11] for makinga detailed and rigorous assessment methodology comparison between previ-ously discussed [9] [10] and find out their limitation that is shown clearly inpaper [12]. The paper [12] aimed to drop the bad points from the previousmethods while combining the good points. However the paper contradictswith our way of viewing the criteria list.
Observing the QSOS , it seems to apply criteria of evaluation in 3 levels.Using a precise wording in it’s top level , it discusses a list of characteristics insecond level which are straight forward and in third level are a set of metricssome what repetitive. But the problem with this model is it is rigid and doesn’tpermit addition of more metrics in it’s top level. OpenBRR method organizescriteria in 2 levels , first level being generic and broad while the second levelis clear in what it want as answer, but quite difficult to measure unless it isbroken up into further metrics that can be measurable. It is because of thisfact many open source software are being evaluated on OSOS methodology[6]. ”But can a method be universal” [12] and each and every open sourcesoftware analyzed by using same number of metric under any kind of circum-stances. The article [12] came up with 3 level criteria list on top of which has alist from QSOS but it seriously lack the openness of methodology that user isfree to apply. A 3 level criteria list is enough to come of with metrics that can beused for analysis of software product but the top level must be broad as possi-ble to incorporate may sub criteria inside it as felt by the user. A custom modelcan be constructed we can use the top level criteria from OpenBRR combinedother level of methods discussed in [7] that OpenBRR lacks. Second level cri-teria from both OpenBRR and QSOS can be used to come up with a definitemodel and further split up each criteria in second level to a measurable metricand precisely describable for all of the tools into account. We strongly believeafter assessment of the tools using this model will be present clear picture andsupply information regarding almost all the thing that user like to know aboutthese products. Of-course all of the criteria as shown in fig2.3 are generic andcan be applied to any open source software in general. It is easy to get startedwith analysis on more generic term and then focusing finally in the specificparticular field where the product is focused.
For a in depth analysis of product it is even important to have a a good
8

2.2. LITERATURE OVERVIEW
understanding of field where the software is used for. A clear understandingof the problem the software is trying to solve is needed. Are there enoughfunctionality in the software that makes a product capable of doing what ittakes? Is the architecture of software strong enough to cope up with the futurechallenge in that particular field etc. All these kind of question are field specificand they need to be addressed for making a strong analysis. Fig 2.2 shows theapplication specific criteria for analysis
2.2 Literature overview
2.2.1 Leuven university site and paper
An effective framework for evaluation of configuration management tool waspresented by a the research group from Leuven university for the large scalesystem administration conference held in 2010. The framework was then ap-plied on 11 different the configuration management for analyzing these sys-tem. The frame work takes 4 main criteria into concern, starting from inputspecification which is concerned about the configuration language, secondlydeployment style discussing how the configuration rules get enforced in theend system. Third criteria is management that focuses on the functionality andscalability etc of the product. The third being support which discusses aboutthe documentation etc for these system. The criteria discussed in the paperis specifically related to configuration management field. The paper is muchhelpful in capturing the over all picture of what each of the discussed configu-ration management solution offers and what one should be looking into con-sideration in order to choose a configuration management product that suitshis/her need. It provides almost all the needed information one need to knowin order to make a better comparison between the configuration tool and fi-nally make a evaluation of those products that matches the user requirement.The level of details focusing configuration tool in this paper is very granu-lar and elaborative. Different ” well thought” aspects of configuration tool isdiscussed as background and based on those aspect the competitive study iscarried out between these tools. Thus it is clearly able to all show those precisethings that is needed to make a good configuration tool and tries to explore ifthose things are the available in tools present in the market. The top 4 charac-teristics, is further divided in to sub categories to give a clear understandingof scope and area which is explained briefly. The table 2.1 tries to summarizethe result for CFEngine , Chef and puppet from their paper [5]
1. Specification properties
• Specification paradigm which deals with the type configuration lan-guage and the User Interface the product provides. This languageis used to specify the user intention as configuration specification.The User interface helps the user to work with the tool implementthe intention into language.
9

2.2. LITERATURE OVERVIEW
Sustainability
Professnalism
Customizability
maintainence
MatirityAge
Stability
History known problem
AdoptionPopularity/Market share
Refrebces
Community strength
Books
Leadershipleadaer
Core team
management style
ActivityDevelopers
Activity on bugs
release Activity
functional activity
DevelopmentCompany /Community
Servicetraining
support
consulting
DocumentationDocumnetation / RecentnessQuality assuracnce
Security issues
Issues after each realse
QA tools
PackagingSoftware distribution
Os vendors
Professional Service
AdaptabilityInteroperability
dependency
flexiblity
Modularitymodules
API
Technological Dispertion
UsabilityAdministration
Functionality
monitoring
StrategyLicense
Roadmap
Sponsor
strategic decision
Figure 2.1: Generic Criteria For Product Analysis
10

2.2. LITERATURE OVERVIEW
Performance
Deployment
Execution
State Verification
State Implementation
Resource Utilization
State Verification
State Implementation
Scalability
Interoperability and heteroginity
Nodes supported
Cost analysis
Installation and Upgrades
Architecture
client server implemenation
Installed Components
Security mechanism
Language (type, structure)
Role Assignment
Decision taking mechanism
Protocols for communication
FunctionalityInstallation management
Service managment
Application Configuration
Virtualization Management
File management
Fault tolerant
Agility
Reporting and monitoring
Repository control /versioning
staging (replication)
self documentation
IT compliance
Figure 2.2: Application Criteria For Product Analysis
11

2.2. LITERATURE OVERVIEW
• Abstraction Mechanism is used to provide the details of the abstrac-tion level that configuration tool can provide to implement the userdesired state. The paper discusses about 6 abstraction level the toolcan provide to deal with the complexity of the infrastructure.
• Modularization mechanism explains the different ways the configura-tion tool provides it’s user to make the code reusable. One of themain aspect of using the configuration tool is to avoid repetitivetask, those task can be written as configuration steps using the con-figuration tool’s respective language and this code now can be usewhen ever such task is to be carried out in future.
• Modeling of relation tries to views the infrastructure as a system withvarious components holding different relation ship with each other.It tries to explore configuration tool ability to support these kind ofrelationship, so when ever some thing is changed the tool can auto-matically adjust configuration for other. Thus it reduces error anddown time in the system and facilitates automation. It categorizesthose relation in terms of granularity on basis of instance relationand arity on basis of one to one , one to many and many to many. Itis a very typical subject to be studied in the configuration tool whichenables the user to determine the tools capability in advance.
2. Deployment properties
• Scalability discusses the ability of configuration tool to adapt to thechanges with the growth of infrastructure. The tool must be ableto provide configuration specification for those large and complexenvironment.
• Workflow deals with the planning and executing of configurationchanges. Keeping this into consideration the authors tries to iden-tify the tools ability to enforce such work flow mechanism that facil-itates a smooth transfer of the system state with out any disruption.Smooth transition can be achieved by coordinating the distributivechanges and by preserving the state while making change.
• Deployment architecture describes the architecture used by configu-ration tool to deploying the input specification. The written downconfiguration specification has to be implemented on each machines, hence configuration tool deploys agent on individual machinesthat are controlled centrally or act independently. It also discusshow these agents obtain their configuration specification i.e. viapush or pull.
• Platform support tend to take the heterogeneity of infrastructure intoaccount and compare the tool on basis of the number if platformsthey support. Large number of platform support is always desirableas it plays vital role scalability and interoperability.
3. Management Properties
12

2.2. LITERATURE OVERVIEW
• Usability in this paper takes three main things into consideration ,Firstly the easiness of the language that enable the user to quicklyswitch into these tool. Secondly support for testing the specifica-tion which lets user understand to see and understand the impactof specification prior to the implementation in production environ-ment. And lastly the monitoring the capability of the tool in itselfand possibility of integration with other monitoring tools which en-ables the user to get information about the current state of the sys-tem.
• Versioning support helps the user to document and track of their con-figuration specification. The researchers have tried to identify thisfeature in all the 11 tools.
• Specification Documentation is used to point out the ability of the toolto generate the necessary documentation about the infrastructurefrom the configuration specification itself.
• Integration with environment is used to point out the ability of theconfiguration tool to consume information from other parts of theinfrastructure in it’s configuration specification. This enables theusers to avoid duplication of information because they need nothave to write the information explicitly for the configuration tool.Once such case is consuming the users and roles from the LDAPserver.
• Conflict management discusses about the possibility of having theconflicting definition on the configuration specification and the abil-ity the configuration tool to deal those conflicts. Different kinds ofconflicts like application specific conflicts e.g. cause by binding twoapplication in same port or Modality conflicts e.g. caused by start-ing and stopping a service in a same machine needed to be detectedand acted upon.
• Workow enforcement can be regarded as the feature built into thesetool that models the workflow while rolling out the configurationspecification. Typically a configuration specification passes throughvarious phases i.e. Q&A testing etc and also junior system admin-istrator writing the configuration specification which are to be re-viewed by senior administrator the code before being rolled out inproduction.
• Access control is one of the desired feature in configuration tool thatallows only the relevant person to write and change the configu-ration specification. The tool should have authentication and au-thorization of system administrator in place before making changesand prevent and allow access on configuration specification the basedon their credentials.
4. Support
• Available documentation is used to get a clear picture of the docu-mentation for the tool on various level. The documentation should
13

2.2. LITERATURE OVERVIEW
be brief and offer less barrier to get the novice user started whileprovide the extensive and elaborative material describing all the as-pects of tool for the experienced user.
• Commercial support helps to quantify the tool can be trusted and beadopted for use.
• Community is important aspect of any configuration tool throughwhich a lot of information can be retrieved to tackle problems andfor getting suggestion on tools usage. It needs to be active andlively.
• Maturity for pointing out the stability of the configuration tool.
As seen in the table the survey presents a very detailed background theoryalong with the competitive information different aspects of the configurationtool. The division of the whole task of analysis into 4 categorical views withunambiguous criteria presents a a clear and easy to flow mechanism. The re-searchers has also introduced interesting aspect like abstraction mechanismand levels , work flow methods and conflict management traits that seemedto be innovative and different from other available methods of analysis. Theexploration of abstraction mechanism can leverage one to understand the truepotential of the configuration tool. However there are some aspects where theresearchers could have done more. For example they have presented a well de-fined method on which one can study the deployment characteristics but theknowledge about the translating agent and their method of communication isnot only sufficient. It is essential to know how the decision taking mechanismis coupled with the implementation of configuration specification, I believe itpresents a much clear picture. The agent can be thin doing only implementa-tion or Thick doing all the compilation and implementation of the configura-tion specification. Hence if the agent does all the heavy lifting it can distribu-tive and scalable as less work is done in server. Knowing only if the agent ispush or pull based is only a small part of information what the agent pulls orthe server is capable to push can present more information. Also if we take alook at the usability analysis , the researches have ranked the tools difficultyon their own experience and understandability which is a bit unscientific waywhich might not represent the actual experience of the users. The researchersalso have taken scalability into account and have clearly stated they analyzedthis metric on real life use case on a single server handling number of clients.But this metric need to be analyzed with carefully performed lab experimentproviding same kind of environment i.e. providing same hard ware capabilityto all the tools.
The survey clearly lacks to explain the methodology that the researchersapplied to obtain the result. For example the researchers have given their re-sult of on the community size on purely based on their estimation and theirexperience. It have been very useful to get some numbers and trends i.e.growth/ decay in the community size. Various methods can be implementedto make a significant research on community size from monitoring the mail-ing list to monitoring the activities in repository and the user contribution on
14

2.2. LITERATURE OVERVIEW
CFEngine Chef PuppetSpecification Properties
Specification paradigmLanguage Declarative Imperative Declarative
User interface CLI GUI + CLI CLI +GUI
Abstraction MechanismGrouping mechanism Classes Roles Classes
Configuration modules Bundles Cook Books modules
Relation Modeling
one-to-one,one-to-manyand,many-to-many betweenparameters in-stances
many-to-manybetween in-stances
one -to-many be-tween instances
Deployment PropertiesScalability nodes supported more than10K 1000-10K unknownWork flow Distributed changes supported supported un supported
Deployment Architecture Translation agentstrongly dis-tributed
central serverneeded
central serverneeded
Distribution mechanism pull pull pull
Platforms
*BSD, AIX, HP-UX, Linux,MacOS X, Solaris andWindows
*BSD, Linux, MacOS X, Solaris andWindows
*BSD, AIX,Linux, Mac OSX,Solaris
Specification Management PropertiesUsability Tool as a whole medium hard medium
Specification testing dry runmultiple environ-ment
multiple environ-ment with dryrun
Monitoringbuild in andIntegration withother tools
easy integrationwith Nagios
reports in met-rics with in eachnode and integra-tion with Nagois
Versioning support svn or git svn or git svn or git
Specification documentation
structuredcomment forgeneration ofdocumentation
comments oncode if structuredRdoc can be used
comments oncode can gen-erate referencedocumentation(limited).
Integration with environmentrun time discov-ery
run time discov-ery
crun time discov-ery.
Conflict management modality conflict modality conflict unknown.Workow enforcement no no no.
Access control file path based file path basedroles based insideconfigurationspecification.
Support
Available documentation
extensive refer-ence documen-tation on website
extensive refer-ence documen-tation on website
extensive refer-ence documen-tation on website.
Commercial support yes yes yes.Community large and active large and active large and active.maturity since 1993 since 2006 since 2009.
Table 2.1: Summarize result of result conducted in[5]
15

2.2. LITERATURE OVERVIEW
actually using these products. A nice comparison of community size betweenpuppet and chef is presented in this paper [13]. Also the researchers kept ma-turity into concern but fail to mention the significance of maturity i.e. whywas the maturity taken into account at the first place. Knowing how old is theproduct does not mean any thing to the users but Using maturity for analysisof reliability of the product will be a more interesting topic. We can collectvarious information from the bug tracker of these tool. A mature product willobviously provide large number of information about it’s usage. Hence fromit’s history a reliability study can be carried to reach the final point of stability.More over the paper only provides a brief discussion on specific characteristicsfocusing some criteria of the products buts lacks other essential criteria of eval-uation like total cost of ownership, flexibility and customizability etc. Over allthe paper is nice to get a brief understanding of the field and get a grips ofwhat is going to be analyzed but a a significant researched can be conductedin each mentioned criteria to produce a well explained analysis.
There is already an existing comparison [2] that demonstrate the differencein the language structure of 3 different products highlighting their pro andcons in brief. But it only provides the top level view which helps the commu-nity realize their difference in terms of their architecture, language used andthe working mechanism. This is helpful to understand these product puttingthem side by side and see the difference but it lacks the level of detail onewants on these kind of comparison. Neither does it provide a extensive inves-tigation on the languages of these product nor does it discusses the architecturein details. While understanding these products it is essential to know the com-munication that happens between various components of the software, howdifferent bits and pieces of policy files are linked together and configurationfiles are generated ,Where are the policy files compiled, what does it take tomake a simple policy files, what are the different things needed and wheredo a user need to put those files. Though it’s product specific information itwill be much helpful data in analyzing the usability and deployment charac-teristics of the product. One must need to play around with each individualsoftware to have a clear understanding of the product and get the grammarin grasp in order to document the difference in architecture and language indetail that can be useful for the community.
2.2.2 Comparison by Jarle Bjorgeengen
A different but an organized model of comparison focusing in specific proper-ties was made by Jarle Bjorgeengen in making a comparison between puppet,CFEngine and Redhat satellite in this paper [14]. This study shows how com-parative study between product can be done be able to show the result thatis easy to understand and perceive. He has done a awesome job by doing alisting out various aspects that are relevant to configuration management tooland marking them as present and not present in the products like CFEngine,Puppet and Redhat satellite. How ever the comparison fails to show the bigpicture. By big picture i mean to say a number of things are missing in thiscomparison, Questions like how well the product is adopted by the users , how
16

2.2. LITERATURE OVERVIEW
good is the support and documentation of these products are still unanswered.For the adopting these product for organizational use case commercial sup-port is absolutely needed and it is good to know on what level, also the otherthings that can be taken in to account is the leadership of these products whichclearly influences the road map of the products and innovation. The ability tocontribute in road map and add feature in these products to fulfill some re-quirement will be a nice addition. It is also helpful to know the frequency ofresponse to a bug and the patches released for these products. The discussionabout software reliability seems to be clearly missing in the paper. By doinga historical analyzing of the bugs one can predict the the software reliabilityby carrying out some probability analysis. This paper is only the comparisonbetween three products focusing in specific properties that is common to allthe products and thus shows difference between them.
In 2010 jar le published another paper in which he has implemented a sci-entific approach for making the resource consumption comparison betweenthe two products Puppet and Chef. He certainly has succeed in displayingthe better product in terms of resource consumption making a set of repetitiveexperiment and finally applying a mathematical model like mean calculationfollowed by t-test analysis in the sample data collected from the experiment. Itis able to show the factual data based on the experiment. The paper is success-fully for what it aims to provide but it doesn’t describe the tools involved incollection of data from the system. The task like how the resource consump-tion data was collected is not mentioned at all. The paper shows only theresource utilization by these product on standalone machine, but since thesetools are mostly used under client server architecture, it is essential to knowabout the resource consumption results from both the client side and the serverside. More over the due to different architecture of the the products , resourceutilization study done under a stand lone machine might not portray the overall resource utilization case. Resource utilization comparison by implement-ing them to do certain task that resembles IT automation in an organization isclearly shown but the possible limitation is it cannot cover all the scenarios thatis exercised by configuration management in organization that possibly con-sumes a lot of resources which can over turn the result. Therefore the possibil-ity of measuring the performance of these system by bench marking the clientserver model is wide open to explore. Even though these product supportedindividual machine configuration where each machine in network has it’s con-figuration files and they manage themselves ,they were most likely to be usedfor centralized management of configuration figuration where a central serverhave the all policy files and individual agent in the client machines responsi-ble for implementing the configuration generated from the policy files. Thecompilation of the policy file can take on either client side as in CFEngine andChef or in Server side as Puppet. So using this Scalability study can be carriedout get knowledge of the nodes (clients) that each server can handle. The testinvolved benchmarking the server daemons of the respective product.
However there were multiple sources [?] [2] , [15] etc. that hinted CFEnginewas the most scalable one when it comes to supporting large number of clientfrom a single server. While it seems tempting to test the claims of scalabil-
17

2.3. SOFTWARE OVERVIEW
ity it equally poses a limited scope of the research and it’s usefulness to thecommunity as it kind of known fact and no brainer task as the server side ofCFEngine is light weight and used only for serving policy files to the server.But we would like to include these criteria and facts as a part of research andcarry out some analysis using it on all the product.
2.2.3 University of Netherlands
Similar study was carried out in university of netherlands by Niek Timmers,Sebastian Carlier which was focused on usability analysis between the CFEngineand Puppet. They have defined the usability in terms if adoptability of thesoftware as the further classification sections like simplicity, reliability scala-bility etc clearly signifies it. A survey asking questions about the utilization ofthese software’s was send to various system administrator. With hands on ex-perience , result obtained from previous work done and a theoretical analysisof the product architecture they have tried to come up with the answer. Theproject have done a decent job in aggregating high level factors and comingup with facts available from various sources. The illustration of backgroundtheories involved in these chapter and utilizing it to make a sensible argumentfor the evaluation under different factors like reliability scalability etc is a niceapproach. How ever the are significant shortcomings in the work done , wedon’t think the result obtained from the survey can be relied upon as it is basedon the opinion and information from individual. And the information sup-plied can biased and the statistics can be deliberately changed to give a wrongimpression of the product. Similarly the paper has touched the several highlevel factors that can be used to classify the products but haven’t done enoughscientific analysis using some model under each section to make comparison.The comparison is adhoc and the reasoning to one product better under somecharacteristics and vice versa is not sufficient enough. For example the reliabil-ity of the system doesn’t only depend on the human errors introduced in theconfiguration policy files , rather the reliability can to be the measure of errorprediction coupled with the historical evaluation of failure rates i.e. bugs andanalyzing the critical components. Similarly of some mathematical model likeWeibull distribution as in [16] on the metrics collected can be used to make ascientific reliability measurement.
2.3 Software overview
Although the products like CFEngine, Puppet and Chef are all seen as con-figuration management solution , they differ in their approach. They all haveunique architecture and decision making process that in-turn applies configu-ration polices system wide. They all are capable of managing and configuringall the aspects of the system and quite successful in their field compared toother products. They all have taking a different route to address the problemof system administration and automation.
18

2.3. SOFTWARE OVERVIEW
2.3.1 CFEngine
CfEngine is a the outcome of research conducted by prof Mark Burgess, mainlyexploring the topic of configuration management. Mark Burgess is the Earth’sfirst Professor of System Administrator [17] and winner of SAGE Award 2010[17]. CFEngine is now available as both free project (core) which have the coreability to configuration management and a commercial product with addi-tional features added to the core to meet various organizational need. CFEnginewas the first generic tool of its type for providing context based implementa-tion of intended state, and has been around since 1993. Since it’s birth CFEnginehas transformed gradually into a mature tool rolling out two major versionsCFEngine 2 and CFEngine 3. CFEngine 2 was first solution of its kinds andwidely accepted and implemented solution through out the industry. Version3 was rolled out in 2001 as complete rewrite to address the experienced de-sign demerit of CFEngine2. CFEngine 3 is based on the promise theory whichwas also developed by mark burgess. CFEngine uses a declarative language towrite rules for achieving the intended state. The rules are termed as promisesand according to the promises being kept determines the final state of thesystem. With CFEngine3 users were able to build modular reusable librariesof common configuration tasks directly in the configuration language, and acleaner separation of data types in the language giving less room for misun-derstandings. With the introduction of CFEngine 3 the company was formedto offer the enterprise version of the CFEngine to address the reporting needsof organization and to help organization achieve various IT compliance stan-dards like ITIL etc. The commercial version also comes with a set of pre buildconfiguration policies that are often used for carrying common tasks.
Design
CFEngine is strongly distributed when it comes to deployment. Every nodecan run on it’s own and have their configuration files for achieving the targetstate. However it is possible to maintain centralized configuration repositoryand make each and every machine to take configuration files from the centralserver to achieve their target state. It is made possible by the used of dae-mon called cfserverd. When CFEngine is installed each machine has a set ofdaemon running in them that carries of various task like implementing theconfiguration , communicating with the central server and making sure thethe compliance is checked at equal interval of time. The dameons can talk toeach other when needed which Mark Burgess terms as orchestration. Due tothese daemon a single machine is self sufficient making it’s architecture dis-tributive. Also each host utilizes one of these daemon to communicate witheach other in the CFEngine world.
• cf-promise: It is a binary that is to be utilized to validate a policy filesmanually before making an actual execution. It is helpful in debuggingerrors in policy file and making sure that the rules(promises) in policyfile does what it is suppose to do.
19

2.3. SOFTWARE OVERVIEW
• cf-agent: It is the program responsible for executing the codes in thepolicy files and implementing in them in the system such that the systemachieves it’s target state. This daemon is ran periodically in some interval(usually 5 min) so keep the system compliant.
• cf-server: This daemon is utilized by CFEngine to share share configura-tion files and also to receive request from remote machine to execute it’slocal copy of configuration policy files.
• cf-exec: It has a similar functionality of crond in the system and is uti-lized for carrying out scheduling task. The most obvious used case ifthis daemon is it is utilized to run cf-agent at every 5 minutes so that thepolicy files get executed.
• cf-runagent: This daemon is utilized to make request to the remote ma-chine’s cf-server for running it’s cf-agent. Utilizing this it is possible tocreate a push scenario but it all work get completed under voluntarycooperation between host. A host cannot make a remote host run it’s cf-agent , it can just request it to do so and then the remote host receivingthe request can carry out the requested activity as per it’s will.
• cf-report: It is the binary that is responsible for keep in the output sum-maries of each run of cf-agent that will used for producing the reports.
• cf-know: CFEngine uses this binary for keep track of ’who did for whatand when as mentioned’ in the policy files. The language gives youthe possibility of mentioning all the possible details about the changeand cf-know constitutes the knowledge based documentation from thesesources that will be useful for future changes to come.
Hence each individual host equipped with these daemons now is capableof sharing and reeving configuration files , which makes it possible for usingCFEngine to be used in client server model. But here the central server onlyshares / transfers it’s file to the client and all the execution of policy files andimplementation takes place in the client. Here the server acts like file server.File transfer takes as the result of request from the client. Hence it is the pullmodel under which the CFEngine works. Clients maintain their local cacheof the configuration files and if any new changes is detected they make a re-quest to the sever to get the new ones. Client them selves are responsible fordecision making by executing the policy files. This kind of model suitable forscalability as processing power get distributed across the clients and increasesthe reliability as it doesn’t create a single point of failure when central serverdies.
Vocabulary
CFEngine is provides a declarative language to express the intended state ofthe system based on the context. Language of version 3 is flexible enough to
20

2.3. SOFTWARE OVERVIEW
declare the expression of intent and the way of implementing it. With the intro-duction of bundles2.3.1 and bodies2.3.1 it has provision of creating on reusablemodule for carrying out common repetitive task. So a configuration code canbe written for one task breaking the whole task into down into modules andnow set of modules from previous task can be used for carrying out new con-figuration task. It can be a bit overwhelming when one needs to to define thestructure of implementation logic in a reasonable way for facilitating reusabil-ity from the very first, but the basic building blocks and examples of structuredCFEngine code that can be reused, is widely available in open source repos-itory like Github. It is also provided a a part of enterprise package thus bysaving time and effort of users.
• Promise Every thing is CFEngine 3 can be expressed as promise. Theyare the basic and only form of expression in CFEngine. Simply laid outa promise is configuration rule. CFEngine language has various promisetype that enables users to perform different task. For example if userwants to work with file he can used file type promise, if it is firing a shellcommand he can use command type promise. A promise have promiser(the abstract object making the promise) , promise e (the abstract objectto whom the promise is made) and set of association called the body ofpromise. Combining all the above with promise type once can under-stand the intent of the promise i.e. what a promise is suppose to do. Letshave a look at sample policy file which created a file named text.txt andupdates it’s touch time.
21

2.3. SOFTWARE OVERVIEW
1 files: # this is the promise type (e.g. files,
2 # processes, commands, etc.)
3
4 "/tmp/test.txt" # this is the promiser, the part of
5 # the system that will be affected by
6 # the promise.
7
8 create => "true", # This is the promise BODY.
9 touch => "true; #The promise body details and
10 #constrains the nature of the
11 #the promise. It consists of
12 #attributes which have values.
• Bundle and body A Bundle is a group of promises. A promise is capableof doing a single elementary task i.e., switching the service on or off ,editing a file etc. Configuring a single application to work can take oneor more of these kind elementary task for e.g. To make a web serviceto be available in a system. The package apache needs to be installed,it should be started and if ssl need to be enabled then it’s configurationfile need to be edited. Hence Bundle allows a grouping of the promisesthat are used for completing a the whole task. If designed strategicallyelementary task that are repetitive can be converted into promise andplaced in the same bundle such that the same bundle can be used overand over to carrying out task that involved the elementary jobs repre-sented by the promise. As seen above the body of promise contains aset of association. The right side of promise can contain a value or afunction that does the most minute job as possible like inserting in afile, copying from a server etc. This job can be abstracted in a func-tion and those function can be utilized many task while carrying outthose task. CFEngine Community Open Promise-Body Library(COPBL)CFEngine Standard library contains a collection of those functions thatcan be reused many time while writing a policy file. It is an interfacelayer that brings industry-wide standardization of CFEngine configura-tion scripting and hides awkward technical details [18]. An example ofbody declaration inside the standard library file is presented below usedfor copying files from a remote machine is presented below.
body copy_from remote_cp(from,server)
{
servers => { "$(server)" };
source => "$(from)";
compare => "mtime";
}
This body can now be utilized in promise when ever we need to copyfiles from a remote server. The only thing we need to do now is to includethe file containing the declaration of this body file , in this cased we need
22

2.3. SOFTWARE OVERVIEW
to include the standard library file. An example of making use of theabove body is shown below
body common control
{
bundlesequence => { "my_file_copy" };
inputs => { "cfengine_stdlib.cf" };
}
bundle agent my_file_copy
{
files:
"/home/user/tmp/test_dir/file"
copy_from => copy_from remote_cp("/var/cfengine/testdir/file","serverhost"),
}
• Classes CFEngine uses classes to determine the context of implication ofpolicy rules simply answers When and where are promises made, henceclass is basically a context in CFEngine. A policy file contains declara-tion of many promises. Each promises is declared under certain contextmaking is applicable under that context only. When a agent executes apolicy files it matches the classes in it ,with the environment variableslike OS name, ip address of the system termed as hard classes. If a con-text match occurs then only it applies that promise in the machine. Ageneral class like ’debian’ represents a set of machines having Debian asOS. But a Specific class like ’10 0 0 4’ denotes only one machine. Thusthe implication of rule in host solely depends upon classes, simply saidif host falls under the declared class the rule is applied other wise not.Hence care must be given while choosing the class other wise it mighttrigger unwanted state implementation in other host of the system. Eachrun of cf-agent t discovers and classifies properties of the environmentor context in which it runs. The properties discovered is termed as hardclasses. It is also possible to us combine these classes by using differentlogical operation and define a class out of it. These class are termed assoft classes. Soft classes also can be formed by utilization of special func-tion which are well documented in CFEngine reference guide. Here aresome examples of hard classes found on a platform by agent run.
any Saturday Hr11 Min26 Min25_30 Q2 Hr11_Q2 Day2
August Yr2008 linux atlas 64_bit linux_2_6_22_18_0_2_default x86_64
linux_x86_64 linux_x86_64_2_6_22_18_0_2_default
linux_x86_64_2_6_22_18_0_2_default__1_SMP_2008_06_09_13_53_20__0200
compiled_on_linux_gnu net_iface_lo
And here is an example that shows the utilization of special function fordeclaring a soft class and utilizing it in promises declaration.
23

2.3. SOFTWARE OVERVIEW
body common control
{
bundlesequence => { "example" };
}
bundle agent example
{
vars:
"binary" string => "/bin/ls";
classes:
"isexecutable" expression => isexecutable("$(binary)");;
commands:
isexecutable::
"$(binary)";
}
• Policy: They are the name given to the files that contain CFEngine promisesand bundles and body. Hence in CFEngine language the policy files arethe one that contain configuration rules are usually of extension.cf.
Working mechanism
The working mechanism of CFEngine deployed as client server architecture isdescribed here. Every thing except client server communicating mechanismhold true if CFEngine is deployed in a single host. As described above eachhost installed with CFEngine comes with a set of daemons , if a machine isto be made server then configuration files under /var/cfengine/masterfileswill be fetched by other CFEngine clients. Hence a set of files can be checkoutout for any repository source to the /var/cfengine/masterfiles directory. Theserver achieve it’s target state by copying it’s file into /var/cfengine/inputsdirectory and then executing these files by cf-agent daemon. While executingcf-agent it checks for difference in the files under Inputs directory and masterdirectory, if there is any difference the most recent version of files are copiedin the inputs directory and then executed.
For client to get the policies file , they need to boot strap with server utiliz-ing servers ip. Boot strap process triggers the cf-agent to execute the embed-ded failsafe policy which will make a request to the cf-serverd of the servermachine to serve the policy files under it’s master directory. The communica-tion is facilitated by the key exchange between server and client and the trustis established, this trust will now be utilized when ever the client agent needsto connect to the server. Now the server’s policy files are now kept under/var/cfengine/inputs directory and finally get executed. On every run of cf-agent it check the difference of files and contents between it’s local copy andthe remote copy in server. Incase of difference most recent version is down-loaded and again kept in /var/cfengine/inputs then executed to make the
24

2.3. SOFTWARE OVERVIEW
system achieve it’s target state. If it cannot get the files from the server thenlocal copy is utilized to achieve compliance. This makes it quite robust andfault tolerance as the problem in network doesn’t cause the deviation of clientfrom desired state. Of course if there will be some deviation if the change wasin server and it was not transferred to client due to some network error butthat will be fixed automatically when the network error is fixed and client isable to communicate with the server. This makes CFEngine a very adaptiveand flexible product.
2.3.2 Puppet
Puppet was introduced in 2003 by reductive labs. It was basically writtenby Luke kanies to achieve productivity and simplicity on the field of infras-tructure automation. It aims to make the system administrator life easier byhiding the implementation detail of configuration with a introduction of it’sdeclarative language that focuses in getting things done through it’s operatingsystem abstraction layer (OSAL) [?]. The tool was written out as an alterna-tive to CFEngine 2 and have tried to focus it’s usability targeting what userwants to do with this tool rather than focusing on how user should use thistool keeping operating system details in mind. The basic philosophy behindthe tool is a abstraction layer is required step in providing the best automationtool,instead of coming up with a new way of handling each OSs messy details.Puppet facilitates code reusability and modularization through the use of classinheritance and it’s abstraction layer. When a configuration rule is written inpuppets language some of common generic task can be divided into class andother class doing specific job can inherit those generic classes and If a rule willbe written for making configuration in one operating system and ideally thatrule can be used in any other environment to do same configuration as all howto implement that configuration details is handled by the abstraction layer. Ithas similar concept like java VM or .net framework which makes it’s possibleto run their code in any environment as long as the frame work is installed.Though it offers simplicity there might be some cases where the abstractionof some implementation is may not be defined in abstraction layer, This kindof situation can limit the product usability however you can get around it bywriting your own implementation logic termed as driver in the ruby code aspuppet itself is written in ruby.
Design
Puppet is built with a focus on client/server configuration within an infras-tructure. All the configuration rules written in puppets Declarative languagereside in the server termed as Puppet Master. Here the puppet master is cen-tral point , which does most of the task like analyzing the configuration filesand supplying client specific configuration only to the client by puling the nec-essary things from it’s manifests and compiling them in catalogues. Thus cat-alogs are just data in xml format, not an executable code. All the clients mustbe connected and trusted by the Puppet master in order to get the catalogs it
25

2.3. SOFTWARE OVERVIEW
need. The clients makes request to the server to get it’s catalog i.e. set of datathat shows the end intended state of it’s resources , so configuration imple-mentation mechanism is pull based. The puppet agent in client is responsiblefor only implementing the things specified in the catalogue once it is obtainedfrom server in case of deviation from server. Once done, the client can send areport back to the server indicating if anything needed to change. The puppetmaster can also notify it’s client when the configuration files are changed sothat it will trigger request from the client to get the catalog.
This design has some advantage as everything is controlled centrally i.e.central point of management and client only gets the data file that tells whatit’s resource state should look like. In case of any client is compromised thewhole infract structure is not vulnerable. Also it possible to collect the re-ports about all the clients centrally as all the client report back to the server.How ever the demerit of this design is when the puppet master is down theclient cannot monitor itself to stay in a configured state which might lead theclient to undesirable state. This creates a single point of failure commonly seenclient/server architectures. Also can present limitation on number of clientsthat can be managed by central server because when number of client growsthe resource utilization of server increases linearly.
Vocabulary
Puppet provides a declarative language whose main purpose is to get the in-tended state implemented in the system with out caring the implementationdetails. Hence it offers simplicity and productivity in writing the configurationfiles without tangling much the details of platform in which the rule is imple-mented. This is all made possible with a component called resource providerin puppet eco-system. Resource provider can be viewed as backend driverthat implement support for a specific implementation of a given resource typeby taking high level parameter while making a resource declaration in the con-figuration language. But what actually is resource.
• Resource : In puppet’s language resource is objects specified that helpsto manage a single the a component of the infrastructure. Each Resourcetypically have a type, a name and a set of attributes that needed to beimplemented. Resource can be thought to be the way of expressing themost elementary form of our intent. Our intent can be writing to a file ,executing a command or making a schedule in cron tab etc. The examplebelow shows the our intent of setting a permission on file. so the re-source type here is file and it’s name is ”/etc/passwd” and it’s attributesis the associative name value pair parameters follows it’s name that isapplicable to the type file. There are different kinds of resource type thatlets us do wide variety of task like exec for executing commands, cronfor scheduling.
file { "/etc/passwd":
owner => root,
26

2.3. SOFTWARE OVERVIEW
group => root,
mode => 644
}
The Resource provider must have some kind of knowledge ”logic” that helpsit to implement the rules i.e. in different kind of low level context. Ideallyspeaking the resource provider is like a translator that translates the high levelpuppet DSL language to platform specific implementation details and get itimplemented. It should also be kept in mind that not all resource types have orneed providers, but any resource type concerned about portability will likelyneed them. Hence one need to create the resource provider in ruby languagefor resource that doesn’t have any resource provider or is unsatisfied with theprovider way of implementing things. It is often useful and easy to use ifthe resource provider is found for the resource but when one needs to makeresource provider then it is painful and time consuming task. The path takenby reductive lab is that whenever one needs a new resource type he/she willcreate it and share it so that the community can make use of resource provider.Also for the resource provider to work it needs to know the type of resourceand the node’s facts.
• Class:Class is a collection of resources. It is one of the way that puppetachieves encapsulation. Class are just a name given to related set of re-sources. Basic purpose of class is to hide out implementation detail anduse only the name of the class when in comes to usage. Class can beinheritable so that the most generic tasks can also be grouped in singleclass and inherited in another class for code re-usability. Shown belowis a basic declaration of class including two resources for installation ofapache and make it running.
class apache {
package { apache: install => latest }
service { apache: running => true, requires => package[apache] }
}
• Node: Node in puppet resembles a machine and is a special kind of class.Node is another abstraction mechanism mechanism that enables puppetto show the intended state on particular machines in uncluttered way.An example of node declaration is shown below where class apache isapplied to host named test. This way the intended state of each node isclearly stated masking away underlying classes that takes care of the dif-ferent levels of implementation. The implemented classes can be nestedmany level separating the granularity of the task they perform
node test {
include apache
}
27

2.3. SOFTWARE OVERVIEW
• Modules: A Puppet module is a collection of resources, classes, files,definitions and templates. The difference between modules and classesis that class can be global i.e can contains class definition for doing var-ious task for configuring various application, while module must onlycontain definition doing a particular job i.e. configuring one application.For example When we need to set up a system with apache service thenwe need to carry out multiple task like installing apache package, writesome thing in a apache configuration file and finally ensure the serviceis on. Modules can generally be thought of as a configuration contain-ing each of our three core requirements, installation, configuration andmonitoring. Big the task is huge module often can be broken down intoclass and sub class but all these classes are coordinated to get a singlebig task completed. Puppet looks in the init.pp file under manifest direc-tory in each and every modules directory under /etc/puppet/modules.Module provides a way of code re-distribution.
• Facts: In puppet the context is provided by a separate component calledfracter. Fracter are installed in the clients and they supply the environ-ment specific things like OS,version,hw-arch, interface ip-adresses, mac-addresses and so on called ’facts’. It is also possible to declared user de-fined facts in the client. These facts are utilized by the server to pick outconfiguration rules related to the hosts. In the example shown below weare using the fact name operating system to determine the location forplacing the file. Of course it goes beyond the principle of puppet whenyou use factes for making decision based on the platform but there aresome cases where we need to make switching that doesn’t depend in theplatform details
file {
name => $operatingsystem ? {
debian => "/etc/php5/apache2/php.ini",
default => "/etc/php.ini",
}
owner => root,
group => root,
mode => 644,
source => "puppet://php/php.ini"
}
• Manifest: They are the name given to the file containing the configu-ration rules. So each and every file with puppet’s declarative code forconfiguring the infrastructure are puppet manifest and are of extension.pp
Working Mechanism
The configuration rules manifest2.3.2 contains the a set of resources2.3.2 andclasses that specifies what need ed to be configured where. All the manifest
28

2.3. SOFTWARE OVERVIEW
Figure 2.3: Puppet infrastructure design
reside in the puppet master. The client with puppet agent is responsible forimplementing the states as supplied from the puppet master. Hence in puppetmaster there is one daemon running listening to request of puppet client , thepuppet client sends request with it’s node2.3.2 name a list of facts 2.3.2. Thefacts in client are collected by fracter which is independent ruby library thatcollects host specific details like IP address, Operating system name etc.
With the help of the node name and facts supplied from the client , puppetmaster now classifies the client and decide which portions of the configura-tion rues is applicable to the client. While doing the compilation and generat-ing the catalog for client puppet master goes through different manifest. Thefirst manifest it looks into is site.pp under /etc/puppet/manifest to get thenit goes through nodes.pp under same directory to get host specific configura-tion. Now it goes through each and every modules init.pp to get all the classesand under modules defined. After fetching every things from manifest file toserver is now able to compile them into a set of things that need to be donein xml file called catalog and send to the client. Now the client receiving thecatalog run a query to find out it’s status and if there is any deviation of it’sstate from the catalog it corrects it’s stage to that specific things mentioned inthe catalog. The report about the specific task i.e. the change made is thensupplied in to the server.
2.3.3 Chef
Chef was introduced in 2009 [2] by Ops code and regarded as young com-pared to the other two products. Though young it cannot be counted out as ithas been gaining grounds and has established itself to be a top player in shortspan of time. Chef was designed keeping ”infrastructure as code ” in mindsuch that it exposes obvious flexibility and simplicity to the user for managingtheir infrastructure. Chef motto is similar to that of perl language i.e. ”There’smore than one way to do it”. There for Chef provides a Domain Specific lan-guage(DSL) along with the ruby code can be written which empowers the user
29

2.3. SOFTWARE OVERVIEW
to do much things without cornering themselves. This also have facilitated theChef users to achieve flexibility as they can always achieve things in one wayor another which in turn can assist interoperability. No longer is infrastruc-ture is thought separate concept and a new language need to be learned formanaging them. This has driven chef successfully in the DevOPs area where adeveloper can write code for there application and at the same time take careof infrastructure.
Another simplicity Chef introduces is in order of implementation of rulesas specified in configuration file. Chef has a deterministic behavior when itcomes to applying a configuration rule specifying a component in infrastruc-ture. This enables the user to visualize what gets executed and applied firstand ultimately help them to debug for errors and apply their existing knowl-edge about programming in the infrastructure code. Chef allows a list of re-sources to be declared in their recipes and execute in the same order as theyappear. Chef also uses techniques referred by various terminology to enablesuser to make a modular implementation of the configuration rules.
Design
One of the core principle of Chef is ”thick client and thin server” but the ar-chitecture is essentially client server. Chef does much of it’s task like compileand execution in client. Chef server is central machine where all our config-uration resides on. Chef Server is responsible for transferring all the files asasked by the client and it also stores the state of each node i.e. client machines.This model like CFEngine is scalable because the processing task is distributedthroughout the infrastructure. Client accesses these data stored in the serverwith the help of Rest API. Chef server is not just the file transferring serverbut has lots of other services. These services are need to make communicationwith the client devices , letting users interact with server, to store data aboutthe configuration as well as states of it’s nodes and search service that allows toquery for data stored by chef related to infrastructure. Below are the servicesthat are running in Chef server to make the whole architecture come alive.
• API Service It is this service that each client machine interact with tomanage the node configuration. Machines with chef-client binary aremachines , this binary make communication with Chef server i.e. chef-server process with the help of REST API calls. User also utilizing thisservice while interacting with Chef-server through the used commandslike Knife or Open Source Chef Server Management Console.
• Open Source Chef Server Management Console: It is the web UI ex-posed by the Chef server reachable from port 4040. It provides the userthe opportunity to carry out all their infrastructure management utiliz-ing the web. This service is user password based authentication andinteracts with the Chef Server making REST API calls. Hence essentiallyit’s API Service client that displays configuration data in web page andlets user to add/modify those data with the help of Web GUI.
30

2.3. SOFTWARE OVERVIEW
• AMQP Server: Chef utilizes this component to keep the index of datastored in it’s backend because chef provides a powerful full text searchabout information of infrastructure and applications. Chef uses Rab-bitMQ as an AMQP server. RabbitMQ provides a queuing service whichstores requests for updates to the search index. This allows the APIserver to handle load spikes while maintaining an even load on Solr. Ev-ery time data is stored in the database, server sends a message and thedata payload to the queue, and the indexer picks it up.
• Search Indexer:The search indexer of Chef is chef-solr-indexer listens toAMQP for messages about what to index, and then passes the resultsto chef-solr. chef-solr is a wrapper around a Apache Solr. This enablesChef users to make a full-text search to query information about the in-frastructure and applications Searches are built by the Chef Server, andallow users to query arbitrary data about your infrastructure.
• Data Store: Chef Server uses Couchdb as it’s backend to store all the dataabout Infrastructure. The data are in json format and it holds informationon Nodes, Roles and Data Bags.
Hence the setting up a chef server is a complex task and many things needto be installed and ensured that each of them are running. While it is com-plex it provides a powerful features like querying the data , using the web UIto manage infrastructure and through exposing it’s data through REST APIany application can consume it which ensures interoperability in the complexenvironment. As described above the Clients only have chef-client installedin them and interacts with server via REST authenticates via Signed HeaderAuthentication, down load, compiles and executes configuration rules calledCookbooks in Chef world.
Vocabulary
Chef configuration is written in pure ruby which is called as chef domain spec-ify language. So ideally every thing about ruby code can be implemented inthe chef configuration file. Thus chef language is imperative by nature. Thegoal of chef was to keep the language very simple by focusing on idempo-tent resource declaration and at the same time offering the flexibility of 3GLlanguage [15]. Managing the infrastructure using ruby will be inspiring for arubists but it there is still a bit of learning curve for new people. Chef creatorsalso believes that there is always a learning curve for newbies but the main dif-ference is when some one hit limitation, they can always find innovative waysto solve their problem. Chef allows users to write resources in ruby. Resourcecan be any thing like file a package etc that need to be configured. These re-sources can be listed in an order called recipe and chef executes these resourcein the following their written order. Hence chef have a implicit ordering mech-anism in which it implements things. So if like in conventional programmingthe essential things are declared first then followed by the things dependingon it. So with this approach chef manages to achieve convergence in a single
31

2.3. SOFTWARE OVERVIEW
run. Chef uses couple of interesting terminology that are used to reference aconfiguration rule or an component of infrastructure. This also be viewed asthe naming convention is done in Chef way.
• Resource: Resource is an component in the infrastructure and it can beany thing like file to be written, package to be monitored ,or services thatneeds to be either switched on or off. A Resource must have a type anda name and a set of actions that specifies the target state of the resource.Basically Resource are Ruby objects with the code behind them to con-figure your system. Behind each resource are one or more providers thattell Chef how to execute the actions you require against a certain type ofsystem. It has similar concept to the puppet that provides a cross plat-form abstraction of a system’s configuration, the only flexibility is thatyou can inject ruby code like if else etc while making resource decla-ration. An example of resource declaration is shown below which haspretty clear syntax to understand what the intention is.
package apache2 do
case node[platform]
when centos,redhat,fedora,suse
package_name httpd
when debian,ubuntu
package_name apache2
end
action :install
end
• Recipe: A Recipe is the collection of Resources in an ordered list. Recipesare written in normal Ruby extended by the Chef resource domain-specificlanguage. It can be termed as resource runlist. The Resources are writtenin systematic order in a recipe and hence they get executed (applied tonode) in the similar order as they appear. This shows the deterministicorder of the Chef which is implicit order mechanism defined on Chef.So foe example configuring a virtual host in apache server. The list willindicate first a package to be present then apache configuration files tobe written and finally turning on the service. This helps in code readabil-ity and understandability. An example recipe of task described above isshown below.
package apache2 do
action :install
end
web_app "my_site" do
server_name node[’hostname’]
server_aliases [node[’fqdn’], "my-site.example.com"]
docroot "/srv/www/my_site"
32

2.3. SOFTWARE OVERVIEW
end
service apache2 do
action [:start, :enable]
end
• Attributes: Attributes are simply data values that describes the prop-erties of Node. Attributes used for providing different values to differ-ent machines depending on location, purpose or other metadata. Wecan set Attributes in cookbooks, nodes, roles and environment. This canbe thought of as an abstraction mechanism that separates the data fromthe implementation. In essence Attributes are a special key-value storecalled a Mash within the Ruby DSL context. A Mash is just a Hash wherethe key can be either a Ruby symbol (:key) or a string (”key”). The keysare attribute names and those can have some default set but they arealways modifiable. All Nodes(host) also have attribute like IP address,hostname, loaded kernel modules, version obtained from ohai but theseattributes are extendable by definition of json file to include user-definedattribute as well. On each individual run of chef client it collect attributesvalues from cookbooks, node, roles and environment and built a com-plete set. An example of attribute used in apache cook book file locatedunder cookbooks/apache2/attributes/default.rb is given below.
default["apache"]["dir"] = "/etc/apache2"
default["apache"]["listen_ports"] = [ "80","443" ]
• Cook Book: Cook book collection of attributes, recipes, custom resources,and definitions to configure a certain application or service. Cookbookforms the fundamental forms of distribution in chef encapsulating eachand every thing. Hence a cook book written can be shared to other chefusers who can make use of it by changing the necessary thing specificto their environment. Cook book contains various components , each ofthem can be a file or directory. Cook book can be create by i and also canbe downloaded if there is existing one for our use case issuing a knifecommand. Following the directories and files under a single cook bookdirectory.
– attributes/for storing the values to be used on node basis
– definitions/ to create and storing the reusable collection of one ormore resources
– files/ build in resources definitions
– libraries/ To store the helpers and extend chef through ruby code
– metadata.rb recipes, including dependencies, version constraints,supported platforms and more.
– providers/ To create and store custom resource provide
– README.rdoc
33

2.3. SOFTWARE OVERVIEW
– recipes/ Resources to be manage, in the order they should be man-aged.
– resources/ Custom resource declaration
– templates/ for creating configuration files that are dynamically cre-ated by replacing variables with our values.
• Node: Nodes are the client machines managed by Chef. Nodes consti-tutes two things runlist and sttributes. Runlist contains a list of recipesand roles. Normally only a node represents a single machine where theserecipes and roles are applied. Node a dynamic property which get buildand destroyed. when a client process is started, Ohai detects the infor-mation of the host like fully qualified name host name etc.chef client nowcompare these data with the last known state data of the node from chef-server. Now all the ohai attributes get update to the recent values andextra attributes added via json also get updated. Lastly all the attributein cook books also get accumulated. Thus the process if node buildingtakes place. With the help of these attributes , runlist and Roles which isexpanded into attributes and runlist at run time ,chef is able to apply therecipes on the node that brings it to the desired state.
• Role: Roles provides means of grouping the nodes with similar func-tionality. Role are used to express the parts of the configuration that areshared by a group of Nodes. Roles contains set of attributes and run list.One or more roles can be applied to a node signifying to implement therecipes in those roles. Hence If a attribute and runlist is applicable tomore than one machines in infrastructure , we can create a role and as-sign that role to those machine that needs those run list to be executed.Roles can be created by utilizing REST API , ruby DSL , Knife or throughweb UI or directly creating json in chef repository. A simple way of rolecreation using ruby declaration is shown below
name "webserver"
description "Simple Web App"
run_list(
"recipe[apache2]"
)
• Ohai: Ohai collects information about the platform on which it is run-ning. It can be used standalone, but it’s primary purpose is to pro-vide node data to Chef. Information like hostname, FQDN, networking,memory, CPU, platform, and kernel data is obtained by ohai. When ohaiis used with chef the information it collected is reported back via ”auto-matic” node attributes to update the node object on the chef-server. Datacollected by it can be compared to puppet facts and CFEngine classes.
34

2.4. COMMUNITY
Working Mechanism
Chef -servers stores all it’s configuration files like cookbooks, receipe, attributesfiles. Normally these files are checkout from version control system to the thedirectory /etc/chef. The process of convergence starts from clients. The chefclient process in the nodes runs every 30 minutes. Hence when it wakes upit will gather the properties of platform using ohai. The ohai then transfersthe OS specific information as node attributes to the chef-client process. Chefclient now fetches the previous information about the host from Chef server ,any additionally json attributes if declared is added together with the gener-ated ohai attribute. Now node building phase is completed hence at this pointchef client is able to tell the properties of node.
Now chef client performs the synchronization of all the cookbooks and re-lated files from the chef server. For synchronization with server it needs tobe trusted by the server hence the process of registration and authenticationtakes place with the help of key exchange. Chef-validator is a special purposeclient used exclusively for registering new clients. The private key generatedafter successful registration is kept in /etc/chef/client.pem. This key will beutilized for future authentication. After synchronization gets completed theclient will have all the things it needs to execute in order to get the machineto desired state. Thus client process now assemble the specific collection ofresources following a definitive pattern of first loading the libraries followedby loading attributes and then after definitions and finally recipes. Now theexecution process takes place by applying on node attributes values on deci-sion making statements in the cook books and recipe. Ideally with one execu-tion cycle the chef should get the machine in desired state thus convergenceis achieved. After converging, Chef saves the state of the node to persist it’snode data and make it available for search by reporting it back to Chef Server.
2.4 Community
Community and documentation support of product is very much importantfactor for the success of the open source project. All open source projects aremade alive by the user contributing to the development and users implement-ing them and providing support. Community support can be divided intotwo half i.e. one for the development of the product while other to supportingthe deployment and usage of the product. With out taking these factor into ac-count the analysis wouldn’t be complete and usable. Often open source projecttreats it’s user as a partial developer. Normally these users implements theproduct in real environments and reports the bugs exposed and bugs encoun-tered. Some bugs are hard to find in the testing environment of the company ,those are hidden bugs and these bugs can show up while the product is imple-mented in the different environments. Hence open source projects carries outmajority of testing by realizing a beta product to the community and organizeit’s development on feedback and bug reports obtained. The users not only re-ports the bugs but can supply fixes for bugs they encountered hence involving
35

2.4. COMMUNITY
Figure 2.4: The onion model (Ye and kishinda 2003 [19].
partly in the development activities. Also these users using the product createsa helpful social environment through different communication channels likeIRC or mailing list to discuss their problems and helping each other to solveproblems. The community grows in size as the products get used by the newusers and old users provides helpful tips to the query of new comers. Newusers often stumble up in the help and support forums to get their problemsolved. If and when they feel like the suggestion they obtained were helpfulthey tend to keep up with the on-line community of the product. Normally thecommunity model of most of the project can be represented by ”onion model”described in open source literature[19] where members fall in different layers.
This model clearly shows that there are large number of passive users i.e.observers that use the product only get less involved in the development. Asthe user gets more experienced with the product and the person’s knowledgeabout the product grows they tend to shift more into inner layer of onionmodel. Also the power of open source project is the people can transition be-tween these layers freely as per their interest and necessity. The onion modelhowever largely represents the developer community. If we focus only on thepassive users area only, then we can find the similar kind of layered behav-ior between the users using the product. While some users being the poweruser raises a lot of technical queries about the product and creates a discus-sion around it , other users are only the normal users hoping to get someanswers for the problem they encountered hence a small discussion can becreated around it. So as the users become more experience with the productsand starts to use it largely then the normal users will transition into powerusers. We believe that the online support of these products also rely in thesevery power users for answering the queries of the other users. The study con-ducted by Karim R. Lakhani and Eric von Hippel on Apache user group alsoshows the similar trend [20]. So it is desirable to figure out if there is some sim-
36

2.5. RELIABILITY
ilarity between the user groups with in these configuration tools , have closeview of power users and normal users and analyze their activity.
2.5 Reliability
Reliability measures how often a a software works as expected and producesoutcome. Hence reliability can be a hard thing to measure as it depends onhow a software is used, under which environment and on what the work load.However when reliability id defined as
probability of failure free operation of a computer program in a specified environ-ment for a specified period of time
This definition [21] portray reliability as a measurable metric. Various re-liability growth models have been used since late 1930’s [22] to measure andpredict Mean Time To Failure (MTTF), future product reliability, testing pe-riod, and planning for product release time.
2.5.1 Models for Reliability
The models used in software reliability growth model are concerned with mea-suring the time between the failures and fault count in a known time span.Mean Time Between Failures model expects a set of data that represents thetime ranges of successful operation. A distribution model is applied in ob-tained data set so that a pattern of time ranges due failures and they get fixedcan be observed. Finally parameters for the applied probability distribution isobtained through simulation and testing. As the numbers of failures decreases,the reliability is increased. Jelinski-Moranda[23] and Littlewood models [24]are two such examples of this kind of reliability modeling.
In fault count model, a number of faults in a specified time period is usedas data set. A probability distribution function can be applied on the the failurerate which is defined as number of failures in a given time. As the fault countdecreases ,when the bugs are found and fixed finally increasing the reliability.The fault count show as certain pattern for which a parameter values can becalculated for applied theorotical distribution model. Goel-Okumoto [25] andMusa Okumoto are examples of this model.
Additionally there are two model for gathering the data about failuresnamely white box and black box models. White box model is used when everything about the software is known i.e. it’s process flow, it’s components andstructure are known. Thus software reliability is focused on measuring thefailure rates of components and relation between them. Black box model as-sumes the whole software as a single entity ignoring it’s various componentsand interdependencies. The black box model needs the failure data collectedover time. Therefore in this case the black box model is more suitable to ana-lyze the reliability.
Generally failure rate can be represented by bathtub model [26] [27], thismodel is capable of representing the failure rate for anything for it’s life timei.e. all three phases consecutively , decreasing , constant and increasing. When
37

2.5. RELIABILITY
a product is new some of it’s aspect will fail but the product will adjust itselfto the environment and finally when the product is old, the failure rate is highagain. The Weibull distribution function is capable of representing all thesethree phases of bath tub model and also been shown by number of studiesthat the Weibull distribution function can model the reliability pattern of mostof the products [28] [16].
2.5.2 Theory
A failure of software is the inability to produce desired results, this is causeddue to error in software, thus an error is a phenomena used to describe whenthe output deviates from the expected out put. An Error in software is intro-duced due to existence of faulty component or logic with in a software. Thusthis faulty part or defect is termed as bug. Failure behavior of software can beanalyzed by utilizing the both PDF (probability density function) and CDF cu-mulative Distribution function [16]. PDF f(t) shows the concentration of datasamples in the measurement scale so that the area under the curve is unitywhile CDF tF(t) shows probability of random variable T, i.e. a probability thatthe value of T will be less that or equal to the specified value t.
F(t) = P(T ≤ t) =∫ t
−∞f (x)dx ⇒ f (t) = F(t) (2.1)
Thus f(t) is the rate of change of F(t). Hence if T is regarded as a failuretime then , F(t) can be regarded as the probability that system will fail at timet i.e. unreliability at time t. Consequently Reliability R(t) can be defined as aprobability that system will not fail by time t, i.e
R(t) = P(T > t) =∫ ∞
tf (x)dx ⇒ R(t) = 1− F(t) (2.2)
Additionally a large number of empirical studies on software projects fol-lows a cyclic pattern described by Rayleigh distribution function representedby a special kind of Weibull distribution function with shape parameter β = 2.A Weibull PDF represented by
f (t) =βtβ−1
αβe−(t/α)β
(2.3)
with different shape parameter β and scale parameter α = 1 is shown in thefigure 2.5. The scale parameter α is responsible for squeezing or stretchingthe distribution. The distribution function takes different shape on differentvalues of β, when β ≤ 1 it represents and exponential distribution , the distri-bution becomes bell shaped at β > 1 and represents Rayleigh distribution atβ = 2 and as β increases , steeper the curve will be.
As seen Weibull PDF with β = 2 and greater can represent the bug lifecycle of the product as when the development of software is considered fin-ished, it enters in testing phase where a large number of bugs might be found
38

2.6. USABILITY
Figure 2.5: Weibull PDF for several shape values when α =1
and fixed. But still there may be more bugs which are difficult to be detectedin the lab testing environment and hence these are caught by different usersin their production environment due the wide range of use case. Thereforethe bug numbers increases slowly when product development is finished andreaches some maximum, then bugs numbers decreases exponentially as testand usage continues and they get fixed. Finally it stabilizes at one point oftime but still, there may be certain bugs that might show up which will de-crease the reliability. Hence every software follows this patter of bug life cycle, the only difference is how long the bug continues to show up down the timeline.
2.6 Usability
2.6.1 Usability as Quality
Quality is a broad term which has many different views of what it means fordifferent people. But often quality is generally treated as a property of a prod-uct. ISO 9126 takes this approach and categorizes the attributes of softwarequality as: functionality, efficiency, usability, reliability, maintainability andportability [29]. ISO 9126 stands as guide for software product evaluation thatresembles most of the aspects from the assessment methodologies describedin section 2.1. ISO 8402 lays out quality in it most clear and concise form ,it states ”Quality: the totality of characteristics of an entity that bear on it’sability to satisfy stated and implied needs.”. It assumes a set of requirementof user fulfilled by the product, however if there are different requirement ofthe users then the they may require different characteristics for a product tohave desired quality, so that assessment of quality becomes dependent on theperception of the user. And this is exactly what is perceived as the quality inreal use case.
Mostly user perceived quality is regarded as judgmental and inaccuratehence not included in the software quality assessment process. A set of qual-
39

2.6. USABILITY
itative methods and a good software engineering practice followed while de-velopment of the product helps to achieve all the attributes that helps to makesoftware qualitative but cannot ensure the it’s quality in the hands of the users.Thus there are more than one reason why the user perceived quality is neededto be accounted. In our case , the functionality, usability and efficiency at-tributes required by a system administrator in a data-center may be very dif-ferent from those required by an system administrator of a university infras-tructure. Hence ”Quality of use” [29] is one of the mechanism that allowsto measure effectiveness , efficiency and satisfaction of users with specifiedtasks in specified environment. ”Quality of use” refers to the extent to which aproduct satisfies stated and implied needs when used under stated conditions.Any relevant aspect of software like functionality, maintainability , reliabilityetc may contribute to quality of use. Hence the measures of ”quality of use”can be used as criteria to determine whether or not the product is successfulin achieving usability. Thus Quality of use i.e quality of user experience thusprovides a means of measuring the usability of a product which up until nowseemed to be a difficult and almost impossible metric to be measured for asoftware.
2.6.2 User Experience Measurement
If we agree that a software considered is capable to do the designated taskthen it’s usability now is extremely depended on users experience , there isno single universal method to measure this user experience. If asked the tousers of product on how they solve their problem utilizing the software , itcan be largely subjective and biased. Thus to measure usability in a scientificway a series of metrics can be collected to do the same task that can give helpus measure the quality of user experience, finally allowing us to characterizesome thing has good or bad usability.
User experience can give us the usability as a measured unit including bothsubjective and objective aspect. The objective part should take care of all thefactual metrics like task time, stress , efficiency etc. associated while user isperforming the task , while subjective part accounts the user feeling towardsexecution of task using the software. But objective data and subjective datacollected from user can point in the same direction i.e. have positive corre-lation which is a good indication of successful usability measurement, whilenegative correlation reveals disaster either partly due to user not interested ordistracted on subjective data collection phase.
An example of negative correlation is a user spending large amount of timeto carry out a task using a certain product , rating as a favorite one for him. Inthis case the user’s expression contradicts with the deeds and does not givea meaningful result. Hence if a test is carried out with a set of users to mea-sure user experience , both objective and subjective need to be collected andanalyzed separately which will give meaningful insights into problems , pro-ductive time, stress level etc using the product. Further calculation like corre-lation of the data sets to can be done to measure the effectiveness of test. Allthese things combined together will give a good measure if user experience.
40

2.6. USABILITY
Combining objective and subjective method helps us to compare and analyzefollowing things
• Two or more similar products used by same set of user to carry out sametask under similar environment
• Two or more users using the same products performing same task undersimilar environment
• Two or more task performed by same set of users using same productsunder similar environment
2.6.3 Objective Method
The objective method help to report factual information about the task per-formed by capturing various data associated with task. It helps to measure theeffectiveness , productivity and efficiency of product for user. Various type ofmetrics are collected by the usability testers depending on the type and inter-action mechanism offered by software under test. For example majority of theusability test is carried out for GUI application , hence testers gathers the keystokes , numbers of clicks , number of back presses etc. But thw common met-rics used in all types of usability test are completion rate, task time, problemsencountered and errors made etc, these metrics can be used in any kind of us-ability testing regards less of product type. Following are the metrics that canbe collected in order to carry out objective method of usability measurement.
• Completion Rates: Completion rate are fundamental metrics collectedthat provides a simple metric for success. These metric is collected inbinary form i.e. completed (1) and incomplete (0). If a task is in com-plete , no more measurement needed to be done, apart from collectingthe reasons for task incompletion. Task completion is widely used in us-ability testing as it is easy to understand for readers and report. Prior toa test a a set of criteria needed to be defined in order to consider a taskas complete. In task completion focus is given on the output obtained byuser which is later compared with success criteria , rather than the pathtaken by user to complete the task. If the result does not meet the criteria, no matter how close was the user near to task completion it will not beconsidered for any further evaluation. The average task completion rateis 78% [30]. Hence 78% task completion can be used as reference point toanalyze the results. Any thing above 78% can be regarded as above aver-age and a nice task completion rate. Since this completion rate measuredwas the result from the commercially available software’s on thousandsof users, it has raised the average completion rate scale. Another causeto have such a high rate of task completion is due to the mentality ofusers in test , they know that they are being observed and show a hightendency towards task completion.
• Task time: Keeping track of the task time helps to measure the efficiencyand productivity. As completion rate , task time are also core metric to
41

2.6. USABILITY
be measured for usability study and widely used in majority of usabil-ity test. Normally the task times are measured in seconds and minutesby keeping track of start time and completion time. Task time can bemeasured in three ways [30]
– Average task time: Only considered for users that has completedthe task.
– Mean Time to Failure: The average time users took on task beforegiving up or completed the task
– Average Time on Task: The total time users are spending on task.
Task times are also helpful for diagnosing the usability problem. If a useris taking long time to finish the time it can often be due to the problemfaced by user or errors associated with the product. When average tasktime, is considered this studyshows that for a small sample size 25 orless , the geometric mean will be more accurate measure than arithmeticmean or median. Also since task time data set are positively skewed assome users take more time to complete the task, the arithmetic mean willcan be dragged to higher values and this also is the main reason for taskdata distribution not being a normal distribution. By separation of timethe user spend in doing the task from the total task time, we can thus ob-tain the productive time. Unproductive period of the task are the timeswhen users spend their time searching for the help and understandingthe structure of software , or overcoming the problem faced. Hence Pro-ductive period can be calculated by removal of these unproductive pe-riod from the task time. These productive time can be crucial for productcomparison for performing same task.
• Usability problems: Keeping track of problems faced by the users helpsto calculate the probability of users likely to face the problem, More overit can help us find unknown problems associated with the products. Ifthe record is maintained such that it can classify which user faced whichproblem , it helps to measure the problem discovery rate and most im-portantly predict a better sample the sample size that can give us reliableresult [30]. For example
We need to test on average 5.32 users to discover 85% of usability problem giventhe occurrence of problem is 30%.
The theory behind this claim is used of binomial probability distribu-tion as stated in [?] and derived in [31]. The author of [31] has achievethe result by performing the calculation shown in. The binomial prob-ability function is applied in detection of usability problem such that nrepresents the total number of users, r equals number of problems and pequals the probability of occurrence.
n!r!(n− r)!
pr(1− p)n−r (2.4)
42

2.6. USABILITY
For no problem to occur at all,i.e. obtaining p(0) we can replace r with 0.
n!n!
1(1− p)n ⇒ p(0) = (1− p)n (2.5)
Therefore we get the probability of finding at least one problem by sub-tracting the probability of finding zero problem from one.
p(≥ 1) = 1− (1− p)n (2.6)
Additionally the author [?] also has shown that 5 users is enough to showthe majority of problems through the used of binomials.
• Conversion: Conversion is a special kind of completion rate. This is alsoa binary measures i.e. (0= not converted, 1=converted). By conversion, we can think of user carrying out a series of task to get the ultimategoal. For example in our case if a users can download a product andimplement it to do automate or configure a part of infrastructure thenwe can say the user have converted. Thus it covers all the phases ofusage of product and will give important information about on usersbeing actually able to solve their need with the product..
2.6.4 Subjective Method
Subject method helps to capture the user perception on the product by askinga user to answer a set of questionnaire. If a user is happy about a product afterusing it , he/she is sure to give positive comments for the products on the otherhand if the product is frustrating to use , with user facing too many problemin every turn while using it, it will definitely raise the negative feeling for theproduct. Subjective measure helps to capture those feelings and present resultin measurable form. Thus it can also be said that it measures users satisfac-tion level. A satisfaction is composed of comfort and acceptability of use [29].Comfort refers to the overall emotional response to use the system (whetherthe user feels good, warm and pleased, or tensed and uncomfortable). Accept-ability of use refers to the overall attitude towards the system which coverswhether users feels the system was able to solve their need, if they feel in con-trol of the system while using it etc. This satisfaction can be measured in twolevels while conducting the test which are discussed below.
• Task level satisfaction: It helps to measure the difficulty level of thetask. Popular method of evaluation of task level satisfaction are ASQ(AfterScenario Questionnaire),NASA TLX( NASA’s task load index is a mea-sure of mental effort ), SMEQ(Subjective Mental Effort Questionnaire),UME(Usability Magnitude Estimation) and SEQ(Single ease question)[?].Getting users to answer a questionnaire immediately after performingthe task is simple and reliable way of achieving task-performance satis-faction level. Thus task level satisfaction can also be termed as perfor-mance satisfaction.
43

2.6. USABILITY
• Test level satisfaction: It measures the user perception towards the prod-uct. Since it is asked at the end of test and the questionnaire is focusedon getting the general information like how was the product , do i thinki can learn it quickly etc , it helps to capture the overall attitude of usersabout the product. Thus it is also regarded as measure of perceptionsatisfaction. System usability scale (SUS) is one of widely used methodto compare the usability of product. There are other measuring scaleas well as home grown proprietary method for carrying out this task,but the SUS provides high level subjective view as questions are quitegeneral. More information about the SUS and it’s structure is providedbelow. The task level satisfaction definitely has impact in the out comeof it’s result but it’s outcome is not solely driven by task level satisfactionand slight difference exist between two, how ever there is also a strongco-relation (r ≥ 0.6) between these post task ratings and post test rat-ings.
Single Ease Question [SEQ]
As discussed in 2.6.4, asking user about the task they just carried out at the endof task provides useful information. But a care must be given such that posttask queries should not be long and complex. It can effect the users answer-ing mentality if it unnecessarily long and difficult to answer. At same timepost task question should also be capable of capturing the user perception to-wards task such that a task performance can be measured. Therefore a goodquestionnaire should be
1. Short
2. Easy to respond to
3. Easy to administer
4. Easy to score
SEQ demonstrates all the above traits [32]. It contains only one question”Overall, this task was ?” and the response is the scale that ranges from 1 (verydifficult) to 7(Very Easy). The strong point of SEQ is that it is observed that userbuilds their expectation into their response. So when the task steps is added orremoved , users are seen to adjust their expectation on scale accordingly. Alsothe out come of SEQ seems to have high correlation with the outcome of thepost test questionnaire i.e. SUS [32].
System Usability Scale [SUS]
System Usability Scale is a ten item questionnaire that provides a high levelsubjective assessments of the usability study. It was developed by John Brooke[33] in 1986 as a tool to be used in usability engineering of electronic officesystems. SUS is technology independent and since it was developed has been
44
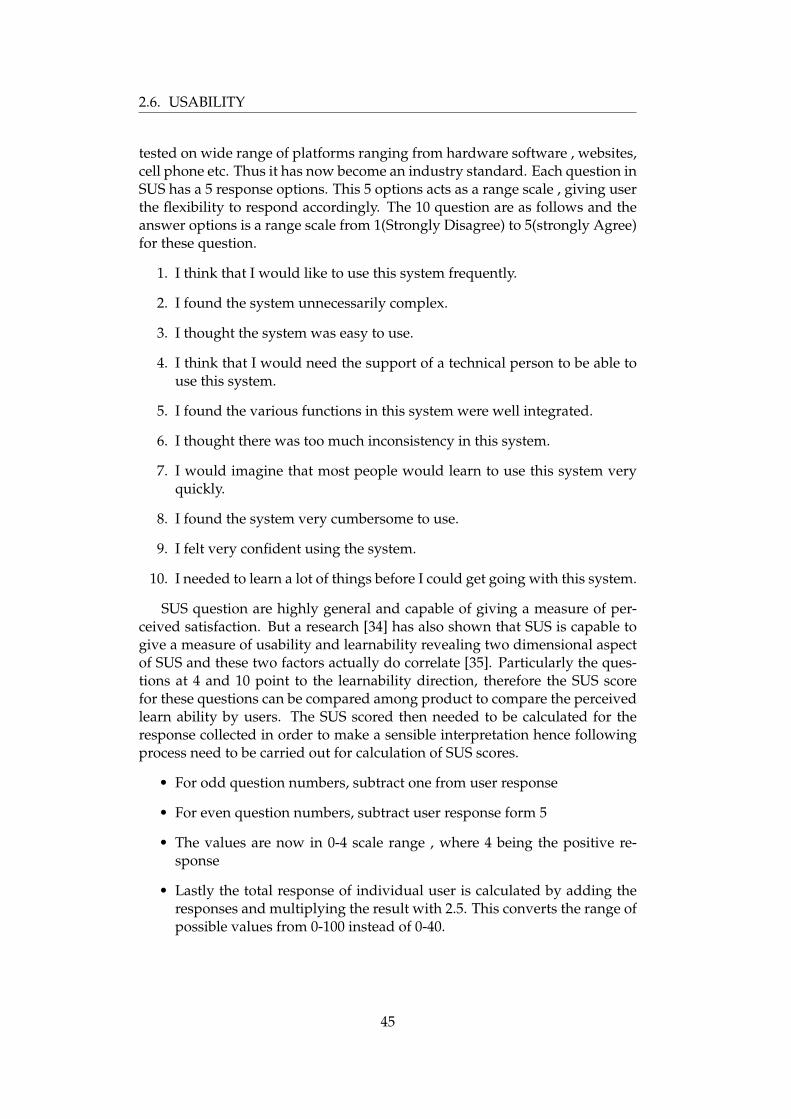
2.6. USABILITY
tested on wide range of platforms ranging from hardware software , websites,cell phone etc. Thus it has now become an industry standard. Each question inSUS has a 5 response options. This 5 options acts as a range scale , giving userthe flexibility to respond accordingly. The 10 question are as follows and theanswer options is a range scale from 1(Strongly Disagree) to 5(strongly Agree)for these question.
1. I think that I would like to use this system frequently.
2. I found the system unnecessarily complex.
3. I thought the system was easy to use.
4. I think that I would need the support of a technical person to be able touse this system.
5. I found the various functions in this system were well integrated.
6. I thought there was too much inconsistency in this system.
7. I would imagine that most people would learn to use this system veryquickly.
8. I found the system very cumbersome to use.
9. I felt very confident using the system.
10. I needed to learn a lot of things before I could get going with this system.
SUS question are highly general and capable of giving a measure of per-ceived satisfaction. But a research [34] has also shown that SUS is capable togive a measure of usability and learnability revealing two dimensional aspectof SUS and these two factors actually do correlate [35]. Particularly the ques-tions at 4 and 10 point to the learnability direction, therefore the SUS scorefor these questions can be compared among product to compare the perceivedlearn ability by users. The SUS scored then needed to be calculated for theresponse collected in order to make a sensible interpretation hence followingprocess need to be carried out for calculation of SUS scores.
• For odd question numbers, subtract one from user response
• For even question numbers, subtract user response form 5
• The values are now in 0-4 scale range , where 4 being the positive re-sponse
• Lastly the total response of individual user is calculated by adding theresponses and multiplying the result with 2.5. This converts the range ofpossible values from 0-100 instead of 0-40.
45

2.6. USABILITY
Figure 2.6: SUS score percentile association and corresponding letter grades
A SUS score range from 0-100 is not percentage. The best way to interpret aSUS score is to convert the individual score into percentile rank. The figure[30]below shows the percentile ranks associated with SUS scores and the gradeletter.
Now with the help of figure 2.6 it becomes easier to interpret the scoreobtained from the SUS score. The average SUS score from over 500 studies is68 [30] i.e. 46% which gets a letter grade C. Therefore product with grade Care considered average , anything above is considered as above average. Forexample if a SUS score 74 have percentile rank of 70% , there fore this producthave a good perceived usability than 70% of the products tested by the SUS. ASUS score of 85 or more helps a product to get a letter A , these are the kindsof products that are likely recommended by people [30].
46

Chapter 3
Approach
3.1 Community
Software aspect like community always have a vague definition but is increas-ingly important for support and success. Though it is an important criteriathat needs to be analyzed, often the previous studies conducted has failed tograsp it into account and give a reasonable overview of the community activ-ity of the three products. Often there are comparison on these tools that statesabout community [36], [37] but does a very little research on it. Measuringpeople in IRC is not only the way to measure the community strength nei-ther the numbers of download of the software packages from the repository ofpopular os platforms like Debian ,Ubuntu etc. Rather it can be a part of mea-suring the over all strength. Community of software is also deeply associatedwith popularity of the products, but all the products seems to claim itself asa popular and dominant player in market. Again if a product is popular andhave large community, it must have large number if resources available anddiscussion around. No prior research had attempted to identify or project theresources available and make comparison based on it. Mechanisms like get-ting the metrics from meta forge, help sites like stack over flows, the mailinglist and determining how soon a question get answered. Articles as well asdocumentation provided can be used to measure the community strength.
The community of the product can also be divided into two main groups ,i.e. the developers group while other are the users of the software. Often thediscussion of the developers group are focused in the product developmentand bug fixes , while the users group are focused in the implementation of theproduct addressing different problems. Together these group help the productto grow , become stable and better over time. We will be concentrating on theanalyzing the users only group activity and try to figure out the puzzles relatedwith community size and behavior of the members with in. Inspired by workdone in [38] [13], a reasonable view of the community size will established.Similarly popularity of each product will be studied carrying out some activ-ities discussed in [39], [13]. By understanding the community behavior fromthe data gathered, a mathematical model will be utilized to find out if there isany difference in community despite of their sizes between these products. We
47
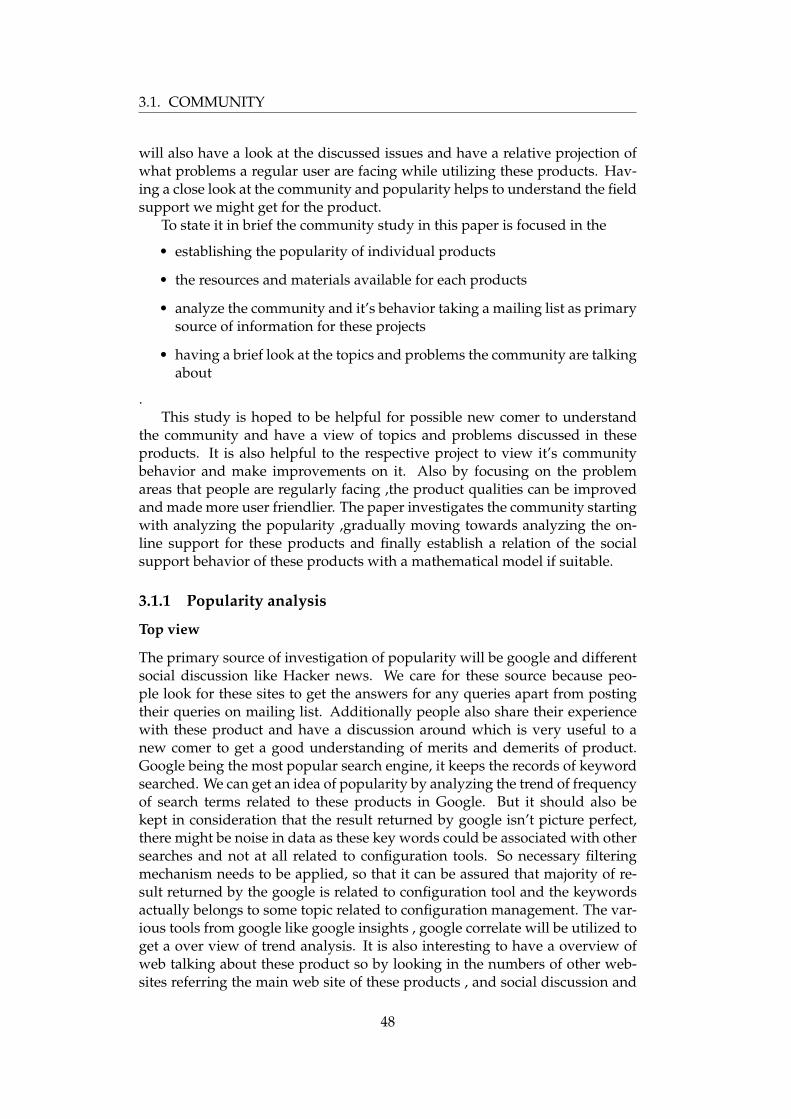
3.1. COMMUNITY
will also have a look at the discussed issues and have a relative projection ofwhat problems a regular user are facing while utilizing these products. Hav-ing a close look at the community and popularity helps to understand the fieldsupport we might get for the product.
To state it in brief the community study in this paper is focused in the
• establishing the popularity of individual products
• the resources and materials available for each products
• analyze the community and it’s behavior taking a mailing list as primarysource of information for these projects
• having a brief look at the topics and problems the community are talkingabout
.This study is hoped to be helpful for possible new comer to understand
the community and have a view of topics and problems discussed in theseproducts. It is also helpful to the respective project to view it’s communitybehavior and make improvements on it. Also by focusing on the problemareas that people are regularly facing ,the product qualities can be improvedand made more user friendlier. The paper investigates the community startingwith analyzing the popularity ,gradually moving towards analyzing the on-line support for these products and finally establish a relation of the socialsupport behavior of these products with a mathematical model if suitable.
3.1.1 Popularity analysis
Top view
The primary source of investigation of popularity will be google and differentsocial discussion like Hacker news. We care for these source because peo-ple look for these sites to get the answers for any queries apart from postingtheir queries on mailing list. Additionally people also share their experiencewith these product and have a discussion around which is very useful to anew comer to get a good understanding of merits and demerits of product.Google being the most popular search engine, it keeps the records of keywordsearched. We can get an idea of popularity by analyzing the trend of frequencyof search terms related to these products in Google. But it should also bekept in consideration that the result returned by google isn’t picture perfect,there might be noise in data as these key words could be associated with othersearches and not at all related to configuration tools. So necessary filteringmechanism needs to be applied, so that it can be assured that majority of re-sult returned by the google is related to configuration tool and the keywordsactually belongs to some topic related to configuration management. The var-ious tools from google like google insights , google correlate will be utilized toget a over view of trend analysis. It is also interesting to have a overview ofweb talking about these product so by looking in the numbers of other web-sites referring the main web site of these products , and social discussion and
48

3.1. COMMUNITY
development forums an estimation of community ecosystem of these productscan be made.
Focusing on the area of interest
Now a days a lot of social news websites that enables news aggregation areavailable. People come here often to talk about the the things they see elsewhere. While the mailing list tends to be useful for finding the answers prob-lem related to the particular problem, these kind of social news provides theplatform where user talk about their experience with the product and anyother thing related to that product. For example if there is article posted for theproduct , individual can discuss around the usefulness and validity of articleas well as it also addresses that article. Also blog writers usually submit thearticles they posted on their blog to sites like Hacker news to get a much widerrange of audience. Thus it is more sensible to analyze the social news site tomake most out from the discussion happening in the web for these products.Having a view at discussion activity level on these forums can give an roughidea of peoples using these products and the resources that could be found forthe product. If the data in these forums is analyzed one can possibly find theadvantages and limitation of products. But for now the focus is on calculatingthe activity level of the community regarding these products. For this purposepopular social news named Hacker news was analyzed.
Estimation of population
As part of analysis of data from social news sites like hacker news, a set ofsamples will be collected at random. Each samples will collected a from setof result will be analyzed to give us a count of numbers of false positives ob-served i.e. the data that doesn’t belong to system administration and IT as awhole. This presents us with total number of results found with total numberof data analyzed. So a sample proportion can be calculated and utilizing thissample proportion and estimation of total population proportion can be made.Finally a a value will be estimated from the calculation and make hypotheti-cal test for testing if estimated value represented the population proportion. Ifit is satisfied we will be using that proportion of population as the result weobtained. For this method to be utilized the sample should contain more than10 correct results and more than 10 incorrect results and the samples must bedrawn at random. Also the population size must be 10 times the sample size.We will be fulfilling all the criteria when we gather and analyze the data. Allthese task will help us understand popularity and resource availability of theseproducts.
3.1.2 Community and Support analysis
A social environment involving a product is created when people using theproduct help each other. Apart from solving each other problems they mightdiscuss set of features they wanted a product to have. Either way mailing lists
49

3.1. COMMUNITY
are the primary place where all of these kind of discussion happen. Mailing listof the open source project are kept alive by the user for the user. Thus by ana-lyzing it several things can be understood about the software. In order to havea clear understanding of support that can be obtained from the community , aclose analysis of mailing list will be done. The things like how many users aresubscribed and their activity can clearly be perceived by glance but a in depthlook into the interaction happening in the mailing can help us understand thecommunity structure , the quality of field support provided by the community, problems that are frequently faced by users, topics the community are talkingabout etc. So the focus will be to have in depth look at the discussion happen-ing in the mailing list to understand the community structure of each productand the support they provide. Since the study is also concerned with analyz-ing the community support ,the mailing list makes itself as ideal source that isprimarily used for discussing and placing problems for using the product.
As pointed out by the results from past studies and research conductedfor understanding the community , a community of users can be divided intodifferent groups depending in their activity level. In a community of users,different users have different activity level. Some users tend to be passivedescribe by users subscribed to the mailing list and only posting problemswhile others are active i.e. subscribed in the mailing list and keep a close eyeon the discussion happening and frequently replying to the queries and takingpart in discussion. Inspired by the work [20] we will try to categorize theusers into three groups and study their behavior. The task of grouping theusers have several advantages , it helps to understand what portion questionis asked by what kind of users, what portion of question are being answeredand is there a difference in answering behavior for the question posted fromdifferent groups. Additionally answers to the question like which groups ofusers are mostly giving answers and how big is the group can be obtained aswell. A part from that it also provides a clear view of total subscribes dividedinto groups on basis of activity they perform.
Community structure
The approach to classify the users is purely based on the type of activity theyperform in the mailing list. Basically there will be those types of users in mail-ing list one , that places the questions only i.e. opens a thread. Another typeof users are both involved in placing the question and answering the question, while other type of users are involved in answering the question and takingpart in discussions only. So users can be categorized as follows
• Seekers: These are the novice and passive users. They are involved onlyin posting question in the mailing list and look up for mailing list fortheir question to get answered. These users are the future prominentmember of community i.e. as they grow experience they can take part inanswering others queries.
• Seekers and Providers: These are the users that places the question andequally replies to other users questions. These are the kind of users that
50

3.1. COMMUNITY
make the community support alive. These users are experienced and arealways sharing their knowledge with others users. They are also equallybenefiting the product by posting queries that helps the product to grow.A part of these group that has a heavy traffic can be termed as powerusers.
• Providers: These are the kind of users that provides solutions only to thequeries posted in the mailing list. These users are can both be passive oractive because person can be subscribe to mailing list and is occasionallyanswering the problem that he/she has faced utilizing the product whiletheir can be other users that are frequently answering the queries i.e. theproduct creators etc.
Supportive Activity
By dividing the users into above discussed groups a number of things can beunderstood about the community of these product. A set of metric was fo-cused for which a data was to be gathered for all the groups. However we willbe focusing in analyzing the activity of seekers only and seekers and providers.These metrics were chosen to get a meaningful result out from the mailing listdata. The set of metric for which the data was to be gathered is listed as followsand all of them are to be collected as percentage to represent the proportion oftotal data.
• Subscribers: It represents the proportion of users falling in the groupwhile at the same time time giving a visualization how big group makingit easier to analyze the activities performed by this group.
• Questions posted: It represents the portion of query posted by the group.It helps us figure out how much of the total queries in mailing list arrivesfrom this group.
• Answers supplied: It represents the portion of answers supplied by thegroup. It helps to know the importance of groups’s role in providing theanswer to community.
• Unanswered question: It represents the portion of queries asked by thegroup that goes unanswered. It helps to understand the community be-havior for answering the queries from this group and how much couldyou expect from the mailing list if one falls in this category.
• Answers in 1st day: It represents the portion of question posted by userfrom this group that get answered in the 1st day. It measure the respon-siveness of the community , additionally helps to see the responsivenesscompared to different group.
Benefit of representation of metrics as percentage of total data are it is pos-sible to take the whole data in mailing list into account at the same time it willenable us to take uniform metric measurement for all products despite of the
51

3.2. RELIABILITY
amount of data in their mailing list. For example if there are large numberof users for puppet , the numbers of threads will be high as well, so it makesno sense with measuring the numbers and comparing with other product likechef or CFEngine. Additionally all of these products were introduced in dif-ferent years hence some might contain a long history while short for others.So just looking the numbers can miss lead the analysis that will be done on thestatistics collected.
Topic and problems discussed
Finally the subjects of each threads will be analyzed to get an understanding oftopics discussed and the problems frequently face by the users. Since a partic-ular problem ideally is represented by single thread , if different threads withdescribing with same problem exist in the mailing list then we can understandthat the problem is frequently faced by the users. Thus analyzing the threadscan give a good idea of the topics that are frequently discussed and problemsraised. For performing this task , the subject of each thread will be analyzedby implementing n-gram counting program to extract text from these subjects.Thus combination of words with high frequencies can be regarded as topics/problems frequently faced by the problem. The differentiation of weather theword combination refers a topic discussed or is associated with problem isdone through analysis of words and it’s combination with other word.
3.2 Reliability
It is always desirable to know how often a products fails but difficult to mea-sure. In case of configuration management failure becomes key concerns assystem administrators rely on these to to carry out automation and consistencywith in the system. This means if failure happen in configuration tool then itis more likely to break the whole system , ultimately leading to down time.And this directly contradicts the work the configuration tool is suppose to do.They are responsible to bring the system back into functional and operationalstate in case of failure happens, and having a too many failure in configura-tion tool is not a option. They must be resilient as far as they could and shouldposses least number failure rate. Thus this paper is concerned about how of-ten the products fails and study the failure pattern, and what is it’s impact onreliability.
There exists several model to carry out reliability analysis [27], in this casefault count model coupled with black box model which focuses in getting thenumbers of faults seen in software for a certain period of time will be uti-lized. Thus the study ignores software structure. The data about failures canbe gathered in two ways, either gather the failures through automated test asshown in [40] to get much faults as possible or the failures previous experi-enced by customers. Thus reliable source to get the list of faults i.e. bugs for asoftware product previously experience by user is it’s bug tracker. Hence thefailure data about all the three softwares will be collected from their online bug
52

3.3. USABILITY
repository. After the collection of data , a filtering mechanism will be appliedin the data so that all the possible noise are reduced. A possible source of noisein bug tracker is that these products keep the bugs related to each and everything i.e. documentation , other projects etc in the same bug tracker. Hencethe data related to the other projects and products needed to be identified anddiscarded.
All of these products have different maturity level and lot of (minor andmajor) version have been launched for them. Therefore a favorable start dateneeds to be chosen for each so that comparison of the reliability growth oflast three major version of each software can be done. Finally the filtered andseparated data for each version needs to be organized into bug frequenciesfor a certain time frame, which will be weekly. So a weekly bug frequenciesfor each version of product will be gathered which can show the bug patternfor software over time. These bug frequencies will be plotted against the timeand further analysis is done through curve fitting and obtaining the reliabilitygrowth.
Weibull curve will be fitted for each plot using Maximum likely hood es-timation method (MLE) and it’s corresponding parameters i.e. shape β andscale α will be calculated. Simplifying the equation 2.3, the Reliability is givenby [41]
R(t) = e−(t/α)β
(3.1)
Thus utilizing parameters obtained from the curve fitting process the reliabil-ity at at time T for each version of product can be calculated. This reliabilitythus obtained also can be plotted against the time which in this case is weekly, therefore reliability plot of different versions for the time range can be ob-tained. The reliability of each version is compared with another version of thesame product so that an reliability growth can be observed for a each product.
3.3 Usability
People have longed to know which if the configuration tool offers better us-ability. This has always been an disputed matter as each claiming to be easierto use and learn. Puppet claims about it’s DSL being simple and easy to un-derstand. With it’s top level language hiding the underlying details of config-uration tasks, it hopes that users feel more comfortable and productive. Chefon the other hand claims it offers the best user experience as it offers every-thing to be done by ruby code. It hopes by executing the configuration on thecode flow basis separation of different underlying aspects into aspects of it’sframe work will help users to write more flexible and extensible configura-tion codes. CFEngine also have it’s own ideology about the usability enablingusers control each and every aspect of system but requires it’s users to havedeep understanding of system. CFEngine puts simplicity and consistency byoffering it’s declarative language that operates on promise model. The chal-lenge for the study is to find out which of the product is easier to work with.By easier , we hope to find out which one offers less obstacles , which product
53

3.3. USABILITY
is learnable, whose documentation is helpful to get over problems in case ithappens and gives user a sense of control etc.
The background study was quite helpful to figure out the processes of mea-suring the usability in qualitative and much more structured way. Since themostly used metrics that needed to be measured to make a good usability areknown, the part of the challenge was ,executing the process of collection ofthese different metrics. Additionally we need to decide what will be the sam-ple size of data collected , i.e. are we targeting for the huge data collection byconducting the test on hundreds of user or the a data is collected only fromthe small set of users. The decision of sample size has a huge implication ofmathematical models and distribution applied latter on in the analysis of thesedata. For example, if a average time taken to do a particular task is to be calcu-lated for a set of users for a product , then if it’s small sample set , a geometricmean will give much accurate average value compared to median.
Apart from the decision of sample size we need to decide how the usabilitytest is going to be conducted on a set of users , i.e. through a controlled lab setup or through distribution of test so that user can conduct on their free timeand supply back the results. The next challenge was to over come was how thedata will be collected from users and what will be the methods and process inplace to collect these data. These were the problems associate with conductionof test to get metrics from users i.e. problem related to test implementationand data collection.
Another major challenge was deciding the task that users were going toperform. The selection of task was very crucial since it needed to be repre-sent the task that system administrator commonly use the products for and italso need to be the most basic form of task so that it doesn’t consume muchtime(days) of user while performing task. These two aspects of the requiredattribute of task were very contradicting as system administrators usually per-forms one huge complex task involving a series of task as per the requirementof their environment spending days in each task. Hence it was decided toconduct the task that represent some sub tasks commonly conducted by sys-tem administrators. Thus all these subtasks combined together can representa bigger task that justifies the use of configuration tool.
3.3.1 Sample size and Test Conduction
A reliable and qualitative results can be obtained even from small samplesize. The test conduction required each candidate to be provided with twomachines where they can play around with the products and carry out theirtask. So driven by this use case scenario, for conduction of usability test andachieve a reliable result from small sample, we can conduct test on 5-10 users.The users will be real world system administrators or personnel with a lot ofexperience with utilizing different system administration tools. On top of thatthey also have necessary problem solving skills in case if any problem ariseswhen implementing task using a particular product. Thus the sample size ofour usability test is around 5-10 and with real world system administrators asusability testers, we can gather a good amount of information with acceptable
54

3.3. USABILITY
reliability and accuracy. The data obtained from this sample size can help usanalyses the usability on both subjective and objective aspect. As mentionedin background study metrics obtained from this sample gives the some ideaand degree of measure of usability but the results should not be overstatedtoo.
For conducting the test, the powerful machine will be deployed to servethe Virtual machines to the users. The host machine need to host a set of vir-tual machines that we can distribute among users. Proxmox that helps us tocreate a pool of virtual machines and manage them. It also supports assigningthe machines to the users , hence Proxmox was ideal for our use case wherewe needed to provide a users only the machine they are concerned with. TheVirtual machines created in Proxmox will be assigned public ip address sothat they are easily accessible from outside , and two machines allocated foreach user. The users will be given credentials for Proxmox login , where theycould manage their two machines i.e. start stop restore etc. They could se-curely log into those machines utilizing the public address associated withthem. This will offer flexibility to users, machines are reachable and manageable any time. Lastly users will be send an email describing the instructionabout the usage of those machines , together with the task list and links toelectronic forms from which they can report back their result.
3.3.2 Tasks and Metric Collection
The tasks selected were to represent a each sub task conducted by the systemadministrator and when every tasks were completed , it give a meaningfulresult out of it , i.e. some application or service configured using these tool.Since web servers were most common these days and every organization havethem, it is common for system administrator to install web servers on machine,ensure it is running and make some company specific configuration so that itis capable to fulfill the company requirement. The most commonly used webserver was Apache , hence each user will be assigned the task of installingthe Apache making sure it is serving some web site under particular domainname. Over all outcome of the tasks will be a web server capable of servinga multiple web sites. Below are the 3 tasks that will be asked to the users toautomated using the three products. Together with the task a list of resourcesis supplied that can help user complete the task number 1 and 2, but it is up touser to use these resources.
1. Install a server and client of each product, such that client is able to re-ceive configuration from server. (A hello world example will do )
2. Install a software package Apache and make sure it is running in anymachine.( In server or in client)
3. Configure a virtual host in Apache, so that it now can serve a web appli-cation with domain name nextapp.iu.hio.no.
55

3.3. USABILITY
The tasks chosen addresses different activities exercised in system admin-istration. Task one is aimed at representing the infrastructure set up of configu-ration management tool. The second task represents the package managementand service management. Lastly the third one represents the configuration ofinstalled service to suit the need and thus demonstrate the automation. To-gether this task combined, it serves a high level goal of having a highly avail-able web server in the organization capable of serving multiple web applica-tion.
Additionally the task needed to be performed in order , for achieving thehigh level , however the users can perform the task in random order just toget each task completed, but the goal cannot be achieved. The listed task alsoshows the higher level of difficulty as the task number increases. The first taskcan be easily carried out by user by reading the quick start materials for eachproduct. The second task needs a little bit of searching but can be carried outciting examples. For the last problem the resources are not made available ,hence it needs some more effort from user to solve the problem. Additionallysince the problem is more specific, it also forces the user to learn about theproduct in some what detail. Hence if a user can get the problem 3 to be solvedfor the product then, the novice users had immediately reached to the mediumlevel for that product. Thus it can help us figure out the learning curve neededfor product.
Task time and SEQ and Problems rates
The users are send link of electronic form that were made using google docs.These forums have spread sheet as backends. The forums have different fieldslike start time, complete time etc that user need to fill into , upon submissionthe data gets inserted in the backend spread sheet. It is a very handy way ofdata collection from users. Some of the forms fields are required while othersare not , so in order for the user to submit the form they need to fill in thevalues of required fields and others could be left empty . Following are thefields in form that help us to collect task specific information from the user.
• Start time , Complete time for the calculation of task time for the user
• Stopped time for separation of effective time used in task, to calculate unproductive period while performing task
• Problems for gatherings issues faced by user and to make relative pro-jection on bugs that user might face later on analysis.
• Errors give the idea of confusing steps involved in carrying out the task
• Single Ease question to get a subjective measure of task and finally cal-culate task easiness
Apart from these fields it allows users to enter their name , choose theproduct and choose the task they performed. This form was to be submittedafter every task completion. So a single user will fill this form for 9 times. Thus
56

3.3. USABILITY
gathered data will be processed into the metrics suitable for analysis. For ex-ample , the start time will be subtracted from completion time to get a totalamount of time in minutes required to carry out the task. Also if a task hascompletion time , it is regarded as complete other wise , it is regarded as in-complete. Thus task completion rate can be measured for these products andcompared. The scale value obtained for single ease question can be averagedtogether for users for same task for same product. Thus it can then be com-pared with similarly obtained data on task easiness for other products.
Problems finding
Similarly the if there are no completion time for users , then what we will haveis a list of problems encountered by the users. By this way of data collection, we can now keep track of which user faced which problem thus enables usto calculate problem discovery rate. The problem discovery rate is a negativeattribute for product , the higher it is the problematic the product is and it de-creases it’s overall usability. We already know that 2.6.3 around 85% of prob-lems if the problems tend to affect 31% or more of the users and be found outby carrying usability test in only 5 users. Hence with such a small set we canknow the obvious problems associated with products in performing the task ,might also catch the rare ones. It also implies that since the sample consideredis small , the problems encountered by the users are also encountered by widerset of users in real world because the problems are frequently occurring.
Conversion
When we get information about the each tasked performed by the users, thedata can be filtered on users completing the task. A conversion is binary mea-sure and is taken into account when users is able to perform all the 3 task.This also means user is able to achieve high level goal associated with the task.Hence by looking at the task completion for the products , we can separate outthe users that completed all the task using the product , thus finally calculatethe average conversion rate for the product. In our case if the product withhigh conversion rate will be extremely easy to learn and understand as well asuse.
SUS scores
A link to a form containing 10 question with each question having a ratingscale as answer will be send to the users. The users will be instructed to fill inthe form and send their replies after completion of all three task for a product.Therefore users will be filling and submitting these form for three times eachfor a product. The forms are made using google docs , thus SUS scores sendby the users will be automatically collected in backed spread sheet associatedwith the electronic form. The SUS scores thus collected will be process furtherfor analysis. For example the SUS score of individual user for a product will becalculated by following the steps mentioned in background study about SUS
57
3.3. USABILITY
on 2.6.4. These SUS scores calculated from users for product will be averagedto get a SUS score for product obtained by this test and finally compared withSUS score of another product obtained in similar manner. One thing to noticeis that if the users are experienced with any of the product previously the SUSscores can high towards that product hence record will also be kept for eachuser about the previous experience with these products.
It is also possible to compare the SUS scores from individual users for dif-ferent product and study the co relation with their task performance. Thereneed to exist a positive correlation between the SUS scores and Task perfor-mance. For example the users can have lot of problems executing the task andstill give high SUS scores to those products , this will result a be negative cor-relation between the task metrics and SUS scores. Therefore by carrying out aco-relation between these data sets we can make sure about the validity andreliability of SUS score obtained.
58

Chapter 4
Data Collection and Results
4.1 Market share and Resource availability
4.1.1 Usage trends
The figure4.1 shows the result obtained from the google insights. The resultshows the search trend for the key words CFEngine, chef and puppet. As seenin the result it shows that CFEngine being the oldest product used to be pop-ular but slowly decreasing the popularity as time passes by while the puppetand Chef are gaining the popularity. At the End of 2011 all of the configurationmanagement tools seems to have same popularity level with some minor fluc-tuations. Google keeps account of how many times the key words appearedand in what context as well. Given that chef and puppet are common dictio-nary data , a search on these key word might be coupled with lots of noise.So a filtering mechanism was applied on basis of context that these key wordswere used in search term. Here we used operating system as context, so thatwe can be sure that these key words were actually used to do configurationmanagement task on some operating system. The full depth of the contextsearch filter applied to get the trends of the keywords is
All Categories ->Computers & Electronics->Software->Operating Systems
The fig 4.1 not only shows the time series of graphs involving the frequen-cies of the of keyword appeared in the search terms but also gives the overview
Figure 4.1: Trends for key word CFEngine, Chef and Puppet from google in-sights
59

4.1. MARKET SHARE AND RESOURCE AVAILABILITY
Figure 4.2: Websites referring the products website from wholinks2me.com
area of from where those search were made generated. Here CFEngine seemsto be a global player where majority of the searches made from four differ-ent country namely United states, Germany , France, United kingdom whilepuppet and chef seems to be popular with in the united states.
4.1.2 Web site Popularity
Having a view of usage trends we now focus on exploring the available re-sources for these products. We would like to know how many websites orblogs are out there that talking about these products. These websites and blogswill definitely have discussion on these products and people taking part ondiscussion these blogs can be referring to the important material that might beuseful and contained in the web site of the product itself. Hence regards lessof whether it is a marketing forum or a social discussion forum we are inter-ested in achieving the numbers if web sites that are referring to the productweb site. In this way we can have a relative guess the of material that we canget from web for these products. Figure 4.2 shows the numbers of back linksprovide from google and it gives an indication of a large amount resources areout there as compared to that of chef and CFEngine. But we cannot solely relyon this statistics to predict the resource availability or popularity as , it mightbe a marketing campaign that might has influenced these number.
The number of incoming links is an important part of Googles famousPageRank algorithm. It categorizes the link on various factor measuring it’susefulness and give rank to link of the website. Hence rather that having a
60

4.2. MAILING LIST
look on only the number of web sites pointing to product main page , we havealso have look at page rank and figure out the quality of those link backs.It was quite interesting to know that though CFEngine have less numbers ofwebsites referring to them it has page rank of 7 out of 10 while , puppet andchef both have the page rank of 6 out of 10. So it can be referred that eventhough CFEngine has less number of websites talking about it , the link backsfrom these web site it quite useful. Hence it can also be conclude that puppethave a lot of buzz created around in the web and we can expect to find a largeshare of web talking about the puppet compared to Chef and CFEngine, butwhen it comes to the helpful links that points to some thing interesting everyproduct have similarity with CFEngine leading with a small margin.
4.1.3 Social discussion
Hackers news contains discussion on wide rage of topics, the data from thissite was collected to get the discussion activity surrounding our interestedproducts. Hacker news provides an API through which one can query it’sdatabase mentioning a set of search filter. A research was made for consumingthe data from this site, and found a number of previously made solution by thecommunity targeted to obtain a summarized and specific report out from thedata exposed by api call. Hacker news Apps list a number of application thatconsumes data from hacker news api and gives users the flexibility to carryout research on those data by providing different functionality like viewingthe trends, making correlation between trends for the supplied key words etc.Trend viewing tool was used to inspect the popularity of these tools. The ap-plication collects the keywords to be plotted as comma separated values andgives a time series graph. Internally the app will match the key words withwords in different blog articles and discussion. Hence finally create a weightedmean of the frequencies of the words count found for each key word withina particular time range. Figure 4.3 gives the Correlation between the frequen-cies of key words CFEngine, chef and puppet cited in different different blogsand articles. It shows the puppet and chef to be popular and more activelydiscussed as well as there are more blogs and articles talking about the puppetand chef. But at the same time it also shows the artifacts being introduced indata as the graph shows a substantial traction in chef before chef was releasei.e. in 2009.
4.2 Mailing list
The data collection process for analyzing the mailing list was diverse anddriven by the of availability of mailing list data for public by these respec-tive products. CFEngine provided it’s mailing list archive data as mbox filesthat could be downloaded, Puppet was using google groups as it’s mailing listhence it data was only available for viewing through web, finally chef also hasexposed their mailing list archives as read only source. Hence for both Pup-pet and Chef the only way to get data was through crawling their mailing list.
61

4.2. MAILING LIST
Figure 4.3: Articles and discussions from hacker news
Since only the users mailing list was to be analyzed , following are the mailinglist that were taken into account
CFEngine [email protected] [email protected] [email protected]
CFEngine mailing list archive data was available for download for as mboxfiles. The mbox files were downloaded and the data was processed by the toolcalled mailingListStats , originally created as a part of set of tools that are usedfor analyzing open source project. This tool took the mbox files and parsedit to create a relational database containing the messages and people and therelation between them. A separation of threads , answers for the threads ,senders , only question posters were carried out by making a SQl query againstthat database.
Puppet using google groups as mailing list did not provide any of it’sarchive data to be downloaded. Hence a crawler need to be written in or-der to obtain data from the puppet’s mailing list. Since new user interface ofgoogle group utilized a a lot of javascript to render messages , it was not pos-sible for crawler to get the message and it’s details from google groups, Butit turned out that puppet has it’s mailing list data searchable through variousfree mailing list aggregation service. These services like mark mail and mail-archive also made puppet mailing list data available. Since they were simplehtml files , it was easier to parse them and grab the contents needed to frompage and save it to database as web site was crawled. A through study aboutthe placement of organization of messages and navigation mechanism avail-able in these services for exploring the mailing list was done. It was discoveredthat mail-archive did not have a smooth navigation system that let the crawlerscript to gather all the mailing list data systematically. Hence mark mail waschosen, this site has two version of user interface , one targeting the humanuser, while another was friendlier for the crawler scripts to traverse the link
62

4.2. MAILING LIST
and gather mailing list data. Finally a crawler was made utilizing perl lan-guage that was specifically designed to traverse the markmail links and gatherdata into mysql data base. Fields like date send , subject , message body , origi-nal thread name, sender, and it’s url was stored. Utilizing these various Mysqlqueries were made in order to get desired out put like number of senders ,separation of threads(questions) only from rest of the data etc.
Chef hosted it’s mailing list archive utilizing the software called monharc,and it turned out that the mailing list archives data was only browse able fromweb by outside users. Thus a crawler needed to be developed in order tocapture data from the web. But the challenge here was different comparedto puppet. The data available for chef was not crawler friendly , i.e. theywere designed to be difficult to traverse and harvest data. Hence with a littlemodification of previous crawler script , we could not gather data from chef.For data gathering a thorough understanding of navigation in chef mailinglist archives was necessary. Once we reach the message page , we need tohave a good understanding of html layout of the page to pick out only thethings needed. Hence a completely new script was written utilizing perl toharvest data from chef mailing list. While the script seemed to successfullyharvest data for some years, in others it failed due to invalid html and injectionof script to render mailing address of the subscribers. Hence along the wayvarious tweaks were made in the scripts to cope up the differences in the pageand finally data till 2012 march 3 was obtained and save in the database. Thefields extracted from mailing list and save in the data base was same as puppetand used the same set of queries to get our result.
Fig 4.4 shows the message activity collected for all of these products. It is atime series graph and shows the message flow per month since the year of themailing list was established. The graph for CFEngine shows strong increasein mailing list activities at year 2010 while recently the activities has sloweddown. For Chef , the mailing list activities are ever increasing. For puppet , itis observed that it has high initial value i.e.(messages per month) in graph , itis because Mark mail started to gather it’s mailing list activities starting fromthat particular date. Puppet shows large numbers of mails being exchangedand steady increase followed by a slight deep in numbers in recent years.
With an idea of message flow in each of the mailing list we inspected themailing list for seekers ,providers and both , The table4.1 summarizes the in-formation obtained from each mailing list. The data for each mailing was col-lected from it’s establishment to 2012 march. An interesting thing observed isthat the numbers of individual falling in each group doesn’t seemed that muchdifferent for all the products.
With a overview of mailing list data divided into different categories ofconcern, individual groups were focused and the data was further analyzedto study the activities performed by each group and understand importanceof the group in over all mailing list. Data about metrics discussed in approachwere collected for each group , except the metric ”numbers of answers” wasnot collected for seekers group because, this group are solely categorized toidentify the question posters and thread starters , thus they are not involvedin any kind of answering activities. Table 4.2 shows the data collected for
63

4.2. MAILING LIST
//
Figure 4.4: Mailing List activity for all there product
CFEngine Chef PuppetSeekers 33% (n=269) 19% (n=110) 26% (n=834)Both 54% (n=442) 61% (n=358) 50% (n=1570)Providers 13% (n=112) 20% (n=112) 24% (n=739)Total subscribers 100% (n=823) 100% (n=580) 100% (n=3143)
Threads (n=3767) (n=2056) (n=7023)Resposes (n=12559) (n=4745) (n=25678)Total messages (n=16326) (n=6801) (n=32707)
Table 4.1: Mailing list divided into different categories
64

4.2. MAILING LIST
CFEngine Chef PuppetQuestion posted 16% (n=601) 9% (n=185) 15% (n=1023)Only one question poster 69% (n=186) 66% (n=73) 86% (n=719)Unanswered threads 48% (n=292) 49% (n=90) 30% (n=304)Questions replied on same day 39% (n=233) 38% (n=71) 45% (n=467)Represents question poster 37% 23% 34%
Table 4.2: Statics about seekers group
CFEngine Chef PuppetQuestion posted 84% (n=3165) 91% (n=1871) 87% (n=6180)Answer supplied 96% (n=12143) 94% (n=4493) 89% (n=22959)Only two question poster %35 (n=186) 13% (n=358) 19% (n=301)Unanswered threads 22% (n=292) 30% (n=578) 16% (n=1046)Questions replied on same day 57% (n=233) 52% (n=966) 61% (n=3808)Represents question poster 63% 76% 66%Represents answer provider 79% 76% 67%
Table 4.3: Statics about seekers-providers group
seekers group for all the tools. And table 4.3 shows the data collected for usersthat played the role of both seekers and providers. Here also one thing canbe noticed immediately, All the products showing not much difference in thedata collected for most of the categories.
Since data collected for both seekers and seekers providers, showed major-ity of queries and answers are made from this group , it was not necessary tocollect data for providers , with simple arithmetic once can know the statisticsfor providers group for the different metric we have chosen. With an arsenal ofdata from mailing list for all of these products , we wanted to study the topicsand problems discussed with in each products. The threads subject summa-rizes the message purpose of the thread and discussion happening inside it,a word count mechanism used in data mining was implemented only for an-alyzing the these subjects. The topics that are discussed in multiple threadshould show up as one having high frequency. Since counting only one sin-gle word provides no meaningful results ,the word groups with in subject wascounted. A per module to write a script that returns the count of bi grams ,trigrams and quad grams with in the supplied text. For the analysis topics andproblems discussed in mailing list , a query was run against MySQL data baseto return only the subjects of the threads and the data miner script was runagainst the list of text generated. Top 10 frequently discussed topics found outby combination of two words, three word and four words ,in the mailing listof these products are shown in table. Of course a lot of interpretation can bemade out from this result but it is to be analyzed to get a overview of topicsand understand the problems frequently faced by user.
65

4.3. BUG REPOSITORY
For generation of lists of topics frequently discussed , a set of commonlyoccurring words like re, release, released , available etc were excluded. Thewords representing the package release activities were also excluded. Alsorepetitive observation of result list generated by script was done to get a sen-sible meaning out of the words with in list. The combination of words thatdid not give any sense e.g. chef chef , puppet users ,cfengine cfengine wereremoved from the bi-gram list. The trigram list is to be use to make sense outof the bigrams and Quad-grams are to get a complete meaning out of bi-gramsif any of the quad-grams contains combination from bi-grams. The table 4.4shows filtered results from the miner script organized as bigrams , trigramsand quad-grams. Notice an interesting pattern is can be observed with in atable. The bigrams gives the view of topics frequently discussed while tri-grams helps to create a mind set if the topics are from reoccurring problemsand finally quad grams helps to see the topics found in bigrams are indeedproblems. This gradual addition of words from bigram to quad-gram helps tocomprehend result and perceive the problems more easily.
4.3 Bug Repository
4.3.1 Data gathering
According to the model of choice,failure and fault counts for a certain periodof time was needed. Bug tracker was the perfect place to look into to obtainsuch kind of data. Bug tracker of these products stored the data about var-ious bugs that appeared during testing as well as in production as bugs arereported by customers too, on top of that these bug reports also have versionassociated with it which will ease the task of separation of bugs accordingto version number. Hence focus was made in harvesting data from the bugtracker of these projects. Next step after identifying the source was identifyingthe attribute of a bug report that are important. A weekly bug frequencies forat least 3 versions was to be established, so at least three field were need.
• the date at which the bug was reported
• the version of product the bug is associated with
• unique bug identifier
The bug reports in bug tracker of all the three products provided various in-formation. Additionally bug tracker of chef and puppet also maintained bugreports about other projects and components e.g. puppet enterprise, chef cookbooks etc. These bug reports has nothing to do with the main product so onlythe bugs related to project puppet as mentioned in Puppet bug tracker , andchef as mentioned in chef bug tracker was considered. The bug tracker of theseproduct were deployed into service on various time hence shows various lev-els of maturity and the amounts of bugs posted in them. Therefor just for data
66

4.3. BUG REPOSITORY
CFEngine Chef Puppet
Bi-gramscfengine help run list puppet dashboard
insert lines knife bootstrap custom factspolicy server data bag external nodes
segmentation fault remote file best practicesserver returned ec instance ssh authorizedreturned error client run os x
edit line application cookbook package providerduplicate selection ruby block undefined method
package installation attribute value custom functionquickstart guide cookbook files retrieve catalogpackage method lwrp chef external node
package management undefined method authorized keyfile select rhel packages best practice
reference manual centos rhel ruby dslcopying files server error puppet mastersyntax error error chef custom typeconfig file cookbooks chef puppet labs
cfengine stdlib package provider puppet agentvar cfengine nodes chef file type
Tri-gramsfiles cfengine help with chef chef users how tofile cfengine help run list chef users could not
server returned error on windows chef could not findclasses cfengine help for chef chef could not retrieve
cf cfengine help centos rhel packages users problem withcfengine cfengine help application cookbook chef users problems with
selection of value how do i not retrieve catalogduplicate selection of attribute value in users using puppet
how to run i test an ssh authorized keyerror cfengine help test an attribute not working puppet
Quad-gramsduplicate selection of value attribute value in an could not retrieve catalog
getting started with cfengine do i test an could not request certificatewith cf cfengine help an attribute value in retrieve catalog from remote
forget the domain name test an attribute value catalog from remote serverpackage installation of rpms i test an attribute not retrieve catalog from
did you forget the how do i test retrieve current state ofyou forget the domain modifying kernel parameters chef to retrieve current statethe domain name or value in an chef failed to retrieve current
started with cfengine webinar undefined method ’ for current state of resourcedomain name or ip method ’ for nil is it possible to
Table 4.4: Collection of frequently repeating word combination in mailing list
67

4.3. BUG REPOSITORY
gathering process , all data about the bugs reports were collected from respec-tive bug tracker. This collected data was filtered before analysis is done , whichis the second phase. The bug tracker of CFEngine and Puppet allowed it’s bugreports to be downloaded into csv files while chef’s bug tracker allowed it’sdata to be downloaded as excel files. The data in all these files were importedin to mysql data base for getting the overview and then deciding on which fil-tering mechanism to be applied in each in order to obtain similar result formatfor all the products. The table 4.3.1 shows the source and the time of the bugtracker has been into operation for each product.
CFEngine http://blog.cfengine.com/bugtracker 2010Chef http://tickets.opscode.com/browse/CHEF 2009Puppet http://projects.puppetlabs.com/issues 2008
4.3.2 Data Filtering
Each mysql table created by importing the data from csv and excel file con-tained different fields and large number of data than required. Hence data wasinspected for each product by making SQl query to check the versions avail-able , the date since operation etc. After carrying out inspection following datawas to be filtered out for at least three version ,and the date range taken intoconsideration was influenced by the version taken into consideration.
For example for Puppet we could see a number of minor version but mostimportantly 4 major version i.e., 0.25, 2.6, 2.7, Telly. Since Telly was relativelynew and it did not contain much bug reports associated with it three versionwere taken into consideration i.e. 0.25,2.6 and 2.7. Now the date range neededto accommodate bugs reports from all the version taken into consideration.For this case the oldest version into consideration is 0.25 ,whose initial bug re-port dates back to 2008 january. Hence the date range taken into considerationis 2008-01-01 till date.
Similar operation was carried out for CFEngine and Chef. Since CFEngineversion 3.3 was just released it was not good candidate to measure fault count.Hence 3.0, 3.1 and 3.2 was choose for CFEngine and 1st bug report for the oldversion i.e. 3.0 into consideration dates back to 2010 january.
For chef there were number of minor releases for each version , but themajor version were 0.6.x,0.7.x ,0.8.x 0.9.x and 0.10.x. The latest version 0.10.has number of minor releases i.e. 0.10.0, 0.10.2,0.10.4,0.10.6,0.10.8 and 0.10.10.Hence 0.10 shows it is a good candidate for analysis as it has been around fora while and has sufficient numbers of bugs affecting it. There for the versiontaken into consideration for chef was 0.8.x , 0.9.x and 0.10.x. The starting datetaken into consideration for chef because of version 0.8 was 2009 june. Thetable 4.3.2 summarizes the date range and version considered
68

4.4. USABILITY TEST
Product Versions considered Start dateCFEngine 3.0.x, 3.1.x, 3.2.x 2010-01-01Chef 0.8.x, 0.9.x, 0.10.x 2009-06-01Puppet 0.25.x, 2.6.x, 2.7.x 2008-01-01
4.3.3 Results
The Figures 4.5, 4.6 and 4.7 shows the weekly bug frequencies for all the threeproducts separating the bug frequencies for each version out from the total bugfrequencies. The outer line in the weekly plot shows the total bug frequencies.As seen in the figure there is a overlap in the bug reports between differentversions which spikes up the over all frequencies. Also the over all bug fre-quencies patter doesn’t seems to follow the pattern that can be representedby Weibull distribution function but the bug frequencies related to individualversion seems to follow the pattern that can be represented by Weibull distri-bution function. Hence in analysis section , curve fitting can be carried out foreach version to calculate the parameter for distribution and ultimately calcu-late reliability. It is also observed from figure 4.7 that there are small releasesof bugs reported for some version of puppet early on from development phaseand there is significant over lap of old version with new version that shows ei-ther the development of these versions are carried out in parallel or the entryin bug tracker are wrong. While for Chef and CFEngine in figures 4.5 and 4.6respectively, bugs report arrival pattern seems to be more natural with leastoverlap on bugs reported for old and new versions and bug reports for newversions arriving only after the old version. Additionally when bug reportsfor new version starts to arrive, the bug reports for old version seems to die,It might be because of old version being phased out by users as new versionsare launched.
4.4 Usability test
A usability test was conducted as planned in the approach section. The pri-mary objective of this task was to collect the data about usability metrics thatenabled us to make a quantifiable measurement regarding usability and giveus a better view of the problems associated with it on these different prod-ucts. The test executed as planned but there were few glitches that preventtest from smoothly moving forward. Since users were taking test at differenttime at their comfortable schedule, my of the users happen to get the sameproblem from the test environment i.e. restoring their respective machineswhen they are done conducting test with one products. Thus there was min-imum email exchange between candidates during the test phase in order toguide them to properly use the test environment which seemed to take awaysome enthusiasm in candidate about the test. Apart from that users did nothave any trouble understanding the test question and the process of submit-ting their response. The section below shows the results obtained for various
69

4.4. USABILITY TEST
Figure 4.5: weekly bugs frequency for CFEngine
Figure 4.6: weekly bugs frequency for Chef
70

4.4. USABILITY TEST
Figure 4.7: weekly bugs frequency for Puppet
usability metrics collected from test.
4.4.1 Completion rate and Task times
Task completion status along with task time for 5 candidates conducting 3 taskon each product is shown in table 4.5. The entries in table with task time arecompleted and the ones without are incomplete task. The table shows a ma-jority of users being able to carry out at least two task for CFEngine , while forChef and Puppet equal portion of users being able to complete the tasks. Butthis collected task statistics is to be processed further by application of pointestimation and calculation of confidence interval in order to get a meaningfulinterpretation out of it.
4.4.2 Task difficulty level
Task difficulty level was meant to be tracked by single was ease question. Thetable 4.6 shows the single ease question score for each task for CFEngine, Chefand puppet. The results shows that some most of the users have high level oftask satisfaction for two task i.e task 1 and task 2 using CFEngine. For Chefthere is mixed level of satisfaction regarding all the task. In case of Puppetmajority of users is satisfied with their performance in task2.
71

4.4. USABILITY TEST
Candidate No. Tasks CFEngine Chef Puppet
11 24min (15min) 22min 32min2 5min 9min 20min3 30min(15min) 41min -
21 15min 27min -2 11min 4 min -3 28min 7min -
31 15min((5min) - -2 9min(5 min) - 10min3 50min(30 min) - 15min(5min)
41 45min 90min -2 90mins - -3 - - -
51 45min 60min 10min2 - - 35min3 - - 20min
Table 4.5: Task times(unproductive time) for performing tasks
Tasks CFEngine Chef Puppet
1
5 1 46 5 16 1 13 3 36 1 6
2
7 6 67 7 15 - 65 2 11 1 6
3
4 2 13 7 -3 - 6- - -1 1 4
Table 4.6: Task scores supplied by users
72

4.4. USABILITY TEST
Problems User 1 User 2 User 3 User4 User 5CFEngine Task1Bootstrap problem x x - - -dependency issues x - x - -CFEngine Task2Problem writing poilices - - - x xProblem understanding process flow - - - x -CFEngine Task3Lack of good examples and documentation - x x - -
Chef Task1problem with ruby x - - - -problem with keys - x - - -cannot follow documentation - - x - xTime consuming - - - - xChef Task2confusing terminology and architecture x - x - x
Puppet Task1Certificate Error due to DNS x x x x xPuppet Task 2Problem understanding architecture x - - - -
Table 4.7: Problems faced by users
4.4.3 Usability Problems
The problems faced by users while carrying out the task is termed as usabilityproblem. These problems can be common problems that are faced by commonusers of product or it can be an unique problem only face by a specific users,what ever is the case if a problem is found it helps to understand the task met-rics that users supplied after performing the task. Tables 4.7 shows the prob-lems reported by users while performing tasks utilizing different products at atime. It cannot be related with whole scope of problem associated with prod-uct, it is only the problem reported by users while using particular product.This problems can be treated as obvious problem because if it is experiencedin such a small sample , then it is likely to be experienced by a large set of usersin large population. Most importantly the problem for Puppet seemed to beexperience by almost all the users hence it must be the most frequent problemthat users have to face while using puppet.
4.4.4 SUS scores
Post test questionnaire responses were collected as user’s perceived satisfac-tion of the product itself. The collected responses were a series of scores rang-ing from 1-5 for 10 question asked to each participants about the product.
73
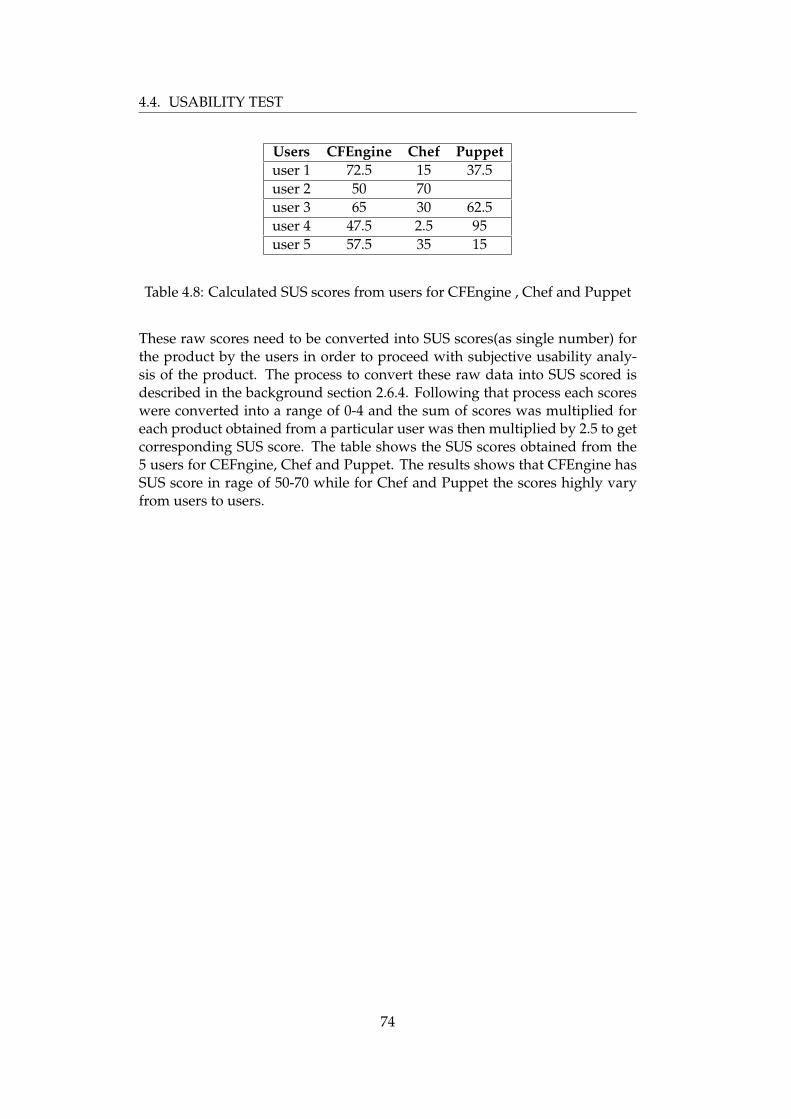
4.4. USABILITY TEST
Users CFEngine Chef Puppetuser 1 72.5 15 37.5user 2 50 70user 3 65 30 62.5user 4 47.5 2.5 95user 5 57.5 35 15
Table 4.8: Calculated SUS scores from users for CFEngine , Chef and Puppet
These raw scores need to be converted into SUS scores(as single number) forthe product by the users in order to proceed with subjective usability analy-sis of the product. The process to convert these raw data into SUS scored isdescribed in the background section 2.6.4. Following that process each scoreswere converted into a range of 0-4 and the sum of scores was multiplied foreach product obtained from a particular user was then multiplied by 2.5 to getcorresponding SUS score. The table shows the SUS scores obtained from the5 users for CEFngine, Chef and Puppet. The results shows that CFEngine hasSUS score in rage of 50-70 while for Chef and Puppet the scores highly varyfrom users to users.
74

Chapter 5
Analysis
5.1 Community trends
It might me tempting to believe from figure 4.1 that chef an puppet are thetechnologies that are currently most popular and widely used but the datagoogle insight result doesn’t provide the full picture. Though it shows the -vetrend for CFEngine , +ve trend for Puppet and Chef it might be coupled withnoise. Considering the fact that both puppet and chef are english dictionaryword and the key word like chef and puppet could have been used for searchesthat has nothing to do with configuration management but have a huge effectin trend analysis. So keeping that in mind, even though operating system asfilter was applied to signify the context of search the data seemed to be coupledwith noise. There is significant level of activity for chef in year 2007/2008while the project mailing list contains data only from 2009. The chef projectactually started in year 2009. In year 2009 the searched frequencies seems topick up a little. Also if the same can be observed for puppet, the time seriesshows the search terms for puppet started from early 2006 while the projectactually started from 2005. If CFEngine is now taken into concern then it showsa high rate of searches in year 2005 / 2006 which is possibly for CFEngine 2,but CFEngine 2 popularity slowly died while CFEngine 3 was introduced inyear 2009 there seems no clear possible way to get CFEngine 3 specific data.Hence it’s trend is coupled with CFEngine2 which can be considered as a kindof noise. Also another important aspect observed from the google insight, isthe area interested in these products. While CFEngine seems to be the globalplayer where people around the Europe and USA being interested , it might bereflected by the used of CFEngine 2 which was the most popular configurationmanagement solution at the time it released. But with puppet and chef as wellas CFEngine3 being introduced lately and more younger they did not haveenough data to represent the areas that were interested in them. Hence thearea of interest gives the tentative regional use case of these products But nonethe less the time series 4.1 give a overview of what is the current status ofthese tool and how frequently are they being searched in the web. It seemslike all of them have similar search trend which can be implied that all of thesetool are equally used by the people. It might be some time when one of these
75

5.1. COMMUNITY TRENDS
tool leads the path or might remain same sharing the equal portion from themarket between them.
5.1.1 Popularity and Resources available
It was the same case we faced with google insights however the the quantityof data returned from hacker news is much less and focused. Since it returnsanalyzing a set of articles submitted and the discussion under them , it’s muchmore easier to filter the randomness in the data and try to filter out the results.With a small amount of filtering done by applying the key words like ”kitchenfood” etc the total data returned for chef seemed to reduce. Hence and sta-tistical method like sampling[42] and testing [43] was utilized to predict whatportion of the total data returned contained the exact result.
Small samples containing 10 results were taken repetitively from the totaldata returned from the search query. Then output obtained in each sampleswere analyzed to point out calculated the number of desired results. In total10 samples were taken at random that included 100 results from the total resultset. The number of desired results obtained in each samples are
9,5,7,4,5,7,2,6,8,6Thus the mean numbers of interested results were 5.9. Hence from the
sample collected , it showed that only 59% of the total result obtained for chefrepresent the data related to configuration management and system adminis-tration and useful to us. A confidence interval was calculated in order to findthe interval that could represent the portion of total result set to contain theresults we are interested in. A 99% confidence interval was chosen which re-sulted in the interval of (0.59-0.12, 0.59+0.12). There fore we now know fromthe samples collected that 47% -72% percent of the data result hope to containthe result about Chef related to configuration management.
After the result obtained, a confirmation was needed that confirms the re-sults showed by the sample actually represents the total proportion of the pop-ulation i.e.(the whole result ) set. For this one sampled z-test was conducted.For z-test , a significance level of 0.05 was chosen. Since the interval of theproportion was known ,a hypothesis was made that 60% of the whole resultset represented interested data, rest were noise.
Thus the values for hypothetical proportion of population(P) is 0.60 andsample proportion was (p) is 0.59. The z-test was conducted by utilizing Rsoftware. The p value obtained was 0.419 which is greater that the significancevalue. Hence the null hypothesis cannot be rejected i.e. our assumption that60% of the whole data returned for the search query on key word ”chef” con-tains the data about Chef product.
Therefore the total results obtained for chef was 1532 of which only 60% i.e.919 of them were useful. This can be interpreted as the tentative total numberof discussion, articles and blog post we can find for chef is 919. Similarly theresult set for puppet keyword was analyzed to reflect the true number of posttalking about puppet in IT or system administration. The random samplesresulted following number of right results.
6,10,7,8,7,4,5,5,2,8
76

5.1. COMMUNITY TRENDS
Therefore from the samples it shows 62% of data available is related to pup-pet and other are related to other things. 99% confidence interval for showedthat data portion about Puppet product is in range 50% to 74%. Hence a con-firmation test was made taking a hypothetical value 70%, after z-test , the pvalue was found to be 0.04 which is less than the significant value. Hence ourassumption was not correct. Now a new assumption with 69% was made. Forthis hypothetical value the z test resulted, a p value of 0.06 which is slightlygreater than significance value. Thus with 99% confidence, it can be stated that69% of the whole result set contains the data about Puppet product.
Thus the total result returned for puppet key word by hacker news was1202. Out of these results only 69% of 1202 i.e. 829 contains the discussion ,articles and blog post about puppet as configuration management product.
For CFEngine only 83 results were obtained hence the methods applied forthe Puppet and Chef cannot be applied to it , because total population sizewon’t be greater than 10 times the samples size. Since the total populationsize was very small, every result were analyzed. After having a inspectionof data all the data returned from the result set seemed to contain data aboutCFEngine as configuration management product. Hence all 81 records wereuseful. Thus the total resources as obtained from hackers news is listed in thefollowing table.
CFEngine 81Chef 919Puppet 829
From the result obtained, it was apparent that as raw results includes ran-domness , so a statical method was applied to estimate the total proportion ofthe whole data that represents the useful information. 99% confidence intervalwas used to find the required interval and it was followed by one sampledz-test to test the hypothetical value of proportion taken from the previouslycalculated interval range. This method might not be perfect and accuratelyidentify the true proportion of the real data in the whole result set , but it givesthe possible view of interval that represents the proportion of desired data hid-den in the result set. This method can be improved and made more accurateby taking large number of sample with different sizes repetitively and finallyconduct the same kind of test on the data obtained from these samples. Withthe high numbers of samples it is more likely to accurately predict the trueportion of data in the result set.
From the hacker news data analysis , our hypothesis about the result setobtained for chef and puppet will be influenced by a lot of noise and that withCFEngine will be much less was proved. It absolutely makes sense becauseCFEngine being a non dictionary word not used in any other field and profes-sion will always give the result that we are looking for. While puppet and chefboth being a dictionary word and linked with other profession (entertainment,cooking) etc tend to give a lot of result of which only some portion of data areuseful to us but still the results point out that Puppet and Chef are popularand large numbers of resources are likely available for them.
77

5.2. COMMUNITY STRUCTURE
5.2 Community Structure
5.2.1 Analysis from mailing trends
Data on mailing list was categorized into various areas of interest and wefound a of similarity between these products on community structure. Thoughdifferent amounts of mailing traffic and trends exits in each of the of the prod-ucts , the structure is the same. Since puppet has large number of subscribers,currently it has double the mailing traffic compared to other products, be chefseems to be gaining a lot of popularity with ever increasing mails since it’slaunch. For CFEngine , the mailing list traffic is a bit turbulent , with largenumbers of mails arriving on the year 2010, it may be due to the launch ofCFEngine 3 earlier in the year 2009. Hence it can be though as CFEngine isslowly making it’s way back into this field with CFEngine3.
From the numbers of subscribers in the mailing list Puppet proves to be thepopular product. Chef also proves to be the hot product with a bright futurewith as we can find a lot of resources talking about it provided that it is is justtwo years old, and +ve trend observed in it’s mailing list also adds to it. ForCFEngine it’s mailing list shows to be the oldest of all , and the mailing trafficshows that it has small community that is involved in discussion and problemsolving. When looked at the type of user heavily involved in questioning andanswering all product showed the same groups of user were significant. Allproduct showed seekers only and seekers/provides group to be very vital toit’s community and their portion with in over all subscriber were similar in allof these tools. More than half of the subscribers fell into these category for allproduct.
5.2.2 Analysis of seekers group
CFEngine shows it has a large share of seekers only group that comes to themailing list only to get answers , this remains some what similar to the puppetand chef. This can explain why a CFEngine has a lot of users but small mailingactivity foot prints. Also the providers only group is same for Puppet and Chefwhile that of CFEngine is small. But important result figured out from thisanalysis was all of the product seems to have large share of users involved inquerying and posting answers.
Moving deeper in to analysis of behavior and importance of each group,we can see that same share of question are posted by the seekers only groupfor puppet and CFEngine despite their size. They represent 1/3 of the questionposter and post almost 1/4 of the total questions. This can be understood thatlarge share of people use it’s mailing list for help. It is also seen that a lot ofqueries from these group get unanswered for all products. Chef seemed to beleading into this category while CFEngine is very close. This might be due tothe users in this group post already discussed problems or a lot of messages infrom this group is spam. But if it is a normal user ,the numbers in this sectionshould be low as possible, then only it encourages the community to flourish.
Puppet seemed to be more responsive when it comes to answering the
78

5.2. COMMUNITY STRUCTURE
queries from seekers group but only by small margin. Combined with thequeries dropped and the responsiveness , it can explain why puppet is thepopular product among the three for novice users. But in summary all of theproduct tending to have similar behavior in number of categories and differedonly by small margins.
5.2.3 Analysis of seekers providers group
All the product showed that a lot of it’s mailing list users belong to this cat-egory, and majority of question and answers in mailing list are provided bythis group. But even with this similarity as a whole , small differences can beobserved when each of the individual categories focused. This group providelarge number of question compared to other two groups but only with smallmargin. Similarly , for CFEngine this group provides most answers as com-pared to it’s counter parts. The portion of questions that went unansweredfrom the user in this group was less for puppet and high for chef, but in all itwas less compared to that of seekers group. Also the portion of queries fromthe user in this group that get answered in first day is large for puppet and lowfor Chef but the differences being very small. More than half of the questionget replied on the first day. Combining the response rate and queries droppedwe can see that community is more supportive and helpful. Hence when onebecomes a experience user of the products , one can often look at the commu-nity to get problem solved / discussed for all of the products.
But there was one phenomena seemed similar in these products. Eventhough from top, this group seemed to be responsible for providing answersto the queries, there was only a small set of users responding to lot of thethreads, i.e. answering queries, And lot of other users were involved in an-swering small portion of the queries. Thus with in this group also lie a subsetof users that can be termed as power users and knows a lot about the prod-uct. This gave us a new insight in to community structure and support theyprovide for these product which is further discussed in 5.2.4.
5.2.4 Load distribution
A simple plot of the numbers of responses and responders indicated that dis-tribution of response to responders is seemed to follow a power law [44].Roughly it is estimated that for all the product community member’s responsepattern can follows a power law ,called 80 -20 [45] rule, which laid out in sim-ple terms says 80 percent of the total answers are given by 20 percent of theusers. This might lead to the conclusion that size of the community is onething but there are only some core and power users that keep the communitysupportive and alive and this is same for all the product. To get a better un-derstanding of the phenomena and reach to a conclusion , the data set withresponses and number of responders associated with them was to be quanti-fied by a mathematical model. Additionally a mathematical model will help usto understand the load distribution in the community it self. Finally with the
79

5.2. COMMUNITY STRUCTURE
response to responders distribution we can also have a good understanding ofknowledge distribution and support offered by community.
To quantify it mathematically power law was taken as theorotical model,our assumption of it followed 80-20 rule as known as Pareto Principle [45] canbe examined by plotting a Lorenz curve [46]. For the distribution to followPareto Principle the Pareto index α should be approximately 1.161. This in-dex can be calculated with the help of Lorenz curve and Gini coefficient withequation 5.1.
12α− 1
(5.1)
The Lorenz curve is used in economics to find the wealth distribution andinequality on wealth concentration within individuals in society. It also suitsfor this case as well for finding out the concentration of responses with eachindividuals and ultimately study the dependence of the community supporton these individuals. The Lorenz curve shows the inequality in terms of Ginicoefficient. In Lorenz plot the perfect equality is shown by the diagonal line(0,0) to (1,1) in figure 5.1. In this case perfect equality shows that every com-munity member is equally involved in discussion and answering. Well it is notpossible in real world, however if majority of community member is active theour lorenz curve plot must be near to this equality line, i.e. the area betweencurve and the line which is gini coefficient should be small. Hence higher Ginicoefficient value signifies larger is the inequality and majority of communityis less involved. The perfect inequality is given by y = 0 when x < 100% andy = 100% when x = 100% , simply said all the rest of community memberis passive and only one is active in answering. This will result in perfect ”L”shaped curve. The more curve looks like ”L” the worse is the participation ofcommunity members and greater is inequality. For this case, high inequalityshows that dispersion of knowledge is very little and only few people is ableto answer the majority of queries. This inequality also signifies that commu-nity support offered by this products is dependent on few individual. Thus anattempt was made to categorize which of these product has hight inequalityand by how much.
From the calculated gini coefficient, even if the Pareto index α is not 1.161,we can find the ratio of concentration i.e inequality, It can be calculated withthe following relation 5.2 where H is gini coefficient.
A : B = (1 + H
2) : (
1− H2
) (5.2)
The lorenz curve plot, along with the gini index for the three products isshown in the figures 5.1, 5.2 and 5.3. After the gini coefficient was obtained, itwas apparent that 80-20 rule doesn’t hold true for these products , the Paretoindex α calculated was more than 1.161 which showed that there was evenmore in equality i.e. 90-10 or 95-5. Hence equation 5.2 was use to find the in-equality. Table 5.2.4 summarizes the joint ratio (degree of imbalance) observedin three products with the obtained gini index.
80

5.2. COMMUNITY STRUCTURE
Figure 5.1: Lorenz curve plot for CFEngine
Figure 5.2: Lorenz curve plot for Puppet
81

5.2. COMMUNITY STRUCTURE
Figure 5.3: Lorenz curve plot for Chef
Product Versions Gini Index Joint ratioCFEngine 0.958 98:2Chef 0.90 95:5Puppet 0.96 98:2
This gives a clear description that all the products have high amount of inequality i.e. very imbalanced when it comes community member participatingin discussion and responding to queries. Despite the size of community andpopularity shown by the Puppet ,it’s joint ratio is same as the joint ratio ofCFEngine , i.e. 98% of response is from 2% of people, it shows that communitysize doesn’t have any effect on the support you get from mailing list. And onealways have to depend in these very 2% user to get support. This also showsthat these two percent of users are have much knowledge about the productand are actively sharing it. Chef on the other hand being a new product , showssome what different behavior. Though the joint ratio for it is also severelyimbalanced, it’s some what better than CFEngine and Puppet. It might bebecause it is a new product and more users are novice to it so every body istaking their time to response and take part in discussion. Down the time itmight as well take the path of CFEngine and Puppet as old users acquire moreknowledge and experience with product , so they have all the knowledge andonly they are answering the queries and discussing while other intermediateand novice users just becomes a passive users.
82

5.2. COMMUNITY STRUCTURE
5.2.5 Analysis of Data miner script output
The table 4.4 shows the top 20 frequently occurring bi-grams , top 10 trigramsand , top 10 quad-grams. When the list of bi- grams is inspected , mix of listand topics that are discussed in the mailing list can be observed. Tri gramsgives a clue what topic is about and the looking at the quad gram the problemassociated with the product can be pointed out.
CFEngine
From bi-gram inspection of CFEngine mailing list it can be said that people aremostly posting issues related to package management and editing files. It alsoshows that the users are having trouble finding the quick start guide as well asthere seems to be discussion around CFEngine reference manual and standardlibrary. Possibly these discussion can be made due to user not finding theinformation that he/she is looking for in reference manual or improving theReference manual to make it more understandable. Also CFEngine standardlibrary contains a set of reusable body that can be utilized in CFEngine policyfiles , it appearance in the list can be summed up as people wanted to addmore things on it or not being able to use the functionality within it. Hencelooking at just the bi-gram list an overview of the possible problem we mightencounter can be observed, it is also helpful to have a idea what topics arebeing brought up frequently.
When tri-grams are observed, it shows that people are having problemswith implementation of classes in policy files also making files related policytask. CFEngine also showed problem with selection of value.
With the Quad-gram inspection, the problems that people are facing be-comes quite clear. It can be assured that users are definitely having troublewith package management and they are searching for the easier way of learn-ing the CFEngine, which adds to it’s reputation of being a hard language tolearn. Also we see users are experiencing problems of domains with CFEngine,but this was error associated with CFEngine 2 which was no longer relevant.
Chef
The bi-gram list of chef shows chef specific words like data bags , run list , knifeboot strap etc as frequently stated words in the mailing list. This signifies that alot of problems and discussion are taking place on these topics. EC2 showingup in the link shows chef users are using it with cloud services. Also usersof chef are looking for ready made cook book files. Since cook books are theblueprint of configuration used in Chef, we can understand people are lookingfor different cook book files and usually turning up to the mailing list to findcook book files that fulfills their need. This also shows the cookbooks in hostedchef are difficult to use in users context or doesn’t cover the whole requirementof users. Another interesting topic that showed up was attribute value , theseattribute value are dynamically calculated by ohai plugins and also definableby user through json. It shows users are having problem with implementation
83

5.2. COMMUNITY STRUCTURE
of attribute value.With a closer inspection of to 10 tri-grams list it was found that there seems
lot of talking going on about the implementation of chef on Windows and Red-hat packages. It might be due to chef has recently released windows packageand users are having trouble implementing it, appearance of Centos Redhatpackage signifies either the user cannot find the required package or there issome flaw with in that package of the chef. Another interesting thing observedis that user are having trouble testing the value of attribute.
From the Quad gram analysis, it absolutely clear that users were definitelyhaving trouble in testing the attribute value. It can be assured by the lackof dry mode available in chef to test the configuration rules and also since itis possible to declare attributes at several place like cookbooks, nodes, roles,environment and since attributes are just the key value pair, the values maybe over written. Thus there is an strong used case of testing an attribute valuebut it seems people are finding themselves in trouble trying to test it.
Puppet
The bigram list of puppet showed that discussion are happening in the top-ics like custom facts, osx, secured authorization, best practices etc. From thetopics it seems likes users are struggling to implement custom type, externalnode and more importantly retrieving catalog. Having a look at the list it canbe roughly estimated that users are looking for the way to define custom factsbecause the available facts didn’t cover their whole use case. There are prob-lems related with authorization either due to human error or because of pup-pet itself. Puppet master authorizes the client based in the ssh key exchangebetween client and master, but it is observed that people are having troubleimplementing it. There also seems to be some frequent discussion related tobest practices. People always looks for best practices , to make things modu-larize and reusable when things grow. The topic ”best practice/s” shown inthe list can be understood as it depends on our implementation to make thingsorganized and reusable with Puppet. Lastly a glimpse of puppet master failingto give catalog(configuration specifications) to it’s client is seen but this can befurther confirmed with tri-gram and quad gram analysis.
With tri-gram analysis we can see that there main topics /problems aredominant in puppet mailing list. The problem related with ssh authorization ,problems in retrieving catalogue and users searching for the best practices ofdoing things.
From quad-gram lists it becomes absolutely clear that puppet has manycases where it failed to deliver the catalogue to the clients. Catalogue is the setof configuration list computed by puppet master for a particular client. A cat-alogue cannot be delivered when a server is too busy to respond to the clientor when there is problems in authorization between client and server. It is alsoseen that the problem of authorization occurs due to failure to receive certifi-cates to the from the server. Another major problems face by puppet users , isthe inability to the retrieve the current state of the system and resource. Thisretrieval of current state is to be done in order to find if there is any deviation
84

5.3. RELIABILITY
on the system and resource than the one mentioned in catalogues. Thereforethe quad grams lists shows that puppet suffers from two main draw backs, that can potentially make it unreliable ,one is it fails to retrieve fails fromserver, while another is if even configuration files successfully are retrieved,it might fail during implementation due to error associated with retrieval ofcurrent state of resource.
5.3 Reliability
5.3.1 Distribution Fitting
The figures 4.5, 4.6 and 4.7 all shows that weekly bug frequencies related toeach version follows a pattern that can be represented by Weibull distribu-tion function. Utilizing R’s maximum likelihood estimation(MLE) techniquethe parameters for Weibull distribution was estimated. Since R requires timedomain data, relative frequency of bug reports needs to be converted to occur-rence times of failure. Therefore bug report is mapped to it’s correspondingweekly period. For example 2 bug reports in week 5 and 4 bug reports inweek 6 is now converted to 5,5,6,6,6,6. Thus the input provided to the R forestimation of parameter is cumulative which consists of list of bugs with eachbug converted as week number. A histogram of bugs frequency is plotted foreach version with x axis representing the weekly time and y axis representingthe number of bugs reported in that week. Using the MASS package availablein R , Weibull PDF was fitted in the bug frequencies histogram plot [47]. Theoutput of the curve fitting method will yield scale α and β shape parameterswhich will be used to calculate the reliability of product weekly. Measure thegoodness of fit can be carried out using relative measures. The equation usedto measure the goodness of fit is given by equation 5.3. The index expresses acoefficient of variation of root mean square deviation normalized to it’s meanmeasure of the mean of observed values.
δ =
√(∑n
i=1(yi − yi∗)2)
∑ni=1 yi
(5.3)
The computed scale and shape for each version of the three products alongwith the accuracy level is shown in the table 5.3.1. As discussed in the back-ground theory , the effect of scale parameter is to squeeze or stretch the PDFplot. Greater the value, greater is the stretching, which produces the flattercurve and this implies less rate of failure. The variation level is the match be-tween the fitted curve data and the actual data i.e. bugs density. Less the valueof variation between the observed and fitted value, the accurate the match is.
85

5.3. RELIABILITY
Product Versions scale shape RMSDCFEngine v3.0 43.257 4.278 86.36CFEngine v3.1 73.313 5.333 63.27CFEngine v3.2 103.373 11.120 69
Chef v0.8 45.302 3.677 48Chef v0.9.x 79.669 4.48 56.91Chef v0.10.x 124.157 7.088 50.80
Puppet v0.25.x 60.89 3.49 44.56Puppet v2.6.x 118.670 5.095 65.295Puppet v2.7.x 155.97 4.987 43.272
The figures 5.4 , 5.5 and 5.6 shows the Weibull distribution curve fitted withthe bug frequency for each versions of the three products. The parameterslisted in the table 5.3.1 was used for corresponding versions to get the plots.From the figure , it’s visually clear that puppet has the better fit , much accuratecompared to others, this also is supported by the RMSD value in the table5.3.1. The increase and span of failures are correspondent to shape and scaleparameters respectively. The estimates are favored towards scale to cover largetime span. Thus this pushes down the peak of the fitted graph resulting a lowaccuracy level specially if there is high amount of failures in small interval oftime.
This explains the accuracy obtained for CFEngine for most of it’s versionand it is also observable in figure5.4. For each point(week) in horizontal axis,difference between observed frequencies and expected frequencies from Weibullparameters is high which increases the over all sum of the residuals. Thereforethe calculated ratio of sum of these differences with mean of observed fre-quencies, will result a high coefficient of variation of theoretical frequenciesabout mean of observed frequencies. The amount of error of the distributionfitting is also clearly observable in the graphs. These kind of errors could havebeen made more transparent by obtaining the residual matrix i.e. that con-tains difference between the observed frequencies and expected frequenciesand plotting them against time. If residual matrix was plotted then , it wouldalso have offered a visual clue for the reason of such a large variation in someplots.
Another method will be to calculate accuracy on basis of pattern ratherthan magnitude, is to calculate the correlation between the observed frequen-cies and frequencies obtained. Correlation can explain which versions of bugreported follows the pattern shown by the fitted curve more closely. Therefore,if there is positive correlation then the obtained frequency distribution followsthe theoretical model generated from the parameters using MLE. Nearer thecorrelation coefficient to 1, strong is the correlation between bugs frequenciesobserved and fitted ones.
In this case the important aspect is the pattern of bug report as peak of esti-mates are factor of time span rather than magnitude of failure rates. Thereforeas long as estimates are increasing or decreasing with respect to observed fail-
86

5.3. RELIABILITY
ure rate , the model is able to describe the failure behavior. It’s reasonably clearthat all the fitted frequencies demonstrates the +ve correlation and majority ofmagnitude variation in between observed and fitted ones are same for all theproduct. For demonstration the correlation between fitted and observed bugfrequencies was calculated and it was find to be 0.71 which is a good indica-tion of estimated PDF is good representation of failure behavior. So the dataobtained were considered for calculation of reliability for each versions within the product.
From the figures it’s clear that bugs in all the version of these product fol-lows the Weibull distribution showing increase in bug numbers being reportedon early weeks and stabilizes slowly later on. A similar trend in bug patternfor CFEngine and Chef from fig 4.5 4.6 i.e. minimal overlap on span of time forbugs reported for consecutive versions. In puppet there is a significant portionof time span overlapped between two versions. Hence since the bug in eachversion is spread over some span of time and there is no sudden spike in thebug numbers reported in each week , we have a better fit of model for puppetversion compared to CFEngine and Chef.
5.3.2 Reliability growth
Since there are two aspects to look into the plots i.e. numbers of failures whichis frequencies of bugs(shape) and the span of failures (scale), i.e. the time spanwhere the bugs reports about the particular version continue to show up. Esti-mation favors the scale to favor long span of time because it is natural for bugsto show up for some period , but if it shows up for a long period of time theit is surely unreliable product. The Weibull’s parameters value calculated foreach version was used to calculate the reliability of each version of the productutilizing function 3.1. Figure 5.4d,5.5d and 5.6d shows the reliability graphsfor each products with various versions. Since the time range considered foreach product is different, comparison of reliability of versions was carried outwithin the product only. As expected the new versions offers more reliabilityin all the products. In case of reliability CFEngine shows to be a better productthat offers more reliability on each new version shown in 5.4d, while Puppetseems to have a small amount of reliability increased between it’s last two ver-sions i.e. 2.7 and 2.6 as seen in fig 5.6d and quantified in table 5.3.2. The table5.3.2 shows number of weeks up to which each version shows at least 90% reli-ability and reliability growth that was calculated by taking this 90% reliabilityas standard value between the versions. The reliability growth between theversion is calculated by subtracting the last week with 90% reliability for oldversion from the last week with 90% reliability for current version and wholedifference is then divided by the total range taken into account. For instancethe growth for CFEngine v3.2 was calculated by [(31-20)/115] *100%, where 31is the number of weeks for which the current version of product offered 90%reliability, similarly 20 is also the numbers of weeks for which the old versionof product offered 90% reliability and 115 being total weeks taken in accountfor bug tracker of CFEngine. The total weeks for Chef and Puppet were 150weeks and 200 weeks respectively.
87

5.3. RELIABILITY
(a) version 3.0.x (b) version 3.1.x
(c) version 3.2.x (d) Reliability growth
Figure 5.4: Weibull curve fitting for CFEngine versions (a), (b) and (c) and it’sreliability growth (d)
88

5.3. RELIABILITY
(a) version 0.8.x (b) version 0.9.x
(c) version 0.10.x (d) Reliability growth
Figure 5.5: Weibull curve fitting for Chef versions (a), (b) and (c) and it’s relia-bility growth (d)
89

5.3. RELIABILITY
(a) version 0.25.x (b) version 2.6.x
(c) version 2.7.x (d) Reliability growth
Figure 5.6: Weibull curve fitting for Puppet versions (a), (b) and (c) and it’sreliability growth (d)
90

5.4. USER EXPERIENCE
Product VersionsLast week withat least 90% reli-ability
growth %
CFEngine v3.0 25 -CFEngine v3.1 48 20%CFEngine v3.2 84 31 %
Chef v0.8 24 -Chef v0.9.x 48 16 %Chef v0.10.x 90 28 %
Puppet v0.25.x 32 -Puppet v2.6.x 76 22%Puppet v2.7.x 99 11 %
This less increase in reliability between two version of puppet can be wellexplained by observing the fig4.7 as the bugs for these two version continueto arrive for a long span of time , and the time span for those two versionare also almost overlapped. While for Chef and CFEngine large portion ofbug reports are posted in short interval of time and as time goes on and whennew version comes out the chances get even slimmer. Both CFEngine and Chefdemonstrate identical and strong reliability increase in it’s consecutive versionbut , the last version i.e. 3.3.x of CFEngine shows more growth in reliabilitycompared to the lasy version of Chef i.e. 0.10.x which is shown in table 5.3.2.It’s also well represented by the figures 5.4c and 5.5c, as the bugs for the chef’slast version are spread over a large span of time in time range and the bugfrequency in each week is not that high as well, so it has also a better fit index50.80 compared to 69.80 of CFEngine. For CFEngine ,the bugs frequency arevery high each week and spread over a small interval of time which resulted asmall scale parameter value and thus resulted high reliability.
5.4 User experience
The raw data obtained after the test is to be processed further i.e. transforma-tion to get a suitable data in order for it to be analyzed. Various mathematicalmodel comes handy in analyzing these set of data , but since test sample issmall caution need to be taken on application as the application of wrong the-oretical model will give wrong projection of actual use case associated withthese products.
Completion rate with usability problems
The task data obtained from result section is broken down into appropriateformat i.e. if there was task times for 3 users then 3 out of 5 completed the test.Normally with small sample sizes it would be wrong to say that a product is100% usable when all users completes the task and 0% usable when all users
91

5.4. USER EXPERIENCE
fail the test. This kind of result is often obtained in test with small samplesizes and reporting 100% and 0% doesn’t portray true picture, instead it ishelpful to be analyzed as how likely the true population parameter shows thevalue as extreme as this. Hence a point estimation method is required in orderto make a estimate of the unknown population parameter value. ThereforeLaplace method [48] is used as best point estimation which is suitable for smallsamples.
When ever 5 users out of 5 successfully completes the task, normally it istermed as 100% instead Laplace Law of Succession adds one to the numeratorand two to the denominator ((x+1)/(n+2)) thus 6/7 is obtained which is 85%completion rate. This is far less than 100% but near to it. The interesting as-pect of this method is that results come more closer to hundred percent whensample size increases. The height of bars in chart shown in figure 5.7 showsthe point estimated by using Laplace method on the individual task data.
Though the point estimation method provides the value that will give anestimation of population parameter, the chances that the estimated value issame as the unknown population’s true completion rate is extremely unlikely.Hence confidence interval also need to be computed so that it will give a rea-sonable boundary for a true population completion rate. For example if 1 outof 5 users completes the task , then the 95% confidence interval is 2%-64 %.Though the interval is large which is again due to sample size the importantinformation that is obtained is that it is highly unlikely the task has a comple-tion rate of 70%. There fore confidence interval is highly informative and isextremely necessary incase of small sample size leading to the extreme resultslike 0% and 100% as completion rate for the tasks conducted.
For computing confidence interval , adjusted Wald interval is utilized as itprovides the best coverage for specified interval when sample size is less than150. In other words if 95% confidence interval is desired then it will yield aninterval that will contain observed proportion on average about 95 % of times[49]. To obtain an interval using this method, small adjustment is to be madein the result. For example for obtaining 95% confidence interval on 3 out of 5i.e. 3/5 users completing the test successfully , add half of the squared z-valueto numerator and squared z value to the denominator such that (3+1.962/2)
5+1.962 re-sulting approximately 5/9. Now the confidence interval is calculated usingwald’s interval on these computed values. The bar chart 5.7 shows the confi-dence interval obtained in this way on every bars. These confidence intervalgives important information and idea about where the true completion rate forthese tasks associated with the products might fall. Large set of usability stud-ies found that average task completion is 78% which can be used as referencepoint to compare the results.
From the figure 5.7 shows CFEngine have the highest completion rates forall the three task but only completion rate for task 1 using CFEngine is aboveaverage. Due to three users having moderate knowledge about CFEngine, thecompletion rate results might have favored CFEngine. Since there is significantamount of overlap in confidence interval in completion rate on same task usingthese products, a conclusive result cannot be drawn rather a relative projection
92

5.4. USER EXPERIENCE
Figure 5.7: Completion rate for CFEngine, Chef and Puppet
93

5.4. USER EXPERIENCE
can be made looking at the upper and lower limits of interval. Therefore, theupper limit of 95% confidence interval for all the task shows that all theseproducts having a value greater or equal to the average task completion. Thismeans that if examined in true population, there is possibility that all of theproducts can achieve average completion rate. Additionally the low value oflower limit of confidence interval shows that puppet really has less number ofcompletion rate for task 1, while chef has less completion rate for task 2 andboth chef and puppet have similar completion rate for task 3.
Considering lower limit of 95% confidence interval along with the best es-timate for CFEngine, shows CFEngine having satisfactory completion rate fortask 1 i.e. installation of CFEngine has completion rate that can go as low as60% which is close to average completion rate and task completion can go upto 100%. Chef also have good completion rate regarding task one but if lowerconfidence interval is observed this task can have really low completion rateas low as 22% which doesn’t seem satisfactory. Among the three puppet hasworst completion rate for task1 which can be well explained by the table 4.7.Since majority of the test user struggled setting up Puppet server to connectwith client due to certification issue triggered by DNS they were unable tocomplete the task. Puppet’s upper limit of 95% CI shows 77% indicating it ishighly improbable to get it’s completion rate above the average rate. If puppetis to get this rate up in the levels of CFEngine and Chef it needs to work in thecertificates issues faced by majority of users while setting up puppet.
For task 2 users had problem regarding understanding the documentationin Chef and CFEngine. The high task completion rate for CFEngine is largelydue to majority of users previously having knowledge about CFEngine. Buta new user getting the task completed with CFEngine signifies this task thatcould be conducted by looking into examples with CFEngine. Only users hav-ing problems understanding the architecture couldn’t complete the problem.Thus is also well explained by bar chart with it’s confidence interval between97-35, hence it is possible to get a good task completion rate of 97% for this taskusing CFEngine, at the same time it can also get worst for inexperienced users.For puppet due to lot of users facing certificate issues in 1st task seems to haveimpact. 2 out of 5 users gave up on this task using Puppet. For chef despite theusers being able to make chef working, too many terminologies involved in itseems to prevent the users from getting the task completed and finally gave upon the task. User stated problems like time consuming and confusing processseems to play the part for chef to obtain the lowest completion rate comparedto others. For this task it is Chef for whom the completion rate is extremelyunlikely to surpass average completion rate.
The same story being continued with puppet and chef, users giving up thetask 3 due to problem in understanding the technology and lack of helpfuldocumentation to complete task. Is also shows users giving up task 3 usingCFEngine due to the same problem as with chef and puppet. Still the com-pletion rate is higher and there is possibility for the completion rate to exceedaverage completion rate for CFEngine while for puppet and chef they havesame completion rate and confidence interval. This task required users to bea moderate users with deep knowledge about task, and no helping material
94

5.4. USER EXPERIENCE
found in internet so it was expected to have low completion rate for all theproducts.
This shows that all the products definitely need some learning in order togo forward with the technology, while CFEngine having less components lessthings to configure , majority of users quickly get the task done but differ-ent users faced different problem with CFEngine, while for chef due to largenumber of components and many configuration some users failed the task andFinally for puppet the most of the users face the same problem and failed toover come the problem, finally end up giving up consecutive task.
5.4.1 Task time and Perceived Easiness
To get an overview of task easiness, users were asked to answer single easequestion after every task. The scale points obtained from 5 users is shown inthe results section 4.6. These data can to be transformed into percentage scaleand calculate a mean out of them for each particular task to get a measureof users perceived easiness and satisfaction regarding the task. For exampleif a user gives a score of 5 , the person had build all his exception and expe-rience abut the task in this score. Thus obtained score need to be averagedfrom all the users to get a single value describing the task easiness. Thoughthis single value is easy to explain , it might not always reflect the true value, hence Confidence interval can be calculated in order to make a reasonablerange that describes the task easiness and statically contains the true value fortask easiness for product. Since small sample was used i.e. Less than 30, Forthis case estimation of confidence interval to contain real value for a unknownpopulation will be calculated utilizing the T-distribution. The table shows themean task easiness and confidence interval computed for each task for threeproducts.
Had the sample size been larger we could have standardized the raw scoresinto z score and corresponding percentiles could have been calculated. Thatwould have made the result much easier to understand but since the samplesize was far less than 30 we could not utilize normal statistical method to geta conclusive results about the perceived easiness
Tasks CFEngine Chef PuppetTask 1 5.2( 3.58,6.81 ) 2.2( -0.02 ,4.42 ) 3(0.36,5.63 )Task 2 5(1.95 ,8.04) 3.4( -0.17,6.97 ) 4(0.59,7.40)Task 3 2.4(0.73,4.06) 2.4( -0.83 ,5.63 ) 2.6(-0.25, 5.45 )
Unfortunately the calculated of mean and confidence interval also isn’tthat much helpful in interpreting the scores collected by from the participants.The basic problem with mean was scores had a high variance, and the meancould not summarize the scores. Additionally since the confidence intervalsizes were also very large ranging from lower limit of the score to even in -veterritory to upper limit, it is difficult to interpret the results. The large sizeof confidence interval is due to small sample size and high variance of scoresgiven by the users. Had the sample size been larger, even though the scores
95

5.4. USER EXPERIENCE
Figure 5.8: Scores for easiness level for each products
have high variance, frequency of each scores could have been examined to seethe easiness level of each task.
So to present data in perceivable way , figure 5.8 shows bar chart that al-lows to see the comparison of task easiness between these products. The figureis even easier to comprehend when the statistics about task time is consideredand try to understand the why was the score given by the user. More impor-tantly it could lead to interpretation of what scores level represents and whichscores levels are used in relation to the task time. The table 5.4.1 shows the cor-relation between task time and scores given by each user for the the task theyperformed. It also shows the geometric average of the task times required byeach users for performing the task using CFEngine, Chef and Puppet.
TasksCorrelation(tasktime and scores)
CFEngine Chef Puppet
Task1 -0.373 17.66 37.39 32.76Task 2 -0.178 14.84 16.28 22.83Task 3 -0.72 37.45 16.94 16.73
The correlation between the scores and the task times shows mixed resultsfor the tasks. While users seemed to have strong opinion about the task3 and
96

5.4. USER EXPERIENCE
task1, their perceived satisfaction seemed to vary in task2. It is obvious tohave a negative correlation between the task time and task score as if the taskis completed quickly it is easier and hence will obtain a high score. But in task2 , even with an low amount of average task time the task scores is not able toshow users perceived satisfaction in correlation. As seen in figure 5.8, almostevery users have assigned a scores, some users get the task completed in smallamount of time leading to high amount of perceived satisfaction , while othersare spending a large chunk of time to get the task completed. But the userstaking large amount of time doesn’t seem to be turned off by product as theyare getting the task implemented, hence they also assigned a satisfactory scoreto the problem which seems to deter the correlation between task time andtask score. In conclusion users point of view about the task was, it is do ablewith a satisfactory level of satisfaction in all products.
For task1 it shows an moderate negative correlation , which points out thatusers scores reflects their experience. Since this was just installation , usersexpect this task to be done by simply following the documentation. But whenusers take a lot of time and encounter problems while doing simple installa-tion , it had impact on users perceived satisfaction. As seen in the figure 5.8, for task 1 every users have reported their scores and CFEngine seems to dowell in obtaining high scores. This is supported by the average task time re-sult as well. The task time needed for CFEngine is almost half the time needfor Chef and Puppet. So with this time about 17 mins , users seems to assign alevel 5-6 scores in easiness scale. Therefore it can be understood that if a user isable to make a server and client connected in about 15 minutes then it resultsin high level of satisfaction. While for Chef the scores is around 3-5 and thetask time around 38 minutes. Therefore in this case, the scores 3-5 represent asatisfactory level. And for Puppet the score is around 1 and only two users be-ing able to complete the task, though the task time was just 32mins. Thereforefor this task even though the task is do able in under a satisfactory level, lot ofusers fails in task propelling puppet is into unsatisfactory level.
Task3 shows a strong correlation between task time and task scores. Thusthe scores for it reflect true picture about user experience compared to priortwo tasks. The average task time for CFEngine is 38 mins and it’s task scoresis at level 3 and below. Hence user has perceived this task with high difficultylevel compared to prior task performed by CFEngine. Also some users failingto report the scores in figure 5.8 signify that they gave up the task or did nottried it at all. This is also the strong indication of low satisfaction. Even withthe users with CFEngine experience rating the task in level 3 and requiring alot of time to complete the task is another symptom of low level of perceivedsatisfaction. For Chef, the average task time is low and a lot of users failing tocomplete the task coupled with task score ranging 1-7 signify that chef offersa high satisfaction if users knows the product and can get the task completed.But Majority of users giving low scores signifies that is hard to get the taskcompleted with chef reducing satisfaction level. Similar is the case with pup-pet, with majority of users failing to get the task implemented and some usersgiving high scores coupled with small average task time hints the same thing.Puppet offers high amount of task satisfaction if users gets the task done or
97

5.4. USER EXPERIENCE
know it.
5.4.2 Over all product usability
The calculation of raw scores into SUS scores had yielded a single number rep-resenting a composite measure of overall usability as perceived by the users.The individual scores for the product by the users is shown on table 4.8 whichneeds to be averaged together in order to get a average SUS score for the prod-uct. Since sample was small and the SUS scores are obtained have a very highvariability i.e. from low to high , if a mean is calculated then it will get skewedtowards higher value. Hence as pointed out by background study, for smallsample sets geometric mean gives a most reasonable middle point for a set ofdata. Should the sample size grow larger and data obtained is more uniformthe obtained mean,median and a geometric mean will be similar. Therefore itis much suitable for getting single SUS score for a product from a set of SUSscores obtained from users. Thus calculated averaged SUS scores for productis shown in below
Products SUS scoresCFEngine 57.77
Chef 19.41Puppet 42.74
Now utilizing the figure 2.6 corresponding percentile and grades for theproduct usability could be obtained. CFEngine have percentile score of about23 which has a grade score of D. Thus CFEngine only has a perceived usabilitythat is higher than 23% of the products. Though the SUS score 57 is near to av-erage usability score 68 having 51 percentile , it is far less in it’s percentile rankson it’s usability. The grade D is explainable for CFEngine, as when it comes todo a complex task it might involved a large amount of resource consumptioni.e. (time and mental effort) to get the task done which too is demonstrated bytask 3. Both Puppet and Chef obtains a grade F in terms of their perceived us-ability with Chef having the least SUS scores. The low score obtained for Chefis might be because of the various technologies and terminologies used in chef,and chef having multiple components to be configured to get working. Major-ity of users were not able to complete all the task using chef which is also aadd to this low usability score. Puppet’s score is close to a CFEngine but usersstill fill less satisfied with it , it might be because of users facing problem earlyon task 1 and majority of them not being able to solve the issue despite theirbest effort, after they get around the problems the tasks became are easier.
If conversion rate is calculated ,it is observed that 3 out of 5 users havecarried out all task using CFEngine and 2 out of 5 users have completed alltask using Chef , and 1 out of 5 users have completed all task using Puppet.Even with high amount of conversion rate of Chef compared to Puppet , it haslow SUS score , signifies that it is much more complex system to work withcompared to CFEngine and Puppet. Additionally even though the users intest have some experience with CFEngine it did not seem to do to well i.e. it is
98

5.4. USER EXPERIENCE
not meeting the average usability hints that it is also difficult system to workwith. For puppet it’s usability is unstable , people that can make it works arehappier but others will have a frustrating time working with product. In ourtest case , majority users seem to have a frustrating time with puppet whichended up in giving up task with puppet.
99

Chapter 6
Conclusion and Future work
The investigation of unexplored aspects of configuration management systemslike CFEngine, Chef and Puppet was quite interesting and informatory. Theaim of this thesis was to find out if any one of the three tools stands out whenit comes to measure complex characteristics like community, usability e.t.c.Up until now the prospective users of CM tool have to rely on word-of-mouthand buzz to create an image of what they think is a better product on theseaspects i.e community , usability e.t.c. But this study hopes to shed light inthose aspects and ultimately answer their curiosity. The focus was given oncollection of whatever data found on web regarding these product and to getas much information undergoing in-depth analysis, finally to obtain a measur-able quantity that can sum up findings with the use of theoretical models.
Community has often been linked as measureless quantity and impossible toapprehend. People associate community in terms of numbers of users in-volved with product’s development, usage, discussions and reviews. Thereare different field of study like support ,development , popularity , usage, col-laboration etc. that falls into community which makes it difficult to apprehend.Explaining community as a single entity is almost impossible. Thus differentaspects within the community needs to be explored separately. In this paperalmost every aspect of the community except development is explored to geta conclusive result. Popularity was investigated by usage of google trendswhich showed that currently all of the three (CFEngine, Chef and Puppet) areequally popular despite these products having different maturity level how-ever Chef shows high rate of popularity growth in short interval of time.
The firm understanding of amount of resources (discussion and articles)that can be found for a product is both helpful for learning as well as problemdiscovery and problem solving. Hence the popular information social discus-sion platform named ”haker news” was analyzed to get overview of resourcesthat might be available to users. The results showed Puppet has large the num-bers of articles and people talking about the product, followed by Chef andCFEngine. One thing to notice was despite Chef being much younger, therewere large number of discussions happening around it close to that of Puppet,
100

while the results also showed that any search result obtained when looking for”CFEngine” word doesn’t contain any inappropriate articles or discussions.
The categorization of community members was carried out by inspectionof mailing list messages. Mailing list captures the interaction of communitymembers that makes it an ideal source to investigate the community struc-ture and understand the support provided by it’s members. It was found thatnearly every product have a similar proportion of individuals categorized asseekers, providers and both. This signified that they all have similar com-munity structure despite the difference in community size. The activities likequestion posting , answering to question etc. of individuals under these groupwere also similar. Another interesting finding was for all the products, themembers in mailing list were not equally participative in answering queries.Therefore, support activity provided by the community exhibited exponen-tial behavior where large number of individuals were answering small pro-portion of questions and small proportion of individuals responding to largenumber of threads which was quantified by Lorenz curve of inequality. Thuscalculated inequality metric called gini index was not significantly differentfor these product. This demonstrates that support obtained from communitydoesn’t depend on community size, at least not in mailing list, but communitysize has strong influence on resources available for the product.
Failure to execute an assigned task decreases reliability of configuration tool.Bugs are the primary source of failure and bug reports provide better percep-tion of failure distribution that helps to figure out the reliability of a software.In this thesis, data from bug repositories for CFEngine , Chef and Puppet wascollected and Weibull distribution was fitted on observed weekly bug frequen-cies. It was observed that even though the goodness of fit was not satisfactory,the model was able to explain the arrival pattern of bug reports. There wassignificant overlap between the bug reports of two different versions for pup-pet , while CFEngine and Chef showed least overlap between these versions.The later versions for all the observed products showed increase in reliability.Latest version of CFEngine showed high amount of reliability gain followedby Chef and then Puppet. Over all the amount of reliability increase betweensubsequent versions on all these product did not show much difference.
User experience with software defines the usability. Hence in this study us-ability was investigated by capturing objective and subjective aspect of theuser experience with software. An usability test was conducted with smallsample of users. Statistics about task time , completion rate and users opinionabout task and product as a whole was gathered. Due to small sample size theresult could not give a conclusive answer on product offering best usability,however the experiment was successful in identifying the common problemsassociated with each product and over all user’s perception about these prod-ucts. Users faced same problem with puppet, but with Chef and CFEnginedifferent users faced different problems. It was also discovered that not a sin-gle product was able to provide consistent and stable user experience across
101

all the users through out all the task. There was large variation of users opin-ion on each task level but on product level there was no significant differencein users opinion. Each product has some learning curve and posses difficultyin one form or another. In summary all of the observed product had perceivedsatisfaction below average. When it comes to usability none of them is excep-tionally good compared to each other.
Because of the time invested in collection and analysis of information on widerange of aspects, some of the sources and work that could provide interestinginsights into each aspect could not be covered. Therefore a possible future re-search would be to determine the resources available and understand the sup-port as well as product popularity , commonly known question answer plat-form like ”stack overflow” and popular public repository site like ”GitHub”could be investigated. Another prospective future work would be to considerdeveloper mailing list also as a bug source and conduct the combined study offeature growth with reliability growth.
The usability test could be conducted with large number of participants, mostimportantly more than 30 to investigate further in the frontiers of usability.Conducting the test with larger sample increases the precision of estimatesresulting narrow confidence interval from which conclusive results can be ex-tracted related to task completion rate and task satisfaction, which possiblycan help to identify the product that offers best usability.
This kind of research can lead towards well established methods for investi-gating community, reliability and usability of a software, layout the platformsfor making comparison of these attributes within different softwares and alsoto be used across different software disciplines.
102

Bibliography
[1] Cory Lueninghoener. Getting started with configuration management.USENIX, 2011.
[2] Aleksey Tsalolikhin. Configuration management summit. Technical re-port, Vertical Sysadmin, 2010.
[3] Sebastian Carlier Niek Timmers. Automating configuration cfengine vspuppet. 2010.
[4] Jarle Bjorgeengen. Puppet andcfengine compared: time and resource con-sumption. 2010.
[5] W . Joosen T . Delaet and B . Vanbrabant. A survey of system congurationtools. 2010.
[6] Roberto Galoppini. How to evaluate open source software / free software(oss/fs) programs. Technical report, 2010.
[7] David A. Wheeler. How to evaluate open source software / free software(oss/fs) programs. Technical report, 2011.
[8] Open source software assessment methodologies.
[9] Method for qualification and selection of open source software (qsos) ver-sion 1.6. Technical report, Atos Origin, 2006.
[10] Business readiness rating for open source. Technical report, brr.org, 2005.
[11] Qualoss,. Technical report, 2008.
[12] Simon Alexandre Jean-Christophe Deprez. Comparing assessmentmethodologies for free/opensource software: Openbrr and qsos1.
[13] Stephen O’Grady. Community metrics: Comparing chef and puppet.Technical report, RedMonk, 2012.
[14] Jarle Bjorgeengen. Feature comparison puppet, redhat satellite server andcfengine. 2009.
[15] Akita. Chatting with adam jacob. Technical report, Codeminer 42, 2010.
[16] Azad Azadmanesh Cobra Rahmani, Harvey Siy. An experimental analy-sis of open source software reliability*.
103

BIBLIOGRAPHY
[17] Alesky. Getting started with cfengine. 2011.
[18] CFEngine Refrence Manual.
[19] J. Crowston, K. & Howison. The social structure of free and open sourcesoftware development,. , 2005.
[20] Eric von Hippel Karim R. Lakhani. How open source software works:free user-to-user assistance. Technical report, MIT Sloan School of Man-agement,, 2002.
[21] J.D. Musa and K. Okumoto. A logarithmic poisson execution time modelfor software reliability measurement. In .
[22] Azad Azadmanesh Cobra Rahmani, Harvey Siy. An experimental anal-ysis of open source software reliability. Technical report, University ofNebraska-Omaha, 2009.
[23] Software reliability research. Stattitical Computer Performance Evaluation,Academic Press, Inc., New York, 1972.
[24] B. Littlewood and J.L. Verrall. A bayesian reliability model with a stochas-tically monotone failure rate. IEEE Transactions on Reliability, 1974.
[25] A.L. Goel and K. Okumoto. A time-dependent error-detection rate modelfor software reliability and other performance measure. IEEE Transactionson Reliability, 1979.
[26] Dennis J. Wilkins. The bathtub curve and product failure behavior.
[27] Jiantao Pan. Software reliability.
[28] Joseph DAVIS Ying ZHOU. Open source software reliability model: anempirical approach.
[29] Nigel Bevan. Measuring usability as quality of use. Technical report, NPLUsability Services, National Physical Laboratory, 1995.
[30] JEFF SAURO. Measuring usability. Technical report, Measuring UsabilityLLC, 2004.
[31] JEFF SAURO. Deriving a problem discovery sample size. Technical re-port, RedMonk, 2012.
[32] Joseph S. Dumas Jeff Sauro. Comparison of three one-question, post-taskusability questionnaires. Technical report, Oracle Corporation,, .
[33] John Brooke. Sus - a quick and dirty usability scale. Technical report,Redhatch Consulting Ltd., 1986.
[34] J.R. Lewis and J. Sauro. The factor structure of the system usability scale.In .
104

BIBLIOGRAPHY
[35] Kortum Philip T. Bangor, Aaron and James T. Miller. An empirical evalu-ation of the system usability scale. nternational Journal of Human-ComputerInteraction, 2008.
[36] Bryan Berry. Puppet vs. chef, fight! 2011.
[37] Klint finley. Puppet vs. chef: Which is more popular. 2011.
[38] Andrs. Analysis on free software communities (i): a quantitative studyon grass, gvsig and qgis. 2011.
[39] Robert A. Muenchen. The popularity of data analysis software. 2011.
[40] Mario Garzia Ben Errez Pankaj Jalote, Brendan Murphy. Measuring reli-ability of software products.
[41] Practical Reliability Analysis. Prentice Hall, 2004.
[42] Sampling distributions.
[43] Hypothesis test for a proportion.
[44] M. E. J. Newman. Power laws, pareto distributions and zipfs law. Tech-nical report, Department of Physics and Center for the Study of ComplexSystems, University of Michigan, Ann Arbor, MI 48109. U.S.A., 2006.
[45] Avinash Narula. What is 80/20 rule?
[46] M. O. Lorenz. Methods of measuring the concentration of wealth. Publi-cations of the American Statistical Association, .
[47] Vito Ricci. Fitting distributions with r. 2005.
[48] James R. Lewis Jeff Sauro. When 100estimates of completion rates. Journalof usability study, 2006.
[49] James R. Lewis Jeff Sauro. Estimating completion rates from smallsamples using binomial confidence intervals: Comparisons and recom-mendations. In PROCEEDINGS of the HUMAN FACTORS AND ER-GONOMICS SOCIETY 49th ANNUAL MEETING2005.
105

Appendix A
HTML Parser and Crawler
A.1 For Puppet’s Mailing List
#!/usr/bin/perl
# Needed packages
use Getopt::Std;
use Date::Parse;
use Scrappy;
use DBI;
use strict "vars";
# Global variables
my $VERBOSE = 0;
my $DEBUG = 0;
# DataBase Connection
my $db="puppetMLS";
my $host="localhost";
my $user="username";
my $password="password"; # the root password
# handle flags and arguments
# Example : c = "-c", c: = "-c argument"
my $opt_string = ’vdh’;
getopts("$opt_string",\my %opt) or usage()and exit 1;
# Print help message in -h is invoked
if($opt{’h’}){
usage();
exit 0;
}
# Handle other user input
106

A.1. FOR PUPPET’S MAILING LIST
$VERBOSE = 1 if $opt{’v’};
$DEBUG = 1 if $opt{’d’};
verbose("Verbose is enabled\n");
debug("Debug is enabled\n");
###### Main script content
#
# my $file=$opt{’f:’};
my $base_url="http://markmail.org";
my $url="http://markmail.org/browse/com.googlegroups.puppet-users";
my @visitedUrls;
# Open Connection to databse
my $scrapper = Scrappy->new;
if($scrapper->get($url)->page_loaded){
my $yearmth = $scrapper->select(’table table tr a’)->data;
my $values = $scrapper->select(’table table tr td:nth-child(2)’)->data;
##################################
# Saving the message activity in file
#################################
open (OUT , ">puppetdata.csv") or die "Cannot open the file for writing";
my $i=0;
foreach my $value (@{$values}){
my $date = format_date($yearmth->[$i]->{text});
print OUT $date.",".$value->{text} ."\n";
# print $scrapper->dumper($date);
$i++;
}
close(OUT);
################################
# Load the previously traversed links
################################
my $dbh = DBI->connect ("DBI:mysql:database=$db:host=$host",$user,$password) or die "Can’t connect to database: $DBI::errstr\n";
my $sth = $dbh->prepare("select url from messages");
$sth->execute();
while (my @row = $sth->fetchrow_array()){
push(@visitedUrls,@row);
}
$dbh->disconnect or warn "Disconnection error: $DBI::errstr\n";
##################################
# Get the links and start visiting
107

A.1. FOR PUPPET’S MAILING LIST
##################################
debug("Visting the links in first page");
my $ymScrapper=Scrappy->new;
my $linkCount=0;
foreach my $link(@{$yearmth}){
# last if($linkCount>0);
my $suburl= $link->{href};
visitArchiveYearMonth($suburl);
$linkCount++;
}
}
#
#########
sub visitArchiveYearMonth{
my $ymScrapper = Scrappy->new();
my @matched = grep(/^$_[0]$/,@visitedUrls);
my $matchedno = @matched;
# print $matchedno."\n";
if($matchedno == 0){
push(@visitedUrls,$_[0]);
if($ymScrapper->get($_[0])->page_loaded){
debug("Loaded Year Month :". $_[0]);
my $threads=$ymScrapper->select(’#browse table tr a’)->data;
my $count=1;
foreach my $thread(@{$threads}){
collectThreadMessages($thread->{href},$thread->{text});
}
}
my @urlparts =split(’/’,$_[0]);
my $size=@urlparts;
if($size < 7){
my $pages=$ymScrapper->select(’#browse h4 a’)->data;
foreach my $page(@{$pages}){
# print $page->{text}."\n";
visitArchiveYearMonth($page->{href});
}
}
}
}
sub collectThreadMessages{
my $threadCrawler = Scrappy->new();
108

A.1. FOR PUPPET’S MAILING LIST
my @matched = grep(/^$_[0]$/,@visitedUrls);
my $matchedno = @matched;
if($matchedno == 0){
if($threadCrawler->get($_[0])->page_loaded){
debug("Loaded thread :".$_[0]);
my $count=0;
my $messages=$threadCrawler->select(’#thread table tr a’)->data;
foreach my $message(@{$messages}){
# last if($count > 1);
CollectMessageDetails($message->{href},$_[1]);
$count++;
}
}
}
}
sub CollectMessageDetails{
my $messageScrapper = Scrappy->new();
my $dbh = DBI->connect ("DBI:mysql:database=$db:host=$host",$user,$password) or die "Can’t connect to database: $DBI::errstr\n";
# $dbh->trace(2);
my @matched = grep(/^$_[0]$/,@visitedUrls);
my $matchedno = @matched;
print $matchedno."\n";
if($matchedno == 0){
push(@visitedUrls,$_[0]);
my $sth = $dbh->prepare("INSERT INTO messages(subject,sender,send_date,message,thread,url) VALUES (?,?,?,?,?,?)");
if($messageScrapper->get($_[0])->page_loaded){
debug("Loaded message: ".$_[0]."\n");
my $subject = $messageScrapper->select(’#headers tr’)->focus(0)->select(’td:nth-child(2)’)->data->[0]->{text};
my $from = $messageScrapper->select(’#headers tr’)->focus(1)->select(’td:nth-child(2)’)->data->[0]->{text};
my $date = $messageScrapper->select(’#headers tr’)->focus(2)->select(’td:nth-child(2)’)->data->[0]->{text};
my $lines = $messageScrapper->select(’#body div.pws > p’)->data;
my $message="";
my $formatted_date = format_date_for_mysql($date);
foreach my $line(@{$lines}){
$message.=$line->{text};
}
$sth->execute($subject,$from, $formatted_date, $message,$_[1], $_[0]);
}
}
$dbh->disconnect or warn "Disconnection error: $DBI::errstr\n";
}
109

A.2. FOR CHEF’S MAILING LIST
sub format_date{
my %mon2num = qw(
jan 1 feb 2 mar 3 apr 4 may 5 jun 6
jul 7 aug 8 sep 9 oct 10 nov 11 dec 12
);
my @datesupplied = split(’ ’,$_[0]);
my $month = $mon2num{lc substr($datesupplied[1],0,3)};
return $datesupplied[0].’/’.$month;
}
sub format_date_for_mysql{
my @date=strptime($_[0]);
my $year=$date[5]+1900;
my $month=$date[4]+1;
my $day=$date[3];
my $hh=$date[2];
my $mm=$date[1];
my $ss=$date[0];
return "$year-$month-$day $hh:$mm:$ss";
}
sub usage{
# prints the correct use of this script
print "Usage:\n";
print "-h Usage \n";
print "-v Verbose\n";
print "-d Debug\n";
print "./script [-d][-v][-h]\n";
}
sub verbose{
print "VERBOSE:".$_[0]."\n" if $VERBOSE;
}
sub debug{
print "DEBUG:".$_[0]."\n" if $DEBUG;
}
A.2 For Chef’s Mailing List
#!/usr/bin/perl
# Needed packages
use Getopt::Std;
110

A.2. FOR CHEF’S MAILING LIST
use Date::Parse;
use Try::Tiny;
use Scrappy;
use DBI;
use POSIX;
use strict "vars";
# Global variables
my $VERBOSE = 0;
my $DEBUG = 0;
# DataBase Connection
my $db="chefMLS";
my $host="username";
my $user="password";
my $password="letmein"; # the root password
# handle flags and arguments
# Example : c = "-c", c: = "-c argument"
my $opt_string = ’vdh’;
getopts("$opt_string",\my %opt) or usage()and exit 1;
# Print help message in -h is invoked
if($opt{’h’}){
usage();
exit 0;
}
# Handle other user input
$VERBOSE = 1 if $opt{’v’};
$DEBUG = 1 if $opt{’d’};
verbose("Verbose is enabled\n");
debug("Debug is enabled\n");
###### Main script content
#
# my $file=$opt{’f:’};
my $base_url="http://markmail.org";
my $url="http://lists.opscode.com/sympa/arc/chef";
my @visitedUrls;
my @yearMths;
my %YMmessages;
# Open Connection to databse
my $scrapper = Scrappy->new;
111

A.2. FOR CHEF’S MAILING LIST
if($scrapper->get($url)->page_loaded){
my $yearmth = $scrapper->select(’#ArcCalendar a’)->data;
# my $values = $scrapper->select(’table table tr td:nth-child(2)’)->data;
##################################
# Saving the message activity in file
#################################
open (OUT , ">chefMLS.csv") or die "Cannot open the file for writing";
my $i=0;
foreach my $link (@{$yearmth}){
my @linkparts = split(’/’,$link->{href});
my @messages = split(’ ’,$link->{title});
my $date = $linkparts[6];
my $value= $messages[0];
push(@yearMths,$date);
$YMmessages{$date}=$value;
print OUT $date.",".$value."\n";
# print $scrapper->dumper(@messages);
$i++;
}
close(OUT);
################################
# Load the previously traversed links
################################
my $dbh = DBI->connect ("DBI:mysql:database=$db:host=$host",$user,$password) or die "Can’t connect to database: $DBI::errstr\n";
my $sth = $dbh->prepare("select url from messages");
$sth->execute();
while (my @row = $sth->fetchrow_array()){
push(@visitedUrls,@row);
}
$dbh->disconnect or warn "Disconnection error: $DBI::errstr\n";
##################################
# Get the links and start visiting
##################################
debug("Visting the links in first page");
my $linkCount=0;
foreach my $link(@{$yearmth}){
# last if($linkCount>1);
my $suburl= $link->{href};
visitArchiveYearMonth($suburl);
$linkCount++;
}
}
#
112
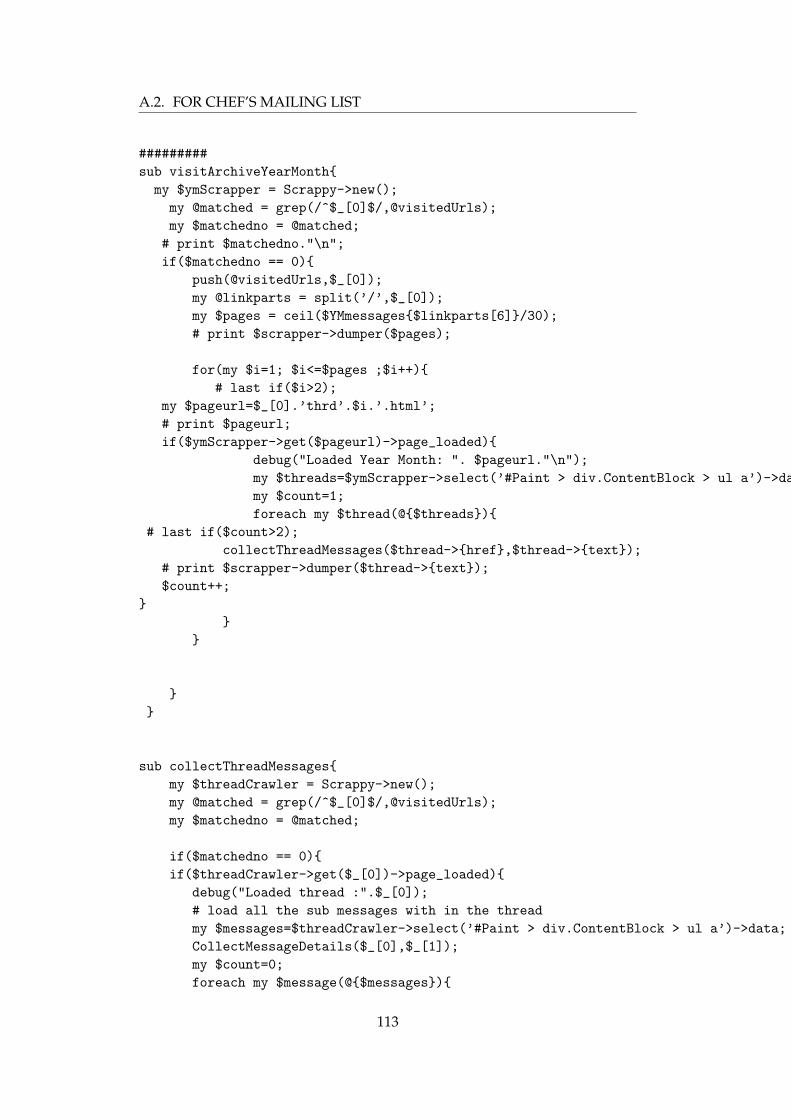
A.2. FOR CHEF’S MAILING LIST
#########
sub visitArchiveYearMonth{
my $ymScrapper = Scrappy->new();
my @matched = grep(/^$_[0]$/,@visitedUrls);
my $matchedno = @matched;
# print $matchedno."\n";
if($matchedno == 0){
push(@visitedUrls,$_[0]);
my @linkparts = split(’/’,$_[0]);
my $pages = ceil($YMmessages{$linkparts[6]}/30);
# print $scrapper->dumper($pages);
for(my $i=1; $i<=$pages ;$i++){
# last if($i>2);
my $pageurl=$_[0].’thrd’.$i.’.html’;
# print $pageurl;
if($ymScrapper->get($pageurl)->page_loaded){
debug("Loaded Year Month: ". $pageurl."\n");
my $threads=$ymScrapper->select(’#Paint > div.ContentBlock > ul a’)->data;
my $count=1;
foreach my $thread(@{$threads}){
# last if($count>2);
collectThreadMessages($thread->{href},$thread->{text});
# print $scrapper->dumper($thread->{text});
$count++;
}
}
}
}
}
sub collectThreadMessages{
my $threadCrawler = Scrappy->new();
my @matched = grep(/^$_[0]$/,@visitedUrls);
my $matchedno = @matched;
if($matchedno == 0){
if($threadCrawler->get($_[0])->page_loaded){
debug("Loaded thread :".$_[0]);
# load all the sub messages with in the thread
my $messages=$threadCrawler->select(’#Paint > div.ContentBlock > ul a’)->data;
CollectMessageDetails($_[0],$_[1]);
my $count=0;
foreach my $message(@{$messages}){
113

A.2. FOR CHEF’S MAILING LIST
# last if($count > 1);
CollectMessageDetails($message->{href},$_[1]);
$count++;
}
}
}
}
sub CollectMessageDetails{
my $messageScrapper = Scrappy->new();
my $dbh = DBI->connect ("DBI:mysql:database=$db:host=$host",$user,$password) or die "Can’t connect to database: $DBI::errstr\n";
# $dbh->trace(2);
my @matched = grep(/^$_[0]$/,@visitedUrls);
my $matchedno = @matched;
print $matchedno."\n";
if($matchedno == 0){
push(@visitedUrls,$_[0]);
my $sth = $dbh->prepare("INSERT INTO messages(subject,sender,send_date,message,thread,url) VALUES (?,?,?,?,?,?)");
if($messageScrapper->get($_[0])->page_loaded){
debug("Loaded message: ".$_[0]."\n");
# collect message details
my $body = $messageScrapper->content->decoded_content(’charset’);
# $body =~ s/(mailto[:][\n]\s*<script.*>(.*[\n]*)+<\/script>[\"]>)/\">/i;
while($body =~ m/(<[^<>]*<script.*>(.*[\n]*)+<\/script>[^<>]*>)/){
# +<script(.*[\n]*)+<\/script>[\"]>)/i){
# print "matched ".$1."\n";
$body =~ s/(<[^<>]*<script.*>(.*[\n]*)+<\/script>[^<>]*>)//i;
}
# print $scrapper->dumper($body)."\n";
while($body =~ m/(<a([^>]+)>(.+?)<\/a>)/i){
$body =~s/(<a([^>]+)>(.+?)<\/a>)//i;
}
my $parser = Scrappy::Scraper::Parser->new;
$parser->html($body);
# $parser->select(’#Paint > div.ContentBlock > div.block li:nth-child(1)’);
my $from=$messageScrapper->select(’#Paint > div.ContentBlock > div.block li:nth-child(1)’)->data->[0]->{text};
# print $scrapper->dumper($parser->data)."\n";
$from =~ s/.*<(.*?)>/$1/i;
if($from ==""){
$from=$messageScrapper->select(’#Paint > div.ContentBlock > div.block li:nth-child(1)’)->data->[0]->{html};
$from =~ s/(.*[\n])+.*\("(.*?)"\s+\W+\s+"(\W+)"\s+\W+\s+"(.*?)"\).*(.*[\n])+.*/$2$3$4/i;
}
114

A.2. FOR CHEF’S MAILING LIST
my $subject=$messageScrapper->select(’#Paint > div.ContentBlock > div.block li:nth-child(3)’)->data->[0]->{text};
if($subject !~ m/Subject:\s+(.*?)/i){
$subject=$parser->select(’#Paint > div.ContentBlock > div.block li:nth-child(4)’)->data->[0]->{text};
}
$subject =~ s/Subject:\s+(.*?)/$1/i;
my $date = $parser->select(’#Paint > div.ContentBlock > div.block li:nth-child(4)’)->data->[0]->{text};
if($date !~ m/Date:\s+(.*?)/i){
$date=$parser->select(’#Paint > div.ContentBlock > div.block li:nth-child(5)’)->data->[0]->{text};
}
$date =~ s/Date:\s+(.*?)/$1/i;
my $formatted_date = format_date_for_mysql($date);
print $subject." ".$formatted_date."\n";
my $msgbody = "";
# $msgbody=$parser->select(’#Paint > div.ContentBlock’)->data->[0]->{html};
# print $scrapper->dumper($msgbody)."\n";
$msgbody =~ s/<hr[^<>]*\/>(.*?)<script.*/$1/i;
$parser->html("<div id=\"dummy\">".$msgbody."</div>");
my $msgtxt=$parser->select("#dummy")->data->[0]->{text};
# $sth->execute($subject,$from, $formatted_date, $msgtxt,$_[1], $_[0]);
}
}
$dbh->disconnect or warn "Disconnection error: $DBI::errstr\n";
}
sub format_date{
my %mon2num = qw(
jan 1 feb 2 mar 3 apr 4 may 5 jun 6
jul 7 aug 8 sep 9 oct 10 nov 11 dec 12
);
my @datesupplied = split(’ ’,$_[0]);
my $month = $mon2num{lc substr($datesupplied[1],0,3)};
return $datesupplied[0].’/’.$month;
}
sub format_date_for_mysql{
my @date=strptime($_[0]);
my $year=$date[5]+1900;
my $month=$date[4]+1;
my $day=$date[3];
115

A.2. FOR CHEF’S MAILING LIST
my $hh=$date[2];
my $mm=$date[1];
my $ss=$date[0];
return "$year-$month-$day $hh:$mm:$ss";
}
sub usage{
# prints the correct use of this script
print "Usage:\n";
print "-h Usage \n";
print "-v Verbose\n";
print "-d Debug\n";
print "./script [-d][-v][-h]\n";
}
sub verbose{
print "VERBOSE:".$_[0]."\n" if $VERBOSE;
}
sub debug{
print "DEBUG:".$_[0]."\n" if $DEBUG;
}
116

Appendix B
Data Miner and tokeniser
This script is originally written by Eric Lease Morgan . Minor tweaks likedatabase connection , filter addition and selection of payload to be inspectionwere made make it work in our context
# n-grams.pl - list top 10 bi-grams from a text ordered by tscore, and
# list top 10 tri-grams and 4-grams ordered by number of occurances
# Eric Lease Morgan <[email protected]>
# June 18, 2009 - first implementation
# June 19, 2009 - tweaked
# August 22, 2009 - added tri-grams and 4-grams
# require
use lib ’../lib’;
use Lingua::EN::Bigram;
use Lingua::StopWords qw( getStopWords );
use DBI;
use Data::Dumper;
use strict;
# initialize
my $stopwords = &getStopWords( ’en’ );
# definition of variables
my $db="chefMLS";
my $host="localhost";
my $user="root";
my $password="letmein"; # the root password
# sanity check
# my $file = $ARGV[ 0 ];
# if ( ! $file ) {
117

# print "Usage: $0 <file>\n";
# exit;
# }
# slurp
my $dbh = DBI->connect ("DBI:mysql:database=$db:host=$host",
$user,
$password)
or die "Can’t connect to database: $DBI::errstr\n";
my $text = " ";
my $sth = $dbh->prepare("select thread from threads");
$sth->execute();
while (my ($thread) = $sth->fetchrow_array()){
# push(@urls,@row
$text = $text." ".$thread;
# print $text;
print Dumper($thread)."\n";
}
# disconnect from database
$dbh->disconnect or warn "Disconnection error: $DBI::errstr\n";
# open F, $file or die "Can’t open input: $!\n";
# my $text = do { local $/; <F> };
# close F;
# build n-grams
my $ngrams = Lingua::EN::Bigram->new;
$ngrams->text( $text );
# get bi-gram counts
my $bigram_count = $ngrams->bigram_count;
my $tscore = $ngrams->tscore;
# display top ten bi-grams, sans stop words and punctuation
my $index = 0;
print "Bi-grams (T-Score, count, bi-gram)\n";
foreach my $bigram ( sort { $$tscore{ $b } <=> $$tscore{ $a } } keys %$tscore ) {
# get the tokens of the bigram
my ( $first_token, $second_token ) = split / /, $bigram;
# skip stopwords and punctuation
next if ( $$stopwords{ $first_token } );
next if ( $first_token =~ /[,.?!:;()\-]/ );
118

next if ( $$stopwords{ $second_token } );
next if ( $second_token =~ /[,.?!:;()\-]/ );
# for chef
next if($first_token =~ m/chef/i);
next if($second_token =~ m/re/i);
next if($second_token =~ m/released/i);
# for puppet
next if($first_token =~ m/rc/i);
next if($first_token =~ m/release/i);
next if($first_token =~ m/users/i);
next if($first_token =~ m/available/i);
next if($second_token =~ m/users/i);
next if($second_token =~ m/announce/i);
next if($second_token =~ m/available/i);
next if($second_token =~ m/source/i);
# increment
$index++;
last if ( $index > 20 );
# output
# print "$$tscore{ $bigram }\t" .
# "$$bigram_count{ $bigram }\t" .
print "$bigram\t\n";
}
print "\n";
# get tri-gram counts
my $trigram_count = $ngrams->trigram_count;
# process the first top 10 tri-grams
$index = 0;
print "Tri-grams (count, tri-gram)\n";
foreach my $trigram ( sort { $$trigram_count{ $b } <=> $$trigram_count{ $a } } keys %$trigram_count ) {
# get the tokens of the bigram
my ( $first_token, $second_token, $third_token ) = split / /, $trigram;
# skip punctuation
next if ( $first_token =~ /[,.?!:;()\-]/ );
next if ( $second_token =~ /[,.?!:;()\-]/ );
next if ( $third_token =~ /[,.?!:;()\-]/ );
# for chef
next if($first_token =~ m/chef/i);
119

next if($second_token =~ m/re/i);
next if($third_token =~ m/re/i);
# for puppet
next if($first_token =~ m/release/i);
next if($first_token =~ m/rc/i);
next if($second_token =~ m/users/i);
next if($second_token =~ m/announce/i);
next if($second_token =~ m/puppet/i);
next if($third_token =~ m/team/i);
# skip stopwords; results are often more interesting if these are commented out
#next if ( $$stopwords{ $first_token } );
#next if ( $$stopwords{ $second_token } );
#next if ( $$stopwords{ $third_token } );
# increment
$index++;
last if ( $index > 10 );
# echo
# print $$trigram_count{ $trigram }, "\t$trigram\n";
print "$trigram\n";
}
print "\n";
# get quad-gram counts
my $quadgram_count = $ngrams->quadgram_count;
# process the first top 10 tri-grams
$index = 0;
print "Quad-grams (count, quad-gram)\n";
foreach my $quadgram ( sort { $$quadgram_count{ $b } <=> $$quadgram_count{ $a } } keys %$quadgram_count ) {
# get the tokens of the bigram
my ( $first_token, $second_token, $third_token, $fourth_token ) = split / /, $quadgram;
# skip punctuation
next if ( $first_token =~ /[,.?!:;()\-]/ );
next if ( $second_token =~ /[,.?!:;()\-]/ );
next if ( $third_token =~ /[,.?!:;()\-]/ );
next if ( $fourth_token =~ /[,.?!:;()\-]/ );
# for puppet
next if($first_token =~ m/rc/i);
next if($first_token =~ m/users/i);
120

next if($first_token =~ m/team/i);
next if($second_token =~ m/users/i);
next if($second_token =~ m/announce/i);
next if($second_token =~ m/puppet/i);
next if($second_token =~ m/announce/i);
next if($third_token =~ m/team/i);
next if($fourth_token =~ m/users/i);
# skip stopwords; results are often more interesting if these are commented out
#next if ( $$stopwords{ $first_token } );
#next if ( $$stopwords{ $second_token } );
#next if ( $$stopwords{ $third_token } );
#next if ( $$stopwords{ $fourth_token } );
# increment
$index++;
last if ( $index > 10 );
# echo
# print $$quadgram_count{ $quadgram }, "\t$quadgram\n";
print "$quadgram\n";
}
print "\n";
# done
exit;
121

Appendix C
Glossary
app: Application
SUS: System Usability Scale
SEQ: Single Ease Question
API: Application Program Interface
CSV: Comma separated value
SQL: Structured Query Language
mbox: Mail Box file
MySql: Database engine(service)
JSON: JavaScript Object Notation
PDF: Probability Density Function
CI: Confidence Interval
SSL: Secure Socket Layer
COPBL: CFEngine Community Open Promise-Body Library
OS: Operating System
OSAL: Operating System Abstraction Layer
DSL: Domain Specific Language
DHCP: Domain Host Control Protocol
122