investec funds series iv interim report and...
TRANSCRIPT

OEIC | REPORT AND ACCOUNTS INVESTEC FUNDS SERIES IV
Investec Funds Series ivInterim Reportand Accounts For the period ended 30 November 2018

REPORT AND ACCOUNTS
Investec Funds Series iv 1
Investec Funds Series iv Semi-Annual Report and Accounts
Diversifi ed Growth Fund* 2 -4
Emerging Markets Blended Debt Fund* 5 -7
Emerging Markets Equity Fund* 8 -10
Global Dividend Fund* 11 -13
Global Franchise Fund* 14 -16
Global Quality Equity Income Fund* 17 -19
Global Special Situations Fund* 20 -22
Multi-Asset Protector Fund* 23 -25
Multi-Asset Protector Fund 2* 26 -28
Target Return Bond Fund* 29 -31
UK Total Return Fund* 32 -34
Portfolio Statements per Fund* 35 -71
Authorised Corporate Director’s Report* 72 -73
Comparative Tables 74 -84
Financial Statements 85 -102
Securities Financing Transactions (‘SFTs’) 103
Other Information 104
Glossary 105 -107
Directory 108
* The above information collectively forms the Authorised Corporate Director’s Report

REPORT AND ACCOUNTS
Investec Funds Series iv2
Diversifi ed Growth Fund
Summary of the Fund’s investment objective and policy
The Fund aims to provide long-term real returns (through a combination of income and capital growth). Real returns are
returns in excess of UK infl ation (currently measured by the increase in the UK Consumer Price Index). The Fund targets
a return of UK CPI +5% gross of fees) per annum over rolling 5-year periods. The Fund’s real returns and its performance
target are not guaranteed over the long term or over any period of time and you may get back less than you invested.
The Fund invests around the world in shares of companies; bonds (contracts to repay borrowed money which typically pay
interest at fi xed times); property; commodities; other funds; derivatives (fi nancial contracts whose value is linked to the price
of an underlying asset) and cash. Exposure to shares may be up to 85%. The bonds invested in are issued by governments
or companies. Derivatives may be used in order to achieve the Fund’s investment objectives or for effi cient portfolio
management purposes e.g. with the aim of either managing the Fund risks or reducing the costs of managing the Fund.
Investments may be directly in the assets themselves (excluding property and commodities) or indirectly through other
investments and other funds (up to 100%).
The Investment Manager is free to choose how the Fund is invested and does not manage it with reference to an index.
Performance record6 months (%)
Investec Diversifi ed Growth Fund ‘I’ accumulation shares -6.11*
Performance comparison index 1.10**
Peer group sector average Not applicable **
Past performance is not a reliable indicator of future results, losses may be made.
Performance review
The Fund delivered a negative return during the period under review, underperforming the performance comparison index.
Factors helping performance
The signifi cant contributors over the period were mainly from Uncorrelated and Defensive assets. Our Uncorrelated
infrastructure basket of companies was the largest contributor over the period, driven by an overall recovery in investor
sentiment and a lessening of political risks, after a diffi cult 12 months for the asset class. Specifi c security-level
developments also boosted the basket’s cumulative performance, notably corporate activity that led to the takeover of John
Laing Infrastructure at a sizeable premium to the share price. This boosted sentiment across the sector more generally. In
addition, the Swedish yield curve fl attener (designed to benefi t when the front of the yield curve rises relative to the long end)
contributed to returns as the market began to price in future interest rate hikes after a strong period for the Swedish
economy. Our equity protection strategy, short the Russell 2000 index and long the S&P 500 index (based on the view that
large cap stocks are better insulated in times of market stress) contributed over the period as small cap stocks
underperformed larger cap stocks, a common occurrence during periods of equity weakness.
Among Defensive assets, our long-developed market duration contributed positively over the period, recovering some of the
losses from the start of the calendar year. This exposure evolved from a primary focus at the start of the period from solely
US treasuries to also include Australian, New Zealand and Korean government bonds – markets where we are cautious
about their respective economic growth prospects. Given the risk-off tone of the period, investors sought safety in
government bonds, leading to falling yields and increasing prices.
REPORT AND ACCOUNTS
Investec Funds Series iv 3
Factors hindering performance
Our overall Growth asset exposure was a signifi cant detractor over the six months. A broad sell-off across most developed
and emerging equity markets occurred after reaching record highs in the US and UK equity markets earlier in 2018, driven by
slowing global growth, a reduction in market liquidity and stuttering company earnings. This sell-off hurt specifi c equity
positions in the portfolio. Our position that certain oil exploration & production companies would outperform the broader US
equity market was additionally impacted by oil price weakness, driven by ongoing concerns over excessive supply and lower
demand growth. Equity holdings in US homebuilders also suffered over the period, given concerns among investors that
housing had reached its cyclical peak and rising rates would weigh on mortgage affordability, although earnings remained
positive at the underlying company level.
Within Defensive assets, our long Japanese yen exposure was the major detractor. The common relationship of the yen
acting as a safe haven during periods of market turmoil didn’t hold as much as investors expected over this period, despite
the fact this relationship did hold at other times over 2018. Overspill fears from the US-China trade war weighed on the
currency as did the continued widening in the interest rate differential between the US and Japan, which contributed to the
relative unattractiveness of the yen for some investors.
Portfolio activity
Signifi cant purchases
Bundesrepublik Deutschland Government Bond 0.5%; Republic of South Africa Government Bond 10.5%; New Zealand
Government Bond 3%; PulteGroup; Lennar; DR Horton; Taylor Morrison Home; KB Home; TRI Pointe Group; NVR.
Signifi cant sales
United Kingdom Gilt 2% 22/07/2020; Republic of South Africa Government Bond 10.5%; John Laing Infrastructure Fund;
Dr Pepper Snapple; Indonesia Treasury Bond 7.5% 15/05/2038; Indonesia Treasury Bond 7.5% 15/05/2036; Great Portland
Estates; Energen; Johnson & Johnson; Varex Imaging.
Outlook
The risk that the bull market in growth assets is on its last legs, or has ended, is building. Downside risks to global growth
are increasing, although recession risks still appear fairly low for 2019, monetary and trade policies are becoming more
restrictive and price action is less convincing.
On a more positive note, valuations are now less expensive, or outright cheap in the case of emerging markets, sentiment is
depressed and there are potential positives from a less hawkish US Federal Reserve, as well as some willingness to
negotiate on trade. For the bull market to continue probably requires ‘Goldilocks’ moderate growth, rather than a global
economy that is too strong or too weak. We continue to like call options as a way to participate if it does. US government
bonds are beginning to price in the end of the cycle and adding duration into weakness is becoming attractive. The dollar’s
fortunes will probably depend on whether growth divergence persists with the rest of the world.
*Source: Morningstar, total return, income reinvested, no initial charge, accumulation (acc) share class, net of fees in GBP.
**Index (UK CPI + 5% p.a. (gross) over rolling 5 years) shown for performance comparison purposes only. For this Fund, there is no relevant
Investment Association peer group sector against which to measure Fund performance.
The opinions expressed herein are as at end of November 2018.

REPORT AND ACCOUNTS
Investec Funds Series iv4
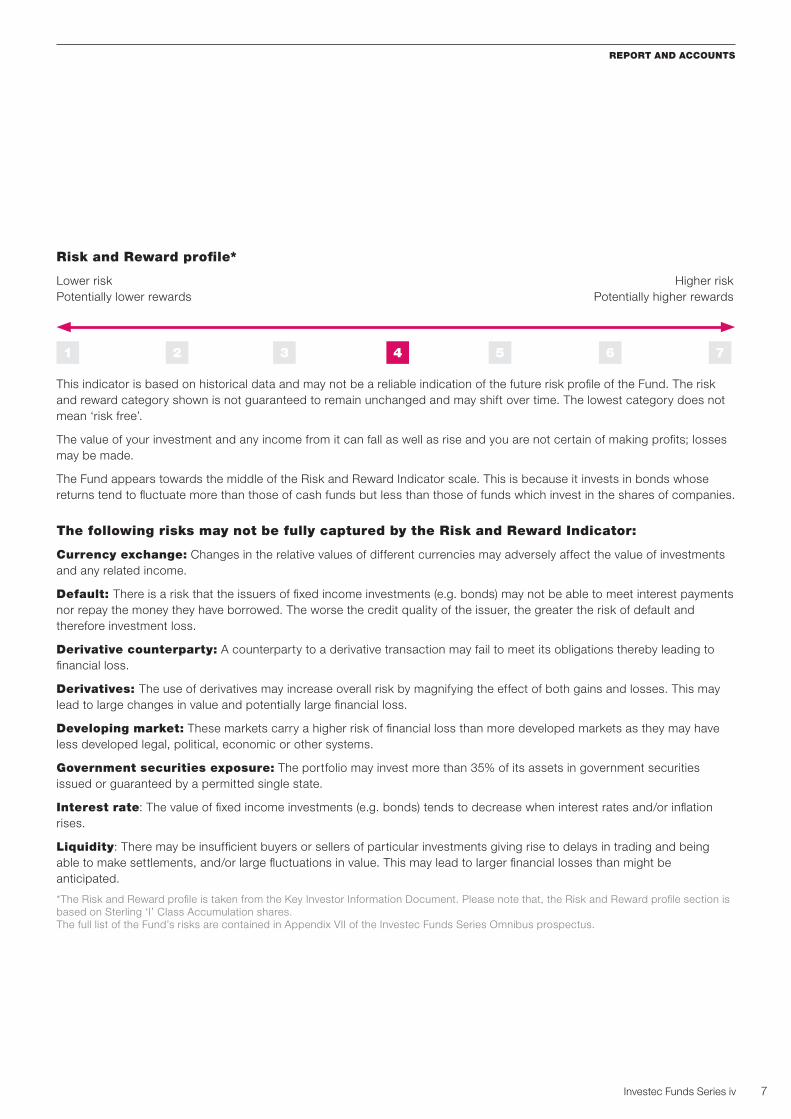
Risk and Reward profi le*
Lower risk Higher risk
Potentially lower rewards Potentially higher rewards
1 765432
This indicator is based on historical data and may not be a reliable indication of the future risk profi le of the Fund. The risk
and reward category shown is not guaranteed to remain unchanged and may shift over time. The lowest category does not
mean ‘risk free’.
The value of your investment and any income from it can fall as well as rise and you are not certain of making profi ts; losses
may be made.
The Fund appears towards the middle of the risk and reward indicator scale. This is because the mix of assets it invests in
tends to produce returns which fl uctuate more than those of cash funds but less than those of funds which solely invest in
the shares of companies.
The following risks may not be fully captured by the Risk and Reward Indicator:
Currency exchange: Changes in the relative values of different currencies may adversely affect the value of investments
and any related income.
Default: There is a risk that the issuers of fi xed income investments (e.g. bonds) may not be able to meet interest payments
nor repay the money they have borrowed. The worse the credit quality of the issuer, the greater the risk of default and
therefore investment loss.
Derivative counterparty: A counterparty to a derivative transaction may fail to meet its obligations thereby leading to
fi nancial loss.
Derivatives: The use of derivatives may increase overall risk by magnifying the effect of both gains and losses. This may
lead to large changes in value and potentially large fi nancial loss.
Developing market: These markets carry a higher risk of fi nancial loss than more developed markets as they may have
less developed legal, political, economic or other systems.
Equity investment: The value of equities (e.g. shares) and equity-related investments may vary according to company
profi ts and future prospects as well as more general market factors. In the event of a company default (e.g. bankruptcy), the
owners of their equity rank last in terms of any fi nancial payment from that company.
Government securities exposure: The portfolio may invest more than 35% of its assets in government securities
issued or guaranteed by a permitted single state.
Interest rate: The value of fi xed income investments (e.g. bonds) tends to decrease when interest rates and/or infl ation
rises.
*The Risk and Reward profi le is taken from the Key Investor Information Document. Please note that, the Risk and Reward profi le section is
based on Sterling ‘I’ Class Accumulation shares.
The full list of the Fund’s risks are contained in Appendix VII of the Investec Funds Series Omnibus prospectus.

REPORT AND ACCOUNTS
Investec Funds Series iv 5
Emerging Markets Blended Debt Fund
Summary of the Fund’s investment objective and policy
The Fund aims to provide income and long-term capital growth.
The Fund invests primarily in bonds (contracts to repay borrowed money which typically pay interest at fi xed times) issued by
governments, institutions or companies in emerging markets (countries that are in economic terms less developed than the
major Western countries). These bonds are issued in either the currency of the country in which they are issued or in hard
currencies (globally traded major currencies).
The Fund uses a currency hedging strategy that aims to reduce the impact of exchange rate movements between US dollars
(USD) and the currency that the Fund’s investments are valued in, sterling (GBP), consistent with the currency hedging in the
Fund’s performance comparison index*. This strategy will be implemented regardless of whether the rate of exchange
between GBP and USD is increasing or decreasing. It uses derivatives for effi cient portfolio management and investment
purposes. The currency hedging in the Fund seeks to reduce, but is not intended to remove, currency risk between GBP and
USD. The Fund’s actual exposure to USD at any time may be higher or lower than the USD exposure hedged to GBP in the
performance comparison index, depending on the Investment Manager’s investment view on currency returns and/or
volatility (wide fl uctuations in price). Where higher, this will result in additional currency exposure to USD. Where lower, this
will result in additional currency exposure to GBP.
The Fund may invest in other assets such as cash, other funds and derivatives (fi nancial contracts whose value is linked to
the price of an underlying asset).
The Investment Manager is free to choose how the Fund is invested. However, a composite index (* 50% JPMorgan GBI-EM
Global Diversifi ed/ 30% JPMorgan EBMI Global Diversifi ed GBP Hedged / 20% JPMorgan CEMBI Broad Diversifi ed GBP
Hedged) is currently taken into account when the Fund’s investments are selected.
Performance record
6 months
(%)
Investec Emerging Markets Blended Debt Fund ‘I’ accumulation shares -2.47**
Performance comparison index 1.86**
Peer group sector average -1.15**
Past performance is not a reliable indicator of future results, losses may be made.
Total deemed income distributions per ‘I’ accumulation share
6 months to November 2018 3.29 pence
6 months to November 2017 3.63 pence
The amount of income payable may rise or fall.
Performance review
The Fund produced a negative return over the period and underperformed its performance comparison index and peer
group sector average.

REPORT AND ACCOUNTS
Investec Funds Series iv6
Factors helping performance
We benefi ted materially from our off-benchmark exposure to the Egyptian pound which we held through high yielding
treasury bills. These securities rallied given the success of its fi scal reform programme and investor appetite for higher yields.
Our underweight holding in Turkish local currency bonds boosted relative performance as the central bank’s political
independence was further undermined, catching the market off guard by keeping market rates steady, sparking a broad
sell-off in the country’s assets. Our short positioning in Taiwanese dollar and South Korean won also contributed to positive
returns.
Factors hindering performance
Our modest overweight in the Argentine peso, a tactical position we entered in July detracted from performance when
Argentina’s request to accelerate IMF (International Monetary Fund) disbursements generated considerable selling in the
peso into month-end. This adjustment which we had not anticipated has led to short-term volatility and losses in the foreign
exchange market. Our overweight in the Brazilian real was the other main detractor as uncertainty surrounding the
presidential election and who would win weighed on the currency.
In Asia, our overweight holding in the Thai baht weighed on relative performance given the ongoing trade tensions weighing
on sentiment and signs of it starting to creep into fundamentals in Asian export-orientated economies.
Within hard currency bonds, overweight exposure to Egyptian hard currency bonds weighed on returns in October as the
bonds sold off alongside US assets, along with an uptick in issuance in Egypt.
Portfolio activity
Signifi cant purchases
Brazil Letras do Tesouro Nacional 01/01/2020; Brazil Letras do Tesouro Nacional 01/10/2020; Mexican Bonos 6.5%
09/06/2022; Thailand Government Bond 2.13% 17/12/2026; Brazil Notas do Tesouro Nacional 10% 01/01/2025; Mexican
Bonos 5.75% 05/03/2026; Mexican Bonos 8% 07/12/2023; Mexican Bonos 7.5% 03/06/2027; Hungary Government Bond
3% 27/10/2027; Russian Federal Bond – OFZ 7.7% 23/03/2033.
Signifi cant sales
Brazil Notas do Tesouro Nacional Serie F 10% 01/01/2025; Brazil Letras do Tesouro Nacional 01/01/2020 ; Mexican Bonos
6.5% 09/06/2022; Mexican Bonos 10% 20/11/2036; Colombian TES 6% 28/04/2028; Indonesia Government International
Bond 5.875% 15/01/2024; Russian Federal Bond – OFZ 7.7% 23/03/2033; Mexican Bonos 5.75% 05/03/2026; Brazil Letras
do Tesouro Nacional 01/07/2019; Mexican Bonos 7.5% 03/06/2027.
Outlook
In general, our outlook for emerging market (EM) fundamentals remains relatively positive, leading us to maintain a
constructive longer-term outlook for the asset class. Overall, the global economy is still growing at healthy pace and
emerging markets on aggregate are still early in the cycle with plenty of slack in many economies. This provides room for
growth to accelerate without stoking infl ation or causing a deterioration in trade balances in to 2019. However, in the short
term, it remains a challenging environment for the asset class. There remains a lot of uncertainty around the US and China
trade dispute with it continuing to weigh on global and EM data. While the Fed may be a touch more dovish, global liquidity
will continue to tighten. Given these ongoing challenges, we continue to monitor the macroeconomic developments.
*Source: Morningstar, total return, income reinvested, no initial charge, accumulation (acc) share class, net of fees in GBP.
**Index (JPMorgan GBI-EM Global Diversifi ed Index) and peer group sector average (Investment Association Global Emerging Markets
Bond sector) shown for performance comparison purposes only.
The opinions expressed herein are as at end of November 2018.
REPORT AND ACCOUNTS
Investec Funds Series iv 7
Risk and Reward profi le*
Lower risk Higher risk
Potentially lower rewards Potentially higher rewards
1 765432
This indicator is based on historical data and may not be a reliable indication of the future risk profi le of the Fund. The risk
and reward category shown is not guaranteed to remain unchanged and may shift over time. The lowest category does not
mean ‘risk free’.
The value of your investment and any income from it can fall as well as rise and you are not certain of making profi ts; losses
may be made.
The Fund appears towards the middle of the Risk and Reward Indicator scale. This is because it invests in bonds whose
returns tend to fl uctuate more than those of cash funds but less than those of funds which invest in the shares of companies.
The following risks may not be fully captured by the Risk and Reward Indicator:
Currency exchange: Changes in the relative values of different currencies may adversely affect the value of investments
and any related income.
Default: There is a risk that the issuers of fi xed income investments (e.g. bonds) may not be able to meet interest payments
nor repay the money they have borrowed. The worse the credit quality of the issuer, the greater the risk of default and
therefore investment loss.
Derivative counterparty: A counterparty to a derivative transaction may fail to meet its obligations thereby leading to
fi nancial loss.
Derivatives: The use of derivatives may increase overall risk by magnifying the effect of both gains and losses. This may
lead to large changes in value and potentially large fi nancial loss.
Developing market: These markets carry a higher risk of fi nancial loss than more developed markets as they may have
less developed legal, political, economic or other systems.
Government securities exposure: The portfolio may invest more than 35% of its assets in government securities
issued or guaranteed by a permitted single state.
Interest rate: The value of fi xed income investments (e.g. bonds) tends to decrease when interest rates and/or infl ation
rises.
Liquidity: There may be insuffi cient buyers or sellers of particular investments giving rise to delays in trading and being
able to make settlements, and/or large fl uctuations in value. This may lead to larger fi nancial losses than might be
anticipated.
*The Risk and Reward profi le is taken from the Key Investor Information Document. Please note that, the Risk and Reward profi le section is
based on Sterling ‘I’ Class Accumulation shares.
The full list of the Fund’s risks are contained in Appendix VII of the Investec Funds Series Omnibus prospectus.

REPORT AND ACCOUNTS
Investec Funds Series iv8
Emerging Markets Equity Fund
Summary of the Fund’s investment objective and policy
The Fund aims to grow the value of your investment over the long term.
The Fund invests primarily in the shares of companies either in emerging markets (countries that are in economic terms less
developed than the major Western countries) or with material links to these markets.
The Fund can also invest in other assets including cash and derivatives (fi nancial contracts whose value is linked to the price
of an underlying asset). Derivatives may be used in order to achieve the Fund’s investment objectives or for effi cient portfolio
management purposes e.g. with the aim of either managing the Fund risks or reducing the costs of managing the Fund.
The Investment Manager is free to choose how the Fund is invested. However, the MSCI Emerging Markets Net Total Return
Index is currently taken into account when the Fund’s investments are selected.
Performance record6 months
(%)
Investec Emerging Markets Equity Fund ‘I’ accumulation shares -8.09**
Performance comparison index -6.03**
Peer group sector average -6.80**
Past performance is not a reliable indicator of future results, losses may be made.
Performance review
The Fund delivered a negative return during the period under review, and underperformed its performance comparison index
and peer group sector average.
Factors helping performance
The portfolio outperformed in technology, due largely to positive stock picking. Top among performer in the sector was
Indian business process outsourcing fi rm Infosys, which rallied after demonstrating some positive sales performance.
Relative performance across technology was also lifted by a not holding Hon Hai, Sunny Optical and SK Hynix, which all
came under pressure amid smartphone demand concerns.
The portfolio also benefi ted from a rally in Brazilian shares in the wake of the well-received outcome of the last presidential
election. This rally cemented Brazilian bank Banco do Brazil as the portfolio’s single best performing holding over the period,
and drove positive contributions from fellow bang Itausa and Utility ENGIE.
The rally in global oil prices helped lift holdings of Russian oil company Lukoil.
Factors hindering performance
Returns were hindered most of all by the communication services and materials sectors, due to disappointing stock
performance. The setbacks from the communications services sector came mostly from Chinese holdings Baidu and
Tencent, which retreated amid a wider sell-off in higher valuation Chinese stocks. Investors were additionally concerned
about Baidu’s on-going cash requirements to fund investments in the iQiyi video streaming platform, while growing
regulatory scrutiny halted Tencent’s ability to generate sales from newer games after regulators temporally halted the
certifi cation of new games. Not having any exposure to outperforming China Mobile also detracted from relative returns in
the sectors. Both fi rms are still in the portfolio as they offer attractive levels of profi tability at current valuations.

REPORT AND ACCOUNTS
Investec Funds Series iv 9
Within materials, the portfolio was held back by South African chemical company Sasol, which detracted amid a severe
sell-off in the rand and wider concerns that falling global growth may negatively impact demand and pricing. South Korean
steelmaker Posco also detracted after its shares retreated amid concerns that the company may soon embark on a large
investment project. We remain invested in both fi rms as they offer signifi cant value at current levels.
The portfolio’s single largest stock-level detractor was Chinese pharmaceutical company CSPC. The company was initially
hindered by a fi ctitious vaccine scandal that triggered a selloff across Chinese pharmaceutical companies. Shares in CSPC
were additionally impacted by the announcement of a pilot program that would see large Chinese drug purchasers club
together to buys drugs in bulk, which triggered investor concerns about the sector’s ability to maintain current margins.
We still believe CSPC offers an attractive investment opportunity with fundamentally strong returns.
Portfolio activity
Signifi cant purchases
China Resources Land; Sasol; Bid; China Telecom; Want Want China; China Taiping Insurance; Anhui Conch Cement;
Tencent; Advanced Info Service; Baidu ADR.
Signifi cant sales
Tencent; Alibaba ADR; CNOOC; ENN Energy; China Overseas Land & Investment; Fibria Celulose; Shinhan Financial;
Mediatek; Anhui Conch Cement; Maruti Suzuki India.
Outlook
The defi ning characteristic of investing in emerging markets has always been their inherent cyclicality. After topping the
global equity league table last year, 2018 has seen volatility come back apace.
Far from undermining the investment case, we believe recent volatility has actually reinforced the main emerging market
value drivers. This is most evident in China, where we believe markets are overly wary of a ‘hard landing’ (sharp deterioration
in the quality of economic data). Behind the fear-inducing headlines, the country’s capital markets – especially new IPOs –
have remained buoyant, while the country has re-iterated its commitment to support a transition away from the current
export-dependent economic model. Meanwhile, the value case has continued to grow since emerging markets now trade at
a material 30% discount to developed markets in the wake of the recent sell-off.
We believe the gradual withdrawal of monetary easing across the world will increase the opportunities for stock-pickers such
as ourselves, albeit within a riskier environment.
*Source: Morningstar, total return, income reinvested, no initial charge, accumulation (acc) share class, net of fees in GBP.
**Index (MSCI*** Emerging Markets NDR Index) and peer group sector average (Investment Association Global Emerging Markets) shown
for performance comparison purposes only.
***Source: MSCI. The MSCI data is comprised of a custom index calculated by MSCI for, and as requested by, Investec Asset Management
Limited. The MSCI data is for internal use only and may not be redistributed or used in connection with creating or offering any securities,
fi nancial products or indices. Neither MSCI nor any other third party involved in or related to compiling, computing or creating the MSCI
data (the “MSCI Parties’) makes any express or implied warranties or representations with respect to such data (or the results to be
obtained by the use thereof), and the MSCI Parties hereby expressly disclaim all warranties of originality, accuracy, completeness,
merchantability or fi tness for a particular purpose with respect to such data. Without limiting any of the foregoing, in no event shall any of
the MSCI Parties have any liability for any direct, indirect, special, punitive, consequential or any other damages (including lost profi ts) even
if notifi ed of the possibility of such damages.
The opinions expressed herein are as at end of November 2018.

REPORT AND ACCOUNTS
Investec Funds Series iv10
Risk and Reward profi le*
Lower risk Higher risk
Potentially lower rewards Potentially higher rewards
1 765432
This indicator is based on historical data and may not be a reliable indication of the future risk profi le of the Fund. The risk
and reward category shown is not guaranteed to remain unchanged and may shift over time. The lowest category does not
mean ‘risk free’.
The value of your investment and any income from it can fall as well as rise and you are not certain of making profi ts; losses
may be made.
The Fund appears towards the higher end of the Risk and Reward Indicator scale. This is because it invests in the shares of
companies, whose values tend to fl uctuate more widely.
The following risks may not be fully captured by the Risk and Reward Indicator:
Currency exchange: Changes in the relative values of different currencies may adversely affect the value of investments
and any related income.
Derivatives: The use of derivatives is not intended to increase the overall level of risk. However, the use of derivatives may
still lead to large changes in value and includes the potential for large fi nancial loss.
Developing market: These markets carry a higher risk of fi nancial loss than more developed markets as they may have
less developed legal, political, economic or other systems.
Equity investment: The value of equities (e.g. shares) and equity-related investments may vary according to company
profi ts and future prospects as well as more general market factors. In the event of a company default (e.g. bankruptcy), the
owners of their equity rank last in terms of any fi nancial payment from that company.
*The Risk and Reward profi le is taken from the Key Investor Information Document. Please note that, the Risk and Reward profi le section is
based on Sterling ‘I’ Class Accumulation shares.
The full list of the Fund’s risks are contained in Appendix VII of the Investec Funds Series Omnibus prospectus.

REPORT AND ACCOUNTS
Investec Funds Series iv 11
Summary of the Fund’s investment objective and policy
The Fund aims to provide income and long-term capital growth.
The Fund invests primarily in the shares of companies from around the world with a focus on those that pay an attractive
dividend.
The Fund may invest in other assets such as cash, other funds and derivatives (fi nancial contracts whose value is linked to
the price of an underlying asset).
The Investment Manager is free to choose how the Fund is invested and does not manage it with reference to an index.
Performance record
6 months
(%)
Investec Global Dividend Fund ‘I’ accumulation shares -0.66**
Performance comparison index 1.52**
Peer group sector average 1.14**
Past performance is not a reliable indicator of future results, losses may be made.
Total deemed income distributions per ‘I’ accumulation share
6 months to November 2018 1.70 pence
6 months to November 2017 1.13 pence
The amount of income payable may rise or fall.
Performance review
The Fund delivered a negative return, and underperformed its performance comparison index and peer group sector
average.
Factors helping performance
The healthcare sector was the largest relative return contributor following rallies in the portfolio’s US-based holdings: positive
earnings momentum from pharmaceutical fi rms Johnson & Johnson and Pfi zer triggered rallies in the latter part of the
period. Swiss holding Novartis also contributed for the portfolio as its innovative medicine portfolio kicked off a solid sales
growth.
The portfolio outperformed in energy as the rally in oil prices globally lifted stock picking in the sector. This was especially
the case with Russian oil form Lukoil, which also benefi ted from some weakness in the Russian rubble.
The fund benefi ted from two take-over bids in the period; exhibitions company UBM plc and IT company Travelport were
both bought at signifi cant premiums, adding to fund returns.
Global Dividend Fund

REPORT AND ACCOUNTS
Investec Funds Series iv12
Factors hindering performance
Financials presented the portfolio with the biggest challenge, due to unfavourable stock performance. Among our holdings in
the sector, two key detractors were UK fi rms Schroders and Prudential, which both faced a steady stream in Brexit-related
uncertainty throughout the year, as well as wider market volatility. Another signifi cant detractor from the sector was Danish
bank Danske, whose Estonian subsidiary became embroiled in a money laundering scandal.
The consumer discretionary sector also detracted signifi cantly after US-listed casino operator Las Vegas Sands sold off on
concerns about weak VIP gambling volumes, especially across Asian markets. Returns across the sector were also weighed
down by US clothing manufacturer Hanesbrands, which retreated after US retailer Target announced it was terminating a
US$390 million contract for an exclusive line of its Champion brand.
Stock picking in the industrials sector was also challenging as Schneider Electric faced a deterioration in its Chinese order
book and margin headwinds from rising raw materials costs.
The portfolio’s single largest stock-level detractor was tobacco conglomerate British American Tobacco, which faced several
challenges stemming from the fall in smoking worldwide and the prospects of a US ban of fl avoured tobacco, such as
menthol cigarettes.
The Fund no longer holds Danske, but remains invested in the remaining fi rms due to their current valuations and yield.
Portfolio activity
Signifi cant purchases
Iberdrola; Unilever; CK Asset; International Business Machines; Merck; Gilead Sciences; Imperial Tobacco; Interpublic;
Hanesbrands; Johnson & Johnson.
Signifi cant sales
Altria; Las Vegas Sands; Danske Bank; Nippon Telegraph & Telephone; SalMar; Novartis; Travelport Worldwide; United
Overseas Bank; Reckitt Benckiser; Hon Hai Precision Industry.
Outlook
Deal or no deal?
Markets are obsessing over a potential breakthrough trade deal between the US and China. As the topic is unlikely to go
away anytime soon, we expect sentiment-driven volatility to persist in the near term. Underneath all this, we continue to see
earnings downgrades come out of Asia following a further deterioration in economic growth indicators in China and
elsewhere.
While market sentiment has recently been lifted by a hint that the US Federal Reserve may prove more accommodative than
previously suspected in 2019, this does suggest that global growth will be weaker than originally anticipated.
Market valuations are also continuing to contract. To us, these movements have opened up a value case for the market as a
whole – whereas we mainly saw sector-level value opportunities up until recently. That said, investor sentiment remains weak
overall. We would therefore need some sort of change in technical momentum and/or earnings expectations to trigger a
signifi cant market infl ection to the upward. Or possibly a trade deal.
*Source: Morningstar, total return, income reinvested, no initial charge, accumulation (acc) share class, net of fees in GBP.
**Index (MSCI*** All Country World Index NDR) and peer group sector average (Investment Association Global Equity Income sector) shown
for performance comparison purposes only.
***Source: MSCI. The MSCI data is comprised of a custom index calculated by MSCI for, and as requested by, Investec Asset Management
Limited. The MSCI data is for internal use only and may not be redistributed or used in connection with creating or offering any securities,
fi nancial products or indices. Neither MSCI nor any other third party involved in or related to compiling, computing or creating the MSCI
data (the “MSCI Parties’) makes any express or implied warranties or representations with respect to such data (or the results to be
obtained by the use thereof), and the MSCI Parties hereby expressly disclaim all warranties of originality, accuracy, completeness,
merchantability or fi tness for a particular purpose with respect to such data. Without limiting any of the foregoing, in no event shall any of
the MSCI Parties have any liability for any direct, indirect, special, punitive, consequential or any other damages (including lost profi ts) even
if notifi ed of the possibility of such damages.
The opinions expressed herein are as at end of November 2018.

REPORT AND ACCOUNTS
Investec Funds Series iv 13
Risk and Reward profi le*
Lower risk Higher risk
Potentially lower rewards Potentially higher rewards
1 765432
This indicator is based on historical data and may not be a reliable indication of the future risk profi le of the Fund. The risk
and reward category shown is not guaranteed to remain unchanged and may shift over time. The lowest category does not
mean ‘risk free’.
The value of your investment and any income from it can fall as well as rise and you are not certain of making profi ts; losses
may be made.
The Fund appears towards the middle of the Risk and Reward Indicator scale. This is because it invests in the shares of
companies, whose values tend to fl uctuate more widely.
The following risks may not be fully captured by the Risk and Reward Indicator:
Currency exchange: Changes in the relative values of different currencies may adversely affect the value of investments
and any related income.
Equity investment: The value of equities (e.g. shares) and equity-related investments may vary according to company
profi ts and future prospects as well as more general market factors. In the event of a company default (e.g. bankruptcy), the
owners of their equity rank last in terms of any fi nancial payment from that company.
The full list of the Fund’s risks are contained in the appendices of the Investec Funds Series omnibus prospectus.
*The Risk and Reward profi le is taken from the Key Investor Information Document. Please note that, the Risk and Reward profi le section is
based on Sterling ‘I’ Class Accumulation shares.
The full list of the Fund’s risks are contained in Appendix VII of the Investec Funds Series Omnibus prospectus.

REPORT AND ACCOUNTS
Investec Funds Series iv14
Summary of the Fund’s investment objective and policy
The Fund aims to provide long-term capital growth.
The Fund invests around the world primarily in the shares of companies.
The Fund focuses investment on companies deemed by the Investment Manager to be of high quality i.e. companies which
have provided sustainably high levels of return on invested capital and free cash fl ow (a company’s cash earnings after its
capital expenditures have been accounted for), typically those associated with global brands or franchises.
The Fund may invest in other assets such as cash, other funds and derivatives (fi nancial contracts whose value is linked to
the price of an underlying asset).
The Investment Manager is free to choose how the Fund is invested and does not manage it with reference to an index.
Performance record
6 months
(%)
Investec Global Franchise Fund ‘I’ accumulation shares 8.15**
Performance comparison index 1.52**
Peer group sector average -1.26**
Past performance is not a good indicator of future results, losses may be made.
Performance review
The Fund delivered a positive return during the period under review and outperformed its peer group sector average and
performance comparison index.
Factors hindering performance
At a sector level, our positioning within fi nancials proved to be the largest drag on relative returns. Financial services provider
Charles Schwab and credit rating agency Moody’s were the leading sector detractors over the period. Shares in Charles
Schwab fell amid the market volatility over the fi nal quarter. Further pain was felt as the US Federal Reserve indicated interest
rates were approaching a neutral level – thereby implying less increases over 2019/2020 than initially thought. Schwab
benefi ts for rising rates through the interest it earns on its cash fl oat. Moody’s sold off after reporting lower ratings revenues
for the quarter following weak bond issuance trends across the globe. We continue to hold both stocks as we believe the
longer-term stories for both remain intact. We believe the recent market volatility has dampened the short-term outlook for
both stocks as the market re-adjusts expectations moving forward.
At a stock level, the largest detractors were also from the technology sector. Online reservation company Booking Holdings
sold off following its second-quarter update. The slowdown in bookings growth (despite being above analysts’ estimates)
continued to concern investors. While we have seen volatility around results and changes to guided growth rates in the past,
we still believe in the long-term growth runway of the model and maintain conviction in the position.
Global Franchise Fund

REPORT AND ACCOUNTS
Investec Funds Series iv 15
Factors helping performance
Our technology sector holdings proved the primary driver towards relative outperformance. Our position in internet domain
name and internet security fi rm Verisign performed well as investors responded well to the company’s plans to simplify its
capital structure. Additionally, quarterly results have been consistently strong, and in November it rallied following the news
that it had been given permission to raise prices on .com domain names. Software company Microsoft released strong
results throughout last year, mainly attributed to the healthy growth from its Cloud offering, Azure, and from its gaming
platforms. Global payment provider Visa also added to performance, underpinned by strong fi nancial results.
Within the communications services sector, media company Twenty-First Century Fox was among the leading contributors
over the period as Disney and Comcast faced off in a bidding war for the bulk of Fox’s assets.
Exposure to healthcare also proved profi table, especially when markets became more volatile in the fourth quarter. The
sector in general continued to benefi t from investors reducing risk and re-allocating capital to more defensive sectors.
Holdings including Roche Holding and Johnson & Johnson performed well, helped further by positive quarterly updates.
Portfolio activity
Signifi cant purchases
Booking Holding; ASML; Charles Schwab; Visa; Amadeus IT; Beiersdorf; Philip Morris International; Reckitt Benckiser;
Roche; Becton Dickinson.
Signifi cant sales
Paypal; Japan Tobacco; Pepsico; VeriSign; Intuit; Anheuser-Busch InBev ADR; Visa; Microsoft; S&P Global; Check Point
Software Technologies.
Outlook
The heightened volatility in recent months serves as a stark reminder of where we are in the current market cycle. Equity
markets are starting to look more vulnerable than they have for some time, especially when we consider the growing list of
factors which are eroding investor confi dence. We believe portfolio resilience is now more important than ever. The
implications of a prolonged market draw down are far-reaching for companies and asset prices, thus we continue to believe
in a balanced quality approach to navigate these uncertain times. Particularly in these late stages of a bull market, we
maintain discipline by investing in high quality companies at reasonable valuations, which continue to compound cashfl ows
at attractive rates over time. Nothing has changed in terms of how quality companies can provide long-term outperformance,
and thus we believe the opportunities provided by quality stocks remain attractive.
*Source: Morningstar, total return, income reinvested, no initial charge, accumulation (acc) share class, net of fees in GBP.
**Index (MSCI*** All Countries World NR Index) and peer group sector average (Investment Association Global sector) shown for
performance comparison purposes only.
***Source: MSCI. The MSCI data is comprised of a custom index calculated by MSCI for, and as requested by, Investec Asset Management
Limited. The MSCI data is for internal use only and may not be redistributed or used in connection with creating or offering any securities,
fi nancial products or indices. Neither MSCI nor any other third party involved in or related to compiling, computing or creating the MSCI
data (the “MSCI Parties’) makes any express or implied warranties or representations with respect to such data (or the results to be
obtained by the use thereof), and the MSCI Parties hereby expressly disclaim all warranties of originality, accuracy, completeness,
merchantability or fi tness for a particular purpose with respect to such data. Without limiting any of the foregoing, in no event shall any of
the MSCI Parties have any liability for any direct, indirect, special, punitive, consequential or any other damages (including lost profi ts) even
if notifi ed of the possibility of such damages.
The opinions expressed herein are as at end of November 2018.

REPORT AND ACCOUNTS
Investec Funds Series iv16
Risk and Reward profi le*
Lower risk Higher risk
Potentially lower rewards Potentially higher rewards
1 765432
This indicator is based on historical data and may not be a reliable indication of the future risk profi le of the Fund. The risk
and reward category shown is not guaranteed to remain unchanged and may shift over time. The lowest category does not
mean ‘risk free’.
The value of your investment and any income from it can fall as well as rise and you are not certain of making profi ts; losses
may be made.
The Fund appears towards the middle of the Risk and Reward Indicator scale. This is because it invests in the shares of
companies, whose values tend to fl uctuate more widely.
The following risks may not be fully captured by the Risk and Reward Indicator:
Concentrated portfolio: The portfolio invests in a relatively small number of individual holdings. This may mean wider
fl uctuations in value than more broadly invested portfolios.
Currency exchange: Changes in the relative values of different currencies may adversely affect the value of investments
and any related income.
Equity investment: The value of equities (e.g. shares) and equity-related investments may vary according to company
profi ts and future prospects as well as more general market factors. In the event of a company default (e.g. bankruptcy), the
owners of their equity rank last in terms of any fi nancial payment from that company.
*The Risk and Reward profi le is taken from the Key Investor Information Document. Please note that, the Risk and Reward profi le section is
based on Sterling ‘I’ Class Accumulation shares.
The full list of the Fund’s risks are contained in Appendix VII of the Investec Funds Series Omnibus prospectus.

REPORT AND ACCOUNTS
Investec Funds Series iv 17
Global Quality Equity Income Fund
Summary of the Fund’s investment objective and policy
The Fund aims to provide income and long-term capital growth.
The Fund invests primarily in the shares of companies around the world with a focus on companies deemed by the
Investment Manager to be of high quality i.e. companies which have provided sustainably high levels of return on invested
capital and free cash fl ow (a company’s cash earnings after its capital expenditures have been accounted for). The Fund
may, at times, invest in a relatively small number of companies.
The Fund may invest in other assets such as cash, other funds and derivatives (fi nancial contracts whose value is linked to
the price of an underlying asset).
The Investment Manager is free to choose how the Fund is invested and does not manage it with reference to an index.
Performance record6 months
(%)
Investec Global Quality Equity Income Fund ‘I’ Income-2 shares 6.51**
Performance comparison index 1.52**
Peer group sector average 1.14**
Past performance is not a good indicator of future results, losses may be made.
Total deemed income distributions per ‘I’ income-2 share
6 months to November 2018 1.35 pence
6 months to November 2017 1.32 pence
The amount of income payable may rise or fall.
Performance review
The Fund delivered a positive return during the period under review, outperforming its performance comparison index and
peer group sector average.
Factors helping performance
Within the portfolio, our stock selection and overweight allocation to healthcare was the main driver of relative
outperformance, with holdings including Novartis, Roche Holding and Johnson & Johnson performing well following positive
quarterly updates. The healthcare sector in general continued to benefi t from investors reducing risk and re-allocating to
more defensive sectors during the fourth-quarter sell-off.
Within the communications services sector, media company Twenty-First Century Fox was among the leading contributors
over the period as Disney and Comcast faced off in a bidding war for the bulk of Fox’s assets.
Within technology, Microsoft released strong results throughout last year mainly attributed to the healthy growth from its
Cloud offering, Azure, and from its gaming platforms. Global payment provider Visa also added to performance,
underpinned by strong fi nancial results.

REPORT AND ACCOUNTS
Investec Funds Series iv18
Factors hindering performance
More negatively, at a sector level, holdings in the food and tobacco sector detracted the most. The US Food & Drug
Administration dealt tobacco companies another blow, with plans to introduce a widespread US ban on menthol cigarettes.
This negatively impacted our positions in British American Tobacco and Imperial Brands. We have been trimming our
exposure to tobacco and continue to monitor the situation. Global brewer Anheuser-Busch InBev detracted having been
impacted by the EM currency sell-off, with the brewer deriving nearly 60% of its revenues from overseas. It also recently
announced it was cutting its dividend by 50% to strengthen its balance sheet following emerging market currency weakness.
Our position in Macau based casino operator Sands China also weighed on returns. Asian stocks in general endured a tough
second half as trade war and Chinese macroeconomic concerns weighed on the region. We maintain our position in the
stock, as on a sector basis, and relative to peers, China Sands has performed well.
Our position in software company Sage also hurt performance. The market reacted badly to the surprise resignation of the
CEO in August. Outgoing Stephen Kelly led Sage through signifi cant change in recent years, but with the restructuring
largely complete, it is felt that a different set of skills may be needed from here. Further to this, UK equities in general have
been treated harshly by Brexit negotiations.
Portfolio activity
Signifi cant purchases
Charles Schwab; ASML; Booking; Reckitt Benckiser; Becton Dickinson; Sands China; Rockwell Automation; Medtronic;
Automatic Data Processing; Nike.
Signifi cant sales
Japan Tobacco; Coca-Cola; Oracle; Twenty-First Century Fox; Microsoft; Johnson & Johnson; GlaxoSmithKline; Procter &
Gamble; Novartis; Medtronic.
Outlook
The heightened volatility in recent months serves as a stark reminder of where we are in the current market cycle. Equity
markets are starting to look more vulnerable than they have for some time, especially when we consider the growing list of
factors which are eroding investor confi dence. We believe portfolio resilience is now more important than ever. The
implications of a prolonged market draw down are far-reaching for companies and asset prices, thus we continue to believe
in a balanced quality approach to navigate these uncertain times. Particularly in these late stages of a bull market, we
maintain discipline by investing in high quality companies at reasonable valuations which continue to compound at attractive
rates over time, while providing dividends to shareholders which are well covered by free cash fl ow. Nothing has changed in
terms of how quality companies can provide long-term outperformance, and thus we believe the opportunities provided by
quality stocks remain attractive.
*Source: Morningstar, total return, income reinvested, no initial charge, income (inc-2) share class, net of fees in GBP.
**Index (MSCI*** All Countries World NR Index) and peer group sector average (Investment Association Global sector) shown for
performance comparison purposes only.
***Source: MSCI. The MSCI data is comprised of a custom index calculated by MSCI for, and as requested by, Investec Asset Management
Limited. The MSCI data is for internal use only and may not be redistributed or used in connection with creating or offering any securities,
fi nancial products or indices. Neither MSCI nor any other third party involved in or related to compiling, computing or creating the MSCI
data (the “MSCI Parties’) makes any express or implied warranties or representations with respect to such data (or the results to be
obtained by the use thereof), and the MSCI Parties hereby expressly disclaim all warranties of originality, accuracy, completeness,
merchantability or fi tness for a particular purpose with respect to such data. Without limiting any of the foregoing, in no event shall any of
the MSCI Parties have any liability for any direct, indirect, special, punitive, consequential or any other damages (including lost profi ts) even
if notifi ed of the possibility of such damages.
The opinions expressed herein are as at end of November 2018.

REPORT AND ACCOUNTS
Investec Funds Series iv 19
Risk and Reward profi le*
Lower risk Higher risk
Potentially lower rewards Potentially higher rewards
1 765432
This indicator is based on historical data and may not be a reliable indication of the future risk profi le of the Fund. The risk
and reward category shown is not guaranteed to remain unchanged and may shift over time. The lowest category does not
mean ‘risk free’.
The value of your investment and any income from it can fall as well as rise and you are not certain of making profi ts; losses
may be made.
The Fund appears towards the middle of the Risk and Reward Indicator scale. This is because it invests in the shares of
companies, whose values tend to fl uctuate more widely.
The following risks may not be fully captured by the Risk and Reward Indicator:
Charges from capital: Expenses are charged to the capital account, so capital will be reduced and any income
payments will be increased to an equivalent extent. This could constrain future capital and income growth. Income may be
taxable.
Concentrated portfolio: The portfolio invests in a relatively small number of individual holdings. This may mean wider
fl uctuations in value than more broadly invested portfolios.
Currency exchange: Changes in the relative values of different currencies may adversely affect the value of investments
and any related income.
Equity investment: The value of equities (e.g. shares) and equity-related investments may vary according to company
profi ts and future prospects as well as more general market factors. In the event of a company default (e.g. bankruptcy), the
owners of their equity rank last in terms of any fi nancial payment from that company.
*The Risk and Reward profi le is taken from the Key Investor Information Document. Please note that, the Risk and Reward profi le section is
based on Sterling ‘I’ Class Accumulation shares.
The full list of the Fund’s risks are contained in Appendix VII of the Investec Funds Series Omnibus prospectus.
REPORT AND ACCOUNTS
Investec Funds Series iv20
Summary of the Fund’s investment objective and policy
The Fund aims to provide income and long-term capital growth.
The Fund invests around the world primarily in the shares of companies and currently uses a value-based, contrarian
approach (investing in companies seen as undervalued where market sentiment is believed to be generally weak) in selecting
investments.
The Fund may invest in other assets such as cash, other funds and derivatives (fi nancial contracts whose value is linked to
the price of an underlying asset).
The Investment Manager is free to choose how the Fund is invested and does not manage it with reference to an index.
Performance record
6 months
(%)
Investec Global Special Situations Fund ‘I’ accumulation shares -6.79*
Performance comparison index 1.52**
Peer group sector average -1.26**
Past performance is not a good indicator of future results, losses may be made.
Performance review
The Fund delivered a negative return during the period under review, underperforming its performance comparison index
and peer group sector average.
Factors helping performance
It wasn’t all doom and gloom as there were pockets of good performance which included diversifi ed fi nancials and retailers.
At a stock level, agricultural equipment company Deere performed well after reporting quarterly results which were
reasonably well-received despite missing estimates, as its outlook allayed concerns that China’s retaliatory tariffs on
American crops could kill demand for new equipment. The fi rm’s outlook is predicated on continued demand growth, albeit
at a slowing rate, which analysts regard as being conservative given the political and trade backdrop.
Advance Autoparts also reported results in November and rose 11% on the day (and indeed the month). The fi rm continues
to talk about closing the margin gap to peers (peers are enjoying stronger margins currently). If it continues to make progress
in this area, coupled with its strong balance sheet, the company could potentially free up hundreds of millions of dollars in
excess cash, which would be hugely benefi cial.
Our position in US fi nancial services fi rm American Express was a strong contributor over the period. Its latest results update
contained numerous encouraging trends, including accelerating revenue growth, industry-leading loan growth, best in-class
credit, and positive operating leverage on the back of a high level of cost effi ciency.
Factors hindering performance
The Fund underperformed over the period, and especially over the last two months, for a number of reasons. The market
seems to be pricing in a recession (based on current valuations) in a number of sectors. In some sectors and countries, such
as UK domestic sectors, auto suppliers and many emerging markets, the predicted recession appears quite severe. This has
made investors in these sectors very skittish. In addition to this negative sentiment, a number of our stocks had profi t
Global Special Situations Fund

REPORT AND ACCOUNTS
Investec Funds Series iv 21
downgrades recently. We tend to hold several recovery stories and turn-arounds, and these are never achieved in a straight
line. Because of this, seeing profi t warnings in our portfolio is not all that unusual, and when it happens we normally spend
some time to make sure that our original thesis hasn’t changed. None of the recent profi t warnings caused us to change our
investment case in any of the holdings.
What has been unusual is the share price impact of these warnings. Examples have been Welbilt (professional kitchen
equipment) and Conduent (IT outsourcing), two businesses whose industries we consider to be both predictable and not
particularly cyclical (follow the typical market cycle), and whose valuations we consider cheap. Each issued relatively minor
profi t warnings early in November, but their stocks dropped over 30%+ in a matter of days. This move is impossible to relate
to the fundamentals of the businesses, or to the content of the announcements. The conclusion seems to be that investors
are extremely nervous given all that’s going on in the world – US and China trade wars, global growth concerns, China’s
slowing economy and the US Federal Reserve’s monetary policy schedule. It appears that in this climate investors are
reacting very badly to anything but perfect news.
Portfolio activity
Signifi cant purchases
Cielo, Bank of America, TAV Havalimanlari, Deere & Co, SKF; Citigroup; Delphi Technologies; Welbilt; Capita; Conduent
Signifi cant sales
Microsoft; Vistra Energy; Centrica; WorleyParsons; Advance Auto Parts; NOW; Jefferies Financial; Forterra; Rolls-Royce
‘C’ Shares; National Oilwell Varco.
Outlook
It seems to us that we are in a situation where investors are extremely pessimistic on a number of stocks and sectors, and
that no valuation is low enough for them to buy. We already owned several stocks we thought were cheap, and many of
them have become signifi cantly cheaper. So what to make of all this? While the short-term impacts of these share price
collapses can feel very uncomfortable, and there will always be some instances where the relevant businesses’ prospects
have taken a turn for the worst, by and large this kind of irrational selling without justifi cation is what we feed on as patient
value investors, and so the recent sell-off of seemingly all things cyclical has presented us with some very attractive
opportunities to add to existing positions and initiate new ones. This is not the only time we have underperformed by large
amounts in a short space of time. It happened in early 2016 (mining and oil downturn) and in June 2016 (Brexit vote). On both
occasions the Fund bounced back. So while we stop short of saying a recovery is guaranteed, we can’t help but feel that
given the very low current valuations, and the rather arbitrary reasons for the initial sell-offs, we remain confi dent that
numerous stocks within the portfolio could easily recover.
*Source: Morningstar, total return, income reinvested, no initial charge, accumulation (acc) share class, net of fees in GBP.
**Index (MSCI*** All Countries World NR Index) and peer group sector average (Investment Association Global sector) shown for
performance comparison purposes only.
***Source: MSCI. The MSCI data is comprised of a custom index calculated by MSCI for, and as requested by, Investec Asset Management
Limited. The MSCI data is for internal use only and may not be redistributed or used in connection with creating or offering any securities,
fi nancial products or indices. Neither MSCI nor any other third party involved in or related to compiling, computing or creating the MSCI
data (the “MSCI Parties’) makes any express or implied warranties or representations with respect to such data (or the results to be
obtained by the use thereof), and the MSCI Parties hereby expressly disclaim all warranties of originality, accuracy, completeness,
merchantability or fi tness for a particular purpose with respect to such data. Without limiting any of the foregoing, in no event shall any of
the MSCI Parties have any liability for any direct, indirect, special, punitive, consequential or any other damages (including lost profi ts) even
if notifi ed of the possibility of such damages.
The opinions expressed herein are as at end of November 2018.

REPORT AND ACCOUNTS
Investec Funds Series iv22
Risk and Reward profi le*
Lower risk Higher risk
Potentially lower rewards Potentially higher rewards
1 765432
This indicator is based on historical data and may not be a reliable indication of the future risk profi le of the Fund. The risk
and reward category shown is not guaranteed to remain unchanged and may shift over time. The lowest category does not
mean ‘risk free’.
The value of your investment and any income from it can fall as well as rise and you are not certain of making profi ts; losses
may be made.
The Fund appears towards the middle of the Risk and Reward Indicator scale. This is because it invests in the shares of
companies whose values tend to fl uctuate more widely.
The following risks may not be fully captured by the Risk and Reward Indicator:
Currency exchange: Changes in the relative values of different currencies may adversely affect the value of investments
and any related income.
Equity investment: The value of equities (e.g. shares) and equity-related investments may vary according to company
profi ts and future prospects as well as more general market factors. In the event of a company default (e.g. bankruptcy), the
owners of their equity rank last in terms of any fi nancial payment from that company.
*The Risk and Reward profi le is taken from the Key Investor Information Document. Please note that, the Risk and Reward profi le section is
based on Sterling ‘I’ Class Accumulation shares.
The full list of the Fund’s risks are contained in Appendix VII of the Investec Funds Series Omnibus prospectus.

REPORT AND ACCOUNTS
Investec Funds Series iv 23
Multi-Asset Protector Fund
Summary of the Fund’s investment objective and policy
The Fund aims to provide long-term capital growth and provide protection (the minimum amount you can expect to get back
from your investment) at 80% of the Fund’s highest ever share price.
The Fund invests around the world in shares of companies (up to 85%); bonds (contracts to repay borrowed money which
typically pay interest at fi xed times); property; commodities; cash (up to 100%); derivatives (fi nancial contracts whose value is
linked to the price of an underlying asset); and other eligible asset classes.
Investment may be directly in the assets themselves (excluding property and commodities) or indirectly through other funds
(up to 100%).
The Fund aims to provide the 80% protection by gradually switching from the investment portfolio to a cash portfolio when
markets fall. As a further level of security the Fund will invest in a derivative contract with a single counterparty. Where this
arrangement fails to support the protection level, the Fund will only be relying on its cash allocation policy to provide the
protection.
The costs of providing the protection are between 0.15-0.5% and are charged to the Fund. These costs are in addition to the
ongoing charge set out in the charges section.
The Investment Manager is free to choose how the Fund is invested and does not manage it with reference to an index.
Performance record
6 months
(%)
Investec Multi-Asset Protector Fund ‘A’ accumulation shares -2.30*
Performance comparison index Not applicable**
Peer group sector average Not applicable**
Past performance is not a good indicator of future results, losses may be made.
Performance review
The Fund delivered a negative return over the period.
Factors helping performance
The Fund’s exposure to foreign currencies, primarily US dollar, Japanese yen and Hong Kong dollar, aided performance over
the period as sterling depreciated against the majority of other major currencies due to concerns around the future path of
and risks around Brexit. We maintain close to 10% of the Fund in foreign currencies.
In bonds, a position in short-dated gilts added to performance as both domestic and international growth began to show
signs of weakness, leading to a decline in gilt yields. We maintain the Fund’s exposure to gilts.
Our positions in infrastructure appreciated strongly after rallying back from a period of underperformance caused by
increasing uncertainty around government private fi nance initiatives. We continue to believe that these are high quality assets
and maintain the exposure.

REPORT AND ACCOUNTS
Investec Funds Series iv24
Factors hindering performance
The Fund’s allocation to a diversifi ed basket of high quality companies that can consistently compound returns through time
detracted over the period as broader equity markets declined sharply. Despite recent weakness we maintain confi dence in
this position over the medium term.
Our holding in US 30-year treasuries detracted modestly from performance over the period as bond yields rose (moving
inversely to prices – which fell). We continue to believe that longer-dated US treasuries represent the best opportunity within
developed market government bonds and are cheap relative to our estimate of fair value, while also providing diversifying
characteristics. We maintain this allocation as a result.
Positioning in emerging market equities made a negative contribution over the period. We maintain this position due to our
belief that supply-side reform (attempts to increase productivity of labour) in China should be supportive of the asset class
over a medium-term horizon.
Portfolio activity
Signifi cant purchases
iShares Core MSCI Emerging Markets UCITS ETF; Vanguard S&P 500 UCITS ETF; Investec GSF Asian Equity Fund; Investec
GSF Emerging Markets Fund; Investec GSF Global Endurance Equity Fund; KB Home; TRI Pointe; NVR; PulteGroup; DR
Horton.
Signifi cant sales
iShares USD Treasury Bond 20 Years UCITS ETF; Investec GSF Global Endurance Equity Fund; iShares MSCI Japan UCITS
ETF; iShares MSCI Emerging Markets UCITS ETF; Investec Global Equity Fund; Investec UK Alpha Fund; iShares Core MSCI
Emerging Markets UCITS ETF; iShares Core FTSE 100 UCITS ETF; Vanguard S&P 500 UCITS ETF; Investec UK Smaller
Companies Fund.
Outlook
The strategy is positioned with a cautious bias. The major fi nancial market benefi ts or tailwinds of this cycle (money printing
and low interest rates) have been transitioning into headwinds and this is beginning to impact fi nancial markets more broadly,
while the risk of a US recession on an 18-month horizon is beginning to rise. Against this backdrop valuations in US equity
and credit markets are relatively elevated. As a result, the strategy remains biased towards an underweight equity position
with a healthy cash allocation that we will look to deploy into investment opportunities as and when they emerge.
*Source: Morningstar, total return, income reinvested, no initial charge, accumulation (acc) share class, net of fees in GBP.
**For this Fund, there is no applicable index or peer group sector average against which to measure performance. The Fund’s performance
target is to exceed 5% p.a. gross of fees over rolling fi ve-year periods. Performance targets are subject to change and may not be
achieved, losses may be made.
The opinions expressed herein are as at end of November 2018.

REPORT AND ACCOUNTS
Investec Funds Series iv 25
Risk and Reward profi le*
Lower risk Higher risk
Potentially lower rewards Potentially higher rewards
1 765432
This indicator is based on historical data and may not be a reliable indication of the future risk profi le of the Fund. The risk
and reward category shown is not guaranteed to remain unchanged and may shift over time. The lowest category does not
mean ‘risk free’.
The value of your investment and any income from it can fall as well as rise and you are not certain of making profi ts; losses
may be made.
The Fund appears towards the middle of the risk and reward indicator scale. This is because the mix of assets it invests in
tends to produce returns which fl uctuate more than those of cash funds but less than those of funds which solely invest in
the shares of companies.
The following risks may not be fully captured by the Risk and Reward Indicator:
Currency exchange: Changes in the relative values of different currencies may adversely affect the value of investments
and any related income.
Derivative counterparty: A counterparty to a derivative transaction may fail to meet its obligations thereby leading to
fi nancial loss.
Derivatives: The use of derivatives is not intended to increase the overall level of risk. However, the use of derivatives may
still lead to large changes in value and includes the potential for large fi nancial loss.
Equity investment: The value of equities (e.g. shares) and equity-related investments may vary according to company
profi ts and future prospects as well as more general market factors. In the event of a company default (e.g. bankruptcy), the
owners of their equity rank last in terms of any fi nancial payment from that company.
Fund closure: Where the Fund is unable to fi nd a suitable counterparty to enable at least 80% of the value of the Fund to
be protected or where only allocation to cash is feasible, the Fund may have to be closed with the proceeds returned to
investors.
Government securities exposure: The portfolio may invest more than 35% of its assets in government securities
issued or guaranteed by a permitted single state.
Interest rate: The value of fi xed income investments (e.g. bonds) tends to decrease when interest rates and/or infl ation
rises.
Large cash holding: There is a risk that the Fund may hold large proportions of cash for considerable periods of time.
This may lead to the Fund underperforming those markets where it is usually expected to invest.
Protected value: Whilst the Fund will endeavour to protect at least 80% of its value at all times this is not guaranteed.
*The Risk and Reward profi le is taken from the Key Investor Information Document. Please note that, the Risk and Reward profi le section is
based on Sterling ‘A’ Class Accumulation shares.
The full list of the Fund’s risks are contained in Appendix VII of the Investec Funds Series Omnibus prospectus.

REPORT AND ACCOUNTS
Investec Funds Series iv26
Summary of the Fund’s investment objective and policy
The Fund aims to provide long-term capital growth and provide protection (the minimum amount you can expect to get back
from your investment) at 80% of the Fund’s highest ever share price.
The Fund invests around the world in shares of companies (up to 85%); bonds (contracts to repay borrowed money which
typically pay interest at fi xed times); property; commodities; cash (up to 100%); derivatives (fi nancial contracts whose value is
linked to the price of an underlying asset); and other eligible asset classes.
Investment may be directly in the assets themselves (excluding property and commodities) or indirectly through other funds
(up to 100%).
The Fund aims to provide the 80% protection by gradually switching from the investment portfolio to a cash portfolio when
markets fall. As a further level of security the Fund will invest in a derivative contract with a single counterparty. Where this
arrangement fails to support the protection level, the Fund will only be relying on its cash allocation policy to provide the
protection.
The costs of providing the protection are between 0.15-0.5% and are charged to the Fund. These costs are in addition to the
ongoing charge set out in the charges section.
The Investment Manager is free to choose how the Fund is invested and does not manage it with reference to an index.
Performance
6 months
(%)
Investec Multi-Asset Protector Fund 2 ‘I’ accumulation shares -1.88*
Performance comparison index Not applicable**
Peer group sector average Not applicable**
Past performance is not a reliable indicator of future results, losses may be made.
Performance review
The Fund delivered a negative return over the period.
Factors helping performance
The Fund’s exposure to foreign currencies, primarily US dollar, Japanese yen and Hong Kong dollar, aided performance over
the period as sterling depreciated against the majority of other major currencies due to concerns around the future path of
and risks around Brexit. We maintain close to 10% of the Fund in foreign currencies.
In bonds, a position in short-dated gilts added to performance as both domestic and international growth began to show
signs of weakness, leading to a decline in gilt yields. We maintain the Fund’s exposure to gilts.
Our positions in infrastructure appreciated strongly after rallying back from a period of underperformance caused by
increasing uncertainty around government private fi nance initiatives. We continue to believe that these are high quality assets
and maintain the exposure.
Multi-Asset Protector Fund 2

REPORT AND ACCOUNTS
Investec Funds Series iv 27
Factors hindering performance
The Fund’s allocation to a diversifi ed basket of high quality companies that can consistently compound returns through time
detracted over the period as broader equity markets declined sharply. Despite recent weakness we maintain confi dence in
this position over the medium term.
Our holding in US 30-year treasuries detracted modestly from performance over the period as bond yields rose (moves
inversely to prices – which fell). We continue to believe that longer-dated US treasuries represent the best opportunity within
developed market government bonds and are cheap relative to our estimate of fair value, while also providing diversifying
characteristics. We maintain this allocation as a result.
Positioning in emerging market equities made a negative contribution over the period. We maintain this position due to our
belief that supply-side reform (attempts to increase productivity of labour) in China should be supportive of the asset class
over a medium-term horizon.
Portfolio activity
Signifi cant purchases
iShares MSCI Emerging Markets UCITS ETF; Vanguard S&P 500 UCITS ETF; Investec GSF Asian Equity Fund; Investec GSF
All China Equity Fund; iShares UK Gilts 0-5 Years UCITS ETF; Investec GSF Emerging Markets Corporate Debt Fund; iShares
USD Treasury Bond 20 Years UCITS ETF; New Capital Wealthy Nations Bond Fund (GBP); KB Home; TRI Pointe.
Signifi cant sales
iShares USD Treasury Bond 20 Years UCITS ETF; iShares MSCI Japan UCITS ETF; Investec GSF Global Endurance Equity
Fund; iShares MSCI Emerging Markets UCITS ETF; Vanguard S&P 500 UCITS ETF; Investec Global Equity Fund; iShares
Core FTSE 100 UCITS ETF; Investec UK Alpha Fund; iShares Core MSCI Emerging Markets UCITS ETF; Dr Pepper Snapple.
Outlook
The strategy is positioned with a cautious bias. The major fi nancial market tailwinds of this cycle (money printing and low
interest rates) have been transitioning into headwinds and this is beginning to impact fi nancial markets more broadly, while
the risk of a US recession on an 18-month horizon is beginning to rise. Against this backdrop valuations in US equity and
credit markets are relatively elevated. As a result, the strategy remains biased towards an underweight equity position with a
healthy cash allocation that we will look to deploy into investment opportunities as and when they emerge.
*Source: Morningstar, total return, income reinvested, no initial charge, accumulation (acc) share class, net of fees in GBP.
**For this Fund, there is no applicable index or peer group sector average against which to measure performance. The Fund’s performance
target is to exceed 5% p.a. gross of fees over rolling fi ve-year periods. Performance targets are subject to change and may not be
achieved, losses may be made.
The opinions expressed herein are as at end of November 2018.

REPORT AND ACCOUNTS
Investec Funds Series iv28
Risk and Reward profi le*
Lower risk Higher risk
Potentially lower rewards Potentially higher rewards
1 765432
This indicator is based on historical data and may not be a reliable indication of the future risk profi le of the Fund. The risk
and reward category shown is not guaranteed to remain unchanged and may shift over time. The lowest category does not
mean ‘risk free’.
The value of your investment and any income from it can fall as well as rise and you are not certain of making profi ts; losses
may be made.
The Fund appears towards the middle of the risk and reward indicator scale. This is because the mix of assets it invests in
tends to produce returns which fl uctuate more than those of cash funds but less than those of funds which solely invest in
the shares of companies.
The following risks may not be fully captured by the Risk and Reward Indicator:
Currency exchange: Changes in the relative values of different currencies may adversely affect the value of investments
and any related income.
Derivative counterparty: A counterparty to a derivative transaction may fail to meet its obligations thereby leading to
fi nancial loss.
Derivatives: The use of derivatives is not intended to increase the overall level of risk. However, the use of derivatives may
still lead to large changes in value and includes the potential for large fi nancial loss.
Equity investment: The value of equities (e.g. shares) and equity-related investments may vary according to company
profi ts and future prospects as well as more general market factors. In the event of a company default (e.g. bankruptcy), the
owners of their equity rank last in terms of any fi nancial payment from that company.
Fund closure: Where the Fund is unable to fi nd a suitable counterparty to enable at least 80% of the value of the Fund to
be protected or where only allocation to cash is feasible, the Fund may have to be closed with the proceeds returned to
investors.
Government securities exposure: The portfolio may invest more than 35% of its assets in government securities
issued or guaranteed by a permitted single state.
Interest rate: The value of fi xed income investments (e.g. bonds) tends to decrease when interest rates and/or infl ation
rises.
Large cash holding: There is a risk that the Fund may hold large proportions of cash for considerable periods of time.
This may lead to the Fund underperforming those markets where it is usually expected to invest.
Protected value: Whilst the Fund will endeavour to protect at least 80% of its value at all times this is not guaranteed.
*The Risk and Reward profi le is taken from the Key Investor Information Document. Please note that, the Risk and Reward profi le section is
based on Sterling ‘I’ Class Accumulation shares.
The full list of the Fund’s risks are contained in Appendix VII of the Investec Funds Series Omnibus prospectus.

REPORT AND ACCOUNTS
Investec Funds Series iv 29
Target Return Bond Fund
Summary of the Fund’s investment objective and policy
The Fund aims to produce a positive return above overnight GBP LIBOR over rolling 3 year periods regardless of market
conditions by investing primarily in interest bearing assets and related derivatives. The Fund targets a return of overnight
GBP LIBOR +2.5% per annum over rolling 3 year periods. While the Fund aims to achieve a positive return and its
performance target, there is no guarantee either will be achieved over rolling three year periods or over any period of time.
There is no guarantee that all capital invested in the Fund will be returned.
The Fund invests around the world primarily in a wide range of bonds (contracts to repay borrowed money which typically
pay interest at fi xed times) issued by companies, institutions or governments and in their related derivatives (fi nancial
contracts whose value is linked to the price of an underlying asset). The Fund will not invest in shares or in their related
derivatives. Derivatives may be used in order to achieve the Fund’s investment objectives or for effi cient portfolio
management purposes e.g. with the aim of either managing the Fund risks or reducing the costs of managing the Fund.
Returns could be from income or growth or a combination of the two.
The Investment Manager is free to choose how the Fund is invested and does not manage it with reference to an index.
Performance
6 months
(%)
Investec Target Return Bond Fund ‘I’ accumulation shares -2.53*
Performance comparison index 0.22**
Peer group sector average Not applicable**
Past performance is not a reliable indicator of future results, losses may be made.
Total deemed income distributions per ‘I’ accumulation share
6 months to 30 November 2018 0.45 pence
6 months to 30 November 2017 0.86 pence
The deemed distribution for the 6 months to 30 November 2018 is lower than the comparable period last year. This is due to
changes in the investment allocation within the portfolio and a fall in the income being earned on these investments. The
amount of income payable may rise or fall.
Performance review
The Fund delivered a negative return and underperformed its performance comparison index during the period under review.
Factors helping performance
We have successfully invested in the Turkish lira over the review period, initially selling it in the expectation of a large fall and
then buying it back and going overweight once the Turkish authorities took credible steps to stabilise their currency. Our
government bond holdings have also added value, with an overweight positions in Israel enjoying a relatively high yield for
sterling based investors. Our position in longer-dated Swedish government bonds, relative to shorter dated – a so-called
yield curve fl attener – also performed well as markets began to anticipate the fi rst interest rate increase from the Riksbank
which led to short maturity bonds underperforming. Finally, we took profi ts on our short position to Italian bonds, which sold
off following the release of a fi scally lax budget.

REPORT AND ACCOUNTS
Investec Funds Series iv30
Factors hindering performance
Our short position in the Indian rupee detracted from performance as the sudden collapse in oil prices aided the Indian
economy and lent support to their currency. Our long standing position in the Japanese yen also hurt performance. There
were also negative impacts from exposure to the Chinese renminbi, which fell over the review period as well as a long in the
Canadian dollar, which also depreciated. In bonds, the main negative contributor came from a short position in a basket of
advanced economy bonds, which detracted as yields fell (prices rose – moves inversely to yield) in October. These losses
were offset by a small position in US 5-year government bonds relative to German 5-year government bonds, which made
new multi-decade highs, refl ecting the extraordinary difference between US and euro-zone interest rates.
Portfolio activity
Signifi cant purchases
Israel Government Bond 1.25% 30/11/2022; United States Treasury Note 2.75% 31/07/2023; Bundesrepublik Deutschland
Bundesanleihe 0.25% 15/02/2027; Republic of South Africa Government Bond 10.5% 21/12/2026; Citibank 3.4% 23/07/2021;
UBS 2.45% 01/12/2020; Santander UK 2.125% 03/11/2020; Morgan Stanley (FRN) 3.88738% 24/10/2023; Wells Fargo Bank
3.625% 22/10/2021; Bank of America (FRN) 0.383% 25/04/2024.
Signifi cant sales
Canadian Government Bond 1.25% 01/02/2020; Canadian Government Bond 1.5% 01/03/2020; United States Treasury Note
2.75% 31/07/2023; Israel Government Bond 1.25% 30/11/2022; United Kingdom Treasury 4.25% 07/12/2027; United States
Treasury Note 3% 15/05/2047; Republic of South Africa Government Bond 10.5% 21/12/2026; United States Treasury
Note 3% 15/05/2047; Bundesrepublik Deutschland Bundesanleihe 0.25% 15/02/2027; Indonesia Treasury Bond 8.25%
15/05/2036.
Outlook
Downside risks to global growth are increasing. Although recession risks still appear low for 2019, monetary and trade
policies have become more restrictive. For emerging markets, there are potential positives from a less hawkish US Federal
Reserve, as well as some willingness to negotiate on trade. US government bonds are beginning to price in the end of the
cycle and adding duration into weakness is becoming attractive. The dollar’s fortunes will probably depend on whether
growth divergence persists with the rest of the world.
*Source: Morningstar, total return, income reinvested, no initial charge, accumulation (acc) share class, net of fees in GBP.
**Index (FTSE All-Share Index) shown for performance comparison purposes only. For this Fund, there is no relevant peer group sector
average against which to measure performance.
The opinions expressed herein are as at end of November 2018.

REPORT AND ACCOUNTS
Investec Funds Series iv 31
Risk and Reward profi le*
Lower risk Higher risk
Potentially lower rewards Potentially higher rewards
1 765432
This indicator is based on historical data and may not be a reliable indication of the future risk profi le of the Fund. The risk
and reward category shown is not guaranteed to remain unchanged and may shift over time. The lowest category does not
mean ‘risk free’.
The value of your investment and any income from it can fall as well as rise and you are not certain of making profi ts; losses
may be made.
The Fund appears towards the lower end of the Risk and Reward Indicator scale. This is because it invests in bonds whose
returns tend to fl uctuate more than those of cash funds but less than those of funds which invest in the shares of companies.
The following risks may not be fully captured by the Risk and Reward Indicator:
Currency exchange: Changes in the relative values of different currencies may adversely affect the value of investments
and any related income.
Default: There is a risk that the issuers of fi xed income investments (e.g. bonds) may not be able to meet interest payments
nor repay the money they have borrowed. The worse the credit quality of the issuer, the greater the risk of default and
therefore investment loss.
Derivative counterparty: A counterparty to a derivative transaction may fail to meet its obligations thereby leading to
fi nancial loss.
Derivatives: The use of derivatives may increase overall risk by magnifying the effect of both gains and losses. This may
lead to large changes in value and potentially large fi nancial loss.
Developing market: These markets carry a higher risk of fi nancial loss than more developed markets as they may have
less developed legal, political, economic or other systems.
Government securities exposure: The portfolio may invest more than 35% of its assets in government securities
issued or guaranteed by a permitted single state.
Interest rate: The value of fi xed income investments (e.g. bonds) tends to decrease when interest rates and/or infl ation
rises.
*The Risk and Reward profi le is taken from the Key Investor Information Document. Please note that, the Risk and Reward profi le section is
based on Sterling ‘I’ Class Accumulation shares.
The full list of the Fund’s risks are contained in Appendix VII of the Investec Funds Series Omnibus prospectus.

REPORT AND ACCOUNTS
Investec Funds Series iv32
Summary of the Fund’s investment objective and policy
The Fund aims to provide long-term capital growth.
While the Fund aims to achieve a positive return this is not guaranteed over any period of time, and you may get back less
than you invested.
The Fund invests primarily in equities (e.g. shares of companies) and related derivatives (fi nancial contracts whose value is
linked to the price of an underlying asset). At least 80% of the Fund’s equity investments will be priced in sterling.
The Fund seeks to achieve its objectives by holding investments which, in combination, are considered over the long term to
offer a level of risk lower than that of the FTSE All-Share Index (an index representing a broad spread of companies listed on
the London Stock Exchange).
The Investment Manager is free to choose how the Fund is invested and does not manage it with reference to an index.
Performance
6 months
(%)
Investec UK Total Return Fund ‘I’ accumulation shares -3.69*
Performance comparison index -7.68**
Peer group sector average Not applicable**
Past performance is not a reliable indicator of future results, losses may be made.
Performance review
The Fund delivered a negative return but outperformed the performance comparison index during the period under review.
Factors helping performance
The Fund holds a short futures position in UK equities to reduce its effective exposure to moves in UK stock market. It is
designed so that when the market falls, these instruments should mitigate any losses the Fund suffers on its holdings in UK
companies. This was the case in the period under the review as the UK stock market performed poorly, due to Brexit and
concerns over global growth and liquidity.
Our exposure to US equities was profi table during the period, with Signet Jewelers making the largest contribution to Fund
performance over the last six months. Following signifi cant share price weakness, we invested in Signet back in 2016,
believing that it was a decent business, with enviable market positions and one whose prospects the market was
fundamentally undervaluing. We did, though, harbour growing concerns that the company’s management were pursuing the
wrong strategy and destroying shareholder value. The belief that the shares were undervalued predominated, but following a
strong rally in the share price around the middle of 2018 we decided to exit our position. This was an unusual sale for us, as
we continue to believe that the shares are potentially very cheap, but the on-going question marks we have over the
management team may well prevent the inherent value being realised.
Advanced Auto Parts (AAP) was another US retail success story for the portfolio during the period. We bought into AAP at
the end of 2017 and it has consistently reported better-than-expected earnings fi gures since then. The market has
responded by re-rating the shares sharply upwards, with the shares approximately doubling since purchase, such that much
of the group’s discount against its peers has disappeared. With this in mind we closed our position in the stock.
UK Total Return Fund

REPORT AND ACCOUNTS
Investec Funds Series iv 33
Factors hindering performance
The Fund’s exposure to UK equities through individual stock holdings was the main reason for the negative performance, but
given the performance of the UK market as whole, this was to be expected. The housing market has endured a particularly
tough time and estate agent, Countrywide, was the leading detractor over the period. Outsourcing company, Capita, was
also a signifi cant drag on performance.
Shares in Countrywide sold off back in July when management was forced to raise additional equity funding. We continue to
believe there is a perfectly decent business there and that the new management team are making progress towards righting
the wrongs committed by the previous regime. Central costs have been cut, with head offi ce costs reduced by a third, while
staffi ng levels in customer-facing sales & lettings roles have been increased. The housing market cycle will eventually turn,
it’s what cycles do, and we believe the structural threat posed by online estate agents is overplayed. Online-only operators
are struggling to make profi table headway, with the recent collapse of Emoov, the second largest online estate agent,
attesting to this.
Having performed strongly in the earlier part of 2018, Capita shares slipped back a little and the large size of the holding
means that it was the second-largest drag on the Fund. The shares sold-off in August following their fi rst-half results. One
gets the sense that following the strong share price rally, the market needed more good news, but none was forthcoming,
with fi rst-half profi t merely in line with expectations and there was no upgrade to the full-year number. Of slightly more
concern was the weakness in free cash fl ow in the fi rst-half and the forward guidance on revenue was also open to adverse
interpretation. There is no real change to the investment case, we continue to believe that the shares are cheap but, as
previously observed, there will inevitably be bumps along the road to recovery.
Portfolio activity
Signifi cant purchases
United Kingdom Gilt 2% 22/07/2020; Travis Perkins; Tullett Prebon; Countrywide; Delphi Technologies; Lloyds Banking;
Royal Bank of Scotland; Forterra; Carpetright; McCarthy & Stone.
Signifi cant sales
United Kingdom Gilt 1.25% 22/07/2018; Advance Auto Parts; Helical; Centrica; Signet Jewelers; Lloyds Banking; Games
Workshop; QinetiQ; Japan Airlines; Chemring.
Outlook
Following a period of pronounced weakness, during which it signifi cantly lagged global indices, the UK equity market is
starting to look quite attractive. Across many valuation metrics including price to earnings ratio (P/E), price to book multiple
(P/B) or dividend yield, the UK equity market is not expensive against historic norms. Moreover, there are some real pockets
of cheap stocks emerging. The reason for the UK’s relative underperformance is, of course, the dreaded ‘B-word’. More
specifi cally, uncertainty around the UK government’s position during the Brexit process has led the market to conclude that
a very bad outcome is on the cards. We continue to believe that some semblance of common sense will prevail. If so, the UK
market in general, and our portfolio in particular, could prove to be well positioned to benefi t.
*Source: Morningstar, total return, income reinvested, no initial charge, accumulation (acc) share class, net of fees in GBP.
**Index (FTSE All-Share Index) shown for performance comparison purposes only. For this Fund, there is no relevant peer group sector
against which to measure performance.
The opinions expressed herein are as at end of November 2018.

REPORT AND ACCOUNTS
Investec Funds Series iv34
Risk and Reward profi le*
Lower risk Higher risk
Potentially lower rewards Potentially higher rewards
1 765432
This indicator is based on historical data and may not be a reliable indication of the future risk profi le of the Fund. The risk
and reward category shown is not guaranteed to remain unchanged and may shift over time. The lowest category does not
mean ‘risk free’.
The value of your investment and any income from it can fall as well as rise and you are not certain of making profi ts; losses
may be made.
The Fund appears towards the middle of the risk and reward indicator scale. This is because the mix of assets it invests in
tends to produce returns which fl uctuate more than those of cash funds but less than those of funds which solely invest in
the shares of companies.
The following risks may not be fully captured by the Risk and Reward Indicator:
Equity investment: The value of equities (e.g. shares) and equity-related investments may vary according to company
profi ts and future prospects as well as more general market factors. In the event of a company default (e.g. bankruptcy), the
owners of their equity rank last in terms of any fi nancial payment from that company.
Geographic / Sector: Investments may be primarily concentrated in specifi c countries, geographical regions and/or
industry sectors. This may mean that the resulting value may decrease whilst portfolios more broadly invested might grow.
*The Risk and Reward profi le is taken from the Key Investor Information Document. Please note that, the Risk and Reward profi le section is
based on Sterling ‘I’ Class Accumulation shares.
The full list of the Fund’s risks are contained in Appendix VII of the Investec Funds Series Omnibus prospectus.

35Investec Funds Series iv
REPORT AND ACCOUNTS
MARKET PERCENTAGE VALUE OF NET ASSETSASSET HOLDING (£’000) (%)
COLLECTIVE INVESTMENT SCHEMES 3.35% (31.05.18: 3.40%)INFRASTRUCTUREHICL Infrastructure 19,527,519 31,596 1.39
3i Infrastructure 11,981,482 30,571 1.34
BBGI SICAV 9,094,342 14,005 0.62 –––––––––––––––––––––––––––––––––––––––––– 76,172 3.35 –––––––––––––––––––––––––––––––––––––––––CORPORATE BONDS 2.13% (31.05.18: 2.80%)Tenet Healthcare 6% 01/10/2020 USD 3,000,000 2,402 0.11
HCA 4.75% 01/05/2023 USD 2,550,000 1,995 0.09
Equinix 2.875% 15/03/2024 EUR 1,846,000 1,653 0.07
Open Text 5.875% 01/06/2026 USD 2,100,000 1,637 0.07
Belden 2.875% 15/09/2025 EUR 1,900,000 1,637 0.07
United 4.875% 01/07/2024 EUR 1,860,000 1,626 0.07
Iron Mountain US 5.375% 01/06/2026 USD 2,200,000 1,602 0.07
IQVIA 3.5% 15/10/2024 EUR 1,770,000 1,601 0.07
Dell International 6.02% 15/06/2026 USD 2,000,000 1,586 0.07
Cott 5.5% 01/07/2024 EUR 1,700,000 1,582 0.07
WMG Acquisition 4.125% 01/11/2024 EUR 1,710,000 1,579 0.07
MPT Operating Partnership 5.5% 01/05/2024 USD 1,970,000 1,556 0.07
CCO 5.125% 01/05/2023 USD 2,000,000 1,555 0.07
Vantiv 3.875% 15/11/2025 GBP 1,620,000 1,548 0.07
Chesapeake Energy (FRN) 5.68631% 15/04/2019 USD 1,963,000 1,539 0.07
Reynolds 7% 15/07/2024 USD 1,950,000 1,529 0.07
IHO Verwaltungs 3.75% 15/09/2026 EUR 1,600,000 1,375 0.06
Constellium 6.625% 01/03/2025 USD 1,800,000 1,345 0.06
Virgin Media Secured Finance 5.125% 15/01/2025 GBP 1,200,000 1,205 0.05
KB Home 8% 15/03/2020 USD 1,300,000 1,064 0.05
Kraton Polymers 5.25% 15/05/2026 EUR 1,265,000 1,037 0.05
HCA 5% 15/03/2024 USD 1,300,000 1,020 0.04
United States Steel 6.25% 15/03/2026 USD 1,390,000 1,004 0.04
InterXion 4.75% 15/06/2025 EUR 1,037,000 951 0.04
CPUK Finance 4.875% 28/02/2047 GBP 950,000 917 0.04
Catalent Pharma Solutions 4.75% 15/12/2024 EUR 1,000,000 912 0.04
Bausch Health 6.5% 15/03/2022 USD 1,100,000 889 0.04
DKT Finance 7% 17/06/2023 EUR 900,000 852 0.04
Nielsen Finance 5% 15/04/2022 USD 1,100,000 841 0.04
United States Steel 6.875% 15/08/2025 USD 1,110,000 825 0.04
Blitz F18-674 6% 30/07/2026 EUR 869,000 756 0.03
ARD Finance 6.625% 15/09/2023 EUR 850,000 736 0.03
TeamSystem (FRN) 4% 15/04/2023 EUR 810,000 719 0.03
Scientifi c Games International 10% 01/12/2022 USD 860,000 700 0.03
Paprec 4% 31/03/2025 EUR 880,000 689 0.03
Altice Financing 7.5% 15/05/2026 USD 930,000 684 0.03
AMC Entertainment 6.375% 15/11/2024 GBP 620,000 597 0.03
Arrow Global Finance (FRN) 2.875% 01/04/2025 EUR 613,000 503 0.02
Antero Midstream Partners 5.375% 15/09/2024 USD 530,000 406 0.02
ATF Netherlands 3.75% Perpetual (German Listing) EUR 400,000 332 0.01
Alpha 2 8.75% 01/06/2023 USD 433,333 330 0.01
Arqiva Broadcast Finance 6.75% 30/09/2023 GBP 275,000 277 0.01
Guala Closures (FRN) 3.5% 15/04/2024 EUR 312,000 276 0.01
Starfruit Finco 6.5% 01/10/2026 EUR 279,000 231 0.01
International Game Technology 4.75% 15/02/2023 EUR 200,000 189 0.01
ATF Netherlands 3.75% Perpetual (Ireland Listed) EUR 200,000 166 0.01 –––––––––––––––––––––––––––––––––––––––––– 48,455 2.13 –––––––––––––––––––––––––––––––––––––––––
Portfolio statement
As at 30 November 2018
Diversifi ed Growth Fund

REPORT AND ACCOUNTS
36 Investec Funds Series iv
Portfolio statement continued
As at 30 November 2018
MARKET PERCENTAGE VALUE OF NET ASSETSASSET HOLDING (£’000) (%)
GOVERNMENT BONDS 33.20% (31.05.18: 24.49%)Bundesrepublik Deutschland Government Bond 0.5% 15/02/2028 EUR 357,520,000 326,196 14.33
United States Treasury Bond 3% 15/05/2047 USD 427,848,100 316,148 13.89
New Zealand Government Bond 3% 20/04/2029 NZD 123,910,000 69,269 3.04
Republic of South Africa Government Bond 10.5% 21/12/2026 ZAR 708,868,000 44,093 1.94 –––––––––––––––––––––––––––––––––––––––––– 755,706 33.20 –––––––––––––––––––––––––––––––––––––––––BASIC MATERIALS 2.78% (31.05.18: 3.96%)CHEMICALSHexpol 781,869 5,440 0.24
DowDuPont 110,749 4,970 0.22
Mitsubishi Chemical 725,800 4,653 0.20 –––––––––––––––––––––––––––––––––––––––––– 15,063 0.66 –––––––––––––––––––––––––––––––––––––––––MININGRio Tinto 299,583 10,715 0.47
Glencore 3,368,298 9,755 0.43
Anglo American 493,616 7,779 0.34
South32 3,872,009 6,870 0.30
Boliden 388,803 6,832 0.30
BHP 416,237 6,303 0.28 –––––––––––––––––––––––––––––––––––––––––– 48,254 2.12 –––––––––––––––––––––––––––––––––––––––––CONSUMER GOODS 8.39% (31.05.18: 5.55%)AUTOMOBILES & PARTSLear 78,077 8,255 0.36
Honda Motor 277,900 6,141 0.27
Bridgestone 156,400 4,966 0.22
Aptiv 53,043 2,973 0.13
Adient 160,959 2,964 0.13
Delphi Technologies 156,744 2,071 0.09
Garrett Motion 13,691 124 0.01 –––––––––––––––––––––––––––––––––––––––––– 27,494 1.21 –––––––––––––––––––––––––––––––––––––––––BEVERAGESKirin 319,500 5,856 0.26
Britvic 614,706 5,191 0.23
Keurig Dr Pepper 120,969 2,559 0.11 –––––––––––––––––––––––––––––––––––––––––– 13,606 0.60 –––––––––––––––––––––––––––––––––––––––––HOUSEHOLD GOODS & HOME CONSTRUCTIONPulteGroup 581,308 12,187 0.54
DR Horton 398,487 11,666 0.51
Lennar 335,927 11,335 0.50
Taylor Morrison Home 775,798 10,297 0.45
NVR 5,236 10,133 0.45
KB Home 607,373 10,086 0.44
Tri Pointe 914,518 9,142 0.40
Sekisui Chemical 484,100 6,156 0.27 –––––––––––––––––––––––––––––––––––––––––– 81,002 3.56 –––––––––––––––––––––––––––––––––––––––––LEISURE GOODSBandai Namco 263,800 8,683 0.38
Sony 204,300 8,371 0.37
Hasbro 106,406 8,078 0.35
Nintendo 25,400 6,072 0.27
Thor Industries 66,386 3,441 0.15 –––––––––––––––––––––––––––––––––––––––––– 34,645 1.52 –––––––––––––––––––––––––––––––––––––––––PERSONAL GOODSUnilever 244,740 10,477 0.46
Estee Lauder 58,399 6,478 0.28
Kao 103,100 5,944 0.26
Moncler 143,799 3,691 0.16 –––––––––––––––––––––––––––––––––––––––––– 26,590 1.16 –––––––––––––––––––––––––––––––––––––––––
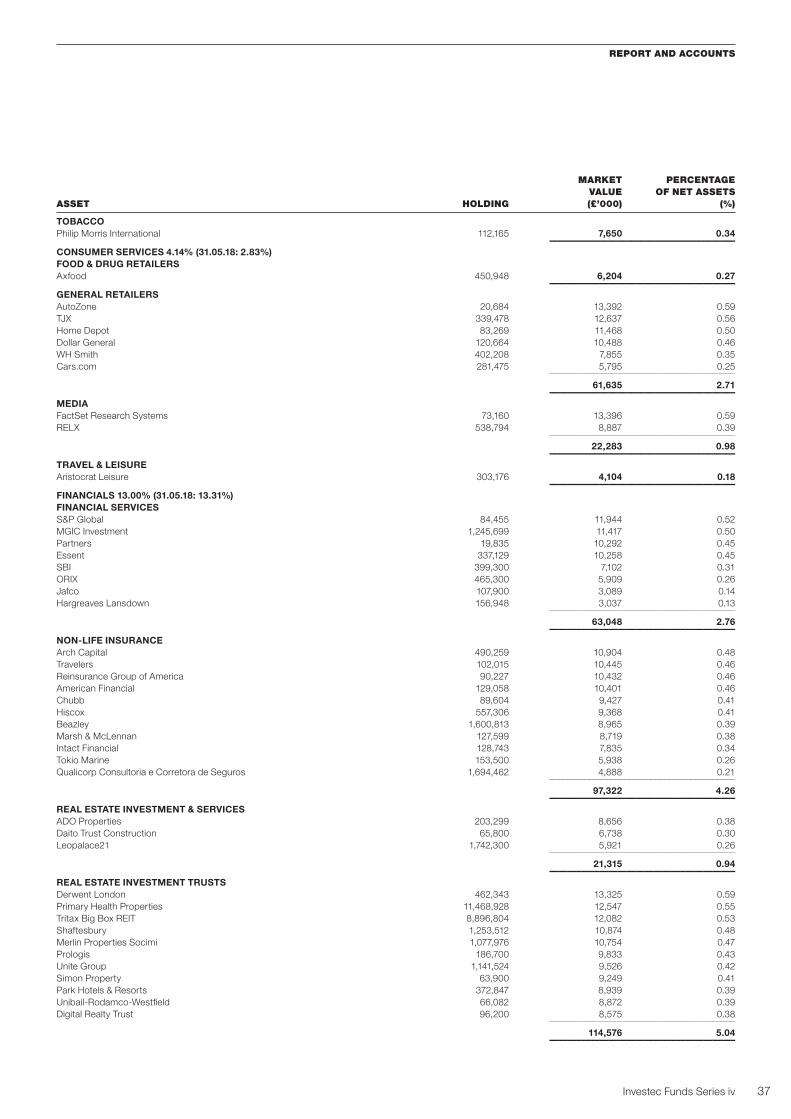
37Investec Funds Series iv
REPORT AND ACCOUNTS
MARKET PERCENTAGE VALUE OF NET ASSETSASSET HOLDING (£’000) (%)
TOBACCOPhilip Morris International 112,165 7,650 0.34 –––––––––––––––––––––––––––––––––––––––––CONSUMER SERVICES 4.14% (31.05.18: 2.83%)FOOD & DRUG RETAILERSAxfood 450,948 6,204 0.27 –––––––––––––––––––––––––––––––––––––––––GENERAL RETAILERSAutoZone 20,684 13,392 0.59
TJX 339,478 12,637 0.56
Home Depot 83,269 11,468 0.50
Dollar General 120,664 10,488 0.46
WH Smith 402,208 7,855 0.35
Cars.com 281,475 5,795 0.25 –––––––––––––––––––––––––––––––––––––––––– 61,635 2.71 –––––––––––––––––––––––––––––––––––––––––MEDIAFactSet Research Systems 73,160 13,396 0.59
RELX 538,794 8,887 0.39 –––––––––––––––––––––––––––––––––––––––––– 22,283 0.98 –––––––––––––––––––––––––––––––––––––––––TRAVEL & LEISUREAristocrat Leisure 303,176 4,104 0.18 –––––––––––––––––––––––––––––––––––––––––FINANCIALS 13.00% (31.05.18: 13.31%)FINANCIAL SERVICESS&P Global 84,455 11,944 0.52
MGIC Investment 1,245,699 11,417 0.50
Partners 19,835 10,292 0.45
Essent 337,129 10,258 0.45
SBI 399,300 7,102 0.31
ORIX 465,300 5,909 0.26
Jafco 107,900 3,089 0.14
Hargreaves Lansdown 156,948 3,037 0.13 –––––––––––––––––––––––––––––––––––––––––– 63,048 2.76 –––––––––––––––––––––––––––––––––––––––––NON-LIFE INSURANCEArch Capital 490,259 10,904 0.48
Travelers 102,015 10,445 0.46
Reinsurance Group of America 90,227 10,432 0.46
American Financial 129,058 10,401 0.46
Chubb 89,604 9,427 0.41
Hiscox 557,306 9,368 0.41
Beazley 1,600,813 8,965 0.39
Marsh & McLennan 127,599 8,719 0.38
Intact Financial 128,743 7,835 0.34
Tokio Marine 153,500 5,938 0.26
Qualicorp Consultoria e Corretora de Seguros 1,694,462 4,888 0.21 –––––––––––––––––––––––––––––––––––––––––– 97,322 4.26 –––––––––––––––––––––––––––––––––––––––––REAL ESTATE INVESTMENT & SERVICESADO Properties 203,299 8,656 0.38
Daito Trust Construction 65,800 6,738 0.30
Leopalace21 1,742,300 5,921 0.26 –––––––––––––––––––––––––––––––––––––––––– 21,315 0.94 –––––––––––––––––––––––––––––––––––––––––REAL ESTATE INVESTMENT TRUSTSDerwent London 462,343 13,325 0.59
Primary Health Properties 11,468,928 12,547 0.55
Tritax Big Box REIT 8,896,804 12,082 0.53
Shaftesbury 1,253,512 10,874 0.48
Merlin Properties Socimi 1,077,976 10,754 0.47
Prologis 186,700 9,833 0.43
Unite Group 1,141,524 9,526 0.42
Simon Property 63,900 9,249 0.41
Park Hotels & Resorts 372,847 8,939 0.39
Unibail-Rodamco-Westfi eld 66,082 8,872 0.39
Digital Realty Trust 96,200 8,575 0.38 –––––––––––––––––––––––––––––––––––––––––– 114,576 5.04 –––––––––––––––––––––––––––––––––––––––––

REPORT AND ACCOUNTS
38 Investec Funds Series iv
Portfolio statement continued
As at 30 November 2018
MARKET PERCENTAGE VALUE OF NET ASSETSASSET HOLDING (£’000) (%)
HEALTH CARE 1.65% (31.05.18: 1.88%)PHARMACEUTICALS & BIOTECHNOLOGYShionogi 204,100 10,558 0.47
Johnson & Johnson 75,323 8,612 0.38
Novo Nordisk 171,861 6,266 0.28
Astellas Pharma 511,500 6,155 0.27
Zoetis 78,306 5,694 0.25 –––––––––––––––––––––––––––––––––––––––––– 37,285 1.65 –––––––––––––––––––––––––––––––––––––––––INDUSTRIALS 6.21% (31.05.18: 5.57%)AEROSPACE & DEFENCELockheed Martin 27,514 6,524 0.29
Northrop Grumman 26,678 5,453 0.24 –––––––––––––––––––––––––––––––––––––––––– 11,977 0.53 –––––––––––––––––––––––––––––––––––––––––CONSTRUCTION & MATERIALSA. O. Smith 178,060 6,537 0.29
Taisei 170,100 5,851 0.26 –––––––––––––––––––––––––––––––––––––––––– 12,388 0.55 –––––––––––––––––––––––––––––––––––––––––ELECTRONIC & ELECTRICAL EQUIPMENTHoya 155,400 7,399 0.33
Amano 297,700 5,028 0.22
Hitachi 211,800 4,802 0.21
nVent Electric 235,528 4,627 0.20
Azbil 199,600 3,377 0.15 –––––––––––––––––––––––––––––––––––––––––– 25,233 1.11 –––––––––––––––––––––––––––––––––––––––––GENERAL INDUSTRIALSHoneywell International 136,912 15,646 0.69
3M 34,862 5,591 0.25 –––––––––––––––––––––––––––––––––––––––––– 21,237 0.94 –––––––––––––––––––––––––––––––––––––––––INDUSTRIAL ENGINEERINGDaifuku 109,300 4,387 0.19
Pentair 118,167 3,933 0.17
Illinois Tool Works 36,283 3,865 0.17 –––––––––––––––––––––––––––––––––––––––––– 12,185 0.53 –––––––––––––––––––––––––––––––––––––––––SUPPORT SERVICESAccenture 77,646 9,807 0.43
Jack Henry & Associates 87,035 9,492 0.42
Amadeus IT 130,426 7,430 0.33
Mitsui 592,900 7,263 0.32
Sumitomo 528,300 6,359 0.28
Meitec 148,800 5,252 0.23
Howden Joinery 1,090,491 4,918 0.22
Conduent 376,388 3,869 0.17
Dip 193,000 3,398 0.15 –––––––––––––––––––––––––––––––––––––––––– 57,788 2.55 –––––––––––––––––––––––––––––––––––––––––OIL & GAS 3.94% (31.05.18: 5.29%)OIL & GAS PRODUCERSDiamondback Energy 95,783 8,410 0.37
Marathon Petroleum 115,729 5,889 0.26
Chevron 59,302 5,525 0.24
Cabot Oil & Gas 220,810 4,274 0.19
Occidental Petroleum 75,158 4,179 0.18
Concho Resources 40,239 4,148 0.18
HollyFrontier 85,032 4,110 0.18
EOG Resources 48,027 3,972 0.17
Cimarex Energy 60,209 3,946 0.17
Pioneer Natural Resources 33,515 3,920 0.17
Exxon Mobil 61,402 3,806 0.17
Phillips 66 52,329 3,802 0.17
ConocoPhillips 69,448 3,641 0.16
Noble Energy 190,135 3,616 0.16
Valero Energy 53,296 3,321 0.15

39Investec Funds Series iv
REPORT AND ACCOUNTS
MARKET PERCENTAGE VALUE OF NET ASSETSASSET HOLDING (£’000) (%)
OIL & GAS PRODUCERS (continued)Parsley Energy 200,340 3,275 0.14
Marathon Oil 237,755 3,085 0.14
Apache 108,967 3,035 0.13
Devon Energy 134,598 2,838 0.12
EQT 127,683 1,880 0.08 –––––––––––––––––––––––––––––––––––––––––– 80,672 3.53 –––––––––––––––––––––––––––––––––––––––––OIL EQUIPMENT, SERVICES & DISTRIBUTIONNOW 388,963 4,306 0.19
KLX Energy Services 202,516 3,201 0.14
Equitrans Midstream 102,146 1,842 0.08 –––––––––––––––––––––––––––––––––––––––––– 9,349 0.41 –––––––––––––––––––––––––––––––––––––––––TECHNOLOGY 2.88% (31.05.18: 2.23%)SOFTWARE & COMPUTER SERVICESMicrosoft 111,813 9,659 0.42
Check Point Software Technologies 86,356 7,473 0.33
Amdocs 131,859 6,696 0.29
DXC Technology 126,146 6,161 0.27
Perspecta 275,671 4,392 0.19
TravelSky Technology 1,825,000 3,841 0.17
Micro Focus International 195,232 3,023 0.13 –––––––––––––––––––––––––––––––––––––––––– 41,245 1.80 –––––––––––––––––––––––––––––––––––––––––TECHNOLOGY HARDWARE & EQUIPMENTF5 Networks 91,466 12,443 0.55
Taiwan Semiconductor Manufacturing ADR 251,893 7,489 0.33
Tokyo Electron 40,800 4,473 0.20 –––––––––––––––––––––––––––––––––––––––––– 24,405 1.08 –––––––––––––––––––––––––––––––––––––––––TELECOMMUNICATIONS 0.20% (31.05.18: 0.21%)FIXED LINE TELECOMMUNICATIONSNippon Telegraph & Telephone 140,800 4,546 0.20 –––––––––––––––––––––––––––––––––––––––––GOVERNMENT TREASURY BILLS 2.19% (31.05.18: 0.83%)United Kingdom Treasury Bill 25/02/2019 GBP 50,000,000 49,909 2.19 –––––––––––––––––––––––––––––––––––––––––CERTIFICATES OF DEPOSIT 5.33% (31.05.18: 9.32%)DZ Bank 0.89% 26/03/1019 20,000,000 19,997 0.88
MUFG Bank 0.9% 26/02/2019 20,000,000 19,996 0.88
National Australia Bank 1% 21/05/2019 20,000,000 19,993 0.88
Korea Development Bank 0.86% 10/12/2018 12,000,000 11,997 0.53
Wells Fargo Bank International 0.83% 11/01/2019 10,000,000 10,000 0.44
Svenska Handelsbanken 0.86% 01/03/2019 10,000,000 9,997 0.44
Sumitomo Trust Banking 0.88% 11/02/2019 10,000,000 9,983 0.44
Sumitomo Mitsui Banking 0.01% 28/02/2019 10,000,000 9,977 0.44
Citibank London 0.80% 06/02/2019 5,000,000 4,999 0.22
Toronto Dominion Bank 0.73% 03/12/2018 4,000,000 4,000 0.18 –––––––––––––––––––––––––––––––––––––––––– 120,939 5.33 –––––––––––––––––––––––––––––––––––––––––COMMERCIAL PAPERS 4.80% (31.05.18: 11.96%)Nordea Bank 21/01/2019 20,000,000 19,977 0.88
Transport For London 21/01/2019 16,000,000 15,984 0.70
Erste Abwicklungsanstalt 15/01/2019 10,000,000 9,991 0.44
Allianz 21/01/2019 10,000,000 9,988 0.44
Nationwide Building Society 04/03/2019 10,000,000 9,975 0.44
ANZ Banking 28/03/2019 10,000,000 9,969 0.44
Swedbank 29/03/2019 10,000,000 9,966 0.44
Paccar Financial Europe 09/01/2019 9,000,000 8,992 0.40
Transport For London 14/01/2019 5,000,000 4,996 0.22
OP Corporate Bank 25/02/2019 5,000,000 4,988 0.22
Agence Centrale des Organismes de Securite Sociale 04/12/2018 4,000,000 4,000 0.18 –––––––––––––––––––––––––––––––––––––––––– 108,826 4.80 –––––––––––––––––––––––––––––––––––––––––

REPORT AND ACCOUNTS
40 Investec Funds Series iv
Portfolio statement continued
As at 30 November 2018
MARKET PERCENTAGE VALUE OF NET ASSETSASSET HOLDING (£’000) (%)
DERIVATIVES – FUTURES (0.01%) (31.05.18: (0.37%))South Korea 10 Year Bond Futures 18/12/2018 865 1,099 0.05
Australian 10 Year Treasury Note Futures 17/12/2018 2,364 855 0.04
S&P 500 E Mini Index Futures 21/12/2018 (1,630) 854 0.04
HSCEI Futures 28/12/2018 1,367 850 0.04
US Ultra Bond Futures 20/03/2019 (2,212) (693) (0.03)
Germany Euro-OAT Futures 06/12/2018 (2,714) (1,643) (0.07)
Japan TOPIX Index Futures 13/12/2018 (979) (1,757) (0.08) –––––––––––––––––––––––––––––––––––––––––– (435) (0.01) –––––––––––––––––––––––––––––––––––––––––DERIVATIVES – OPTIONS 0.14% (31.05.18: 0.11%)Goldman Sachs 0.89878 EUR Call GBP Put FX Option 01/04/2019 108,000,000 2,147 0.09
Morgan Stanley Ares Capital 16.10 Put Equity Option 08/03/2019 1,894,534 463 0.02
Morgan Stanley Ares Capital 16.10 Put Equity Option 08/03/2019 17,748 434 0.02
Morgan Stanley Main Street 37.1701 Put Equity Option 15/03/2019 4,700 277 0.01
Goldman Sachs Ares Capital 16.10 Put Equity Option 08/03/2019 4,052 99 –
CITI 0.7049 AUD Put USD Call FX Option 12/12/2018 164,196,180 41 –
CITI 0.6346 NZD Put USD Call FX Option 12/12/2018~ 164,196,180 – –
Goldman Sachs 4.35 USD Call BRL Put FX Option 06/12/2018~ 80,100,000 – – –––––––––––––––––––––––––––––––––––––––––– 3,461 0.14 –––––––––––––––––––––––––––––––––––––––––DERIVATIVES – CREDIT DEFAULT SWAPS 0.34% (31.05.18: 0.00%)Goldman Sachs Brazilian Government International Bond 1% 20/12/2023 86,999,542 3,228 0.14
Goldman Sachs Colombia Government International Bond 1% 20/12/2023 119,839,357 1,621 0.07
JP Morgan Brazilian Government International Bond 1% 20/12/2023 80,000,000 1,303 0.05
JP Morgan Brazilian Government International Bond 1% 20/12/2023 33,000,458 1,224 0.05
JP Morgan Colombia Government International Bond 1% 20/12/2023 40,160,643 543 0.03 –––––––––––––––––––––––––––––––––––––––––– 7,919 0.34 –––––––––––––––––––––––––––––––––––––––––DERIVATIVES – INTEREST RATE SWAPS 0.24% (31.05.18: 0.13%)Goldman Sachs Interest Rate Swap receive 1.4385% 06/02/2028 1,461,200,000 5,914 0.26
Goldman Sachs Interest Rate Swap receive 0.1006% 01/12/2022 116,550,000,000 2,020 0.08
Goldman Sachs Interest Rate Swap receive 1.2645% 26/03/2028 750,200,000 1,657 0.07
Goldman Sachs Interest Rate Swap receive 1.221% 07/05/2028 792,100,000 1,291 0.06
Goldman Sachs Interest Rate Swap receive 1.206% 07/08/2028 876,100,000 937 0.04
Goldman Sachs Interest Rate Swap receive 0.165% 07/05/2020 4,134,000,000 356 0.01
Goldman Sachs Interest Rate Swap receive 0.1263% 31/07/2023 13,271,000,000 305 0.01
HSBC Bank Interest Rate Swap receive 1.2892% 06/11/2028 146,323,513 194 0.01
Goldman Sachs Interest Rate Swap receive 0.1495% 04/07/2020 2,096,000,000 109 –
Goldman Sachs Interest Rate Swap receive 0.1372% 26/03/2020 3,923,000,000 24 –
Goldman Sachs Interest Rate Swap pay 0.09% 07/08/2020 4,782,000,000 (16) (0.01)
HSBC Bank Interest Rate Swap pay 0.0275% 06/11/2020 766,389,762 (102) (0.01)
Goldman Sachs Interest Rate Swap pay 0.7328% 17/10/2037 1,744,000,000 (262) (0.01)
Goldman Sachs Interest Rate Swap pay 0.8125% 31/07/2038 1,155,000,000 (274) (0.01)
Goldman Sachs Interest Rate Swap pay 2.0125% 16/10/2020 471,800,000 (297) (0.01)
Goldman Sachs Interest Rate Swap pay 2.0025% 15/10/2020 462,900,000 (332) (0.01)
Goldman Sachs Interest Rate Swap pay 2.005% 17/10/2020 471,800,000 (341) (0.01)
Goldman Sachs Interest Rate Swap pay 0.0493% 13/11/2020 2,634,504,073 (427) (0.02)
Goldman Sachs Interest Rate Swap pay 0.0775% 06/02/2020 7,610,500,000 (620) (0.03)
Goldman Sachs Interest Rate Swap pay 0.7333% 19/10/2037 26,359,000,000 (3,953) (0.18) –––––––––––––––––––––––––––––––––––––––––– 6,183 0.24 –––––––––––––––––––––––––––––––––––––––––DERIVATIVES – TOTAL RETURN SWAPS (0.47%) (31.05.18: 0.01%)JP Morgan Total Return Swap receive 0.9% 30/03/2019 413,110,458 18,590 0.81
JP Morgan Total Return Swap receive 0% 27/03/2019 62,461,081 1,870 0.09
Goldman Sachs Total Return Swap receive 0.7% 27/03/2019 23,255,882 123 –
Goldman Sachs Total Return Swap pay 0.1% 27/03/2019 (20,484,263) (268) (0.01)
Goldman Sachs Total Return Swap pay 0.9% 27/03/2019 (23,419,114) (307) (0.01)
JP Morgan Total Return Swap pay 0% 30/03/2019 (62,891,329) (3,207) (0.14)
JP Morgan Total Return Swap pay 0.09% 30/03/2019 (415,901,803) (27,637) (1.21) –––––––––––––––––––––––––––––––––––––––––– (10,836) (0.47) –––––––––––––––––––––––––––––––––––––––––

41Investec Funds Series iv
REPORT AND ACCOUNTS
MARKET PERCENTAGE VALUE OF NET ASSETSASSET HOLDING (£’000) (%)
FORWARD FOREIGN EXCHANGE CONTRACTS (1.5 0%) (31.05.2018: (2.27%))FORWARD CURRENCY CONTRACTSAustralian DollarSell AUD (42,829,700) for GBP 23,271,650 (1,228) (0.05)
Canadian DollarBuy CAD 4,110,000 for GBP (2,447,396) (28) –
Sell CAD (35,046,000) for GBP 20,641,083 12 –
Swiss FrancSell CHF (258,158,544) for GBP 204,180,266 1,222 0.05
Danish KroneBuy DKK 29,620,000 for GBP (3,549,775) (9) –
Sell DKK (157,565,000) for GBP 18,797,138 (39) –
EuroBuy EUR 121,373,000 for GBP (108,129,291) 389 0.02
Sell EUR (637,904,859) for GBP 569,687,790 256 0.01
Hungarian ForintBuy HUF 54,652,703,000 for GBP (150,103,551) 560 0.02
Japanese YenBuy JPY 34,890,273,853 for GBP (240,971,310) 175 0.01
Sell JPY (4,866,227,000) for GBP 33,732,688 99 –
Mexican PesoSell MXN (36,085,181) for GBP 1,410,719 23 –
Norwegian KroneBuy NOK 545,267,762 for GBP (49,992,290) (90) –
New Zealand DollarSell NZD (130,470,000) for GBP 65,182,009 (4,999) (0.22)
Polish ZlotySell PLN (702,929,823) for GBP 144,732,552 (1,194) (0.05)
Swedish KronaBuy SEK 280,331,414 for GBP (23,824,365) 392 0.02
Sell SEK (11,980,000) for GBP 1,028,548 (6) –
US DollarBuy USD 126,369,000 for GBP (98,219,668) 774 0.03
Sell USD (1,512,798,694) for GBP 1,156,667,914 (28,407) (1.25)
South African RandBuy ZAR 424,460,000 for GBP (21,226,844) 2,910 0.13
Sell ZAR (1,224,275,000) for GBP (1,224,275,000) (6,055) (0.27) –––––––––––––––––––––––––––––––––––––––––– (35,243) (1.55) –––––––––––––––––––––––––––––––––––––––––FORWARD CROSS CURRENCY CONTRACTSBuy BRL 26,439,428 for USD (6,957,744) (80) –
Buy CHF 78,382,000 for JPY (9,031,856,593) (802) (0.04)
Buy EUR 5,843,000 for USD (6,667,640) (11) –
Buy EUR 7,950,000 for PLN (34,370,378) (44) –
Buy INR 1,686,882,524 for USD (22,838,919) 1,031 0.05
Buy JPY 9,164,620,000 for USD (83,137,777) (1,786) (0.08)
Buy NZD 70,510,000 for USD (45,964,277) 1,921 0.08
Buy TRY 113,257,796 for USD (14,918,891) 3,166 0.14
Buy USD 13,195,342 for BRL (52,878,856) (385) (0.02)
Buy USD 22,801,000 for EUR (19,722,179) 270 0.01
Buy USD 22,858,683 for INR (1,671,759,200) (846) (0.04)
Buy USD 18,240,000 for JPY (2,059,343,308) 55 –
Buy USD 157,023,574 for KRW (176,594,992,000) (278) (0.01)
Buy USD 47,796,000 for NZD 47,796,000 (97) –
Buy USD 4,012,992 for TRY (21,557,796) (98) –
Buy USD 45,764,000 for TWD (1,416,166,980) (195) (0.01)
Buy USD 41,467,000 for ZAR (601,419,257) (1,716) (0.08)
Buy ZAR 451,955,000 for USD (31,229,840) 1,236 0.05 –––––––––––––––––––––––––––––––––––––––––– 1,341 0.05 –––––––––––––––––––––––––––––––––––––––––Portfolio of investments^ 2,115,498 92.93
Net other assets 160,911 7.07 ––––––––––––––––––––––––––––––––––––––––––Net assets 2,276,409 100.00 –––––––––––––––––––––––––––––––––––––––––
^ Including derivative liabilities.
~ The market value of the holdings is below £500 and is therefore rounded down to £0.
Unless otherwise stated the above securities are ordinary shares or common stock and admitted to offi cial stock exchange listings.
Fixed interest securities are traded on a regulated market, unless otherwise stated. Stocks shown as FRNs represent Floating Rate Notes – debt instruments
that pay a fl oating rate of interest, usually based on an accepted market benchmark rate such as LIBOR.
The collective investment schemes investments, credit default swaps, interest rate swaps, total return swaps and the forward foreign exchange contracts are not listed.
Stocks shown as ADRs represent American Depositary Receipts.

REPORT AND ACCOUNTS
42 Investec Funds Series iv
Portfolio Analysis 30.11.18 31.05.18 MARKET PERCENTAGE MARKET PERCENTAGE VALUE OF NET ASSETS VALUE OF NET ASSETSASSET (£’000) (%) (£’000) (%)
Bonds 804,161 35.33 658,524 27.29
Certifi cates of Deposit 120,939 5.33 224,972 9.32
Collective Investment Schemes 76,172 3.35 82,074 3.40
Commercial Papers 108,826 4.80 288,333 11.96
Derivatives 6,292 0.24 (2,971) (0.12)
Equities 983,101 43.19 985,168 40.83
Forward Foreign Exchange Contracts (33,902) (1.50) (54,448) (2.27)
Government Treasury Bills 49,909 2.19 19,975 0.83
Net other assets 160,911 7.07 211,352 8.76
Net assets 2,276,409 100.00 2,412,979 100.00
Credit Breakdown* 30.11.18 31.05.18 MARKET PERCENTAGE MARKET PERCENTAGE VALUE OF NET ASSETS VALUE OF NET ASSETSASSET (£’000) (%) (£’000) (%)
AAA 642,344 28.22 – –
AA 69,269 3.04 559,843 23.20
BBB 2,084 0.09 34,319 1.42
BB 66,382 2.92 32,373 1.35
B 20,031 0.89 26,068 1.08
CCC 4,051 0.17 5,921 0.24
Total Bonds 804,161 35.33 658,524 27.29
*Bond ratings are Investec approximations.
Portfolio statement continued
As at 30 November 2018

43Investec Funds Series iv
REPORT AND ACCOUNTS
Emerging Markets Blended Debt Fund
MARKET PERCENTAGE VALUE OF NET ASSETSASSET HOLDING (£’000) (%)
COLLECTIVE INVESTMENT SCHEMES 0.00% (31.05.18: 0.36%)CORPORATE BONDS 21.36% (31.05.18: 18.84%)YPF 6.95% 21/07/2027 USD 1,749,000 1,161 0.96
European Investment Bank 7.2% 09/07/2019 IDR 14,460,000,000 788 0.65
Petroleos Mexicanos 4.875% 21/02/2028 EUR 911,000 772 0.64
Standard Chartered Bank 7.5% 19/05/2038 IDR 14,017,000,000 716 0.59
Empresa Nacional del Petroleo 3.75% 05/08/2026 USD 975,000 695 0.57
Minerva Luxembourg 6.5% 20/09/2026 USD 900,000 638 0.53
KOC 5.25% 15/03/2023 USD 850,000 615 0.51
Ecopetrol 7.375% 18/09/2043 USD 705,000 596 0.49
Suzano Austria 7% 16/03/2047 USD 750,000 592 0.49
Southern Copper 6.75% 16/04/2040 USD 700,000 591 0.49
Eskom 6.35% 10/08/2028 USD 792,000 586 0.48
KazMunayGas National 5.375% 24/04/2030 USD 775,000 579 0.48
Lamar Funding 3.958% 07/05/2025 USD 850,000 574 0.47
Marfrig Holdings Europe 8% 08/06/2023 USD 725,000 571 0.47
Medco Platinum Road 6.75% 30/01/2025 USD 830,000 562 0.46
GTH Finance 7.25% 26/04/2023 USD 700,000 561 0.46
MHP 7.75% 10/05/2024 USD 745,000 550 0.45
SABIC Capital II 4.5% 10/10/2028 USD 697,000 535 0.44
Turk Telekomunikasyon 4.875% 19/06/2024 USD 800,000 534 0.44
C&W Senior Financing Designated Activity 6.875% 15/09/2027 USD 725,000 528 0.44
Petroleos Mexicanos 4.25% 15/01/2025 USD 748,000 510 0.42
Eskom 7.5% 15/09/2033 ZAR 11,900,000 510 0.42
Star Energy Geothermal Wayang Windu 6.75% 24/04/2033 USD 689,083 483 0.40
Proven Honour Capital 4.125% 06/05/2026 USD 625,000 445 0.37
Empresa de Transporte de Pasajeros Metro 5% 25/01/2047 USD 575,000 440 0.36
OCP 6.875% 25/04/2044 USD 550,000 436 0.36
Ultrapar International 5.25% 06/10/2026 USD 575,000 428 0.35
MAF Global Securities 5.5% Perpetual USD 575,000 427 0.35
Grupo Unicomer 7.875% 01/04/2024 USD 525,000 426 0.35
Eskom 5.75% 26/01/2021 USD 575,000 424 0.35
Global Bank 4.5% 20/10/2021 USD 550,000 423 0.35
Banco Regional SAECA 8.125% 24/01/2019 USD 525,000 410 0.34
Alfa 6.875% 25/03/2044 USD 550,000 409 0.34
BBVA Bancomer 6.75% 30/09/2022 USD 500,000 403 0.33
Eskom 6.75% 06/08/2023 USD 550,000 397 0.33
Ooredoo International Finance 3.75% 22/06/2026 USD 520,000 383 0.32
Petroleos Mexicanos 7.19% 12/09/2024 MXN 12,416,800 380 0.31
Southern Gas Corridor 6.875% 24/03/2026 USD 450,000 369 0.31
Indonesia Asahan Aluminium 6.53% 15/11/2028 USD 422,000 340 0.28
Transnet 9.5% 13/05/2021 ZAR 5,540,000 312 0.26
SABIC Capital II 4% 10/10/2023 USD 388,000 300 0.25
Eskom 7.125% 11/02/2025 USD 400,000 288 0.24
Standard Chartered Bank 8.75% 15/05/2031 IDR 4,949,000,000 284 0.24
Aegea Finance 5.75% 10/10/2024 USD 377,000 280 0.23
Vanke Real Estate Hong Kong 3.975% 09/11/2027 USD 405,000 279 0.23
Gohl Capital 4.25% 24/01/2027 USD 375,000 272 0.23
Rede D’or Finance 4.95% 17/01/2028 USD 397,000 272 0.22
Petkim Petrokimya 5.875% 26/01/2023 USD 383,000 271 0.22
Standard Chartered Bank 8.25% 17/05/2029 IDR 4,735,000,000 266 0.22
Mexico City Airport Trust 5.5% 31/07/2047 USD 450,000 261 0.22
America Movil 7.125% 09/12/2024 MXN 7,740,000 258 0.21
Minejesa Capital 5.625% 10/08/2037 USD 380,000 254 0.21
OCP 5.625% 25/04/2024 USD 300,000 236 0.19
Country Garden 4.75% 17/01/2023 USD 327,000 220 0.18
Financiera de Desarrollo Territorial 7.875% 12/08/2024 COP 856,000,000 210 0.17
Standard Chartered Bank 8.375% 15/03/2024 IDR 2,954,000,000 165 0.14
MTN Mauritius Investment 6.5% 13/10/2026 USD 200,000 151 0.12
Longfor 4.5% 16/01/2028 USD 200,000 132 0.11
European Investment Bank 8.5% 17/09/2024 ZAR 2,150,000 123 0.10
Portfolio statement
As at 30 November 2018

REPORT AND ACCOUNTS
44 Investec Funds Series iv
Portfolio statement continued
As at 30 November 2018
MARKET PERCENTAGE VALUE OF NET ASSETSASSET HOLDING (£’000) (%)
CORPORATE BONDS 21.36% (31.05.18: 18.84%) (continued)Standard Chartered Bank 6.125% 17/05/2028 IDR 2,246,000,000 109 0.09
Nemak 3.25% 15/03/2024 EUR 100,000 88 0.07
Central American Bottling 5.75% 31/01/2027 USD 90,000 69 0.06 –––––––––––––––––––––––––––––––––––––––––– 25,887 21.36 –––––––––––––––––––––––––––––––––––––––––GOVERNMENT BONDS 65.87% (31.05.18: 61.76%)Brazil Letras do Tesouro Nacional 01/10/2020 BRL 24,674,000 4,375 3.61
Thailand Government Bond 2.13% 17/12/2026 THB 141,025,000 3,245 2.68
Republic of South Africa Government Bond 9% 31/01/2040 ZAR 43,100,570 2,280 1.88
Malaysia Government Bond 3.62% 30/11/2021 MYR 12,188,000 2,279 1.88
Brazil Letras do Tesouro Nacional 01/01/2020 BRL 12,000,000 2,267 1.87
Brazil Notas do Tesouro Nacional Serie F 10% 01/01/2021 BRL 920,700 1,942 1.60
Russian Federal Bond – OFZ 7.7% 23/03/2033 RUB 170,453,000 1,849 1.53
Saudi Government International Bond 2.88% 04/03/2023 USD 2,425,000 1,815 1.50
Republic of South Africa Government Bond 8.875% 28/02/2035 ZAR 33,206,846 1,770 1.46
Republic of Poland Government Bond 2.5% 25/04/2024 PLN 8,225,000 1,710 1.41
Uruguay Government International Bond 7.625% 21/03/2036 USD 1,675,000 1,670 1.38
Russian Federal Bond – OFZ 8.15% 03/02/2027 RUB 122,078,000 1,400 1.16
Egypt Government International Bond 8.5% 31/01/2047 USD 1,840,000 1,311 1.08
Croatia Government International Bond 6% 26/01/2024 USD 1,523,000 1,278 1.06
Argentine Republic Government International Bond 5.875% 11/01/2028 USD 1,911,000 1,122 0.93
Brazil Letras do Tesouro Nacional 01/07/2020 BRL 5,971,000 1,084 0.90
Serbia International Bond 7.25% 28/09/2021 USD 1,275,000 1,071 0.88
Argentine Republic Government International Bond 7.5% 22/04/2026 USD 1,550,000 1,029 0.85
Brazil Letras do Tesouro Nacional 01/07/2021 BRL 6,000,000 993 0.82
Colombian TES 7% 30/06/2032 COP 4,195,200,000 981 0.81
Peru Government Bond 6.9% 12/08/2037 PEN 3,928,000 971 0.80
Russian Federal Bond – OFZ 7.75% 16/09/2026 RUB 81,758,000 918 0.76
Hungary Government Bond 2.75% 22/12/2026 HUF 329,690,000 883 0.73
Dominican Republic International Bond 6.875% 29/01/2026 USD 1,075,000 870 0.72
Brazil Notas do Tesouro Nacional Serie F 10% 01/01/2023 BRL 4,114,000 862 0.71
Colombian TES 7.5% 26/08/2026 COP 3,375,000,000 845 0.70
Turkey Government Bond 7.1% 08/03/2023 TRY 7,620,616 825 0.68
Dominican Republic International Bond 6.5% 15/02/2048 USD 1,100,000 791 0.65
Turkey Government Bond 12.2% 18/01/2023 TRY 5,773,969 765 0.63
Romanian Government International Bond 4.13% 11/03/2039 EUR 869,000 754 0.62
Republic of South Africa Government Bond 6.75% 31/03/2021 ZAR 13,287,053 751 0.62
Republic of South Africa Government International Bond 4.875% 14/04/2026 USD 1,000,000 730 0.60
Argentine Republic Government International Bond 5.625% 26/01/2022 USD 1,025,000 709 0.59
Hungary Government Bond 3% 27/10/2027 HUF 260,000,000 705 0.58
Colombian TES 10% 24/07/2024 COP 2,256,800,000 637 0.53
Thailand Government Bond 3.775% 25/06/2032 THB 24,616,000 635 0.53
Republic of South Africa Government Bond 8% 31/01/2030 ZAR 12,000,000 621 0.51
Hungary Government International Bond 5.375% 25/03/2024 USD 700,000 578 0.48
Jordan Government International Bond 5.75% 31/01/2027 USD 775,000 557 0.46
Brazil Letras do Tesouro Nacional 01/04/2020 BRL 300,000 556 0.46
Indonesia Treasury Bond 9% 15/03/2029 IDR 9,527,000,000 555 0.46
Hungary Government International Bond 7.625% 29/03/2041 USD 524,000 548 0.45
Senegal Government International Bond 6.25% 23/05/2033 USD 825,000 546 0.45
Nigeria Government International Bond 6.5% 28/11/2027 USD 800,000 546 0.45
Costa Rica Government International Bond 7.158% 12/03/2045 USD 795,000 545 0.45
Dominican Republic International Bond 5.95% 25/01/2027 USD 700,000 537 0.44
Colombian TES 7% 04/05/2022 COP 2,142,900,000 537 0.44
Oman Government International Bond 5.625% 17/01/2028 USD 736,000 533 0.44
Colombian TES 4.75% 04/04/2035 COP 7,480,000 530 0.44
Republic of South Africa Government Bond 8.5% 31/01/2037 ZAR 10,105,000 515 0.43
Mexican Bonos 10% 05/12/2024 MXN 12,456,300 504 0.42
Jordan Government International Bond 7.375% 10/10/2047 USD 725,000 502 0.42
Mexican Bonos 6.5% 10/06/2021 MXN 13,556,600 498 0.41
Ecuador Government International Bond 7.875% 23/01/2028 USD 758,000 496 0.41
Republic of South Africa Government Bond 8.25% 31/03/2032 ZAR 9,639,505 496 0.41
Serbia Treasury Bonds 5.875% 08/02/2028 RSD 60,780,000 495 0.41
Provincia de Buenos Aires 7.875% 15/06/2027 USD 811,000 488 0.40
Dominican Republic International Bond 5.5% 27/01/2025 USD 625,000 477 0.39
Brazil Letras do Tesouro Nacional 01/01/2022 BRL 3,000,000 472 0.39
Zambia Government International Bond 8.5% 14/04/2024 USD 800,000 471 0.39
Zambia Government International Bond 8.97% 30/07/2027 USD 800,000 469 0.39
Thailand Government Bond 3.4% 17/06/2036 THB 18,730,000 463 0.38

45Investec Funds Series iv
REPORT AND ACCOUNTS
MARKET PERCENTAGE VALUE OF NET ASSETSASSET HOLDING (£’000) (%)
GOVERNMENT BONDS 65.87% (31.05.18: 61.76%) (continued)Mongolia Government International Bond 5.625% 01/05/2023 USD 618,000 453 0.37
Peruvian Government International Bond 6.95% 12/08/2031 PEN 1,801,000 452 0.37
Russian Federal Bond – OFZ 7.05% 19/01/2028 RUB 42,428,000 451 0.37
Ukraine Government International Bond 7.75% 01/09/2024 USD 641,000 447 0.37
Mexican Bonos 6.5% 09/06/2022 MXN 12,263,700 441 0.37
Republic of South Africa Government International Bond 4.85% 27/09/2027 USD 613,000 437 0.36
Colombian TES 11% 24/07/2020 COP 1,633,000,000 430 0.36
Turkey Government International Bond 5.125% 17/02/2028 USD 641,000 421 0.35
Republic of South Africa Government Bond 10.5% 21/12/2026 ZAR 6,718,051 418 0.35
Brazil Notas do Tesouro Nacional Serie F 10% 01/01/2027 BRL 2,000,000 411 0.34
Malaysia Government Bond 3.955% 15/09/2025 MYR 2,185,000 404 0.33
Peru Government Bond 6.15% 12/08/2032 PEN 1,693,000 398 0.33
Malaysia Government Bond 3.9% 30/11/2026 MYR 2,105,000 386 0.32
Brazil Letras do Tesouro Nacional 01/10/2019 BRL 2,000,000 385 0.32
Croatia Government International Bond 2.7% 15/06/2028 EUR 409,000 366 0.30
Colombian TES 6% 28/04/2028 COP 1,617,600,000 365 0.30
Indonesia Government International Bond 4.125% 15/01/2025 USD 475,000 361 0.30
Ukraine Government International Bond 7.75% 01/09/2026 USD 525,000 353 0.29
Angolan Government International Bond 8.25% 09/05/2028 USD 464,000 350 0.29
Ecuador Government International Bond 8.75% 02/06/2023 USD 475,000 349 0.29
Indonesia Treasury Bond 8.25% 15/05/2036 IDR 6,051,000,000 331 0.27
Colombia Government International Bond 7.375% 18/09/2037 USD 350,000 327 0.27
Indonesia Treasury Bond 7.5% 15/08/2032 IDR 6,295,000,000 324 0.27
Czech Republic Government Bond 2.75% 23/07/2029 CZK 8,780,000 318 0.26
Senegal Government International Bond 4.75% 13/03/2028 EUR 383,000 314 0.26
Uruguay Government International Bond 4.375% 15/12/2028 UYU 6,897,700 310 0.26
Indonesia Treasury Bond 6.125% 15/05/2028 IDR 6,355,000,000 308 0.26
Indonesia Government International Bond 7.75% 17/01/2038 USD 311,000 305 0.25
Mexican Bonos 8% 07/12/2023 MXN 7,858,800 293 0.24
Colombian TES 6.25% 26/11/2025 COP 1,214,300,000 287 0.24
Ivory Coast Government International Bond 5.75% 31/12/2032 USD 416,250 286 0.24
Ivory Coast Government International Bond 6.375% 03/03/2028 USD 400,000 281 0.23
Ukraine Government International Bond 7.75% 01/09/2027 USD 425,000 281 0.23
Ukraine Government International Bond 7.75% 01/09/2025 USD 404,000 277 0.23
Ecuador Government International Bond 9.65% 13/12/2026 USD 375,000 272 0.23
Egypt Government International Bond 7.5% 31/01/2027 USD 340,000 256 0.21
Egypt Government International Bond 7.903% 21/02/2048 USD 375,000 255 0.21
Indonesia Treasury Bond 8.375% 15/03/2034 IDR 4,447,000,000 246 0.20
Nigeria Government International Bond 8.747% 21/01/2031 USD 325,000 245 0.20
Provincia de Cordoba 7.125% 10/06/2021 USD 325,000 233 0.19
Czech Republic Government Bond 0.25% 10/02/2027 CZK 7,710,000 230 0.19
Ecuador Government International Bond 10.5% 24/03/2020 USD 275,000 221 0.18
Argentine Republic Government International Bond 6.875% 26/01/2027 USD 350,000 221 0.18
Czech Republic Government Bond 4.2% 04/12/2036 CZK 5,100,000 217 0.18
Senegal Government International Bond 6.75% 13/03/2048 USD 326,000 210 0.17
Czech Republic Government Bond 2% 13/10/2033 CZK 6,370,000 209 0.17
Croatia Government International Bond 6.625% 14/07/2020 USD 250,000 204 0.17
Colombia Government International Bond 6.125% 18/01/2041 USD 240,000 200 0.17
Angolan Government International Bond 9.375% 08/05/2048 USD 250,000 189 0.16
Dominican Republic International Bond 6.85% 27/01/2045 USD 250,000 187 0.16
Kazakhstan Government International Bond 6.5% 21/07/2045 USD 200,000 179 0.15
Ukraine Government International Bond 7.75% 01/09/2021 USD 225,000 166 0.14
Indonesia Treasury Bond 8.75% 15/05/2031 IDR 2,869,000,000 165 0.14
Ecuador Government International Bond 10.75% 28/03/2022 USD 200,000 160 0.13
Indonesia Government International Bond 4.75% 08/01/2026 USD 200,000 157 0.13
Ukraine Government International Bond 8.994% 01/02/2024 USD 200,000 148 0.12
Kenya Government International Bond 7.25% 28/02/2028 USD 200,000 140 0.12
Ecuador Government International Bond 8.875% 23/10/2027 USD 200,000 138 0.11
Kenya Government International Bond 8.25% 28/02/2048 USD 200,000 134 0.11
Hungary Government Bond 3% 26/06/2024 HUF 43,560,000 123 0.10
Malaysia Government Bond 3.892% 15/03/2027 MYR 553,000 101 0.08
Dominican Republic International Bond 7.45% 30/04/2044 USD 125,000 99 0.08
Malaysia Government Bond 4.254% 31/05/2035 MYR 551,000 97 0.08
Malaysia Government Investment Issue 4.07% 30/09/2026 MYR 517,000 96 0.08
Malaysia Government Bond 4.392% 15/04/2026 MYR 387,000 73 0.06
Bonos de la Tesoreria de la Republica en pesos 4.7% 01/09/2030 CLP 45,000,000 53 0.04
Czech Republic Government Bond 2.5% 25/08/2028 CZK 1,400,000 50 0.04
Bonos de la Tesoreria de la Republica en pesos 4% 01/03/2023 CLP 40,000,000 46 0.04

REPORT AND ACCOUNTS
46 Investec Funds Series iv
Portfolio statement continued
As at 30 November 2018
MARKET PERCENTAGE VALUE OF NET ASSETSASSET HOLDING (£’000) (%)
GOVERNMENT BONDS 65.87% (31.05.18: 61.76%) (continued)Malaysia Government Bond 4.16% 15/07/2021 MYR 128,000 24 0.02
Peru Government Bond 6.85% 12/02/2042 PEN 81,000 20 0.02 –––––––––––––––––––––––––––––––––––––––––– 79,741 65.87 –––––––––––––––––––––––––––––––––––––––––GOVERNMENT TREASURY BILLS 3.87% (31.05.18: 5.98%)Egypt Treasury Bills 16/04/2019 EGP 55,350,000 2,255 1.86
Egypt Treasury Bills 15/01/2019 EGP 47,850,000 2,044 1.69
Egypt Treasury Bills 12/02/2019 EGP 9,325,000 392 0.32 –––––––––––––––––––––––––––––––––––––––––– 4,691 3.87 –––––––––––––––––––––––––––––––––––––––––DERIVATIVES – FUTURES (0.02%) (31.05.18: (0.04%))Germany Euro-BUND Futures 06/12/2018 (19) (26) (0.02) –––––––––––––––––––––––––––––––––––––––––DERIVATIVES – INTEREST RATE SWAPS (0.13%) (31.05.18: 0.06%)Goldman Sachs Interest Rate Swap Rec 6.654% 19/04/2023 54,180,342 5 0.01
Goldman Sachs Interest Rate Swap Pay 9.32% 14/01/2046 300,000 (2) –
Goldman Sachs Interest Rate Swap Pay 9.3121% 15/01/2046 500,000 (3) –
Goldman Sachs Interest Rate Swap Pay 9.3685% 19/01/2046 500,000 (3) –
Standard Chartered Interest Rate Swap Pay 7.415% 07/09/2023 63,444,901 (17) (0.01)
Goldman Sachs Interest Rate Swap Pay 1.576% 09/10/2038 714,000 (22) (0.02)
Citi Interest Rate Swap Pay 2.2372% 02/08/2023 7,510,153 (26) (0.02)
Goldman Sachs Interest Rate Swap Pay 7.577417% 10/10/2023 309,207,000 (105) (0.09) –––––––––––––––––––––––––––––––––––––––––– (173) (0.13) –––––––––––––––––––––––––––––––––––––––––DERIVATIVES – TOTAL RETURN SWAPS 0.80% (31.05.18: 1.57%)Citi Total Return Swap 10.25% 15/07/2022 5,000,000,000 294 0.24
Citi Total Return Swap 10.25% 15/07/2027 3,500,000,000 217 0.18
Standard Chartered H1 Total Return Swap 7.875% 15/04/2019 3,375,000,000 186 0.15
Deutsche Bank – Indonesia Government Total Return Bond Swap Rec 8.75% 15/05/2031 2,002,000,000 114 0.09
Standard Chartered G1 Total Return Swap 9% 15/03/2029 1,037,000,000 60 0.05
Deutche Bank – Indonesia Government Total Return Bond Swap Rec 8.375% 15/09/2026 1,017,000,000 57 0.05
Deutsche Bank – Indonesia Government Total Return Bond Swap Rec 8.375% 15/09/2026 464,000,000 26 0.02
Standard Chartered – Indonesia Government Total Return Bond Swap Rec 8.75% 15/05/2031 219,000,000 13 0.01
Standard Chartered – Indonesia Government Total Return Bond Swap Rec 8.375% 15/09/2026 217,000,000 12 0.01
Standard Chartered – Indonesia Government Total Return Bond Swap Rec 8.375% 15/09/2026 41,000,000 2 –
Standard Chartered – Indonesia Government Total Return Bond Swap Rec 8.375% 15/09/2026 37,000,000 2 – –––––––––––––––––––––––––––––––––––––––––– 983 0.80 ––––––––––––––––––––––––––––––––––––––––– FORWARD FOREIGN EXCHANGE CONTRACTS (1.54%) (31.05.18: (0.61%))US Dollar
Buy USD 3,073,953 for GBP (2,370,000) 38 0.03
Sell USD (80,904,990) for GBP 61,514,000 (1,863) (1.54) –––––––––––––––––––––––––––––––––––––––––– (1,825) (1.51) –––––––––––––––––––––––––––––––––––––––––FORWARD CROSS CURRENCY CONTRACTSBuy ARS 79,960,000 for USD (2,056,949) 29 0.02
Buy BRL 66,219,724 for USD (17,014,768) 123 0.10
Buy CLP 1,227,240,000 for USD (1,822,995) 3 –
Buy CNH 65,170,000 for USD (9,423,817) (34) (0.03)
Buy COP 3,473,270,000 for USD (1,123,050) (40) (0.03)
Buy CZK 106,770,000 for EUR (4,154,125) (35) (0.03)
Buy CZK 194,178,367 for USD (8,433,437) 92 0.08
Buy EUR 173,097 for HUF (56,380,000) (1) –
Buy EUR 12,924,138 for USD (14,976,931) (204) (0.17)
Buy HUF 616,000,000 for USD (2,169,605) 4 –
Buy IDR 51,423,390,000 for USD (3,470,387) 88 0.07
Buy INR 317,186,000 for USD (4,425,929) 91 0.07
Buy KRW 8,876,693,000 for USD (7,905,333) 4 –
Buy MXN 254,410,000 for USD (12,766,346) (218) (0.18)
Buy PEN 8,290,000 for USD (2,492,555) (32) (0.03)
Buy PHP 217,490,000 for USD (4,039,027) 84 0.07
Buy PLN 51,341,173 for USD (13,830,763) (176) (0.16)
Buy RON 37,200,000 for USD (9,069,013) 7 0.01
Buy RUB 343,030,826 for USD (4,840,795) 218 0.18
Buy SGD 10,658,932 for USD (7,782,034) (6) (0.01)
Buy THB 445,547,939 for USD (13,945,173) (306) (0.25)
Buy TRY 40,558,044 for USD (6,101,106) 1,320 1.09
Buy TWD 158,622,240 for USD (5,144,408) 7 0.01

47Investec Funds Series iv
REPORT AND ACCOUNTS
MARKET PERCENTAGE VALUE OF NET ASSETSASSET HOLDING (£’000) (%)
FORWARD CROSS CURRENCY CONTRACTS (continued)Buy USD 1,664,710 for ARS (62,280,000) 26 0.02
Buy USD 21,348,513 for BRL (85,409,448) (611) (0.51)
Buy USD 9,359,123 for CNH (65,170,000) (17) (0.01)
Buy USD 4,469,938 for COP (13,907,625,000) 141 0.12
Buy USD 6,914,813 for CZK (157,556,700) 1 –
Buy USD 25,883,167 for EUR (22,422,144) 231 0.19
Buy USD 898,388 for IDR (13,565,524,627) (40) (0.03)
Buy USD 3,902,859 for ILS (14,272,897) 40 0.03
Buy USD 4,183,462 for INR (309,723,000) (197) (0.16)
Buy USD 7,914,673 for KRW (8,876,727,000) 3 –
Buy USD 8,526,050 for MXN (163,098,100) 407 0.34
Buy USD 1,556,408 for NGN (608,873,000) (1) –
Buy USD~ 408,000 for PEN (1,379,000) – –
Buy USD 7,830,868 for PHP (426,820,000) (240) (0.20)
Buy USD 2,212,983 for PLN (8,330,000) (4) –
Buy USD 6,218,806 for RON (24,920,000) 108 0.09
Buy USD 6,167,975 for RUB (415,500,000) (25) (0.02)
Buy USD 9,169,977 for THB (302,013,517) (14) (0.01)
Buy USD 5,624,725 for TRY (33,340,000) (607) (0.50)
Buy USD 9,431,173 for TWD (288,968,170) 33 0.03
Buy USD 7,343,166 for ZAR (106,513,938) (305) (0.25)
Buy ZAR 13,570,000 for USD (942,456) 33 0.03 –––––––––––––––––––––––––––––––––––––––––– (20) (0.03) –––––––––––––––––––––––––––––––––––––––––Portfolio of investments^ 109,258 90.21
Net other assets 11,852 9.79 ––––––––––––––––––––––––––––––––––––––––––Net assets 121,110 100.00 –––––––––––––––––––––––––––––––––––––––––^ Including derivative liabilities.
~ The market value of the holding is below £500 and is therefore rounded down to £0.
Unless otherwise stated the above securities are ordinary shares or common stock and admitted to offi cial stock exchange listings.
The interest rate swaps, total return swaps and the forward foreign exchange contracts are not listed.
Portfolio Analysis 30.11.18 31.05.18 MARKET PERCENTAGE MARKET PERCENTAGE VALUE OF NET ASSETS VALUE OF NET ASSETSASSET (£’000) (%) (£’000) (%)
Bonds 105,628 87.23 90,362 80.60
Collective Investment Schemes – – 398 0.36
Derivatives 784 0.65 1,804 1.59
Forward Foreign Exchange Contracts (1,845) (1.54) (694) (0.61)
Government Treasury Bills 4,691 3.87 6,697 5.98
Net other assets 11,852 9.79 13,541 12.08
Net assets 121,110 100.00 112,108 100.00
Credit Breakdown* 30.11.18 31.05.18 MARKET PERCENTAGE MARKET PERCENTAGE VALUE OF NET ASSETS VALUE OF NET ASSETSASSET (£’000) (%) (£’000) (%)
AAA 911 0.75 907 0.81
AA 906 0.74 251 0.22
A 12,695 10.48 11,034 9.84
BBB 34,284 28.35 29,145 26.00
BB 38,554 31.82 32,880 29.34
B 17,593 14.52 13,163 11.73
CCC 685 0.57 2,982 2.66
Total Bonds 105,628 87.23 90,362 80.60
*Bond ratings are Investec approximations.

REPORT AND ACCOUNTS
48 Investec Funds Series iv
MARKET PERCENTAGE VALUE OF NET ASSETSASSET HOLDING (£’000) (%)
AUSTRIA 1.55% (31.05.18: 1.39%) Raiffeisen Bank International 54,192 1,256 0.79
Erste Group Bank 39,207 1,220 0.76 –––––––––––––––––––––––––––––––––––––––––– 2,476 1.55 –––––––––––––––––––––––––––––––––––––––––BRAZIL 7.34% (31.05.18: 7.52%)Vale ADR 320,692 3,382 2.12
Itausa Preference Shares 719,264 1,826 1.15
Banco do Brasil 191,423 1,761 1.09
Atacadao Distribuicao Comercio e Industria 495,123 1,679 1.05
Engie Brasil Energia 140,567 1,253 0.79
Cia de Transmissao de Energia Eletrica Paulista Preference Shares 72,780 1,066 0.67
TIM Participacoes ADR 60,866 744 0.47 –––––––––––––––––––––––––––––––––––––––––– 11,711 7.34 –––––––––––––––––––––––––––––––––––––––––CHINA 25.57% (31.05.18: 31.96%)Tencent 233,600 7,304 4.58
Ping An Insurance Group Company of China 689,000 5,224 3.28
Alibaba ADR 41,044 5,023 3.15
Baidu ADR 31,193 4,484 2.81
China Construction Bank 5,304,000 3,540 2.22
China Petroleum & Chemical 3,940,000 2,626 1.65
China Telecom 4,488,000 1,889 1.18
CSPC Pharmaceutical 1,150,000 1,826 1.15
Anhui Conch Cement 467,966 1,681 1.05
China Shenhua Energy 836,988 1,458 0.91
Geely Automobile 910,000 1,406 0.88
Want Want China 2,263,000 1,309 0.82
Wuliangye Yibin 201,356 1,191 0.75
Bank of China 3,320,500 1,138 0.71
Beijing Capital International Airport 780,000 679 0.43 –––––––––––––––––––––––––––––––––––––––––– 40,778 25.57 –––––––––––––––––––––––––––––––––––––––––HONG KONG 8.37% (31.05.18: 6.84%)AIA 368,000 2,355 1.48
China Resources Land 782,000 2,273 1.43
WH 3,089,488 1,768 1.11
China Taiping Insurance 507,600 1,315 0.82
Galaxy Entertainment 257,000 1,238 0.78
Kunlun Energy 1,142,000 1,084 0.68
Kerry Properties 361,694 973 0.61
Lee & Man Paper Manufacturing 1,304,756 926 0.58
China Resources Gas 266,000 841 0.53
Shenzhen International 350,000 551 0.35 –––––––––––––––––––––––––––––––––––––––––– 13,324 8.37 –––––––––––––––––––––––––––––––––––––––––HUNGARY 1.32% (31.05.18: 1.05%)MOL Hungarian Oil & Gas 154,321 1,353 0.85
Richter Gedeon 49,850 755 0.47 –––––––––––––––––––––––––––––––––––––––––– 2,108 1.32 –––––––––––––––––––––––––––––––––––––––––INDIA 6.08% (31.05.18: 7.09%)Infosys ADR 399,341 3,028 1.90
HDFC Bank 92,033 2,195 1.38
Tech Mahindra 253,035 2,010 1.26
Hindalco Industries 685,306 1,743 1.09
Infosys 81,265 612 0.38
Mahanagar Gas 11,999 113 0.07 –––––––––––––––––––––––––––––––––––––––––– 9,701 6.08 –––––––––––––––––––––––––––––––––––––––––
Portfolio statement
As at 30 November 2018
Emerging Markets Equity Fund

49Investec Funds Series iv
REPORT AND ACCOUNTS
INDONESIA 1.10% (31.05.18: 0.98%)Bank Negara Indonesia 3,793,000 1,762 1.10 –––––––––––––––––––––––––––––––––––––––––JERSEY 0.19% (31.05.18: 0.18%)En+ GDR 83,391 307 0.19 –––––––––––––––––––––––––––––––––––––––––LUXEMBOURG 1.01% (31.05.18: 1.08%)Ternium ADR 71,008 1,611 1.01 –––––––––––––––––––––––––––––––––––––––––MALAYSIA 1.45% (31.05.18: 0.90%)Malayan Banking 871,400 1,533 0.96
Genting Bhd 660,000 777 0.49 –––––––––––––––––––––––––––––––––––––––––– 2,310 1.45 –––––––––––––––––––––––––––––––––––––––––MEXICO 3.59% (31.05.18: 4.45%)Grupo Financiero Banorte 403,345 1,430 0.90
Grupo Aeroportuario del Sureste ADR 12,000 1,282 0.80
Cemex ADR 292,439 1,172 0.73
Grupo Mexico 579,536 939 0.59
Industrias Penoles 65,788 603 0.38
Wal-Mart de Mexico 156,376 300 0.19 –––––––––––––––––––––––––––––––––––––––––– 5,726 3.59 –––––––––––––––––––––––––––––––––––––––––PERU 1.23% (31.05.18: 1.04%)Credicorp 11,158 1,963 1.23 –––––––––––––––––––––––––––––––––––––––––POLAND 0.84% (31.05.18: 0.66%)Powszechna Kasa Oszczednosci Bank Polski 158,155 1,334 0.84 –––––––––––––––––––––––––––––––––––––––––RUSSIA 2.06% (31.05.18: 1.80%)Lukoil ADR (US Listing) 40,349 2,264 1.42
Polymetal International 130,340 1,026 0.64
Lukoil ADR (LN Listing) 24 1 – –––––––––––––––––––––––––––––––––––––––––– 3,291 2.06 –––––––––––––––––––––––––––––––––––––––––SOUTH AFRICA 4.61% (31.05.18: 1.25%)Bid 117,474 1,758 1.10
Sasol 71,127 1,672 1.05
Exxaro Resources 186,046 1,396 0.87
RMB 288,035 1,301 0.82
Old Mutual 918,383 1,221 0.77 –––––––––––––––––––––––––––––––––––––––––– 7,348 4.61 –––––––––––––––––––––––––––––––––––––––––SOUTH KOREA 7.32% (31.05.18: 9.27%)Samsung Electronics 184,530 5,401 3.39
KB Financial 58,201 1,919 1.20
POSCO 9,456 1,637 1.03
Hana Financial 50,106 1,316 0.83
Samsung Life Insurance 14,473 875 0.55
Orange Life Insurance 24,061 506 0.32 –––––––––––––––––––––––––––––––––––––––––– 11,654 7.32 –––––––––––––––––––––––––––––––––––––––––SWITZERLAND 0.60% (31.05.18: 0.83%)Swatch 4,122 958 0.60 –––––––––––––––––––––––––––––––––––––––––TAIWAN 7.09% (31.05.18: 7.97%)Taiwan Semiconductor Manufacturing ADR 270,983 8,056 5.05
Cathay Financial 1,226,000 1,515 0.95
Novatek Microelectronics 291,000 963 0.60
Silicon Motion Technology ADR 28,035 778 0.49 –––––––––––––––––––––––––––––––––––––––––– 11,312 7.09 –––––––––––––––––––––––––––––––––––––––––
MARKET PERCENTAGE VALUE OF NET ASSETSASSET HOLDING (£’000) (%)

REPORT AND ACCOUNTS
50 Investec Funds Series iv
THAILAND 5.10% (31.05.18: 1.84%)Bangkok Bank NVDR 389,500 1,931 1.21
PTT 1,372,500 1,620 1.02
Advanced Info Service 261,000 1,107 0.69
Bangkok Dusit Medical Services 1,648,700 1,042 0.65
Kasikornbank NVDR 218,000 1,003 0.63
Indorama Ventures 562,200 720 0.45
Kasikornbank 107,100 494 0.31
Bangkok Bank 44,400 224 0.14 –––––––––––––––––––––––––––––––––––––––––– 8,141 5.10 –––––––––––––––––––––––––––––––––––––––––TURKEY 0.71% (31.05.18: 1.18%)TAV Havalimanlari 322,508 1,137 0.71 –––––––––––––––––––––––––––––––––––––––––UNITED ARAB EMIRATES 2.67% (31.05.18: 2.54%)Emaar Properties 1,443,226 1,386 0.87
First Abu Dhabi Bank 448,489 1,294 0.81
Aldar Properties 2,327,513 795 0.50
Abu Dhabi National Oil for Distribution 1,614,566 782 0.49 –––––––––––––––––––––––––––––––––––––––––– 4,257 2.67 –––––––––––––––––––––––––––––––––––––––––UNITED KINGDOM 2.20% (31.05.18: 3.52%)Mondi 106,982 1,862 1.17
Anglo American 104,272 1,643 1.03 –––––––––––––––––––––––––––––––––––––––––– 3,505 2.20 –––––––––––––––––––––––––––––––––––––––––UNITED STATES 1.36% (31.05.18: 1.06%)Broadcom 11,762 2,174 1.36 –––––––––––––––––––––––––––––––––––––––––Portfolio of investments 148,888 93.36
Net other assets 10,581 6.64 ––––––––––––––––––––––––––––––––––––––––––Net assets 159,469 100.00 –––––––––––––––––––––––––––––––––––––––––
Unless otherwise stated the above securities are ordinary shares or common stock and admitted to offi cial stock exchange listings.
Stocks shown as NVDRs represent Non Voting Depositary Receipts.
Stocks shown as ADRs represent American Depositary Receipts.
Stocks shown as GDRs represent Global Depositary Receipts.
MARKET PERCENTAGE VALUE OF NET ASSETSASSET HOLDING (£’000) (%)
Portfolio statement continued
As at 30 November 2018

51Investec Funds Series iv
REPORT AND ACCOUNTS
Global Dividend Fund
MARKET PERCENTAGE VALUE OF NET ASSETSASSET HOLDING (£’000) (%)
CANADA 2.25% (31.05.18: 2.29%)Canadian Imperial Bank of Commerce 4,337 287 2.25 –––––––––––––––––––––––––––––––––––––––––CHINA 2.66% (31.05.18: 3.20%)China Construction Bank 271,000 181 1.42
Qingdao Port International 351,000 158 1.24 –––––––––––––––––––––––––––––––––––––––––– 339 2.66 –––––––––––––––––––––––––––––––––––––––––CAYMAN ISLANDS 2.34% (31.05.18: 0.00%)CK Asset 53,000 299 2.34 –––––––––––––––––––––––––––––––––––––––––DENMARK 0.00% (31.05.18: 2.17%)
FRANCE 6.16% (31.05.18: 6.49%)Schneider Electric 7,222 413 3.24
Total 5,891 257 2.02
AXA 6,018 115 0.90 –––––––––––––––––––––––––––––––––––––––––– 785 6.16 –––––––––––––––––––––––––––––––––––––––––GERMANY 0.00% (31.05.18: 0.88%)
HONG KONG 1.61% (31.05.18: 2.22%)PCCW 445,000 205 1.61 –––––––––––––––––––––––––––––––––––––––––JAPAN 2.40% (31.05.18: 4.71%)Sumitomo Mitsui Financial 10,600 306 2.40 –––––––––––––––––––––––––––––––––––––––––NETHERLANDS 2.65% (31.05.18: 2.62%)ASR Nederland 5,976 204 1.60
Euronext 2,896 134 1.05 –––––––––––––––––––––––––––––––––––––––––– 338 2.65 –––––––––––––––––––––––––––––––––––––––––NORWAY 0.00% (31.05.18: 1.24%)
RUSSIA 1.28% (31.05.18: 1.81%)LUKOIL ADR 2,902 163 1.28 –––––––––––––––––––––––––––––––––––––––––SINGAPORE 2.76% (31.05.18: 4.37%)United Overseas Bank 13,400 192 1.50
DBS 11,600 161 1.26 –––––––––––––––––––––––––––––––––––––––––– 353 2.76 –––––––––––––––––––––––––––––––––––––––––SOUTH KOREA 2.71% (31.05.18: 3.65%)Samsung Electronics Preference 9,699 229 1.79
Samsung Electronics 4,018 118 0.92 –––––––––––––––––––––––––––––––––––––––––– 347 2.71 –––––––––––––––––––––––––––––––––––––––––SPAIN 4.75% (31.05.18: 2.28%)Iberdrola 55,655 327 2.56
Repsol 20,609 279 2.19 –––––––––––––––––––––––––––––––––––––––––– 606 4.75 –––––––––––––––––––––––––––––––––––––––––SWITZERLAND 1.99% (31.05.18: 2.48%)Novartis 3,554 254 1.99 –––––––––––––––––––––––––––––––––––––––––TAIWAN 1.76% (31.05.18: 2.93%) Taiwan Semiconductor Manufacturing 39,000 224 1.76 –––––––––––––––––––––––––––––––––––––––––UNITED ARAB EMIRATES 2.08% (31.05.18: 2.85%) Aldar Properties 775,928 265 2.08 –––––––––––––––––––––––––––––––––––––––––
Portfolio statement
As at 30 November 2018

REPORT AND ACCOUNTS
52 Investec Funds Series iv
UNITED KINGDOM 17.48% (31.05.18: 18.01%)Royal Dutch Shell 16,064 387 3.03
Schroders 16,418 381 2.99
Prudential 24,035 368 2.88
Unilever 7,585 325 2.55
British American Tobacco 11,845 323 2.53
Imperial Tobacco 7,076 169 1.32
RELX 9,977 165 1.29
Rio Tinto 3,160 113 0.89 –––––––––––––––––––––––––––––––––––––––––– 2,231 17.48 –––––––––––––––––––––––––––––––––––––––––UNITED STATES 42.76% (31.05.18: 37.14%)Johnson & Johnson 4,520 517 4.05
PepsiCo 4,686 434 3.40
Carnival 8,542 407 3.19
Microsoft 4,624 399 3.13
Pfi zer 8,995 321 2.52
Wells Fargo 7,422 314 2.46
Broadcom 1,670 309 2.42
Extended Stay America 21,727 309 2.42
Merck 4,868 297 2.33
Philip Morris International 3,474 237 1.86
International Business Machines 2,287 218 1.71
Eastman Chemical 3,190 198 1.55
Gilead Sciences 3,440 188 1.47
Las Vegas Sands 4,327 185 1.45
Interpublic 9,441 180 1.41
Cisco Systems 4,790 178 1.40
Foot Locker 4,092 177 1.39
Gaming and Leisure Properties* 6,391 172 1.35
QUALCOMM 3,747 171 1.34
Public Service Enterprise 3,138 134 1.05
Hanesbrands 8,958 110 0.86 –––––––––––––––––––––––––––––––––––––––––– 5,455 42.76 –––––––––––––––––––––––––––––––––––––––––Portfolio of investments 12,457 97.64
Net other assets 301 2.36 ––––––––––––––––––––––––––––––––––––––––––Net assets 12,758 100.00 –––––––––––––––––––––––––––––––––––––––––
*Real Estate Investment Trust (REIT).
Unless otherwise stated the above securities are ordinary shares or common stock and admitted to offi cial stock exchange listings.
Stocks shown as ADRs represent American Depositary Receipts.
MARKET PERCENTAGE VALUE OF NET ASSETSASSET HOLDING (£’000) (%)
Portfolio statement continued
As at 30 November 2018

53Investec Funds Series iv
REPORT AND ACCOUNTS
Global Franchise Fund
MARKET PERCENTAGE VALUE OF NET ASSETSASSET HOLDING (£’000) (%)
BELGIUM 1.42% (31.05.18: 2.30%)Anheuser-Busch InBev ADR 18,100 1,096 1.42 –––––––––––––––––––––––––––––––––––––––––CHINA 0.94% (31.05.18: 1.02%)NetEase ADR 4,134 723 0.94 –––––––––––––––––––––––––––––––––––––––––GERMANY 3.04% (31.05.18: 2.57%)Beiersdorf 27,833 2,346 3.04 –––––––––––––––––––––––––––––––––––––––––IRELAND 1.50% (31.05.18: 1.76%)Medtronic 15,330 1,161 1.50 –––––––––––––––––––––––––––––––––––––––––ISRAEL 2.94% (31.05.18: 2.99%)Check Point Software Technologies 26,297 2,276 2.94 –––––––––––––––––––––––––––––––––––––––––JAPAN 0.00% (31.05.18: 2.12%)
NETHERLANDS 1.26% (31.05.18: 0.00%)ASML 7,333 972 1.26 –––––––––––––––––––––––––––––––––––––––––SOUTH KOREA 1.54% (31.05.18: 2.37%)Samsung Electronics GDR 1,624 1,188 1.54 –––––––––––––––––––––––––––––––––––––––––SPAIN 1.85% (31.05.18: 1.19%)Amadeus IT 25,128 1,431 1.85 –––––––––––––––––––––––––––––––––––––––––SWITZERLAND 8.09% (31.05.18: 7.32%)Nestle 48,599 3,262 4.22
Roche 14,921 2,988 3.87 –––––––––––––––––––––––––––––––––––––––––– 6,250 8.09 –––––––––––––––––––––––––––––––––––––––––UNITED KINGDOM 11.22% (31.05.18: 12.15%)Reckitt Benckiser 41,403 2,728 3.53
Unilever 59,112 2,532 3.27
Imperial Tobacco 84,113 2,009 2.60
GlaxoSmithKline 87,810 1,406 1.82 –––––––––––––––––––––––––––––––––––––––––– 8,675 11.22 –––––––––––––––––––––––––––––––––––––––––UNITED STATES 59.94% (31.05.18: 61.74%)Visa 53,949 5,884 7.61
Microsoft 58,165 5,024 6.50
VeriSign 33,183 4,076 5.27
Booking 2,623 3,836 4.96
Johnson & Johnson 33,084 3,783 4.89
Twenty-First Century Fox 93,957 3,649 4.72
Moody’s 29,368 3,606 4.66
Philip Morris International 48,195 3,287 4.25
Intuit 15,690 2,573 3.33
Factset Research Systems 10,039 1,838 2.38
S&P Global 12,212 1,727 2.23
Charles Schwab 47,606 1,648 2.13
Becton Dickinson 8,300 1,627 2.10
3M 9,141 1,466 1.89
Altria 31,889 1,398 1.81
Colgate-Palmolive 18,893 933 1.21 –––––––––––––––––––––––––––––––––––––––––– 46,355 59.94 –––––––––––––––––––––––––––––––––––––––––Portfolio of investments 72,473 93.74
Net other assets 4,842 6.26 ––––––––––––––––––––––––––––––––––––––––––Net assets 77,315 100.00 –––––––––––––––––––––––––––––––––––––––––
Unless otherwise stated the above securities are ordinary shares or common stock and admitted to offi cial stock exchange listings.
Stocks shown as ADR’s represent American Depositary Receipts.
Stocks shown as GDR’s represent Global Depositary Receipts.
Portfolio statement
As at 30 November 2018

REPORT AND ACCOUNTS
54 Investec Funds Series iv
MARKET PERCENTAGE VALUE OF NET ASSETSASSET HOLDING (£’000) (%)
CONSUMER GOODS 31.14% (31.05.18: 37.61%)BEVERAGESDiageo 25,211 713 3.65
Anheuser-Busch 6,598 402 2.06
PepsiCo 4,009 372 1.90 –––––––––––––––––––––––––––––––––––––––––– 1,487 7.61 –––––––––––––––––––––––––––––––––––––––––HOUSEHOLD GOODS & HOME CONSTRUCTIONReckitt Benckiser 13,046 859 4.39
Procter & Gamble 7,718 562 2.87 –––––––––––––––––––––––––––––––––––––––––– 1,421 7.26 –––––––––––––––––––––––––––––––––––––––––PERSONAL GOODSUnilever 14,286 611 3.12
Nike 8,539 498 2.55 –––––––––––––––––––––––––––––––––––––––––– 1,109 5.67 –––––––––––––––––––––––––––––––––––––––––TOBACCOImperial Tobacco 33,675 804 4.11
Philip Morris International 10,523 718 3.67
British American Tobacco 20,199 551 2.82 –––––––––––––––––––––––––––––––––––––––––– 2,073 10.60 –––––––––––––––––––––––––––––––––––––––––CONSUMER SERVICES 6.70% (31.05.18: 5.70%)MEDIATwenty-First Century Fox 17,606 684 3.50 –––––––––––––––––––––––––––––––––––––––––TRAVEL & LEISURESands China 99,600 338 1.73
Booking 197 288 1.47 –––––––––––––––––––––––––––––––––––––––––– 626 3.20 –––––––––––––––––––––––––––––––––––––––––FINANCIALS 9.75% (31.05.18: 7.61%)FINANCIAL SERVICESVisa 8,487 926 4.74
CME 2,894 429 2.19
Charles Schwab 10,034 347 1.77 –––––––––––––––––––––––––––––––––––––––––– 1,702 8.70 –––––––––––––––––––––––––––––––––––––––––REAL ESTATE INVESTMENT TRUSTSGrowthpoint Properties Australia 98,248 205 1.05 –––––––––––––––––––––––––––––––––––––––––HEALTH CARE 20.61% (31.05.18: 19.51%)HEALTH CARE EQUIPMENT & SERVICESBecton Dickinson 2,965 581 2.97
Medtronic 5,896 446 2.28 –––––––––––––––––––––––––––––––––––––––––– 1,027 5.25 –––––––––––––––––––––––––––––––––––––––––PHARMACEUTICALS & BIOTECHNOLOGYNovartis 12,990 928 4.75
GlaxoSmithKline 54,867 878 4.49
Johnson & Johnson 6,061 693 3.54
Roche 2,517 504 2.58 –––––––––––––––––––––––––––––––––––––––––– 3,003 15.36 –––––––––––––––––––––––––––––––––––––––––INDUSTRIALS 12.40% (31.05.18: 11.64%)‡
GENERAL INDUSTRIALS3M 1,982 318 1.63 –––––––––––––––––––––––––––––––––––––––––
Portfolio statement
As at 30 November 2018
Global Quality Equity Income Fund

55Investec Funds Series iv
REPORT AND ACCOUNTS
INDUSTRIAL ENGINEERINGKone 18,000 704 3.60
Rockwell Automation 3,029 408 2.09 –––––––––––––––––––––––––––––––––––––––––– 1,112 5.69 –––––––––––––––––––––––––––––––––––––––––SUPPORT SERVICESExperian 29,410 558 2.85
Automatic Data Processing 3,819 437 2.23 –––––––––––––––––––––––––––––––––––––––––– 995 5.08 –––––––––––––––––––––––––––––––––––––––––TECHNOLOGY 14.69% (31.05.18: 17.16%)‡
SOFTWARE & COMPUTER SERVICESMicrosoft 15,441 1,334 6.82
Amadeus IT 12,763 727 3.72
Sage 96,615 575 2.94 –––––––––––––––––––––––––––––––––––––––––– 2,636 13.48 –––––––––––––––––––––––––––––––––––––––––TECHNOLOGY HARDWARE & EQUIPMENTASML 1,778 236 1.21 –––––––––––––––––––––––––––––––––––––––––Portfolio of investments 18,634 95.29
Net other assets 922 4.71 ––––––––––––––––––––––––––––––––––––––––––Net assets 19,556 100.00 –––––––––––––––––––––––––––––––––––––––––
‡ Prior year comparatives restated.
Unless otherwise stated the above securities are ordinary shares or common stock and admitted to offi cial stock exchange listings.
MARKET PERCENTAGE VALUE OF NET ASSETSASSET HOLDING (£’000) (%)

REPORT AND ACCOUNTS
56 Investec Funds Series iv
MARKET PERCENTAGE VALUE OF NET ASSETSASSET HOLDING (£’000) (%)
AUSTRALIA 1.03% (31.05.18: 4.30%) WorleyParsons 236,934 1,786 1.03 –––––––––––––––––––––––––––––––––––––––––BRAZIL 6.35% (31.05.18: 2.39%)Cielo 3,078,420 5,576 3.23
Cia de Saneamento de Minas Gerais 187,521 1,978 1.15
Cia de Saneamento do Parana 154,963 1,815 1.05
Cia de Saneamento Basico do Estado de Sao Paulo 272,210 1,580 0.92 –––––––––––––––––––––––––––––––––––––––––– 10,949 6.35 –––––––––––––––––––––––––––––––––––––––––GUERNSEY 0.21% (31.05.17: 0.00%)Hipgnosis Songs Fund 342,921 365 0.21 –––––––––––––––––––––––––––––––––––––––––HONG KONG 0.90% (31.05.18: 1.13%)Chow Sang Sang Holdings International 1,293,000 1,560 0.90 –––––––––––––––––––––––––––––––––––––––––IRELAND 1.92% (31.05.18: 2.03%)Grafton 466,870 3,308 1.92 –––––––––––––––––––––––––––––––––––––––––JAPAN 4.97% (31.05.18: 5.47%)Resona 983,100 4,086 2.37
Japan Airlines 89,800 2,537 1.47
Japan Steel Works 136,600 1,954 1.13 –––––––––––––––––––––––––––––––––––––––––– 8,577 4.97 –––––––––––––––––––––––––––––––––––––––––LUXEMBOURG 1.25% (31.05.18: 1.82%)Tenaris 227,818 2,161 1.25 –––––––––––––––––––––––––––––––––––––––––NORWAY 1.34% (31.05.18: 1.30%)Yara International 72,854 2,307 1.34 –––––––––––––––––––––––––––––––––––––––––SOUTH KOREA 1.77% (31.05.17: 0.00%)Kangwon Land 135,190 3,049 1.77 –––––––––––––––––––––––––––––––––––––––––SWEDEN 2.82% (31.05.17: 0.00%)SKF 393,329 4,863 2.82 –––––––––––––––––––––––––––––––––––––––––TURKEY 4.12% (31.05.18: 2.81%)TAV Havalimanlari 2,015,159 7,104 4.12 –––––––––––––––––––––––––––––––––––––––––UNITED ARAB EMIRATES 1.80% (31.05.18: 2.16%)Aldar Properties 9,113,197 3,112 1.80 –––––––––––––––––––––––––––––––––––––––––UNITED KINGDOM 23.60% (31.05.18: 23.59%)Travis Perkins 525,527 5,762 3.34
Capita 5,244,891 5,612 3.25
Barclays 3,298,287 5,351 3.10
Lloyds Banking 9,241,093 5,076 2.94
Aggreko 562,902 4,217 2.44
Delphi Technologies 314,617 4,156 2.41
Royal Bank of Scotland 1,606,179 3,484 2.02
Next 49,909 2,503 1.45
Rolls-Royce 283,232 2,397 1.39
CYBG 1,073,756 2,163 1.25
Rolls-Royce ‘C’ Shares 12,183,468 12 0.01 –––––––––––––––––––––––––––––––––––––––––– 40,733 23.60 –––––––––––––––––––––––––––––––––––––––––
Portfolio statement
As at 30 November 2018
Global Special Situations Fund

57Investec Funds Series iv
REPORT AND ACCOUNTS
UNITED STATES 40.87% (31.05.18: 47.03%)Bank of America 391,349 8,603 4.98
Deere & Co 64,059 7,532 4.36
Citigroup 140,764 7,161 4.15
American Express 72,277 6,306 3.65
Welbilt 483,464 5,280 3.06
Northern Trust 67,288 5,117 2.96
Cars.com 231,698 4,770 2.76
Conduent 429,891 4,419 2.56
Signet Jewelers 96,586 3,925 2.27
Adient 198,843 3,662 2.12
Helmerich & Payne 60,107 2,881 1.67
Western Union 193,880 2,838 1.64
Advance Auto Parts 20,246 2,820 1.63
MicroStrategy 27,373 2,740 1.59
Tapestry 73,849 2,201 1.27
Avon Products 198,953 340 0.20 –––––––––––––––––––––––––––––––––––––––––– 70,595 40.87 –––––––––––––––––––––––––––––––––––––––––
FORWARD FOREIGN EXCHANGE CONTRACTS 0.00% (31.05.18: 0.00%)FORWARD CURRENCY CONTRACTSUAE dirham~Buy AED 946,180 for GBP 201,631 – –
Brazilian realBuy BRL 3,559,341 for GBP 723,055 1 – –––––––––––––––––––––––––––––––––––––––––– 1 – –––––––––––––––––––––––––––––––––––––––––Portfolio of investments 160,470 92.95
Net other assets 12,173 7.05 ––––––––––––––––––––––––––––––––––––––––––Net assets 172,643 100.00 –––––––––––––––––––––––––––––––––––––––––
Unless otherwise stated the above securities are ordinary shares or common stock and admitted to offi cial stock exchange listings.
~ The market value of the holdings is below £500 and is therefore rounded down to £0.
MARKET PERCENTAGE VALUE OF NET ASSETSASSET HOLDING (£’000) (%)

REPORT AND ACCOUNTS
58 Investec Funds Series iv
MARKET PERCENTAGE VALUE OF NET ASSETSASSET HOLDING (£’000) (%)
ALTERNATIVES 3.01% (31.05.18: 2.36%) BBGI SICAV 1,212,273 1,867 1.10
HICL Infrastructure 1,044,370 1,690 1.00
3i Infrastructure 603,825 1,541 0.91 –––––––––––––––––––––––––––––––––––––––––– 5,098 3.01 –––––––––––––––––––––––––––––––––––––––––EQUITIES 24.62% (31.05.18: 38.93%) GLOBAL EQUITIES 10.07% (31.05.18: 14.44%)Vanguard S&P 500 UCITS ETF 86,878 3,537 2.09
iShares Core MSCI Emerging Markets UCITS ETF 169,611 3,501 2.07
Investec GSF Asian Equity Fund† 152,623 3,465 2.05
Investec Global Equity Fund† 1,438,118 2,573 1.52
Investec GSF Global Endurance Equity Fund† 81,823 2,266 1.34
Investec GSF All China Equity Fund† 95,518 1,695 1.00 –––––––––––––––––––––––––––––––––––––––––– 17,037 10.07 –––––––––––––––––––––––––––––––––––––––––REGION THEMATIC 0.82% (31.05.18: 5.02%)iShares MSCI Japan UCITS ETF 128,063 1,394 0.82 –––––––––––––––––––––––––––––––––––––––––SECTOR THEMATIC 6.20% (31.05.18: 6.68%)INSURANCETravelers 3,306 338 0.20
Reinsurance Group of America 2,882 333 0.20
Essent 10,685 325 0.19
American Financial 4,012 323 0.19
MGIC Investment 34,616 317 0.19
Chubb 2,869 302 0.18
Hiscox 17,724 298 0.18
Arch Capital 13,375 297 0.17
Beazley 51,006 286 0.17
Intact Financial 4,108 250 0.15 –––––––––––––––––––––––––––––––––––––––––– 3,069 1.82 –––––––––––––––––––––––––––––––––––––––––MINERSGlencore 60,136 174 0.10
Rio Tinto 4,232 151 0.09
Anglo American 9,273 146 0.09
South32 74,566 132 0.08
Boliden Redemption Shares 6,382 112 0.07
BHP Billiton 5,723 87 0.05 –––––––––––––––––––––––––––––––––––––––––– 802 0.48 –––––––––––––––––––––––––––––––––––––––––SPIN OFFPark Hotels & Resorts REIT* 9,629 231 0.14
Cars.com 9,748 201 0.12
DXC Technology 3,787 185 0.11
DowDuPont 3,775 169 0.10
KLX 9,506 150 0.09
Conduent 13,485 139 0.08
Pentair 3,975 132 0.08
Adient 5,696 105 0.06
NOW 9,324 103 0.06
nVent Electric 3,975 78 0.05
Delphi Technologies 5,074 67 0.04
Equitrans Midstream 1,748 32 0.02
Perspecta 1,414 23 0.01
Garrett Motion 525 5 – –––––––––––––––––––––––––––––––––––––––––– 1,620 0.96 –––––––––––––––––––––––––––––––––––––––––
Portfolio statement
As at 30 November 2018
Multi-Asset Protector Fund
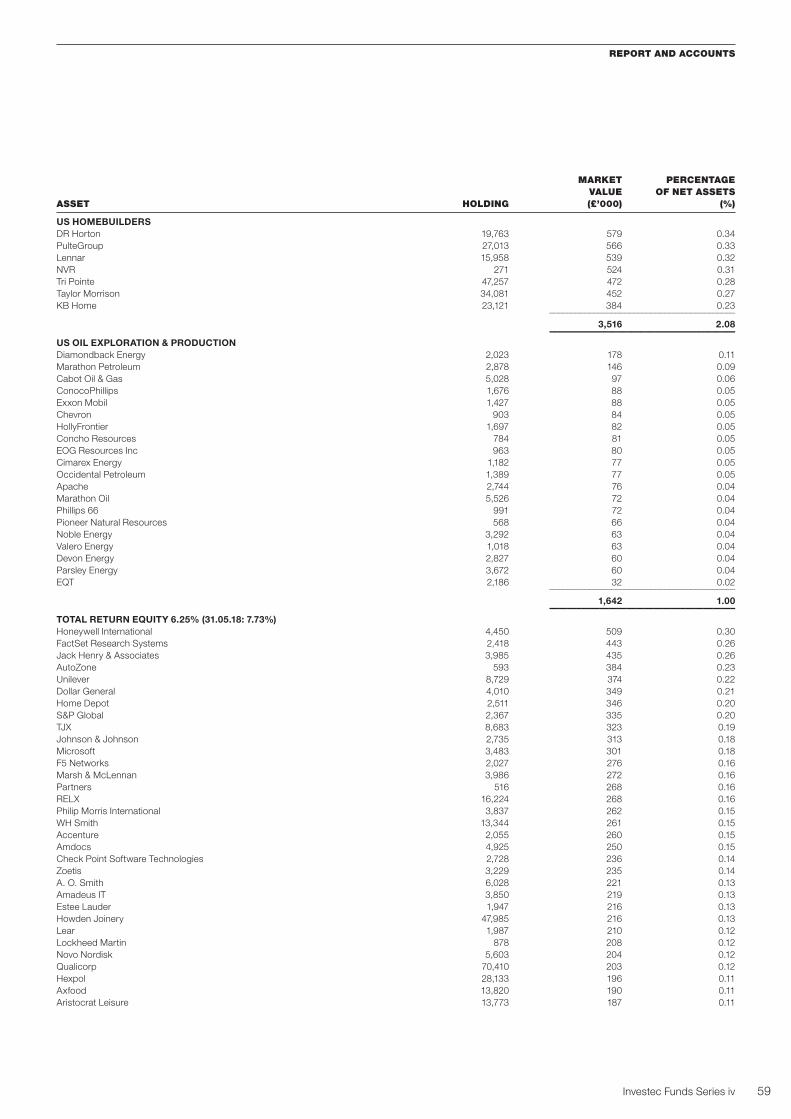
59Investec Funds Series iv
REPORT AND ACCOUNTS
US HOMEBUILDERSDR Horton 19,763 579 0.34
PulteGroup 27,013 566 0.33
Lennar 15,958 539 0.32
NVR 271 524 0.31
Tri Pointe 47,257 472 0.28
Taylor Morrison 34,081 452 0.27
KB Home 23,121 384 0.23 –––––––––––––––––––––––––––––––––––––––––– 3,516 2.08 –––––––––––––––––––––––––––––––––––––––––US OIL EXPLORATION & PRODUCTIONDiamondback Energy 2,023 178 0.11
Marathon Petroleum 2,878 146 0.09
Cabot Oil & Gas 5,028 97 0.06
ConocoPhillips 1,676 88 0.05
Exxon Mobil 1,427 88 0.05
Chevron 903 84 0.05
HollyFrontier 1,697 82 0.05
Concho Resources 784 81 0.05
EOG Resources Inc 963 80 0.05
Cimarex Energy 1,182 77 0.05
Occidental Petroleum 1,389 77 0.05
Apache 2,744 76 0.04
Marathon Oil 5,526 72 0.04
Phillips 66 991 72 0.04
Pioneer Natural Resources 568 66 0.04
Noble Energy 3,292 63 0.04
Valero Energy 1,018 63 0.04
Devon Energy 2,827 60 0.04
Parsley Energy 3,672 60 0.04
EQT 2,186 32 0.02 –––––––––––––––––––––––––––––––––––––––––– 1,642 1.00 –––––––––––––––––––––––––––––––––––––––––TOTAL RETURN EQUITY 6.25% (31.05.18: 7.73%)Honeywell International 4,450 509 0.30
FactSet Research Systems 2,418 443 0.26
Jack Henry & Associates 3,985 435 0.26
AutoZone 593 384 0.23
Unilever 8,729 374 0.22
Dollar General 4,010 349 0.21
Home Depot 2,511 346 0.20
S&P Global 2,367 335 0.20
TJX 8,683 323 0.19
Johnson & Johnson 2,735 313 0.18
Microsoft 3,483 301 0.18
F5 Networks 2,027 276 0.16
Marsh & McLennan 3,986 272 0.16
Partners 516 268 0.16
RELX 16,224 268 0.16
Philip Morris International 3,837 262 0.15
WH Smith 13,344 261 0.15
Accenture 2,055 260 0.15
Amdocs 4,925 250 0.15
Check Point Software Technologies 2,728 236 0.14
Zoetis 3,229 235 0.14
A. O. Smith 6,028 221 0.13
Amadeus IT 3,850 219 0.13
Estee Lauder 1,947 216 0.13
Howden Joinery 47,985 216 0.13
Lear 1,987 210 0.12
Lockheed Martin 878 208 0.12
Novo Nordisk 5,603 204 0.12
Qualicorp 70,410 203 0.12
Hexpol 28,133 196 0.11
Axfood 13,820 190 0.11
Aristocrat Leisure 13,773 187 0.11
MARKET PERCENTAGE VALUE OF NET ASSETSASSET HOLDING (£’000) (%)

REPORT AND ACCOUNTS
60 Investec Funds Series iv
Portfolio statement continued
As at 30 November 2018
TOTAL RETURN EQUITY 6.25% (31.05.18: 7.73%) (continued)Northrop Grumman 867 177 0.10
Britvic 19,938 168 0.10
3M 1,039 167 0.10
Micro Focus International 10,020 155 0.09
Moncler 5,826 150 0.09
Hasbro 1,838 140 0.08
Illinois Tool Works 1,262 135 0.08
Hargreaves Lansdown 6,522 126 0.07
Taiwan Semiconductor Manufacturing ADR 4,149 123 0.07
TravelSky Technology 50,000 105 0.06
Aptiv 1,622 91 0.05
Keurig Dr Pepper 3,276 69 0.04
Thor Industries 1,334 69 0.04 –––––––––––––––––––––––––––––––––––––––––– 10,645 6.25 –––––––––––––––––––––––––––––––––––––––––UK EQUITIES 1.14% (31.05.18: 5.06%)Investec UK Smaller Companies Fund† 16,067 789 0.47
Lloyds Banking 545,534 300 0.18
Land Securities REIT* 35,490 288 0.17
British Land REIT* 49,313 274 0.16
Barclays 97,774 159 0.09
Royal Bank of Scotland 57,911 126 0.07 –––––––––––––––––––––––––––––––––––––––––– 1,936 1.14 –––––––––––––––––––––––––––––––––––––––––FIXED INCOME 32.14% (31.05.18: 37.25%)CORPORATE HIGH YIELD 5.41% (31.05.18: 4.93%)Investec Diversifi ed Income Fund† 3,250,059 5,401 3.19
H2O Multibonds 22 3,751 2.22 –––––––––––––––––––––––––––––––––––––––––– 9,152 5.41 –––––––––––––––––––––––––––––––––––––––––EMERGING MARKETS DEBT 3.84% (31.05.18: 3.54%)New Capital Wealthy Nations Bond Fund (GBP) 61,706 6,504 3.84 –––––––––––––––––––––––––––––––––––––––––EMERGING MARKETS EQUITY 1.08% (31.05.18: 0.00%)Investec GSF Emerging Markets† 79,271 1,836 1.08 –––––––––––––––––––––––––––––––––––––––––GOVERNMENT BOND 21.81% (31.05.18: 28.78%)iShares UK Gilts 0-5 Years UCITS ETF GBP 110,607 14,672 8.67
iShares USD Treasury Bond 20 Years UCITS ETF USD 3,951,889 13,471 7.96
United States Treasury Note 2.25% 15/08/2046 USD 6,989,300 4,423 2.61
United States Treasury Note 2.875% 15/11/2046 USD 6,035,200 4,355 2.57 –––––––––––––––––––––––––––––––––––––––––– 36,921 21.81 –––––––––––––––––––––––––––––––––––––––––GOVERNMENT TREASURY BILLS 35.58% (31.05.18: 17.76%)United Kingdom Treasury Bill 14/01/2019 GBP 9,000,000 8,992 5.31
United Kingdom Treasury Bill 28/01/2019 GBP 8,000,000 7,991 4.72
United Kingdom Treasury Bill 18/02/2019 GBP 8,000,000 7,987 4.72
United Kingdom Treasury Bill 18/03/2019 GBP 7,000,000 6,984 4.13
United Kingdom Treasury Bill 04/02/2019 GBP 6,500,000 6,491 3.84
United Kingdom Treasury Bill 03/12/2018 GBP 5,000,000 5,000 2.95
United Kingdom Treasury Bill 11/02/2019 GBP 3,500,000 3,495 2.06
United Kingdom Treasury Bill 17/12/2018 GBP 3,000,000 2,999 1.77
United Kingdom Treasury Bill 04/03/2019 GBP 3,000,000 2,995 1.77
United Kingdom Treasury Bill 25/02/2019 GBP 2,300,000 2,296 1.36
United Kingdom Treasury Bill 24/12/2018 GBP 2,000,000 1,999 1.18
United Kingdom Treasury Bill 25/03/2019 GBP 2,000,000 1,995 1.18
United Kingdom Treasury Bill 10/12/2018 GBP 1,000,000 1,000 0.59 –––––––––––––––––––––––––––––––––––––––––– 60,224 35.58 –––––––––––––––––––––––––––––––––––––––––PROPERTY 3.02% (31.05.18: 2.55%) Investec GSF Global Real Estate Securities Fund† 221,581 3,210 1.90
iShares US Property Yield UCITS ETF 85,821 1,889 1.12 –––––––––––––––––––––––––––––––––––––––––– 5,099 3.02 –––––––––––––––––––––––––––––––––––––––––
MARKET PERCENTAGE VALUE OF NET ASSETSASSET HOLDING (£’000) (%)

61Investec Funds Series iv
REPORT AND ACCOUNTS
FORWARD FOREIGN EXCHANGE CONTRACTS (0.85%) (31.05.18: (1.86%))FORWARD CURRENCY CONTRACTSEuro Sell EUR (6,858,000) for GBP 6,135,037 21 0.01
US DollarBuy USD 11,353,000 for GBP (8,690,902) 208 0.12
Sell USD (76,700,600) for GBP 58,465,530 (1,666) (0.98) –––––––––––––––––––––––––––––––––––––––––– (1,437) (0.85) –––––––––––––––––––––––––––––––––––––––––Portfolio of investments^ 165,058 97.52
Net other assets 4,198 2.48 ––––––––––––––––––––––––––––––––––––––––––Net assets 169,256 100.00 –––––––––––––––––––––––––––––––––––––––––
^ Including derivative liabilities.
† A related party to the Fund.
* Real Estate Investment Trust (REIT).
Unless otherwise stated the above securities are ordinary shares or common stock and admitted to offi cial stock exchange listings.
The collective investment schemes investments, interest rate swaps, total return swaps and the forward foreign exchange contracts are not listed.
Stocks shown as ADR s represent American Depositary Receipts.
Portfolio Analysis 30.11.18 31.05.18 MARKET PERCENTAGE MARKET PERCENTAGE VALUE OF NET ASSETS VALUE OF NET ASSETSASSET (£’000) (%) (£’000) (%)
Bonds 8,778 5.18 9,743 5.18
Collective Investment Schemes 75,052 44.35 115,684 61.50
Derivatives
Equities 22,441 13.26 27,091 14.41
Forward Foreign Exchange Contracts (1,437) (0.85) (3,504) (1.86)
Government Treasury Bills 60,224 35.58 33,380 17.76
Net other assets 4,198 2.48 5,652 3.01
Net assets 169,256 100.00 188,046 100.00
Credit Breakdown* 30.11.18 31.05.18 MARKET PERCENTAGE MARKET PERCENTAGE VALUE OF NET ASSETS VALUE OF NET ASSETSASSET (£’000) (%) (£’000) (%)
AAA 8,778 5.18
AA 9,743 5.18
Total Bonds 8,778 5.18 9,743 5.18
* Bond ratings are Investec approximations.
MARKET PERCENTAGE VALUE OF NET ASSETSASSET HOLDING (£’000) (%)
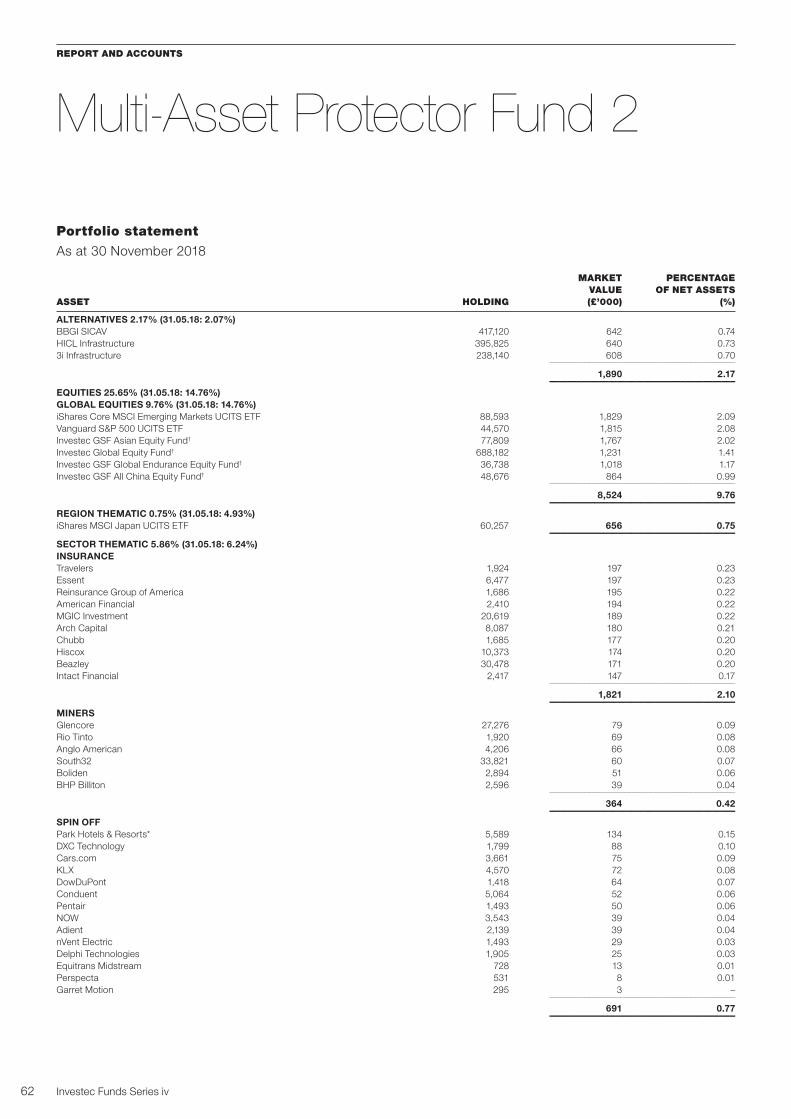
REPORT AND ACCOUNTS
62 Investec Funds Series iv
MARKET PERCENTAGE VALUE OF NET ASSETSASSET HOLDING (£’000) (%)
ALTERNATIVES 2.17% (31.05.18: 2.07%) BBGI SICAV 417,120 642 0.74
HICL Infrastructure 395,825 640 0.73
3i Infrastructure 238,140 608 0.70 –––––––––––––––––––––––––––––––––––––––––– 1,890 2.17 –––––––––––––––––––––––––––––––––––––––––EQUITIES 25.65% (31.05.18: 14.76%)GLOBAL EQUITIES 9.76% (31.05.18: 14.76%)iShares Core MSCI Emerging Markets UCITS ETF 88,593 1,829 2.09
Vanguard S&P 500 UCITS ETF 44,570 1,815 2.08
Investec GSF Asian Equity Fund† 77,809 1,767 2.02
Investec Global Equity Fund† 688,182 1,231 1.41
Investec GSF Global Endurance Equity Fund† 36,738 1,018 1.17
Investec GSF All China Equity Fund† 48,676 864 0.99 –––––––––––––––––––––––––––––––––––––––––– 8,524 9.76 –––––––––––––––––––––––––––––––––––––––––REGION THEMATIC 0.75% (31.05.18: 4.93%)iShares MSCI Japan UCITS ETF 60,257 656 0.75 –––––––––––––––––––––––––––––––––––––––––SECTOR THEMATIC 5.86% (31.05.18: 6.24%)INSURANCETravelers 1,924 197 0.23
Essent 6,477 197 0.23
Reinsurance Group of America 1,686 195 0.22
American Financial 2,410 194 0.22
MGIC Investment 20,619 189 0.22
Arch Capital 8,087 180 0.21
Chubb 1,685 177 0.20
Hiscox 10,373 174 0.20
Beazley 30,478 171 0.20
Intact Financial 2,417 147 0.17 –––––––––––––––––––––––––––––––––––––––––– 1,821 2.10 –––––––––––––––––––––––––––––––––––––––––MINERS Glencore 27,276 79 0.09
Rio Tinto 1,920 69 0.08
Anglo American 4,206 66 0.08
South32 33,821 60 0.07
Boliden 2,894 51 0.06
BHP Billiton 2,596 39 0.04 –––––––––––––––––––––––––––––––––––––––––– 364 0.42 –––––––––––––––––––––––––––––––––––––––––SPIN OFFPark Hotels & Resorts* 5,589 134 0.15
DXC Technology 1,799 88 0.10
Cars.com 3,661 75 0.09
KLX 4,570 72 0.08
DowDuPont 1,418 64 0.07
Conduent 5,064 52 0.06
Pentair 1,493 50 0.06
NOW 3,543 39 0.04
Adient 2,139 39 0.04
nVent Electric 1,493 29 0.03
Delphi Technologies 1,905 25 0.03
Equitrans Midstream 728 13 0.01
Perspecta 531 8 0.01
Garret Motion 295 3 – –––––––––––––––––––––––––––––––––––––––––– 691 0.77 –––––––––––––––––––––––––––––––––––––––––
Portfolio statement
As at 30 November 2018
Multi-Asset Protector Fund 2

63Investec Funds Series iv
REPORT AND ACCOUNTS
US HOMEBUILDERSDR Horton 8,408 246 0.28
PulteGroup 11,493 241 0.28
Lennar 6,790 229 0.26
NVR 115 223 0.25
KB Home 13,353 222 0.25
Taylor Morrison Home 16,085 213 0.24
Tri Pointe 20,106 201 0.23 –––––––––––––––––––––––––––––––––––––––––– 1,575 1.79 –––––––––––––––––––––––––––––––––––––––––US OIL EXPLORATION & PRODUCTIONDiamondback Energy 842 74 0.08
Marathon Petroleum 1,197 61 0.07
Cabot Oil & Gas 2,094 40 0.05
ConocoPhillips 698 37 0.04
Exxon Mobil 594 37 0.04
Chevron 376 35 0.04
Concho Resources 326 34 0.04
HollyFrontier 707 34 0.04
EOG Resources 401 33 0.04
Apache 1,143 32 0.04
Cimarex Energy 492 32 0.04
Occidental Petroleum 578 32 0.04
Marathon Oil 2,301 30 0.03
Phillips 66 413 30 0.03
Pioneer Natural Resources 237 28 0.03
Noble Energy 1,371 26 0.03
Valero Energy 424 26 0.03
Devon Energy 1,177 25 0.03
Parsley Energy 1,529 25 0.03
EQT 910 13 0.01 –––––––––––––––––––––––––––––––––––––––––– 684 0.78 –––––––––––––––––––––––––––––––––––––––––TOTAL RETURN EQUITY 8.28% (31.05.18: 7.12%)Honeywell International 2,958 338 0.38
FactSet Research Systems 1,625 297 0.34
AutoZone 413 267 0.31
Unilever 6,065 260 0.30
Jack Henry & Associates 2,366 258 0.29
Home Depot 1,740 240 0.27
Dollar General 2,706 235 0.27
S&P Global 1,604 227 0.26
Philip Morris International 3,297 225 0.26
Johnson & Johnson 1,947 223 0.25
TJX 5,542 206 0.24
Microsoft 2,227 192 0.22
Marsh & McLennan 2,752 188 0.22
RELX 11,132 184 0.21
Amdocs 3,608 183 0.21
F5 Networks 1,316 179 0.20
WH Smith 9,098 178 0.20
Accenture 1,411 178 0.20
Zoetis 2,332 170 0.19
Partners 320 166 0.19
Check Point Software Technologies 1,866 161 0.18
Amadeus IT 2,734 156 0.18
Qualicorp 53,745 155 0.18
Novo Nordisk 4,021 147 0.17
Lockheed Martin 618 146 0.17
Estee Lauder 1,307 145 0.17
Lear 1,371 145 0.17
A. O. Smith 3,952 145 0.17
Axfood 10,229 141 0.16
Britvic 16,243 137 0.16
Northrop Grumman 665 136 0.16
Hexpol 18,612 130 0.15
Howden Joinery 26,505 120 0.14
MARKET PERCENTAGE VALUE OF NET ASSETSASSET HOLDING (£’000) (%)

REPORT AND ACCOUNTS
64 Investec Funds Series iv
TOTAL RETURN EQUITY 8.28% (31.05.18: 7.12%) (continued)Aristocrat Leisure 8,792 119 0.14
Illinois Tool Works 1,084 115 0.13
Taiwan Semiconductor Manufacturing ADR 3,725 111 0.13
3M 667 107 0.12
Moncler 3,079 79 0.09
Thor Industries 1,494 77 0.09
Hasbro 994 75 0.09
TravelSky Technology 35,000 74 0.08
Micro Focus International 3,914 61 0.07
Hargreaves Lansdown 2,870 56 0.06
Aptiv 943 53 0.06
Keurig Dr Pepper 2,147 45 0.05 –––––––––––––––––––––––––––––––––––––––––– 7,230 8.28 –––––––––––––––––––––––––––––––––––––––––UK EQUITIES 1.00% (31.05.18: 4.93%)Investec UK Smaller Companies Fund† 7,695 378 0.43
Lloyds Banking 235,994 130 0.15
Land Securities* 15,353 125 0.14
British Land* 21,333 118 0.14
Barclays 42,296 69 0.08
Royal Bank of Scotland 25,052 54 0.06 –––––––––––––––––––––––––––––––––––––––––– 874 1.00 –––––––––––––––––––––––––––––––––––––––––FIXED INCOME 30.56% (31.05.18: 36.21%)CORPORATE HIGH YIELD 4.49% (31.05.18: 4.65%)Investec Diversifi ed Income Fund† 1,434,383 2,384 2.73
H2O Multibonds 9 1,540 1.76 –––––––––––––––––––––––––––––––––––––––––– 3,924 4.49 –––––––––––––––––––––––––––––––––––––––––EMERGING MARKETS DEBT 4.43% (31.05.18: 3.50%)New Capital Wealthy Nations Bond Fund (GBP) 28,526 3,007 3.44
Investec GSF - Emerging Markets Corporate Debt† 37,241 862 0.99 –––––––––––––––––––––––––––––––––––––––––– 3,869 4.43 –––––––––––––––––––––––––––––––––––––––––GOVERNMENT BOND 21.64% (31.05.18: 28.06%)iShares USD Treasury Bond 20 Years UCITS ETF USD 2,211,065 7,537 8.63
iShares UK Gilts 0-5 Years UCITS ETF GBP 52,329 6,941 7.95
United States Treasury Note 2.25% 15/08/2046 USD 3,510,800 2,222 2.54
United States Treasury Note 2.875% 15/11/2046 USD 3,053,000 2,203 2.52 –––––––––––––––––––––––––––––––––––––––––– 18,903 21.64 –––––––––––––––––––––––––––––––––––––––––GOVERNMENT TREASURY BILLS 38.22% (31.05.18: 17.53%)United Kingdom Treasury Bill 28/06/2019 GBP 6,000,000 5,993 6.86
United Kingdom Treasury Bill 14/01/2019 GBP 4,000,000 3,997 4.58
United Kingdom Treasury Bill 18/02/2019 GBP 3,500,000 3,494 4.00
United Kingdom Treasury Bill 18/03/2019 GBP 3,500,000 3,492 4.00
United Kingdom Treasury Bill 10/12/2018 GBP 3,400,000 3,399 3.89
United Kingdom Treasury Bill 04/02/2019 GBP 2,500,000 2,497 2.86
United Kingdom Treasury Bill 03/12/2018 GBP 2,000,000 2,000 2.29
United Kingdom Treasury Bill 11/02/2019 GBP 2,000,000 1,997 2.29
United Kingdom Treasury Bill 25/02/2019 GBP 1,700,000 1,697 1.94
United Kingdom Treasury Bill 04/03/2019 GBP 1,500,000 1,498 1.72
United Kingdom Treasury Bill 25/03/2019 GBP 1,300,000 1,297 1.49
United Kingdom Treasury Bill 17/12/2018 GBP 1,000,000 1,000 1.15
United Kingdom Treasury Bill 24/12/2018 GBP 1,000,000 1,000 1.15 –––––––––––––––––––––––––––––––––––––––––– 33,361 38.22 –––––––––––––––––––––––––––––––––––––––––PROPERTY 2.47% (31.05.18: 2.54%)Investec GSF Global Real Estate Securities Fund† 78,292 1,134 1.30
iShares US Property Yield UCITS ETF 46,573 1,025 1.17 –––––––––––––––––––––––––––––––––––––––––– 2,159 2.47 –––––––––––––––––––––––––––––––––––––––––
MARKET PERCENTAGE VALUE OF NET ASSETSASSET HOLDING (£’000) (%)
Portfolio statement continued
As at 30 November 2018

65Investec Funds Series iv
REPORT AND ACCOUNTS
FORWARD FOREIGN EXCHANGE CONTRACTS (0.82%) (31.05.18: (1.86%))FORWARD CURRENCY CONTRACTSEuro Sell EUR (2,770,000) for GBP 2,477,989 8 0.01
US DollarBuy USD 2,280,000 for GBP (1,734,943) 53 0.06
Sell USD (35,940,500) for GBP 27,399,076 (777) (0.89) –––––––––––––––––––––––––––––––––––––––––– (716) (0.82) –––––––––––––––––––––––––––––––––––––––––Portfolio of investments^ 85,809 98.25
Net other assets 1,525 1.75 ––––––––––––––––––––––––––––––––––––––––––Net assets 87,334 100.00 –––––––––––––––––––––––––––––––––––––––––
^ Including derivative liabilities.
* Real Estate Investment Trust (REIT).
† A related party to the Fund.
Unless otherwise stated the above securities are ordinary shares or common stock and admitted to offi cial stock exchange listings.
Stocks shown as ADRs represent American Depositary Receipts.
Portfolio Analysis 30.11.18 31.05.18 MARKET PERCENTAGE MARKET PERCENTAGE VALUE OF NET ASSETS VALUE OF NET ASSETSASSET (£’000) (%) (£’000) (%)
Bonds 4,425 5.06 3,991 5.00
Collective Investment Schemes 35,878 41.08 48,224 60.44
Equities 12,861 14.71 10,662 13.36
Forward Foreign Exchange Contracts (716) (0.82) (1,486) (1.86)
Government Treasury Bills 33,361 38.22 13,991 17.53
Net other assets 1,525 1.75 4,410 5.53
Net assets 87,334 100.00 79,792 100.00
Credit Breakdown* 30.11.18 31.05.18 MARKET PERCENTAGE MARKET PERCENTAGE VALUE OF NET ASSETS VALUE OF NET ASSETSASSET (£’000) (%) (£’000) (%)
AAA 4,425 5.06 – –
AA – – 3,991 5.00
Total Bonds 4,425 5.06 3,991 5.00
*Bond ratings are Investec approximations.
MARKET PERCENTAGE VALUE OF NET ASSETSASSET HOLDING (£’000) (%)

REPORT AND ACCOUNTS
66 Investec Funds Series iv
MARKET PERCENTAGE VALUE OF NET ASSETSASSET HOLDING (£’000) (%)
CORPORATE BONDS 19.74% (31.05.18: 19.43%) UBS 2.45% 01/12/2020 USD 2,680,000 2,052 1.03
Santander UK 2.125% 03/11/2020 USD 2,700,000 2,049 1.03
Wells Fargo Bank 3.625% 22/10/2021 USD 2,600,000 2,036 1.02
Citibank 3.4% 23/07/2021 USD 2,593,000 2,019 1.01
Morgan Stanley (FRN) 3.88738% 24/10/2023 USD 2,545,000 2,006 1.01
JPMorgan Chase (FRN) 3.71738% 24/10/2023 USD 2,498,000 1,967 0.99
Bank of America (FRN) 0.383% 25/04/2024 EUR 2,237,000 1,949 0.98
Barclays 2.625% 11/11/2025 EUR 1,070,000 950 0.48
eircom Finance 4.5% 31/05/2022 EUR 930,000 843 0.42
Sprint Capital 6.9% 01/05/2019 USD 1,030,000 817 0.41
Lennar 2.95% 29/11/2020 USD 1,046,000 799 0.40
Bausch Health 6.5% 15/03/2022 USD 950,000 768 0.39
CenturyLink 6.45% 15/06/2021 USD 920,000 735 0.37
Nielsen Finance 5% 15/04/2022 USD 950,000 726 0.36
Sinclair Television 6.125% 01/10/2022 USD 890,000 711 0.36
Constellation Brands 3.875% 15/11/2019 USD 900,000 708 0.36
CCO 5.25% 15/03/2021 USD 900,000 707 0.36
DR Horton 3.75% 01/03/2019 USD 900,000 705 0.35
PulteGroup 4.25% 01/03/2021 USD 890,000 697 0.35
Tenet Healthcare 6% 01/10/2020 USD 870,000 697 0.35
Reynolds Group Issuer 5.75% 15/10/2020 USD 866,018 679 0.34
Merlin Entertainments 2.75% 15/03/2022 EUR 700,000 636 0.32
Elis 1.875% 15/02/2023 EUR 700,000 621 0.31
Huntsman International 4.875% 15/11/2020 USD 750,000 593 0.30
Crown European 4% 15/07/2022 EUR 600,000 582 0.29
Nabors Industries 5% 15/09/2020 USD 750,000 581 0.29
Ball 5% 15/03/2022 USD 690,000 553 0.28
TA Manufacturing 3.625% 15/04/2023 EUR 600,000 540 0.27
Spectrum Brands 7.75% 15/01/2022 USD 650,000 521 0.26
William Hill 4.25% 05/06/2020 GBP 500,000 501 0.25
Hughes Satellite Systems 7.625% 15/06/2021 USD 600,000 493 0.25
Citigroup (FRN) 3.83713% 08/12/2021 USD 600,000 471 0.24
CPUK Finance 4.25% 28/08/2022 GBP 480,000 469 0.24
CSC 5.125% 15/12/2021 USD 600,000 468 0.24
Jaguar Land Rover Automotive 4.25% 15/11/2019 USD 600,000 467 0.23
Telecom Italia 6.375% 24/06/2019 GBP 450,000 459 0.23
Chesapeake Energy (FRN) 5.68631% 15/04/2019 USD 572,000 448 0.22
International Game Technology 6.25% 15/02/2022 USD 550,000 444 0.22
Yum! Brands 3.875% 01/11/2020 USD 568,000 443 0.22
Ardagh Packaging Finance 4.25% 15/09/2022 USD 580,000 441 0.22
T-Mobile USA 4% 15/04/2022 USD 570,000 439 0.22
NGPL PipeCo 4.375% 15/08/2022 USD 560,000 433 0.22
Cablevision Systems 5.875% 15/09/2022 USD 550,000 431 0.22
Dell 5.875% 15/06/2019 USD 500,000 394 0.20
GLP Capital 4.875% 01/11/2020 USD 490,000 388 0.19
Iron Mountain 4.375% 01/06/2021 USD 484,000 376 0.19
Credit Suisse Group Funding Guernsey (FRN) 4.73456% 16/04/2021 USD 440,000 357 0.18
Credit Agricole 2.75% 10/06/2020 USD 400,000 310 0.16
United (FRN) 4.375% 01/07/2023 EUR 350,000 308 0.15
UBS 2.45% 01/12/2020 Private Placement USD 400,000 307 0.15
Synlab Bondco 6.25% 01/07/2022 EUR 250,000 229 0.12
Huntsman International 5.125% 15/04/2021 EUR 200,000 192 0.10
ING Bank 5% 09/06/2021 USD 200,000 162 0.08
ING Bank 2.45% 16/03/2020 USD 200,000 155 0.08
Hughes Satellite Systems 6.5% 15/06/2019 USD 193,000 153 0.08
United 4.375% 01/07/2022 EUR 172,000 151 0.08
Guala Closures (FRN) 3.5% 15/04/2024 EUR 100,000 89 0.04
Continental Resources 5% 15/09/2022 USD 80,000 62 0.03 –––––––––––––––––––––––––––––––––––––––––– 39,287 19.74 –––––––––––––––––––––––––––––––––––––––––
Portfolio statement
As at 30 November 2018
Target Return Bond Fund
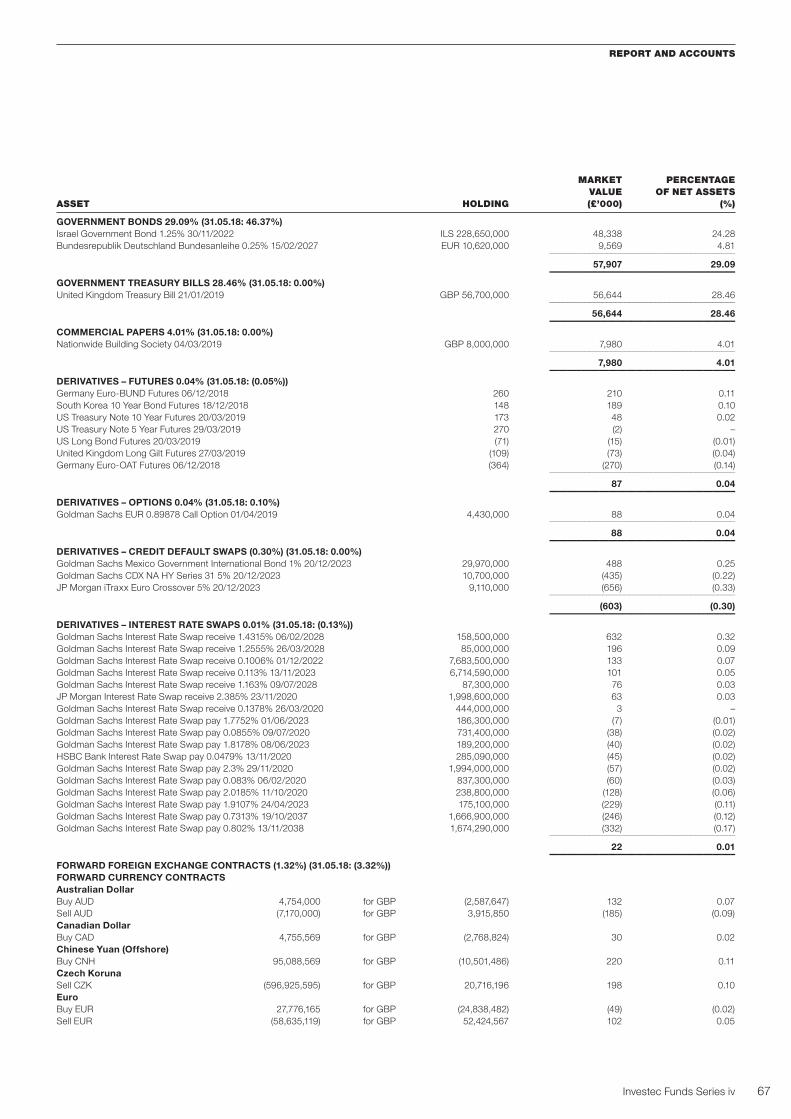
67Investec Funds Series iv
REPORT AND ACCOUNTS
GOVERNMENT BONDS 29.09% (31.05.18: 46.37%)Israel Government Bond 1.25% 30/11/2022 ILS 228,650,000 48,338 24.28
Bundesrepublik Deutschland Bundesanleihe 0.25% 15/02/2027 EUR 10,620,000 9,569 4.81 –––––––––––––––––––––––––––––––––––––––––– 57,907 29.09 –––––––––––––––––––––––––––––––––––––––––GOVERNMENT TREASURY BILLS 28.46% (31.05.18: 0.00%)United Kingdom Treasury Bill 21/01/2019 GBP 56,700,000 56,644 28.46 –––––––––––––––––––––––––––––––––––––––––– 56,644 28.46 –––––––––––––––––––––––––––––––––––––––––COMMERCIAL PAPERS 4.01% (31.05.18: 0.00%)Nationwide Building Society 04/03/2019 GBP 8,000,000 7,980 4.01 –––––––––––––––––––––––––––––––––––––––––– 7,980 4.01 –––––––––––––––––––––––––––––––––––––––––DERIVATIVES – FUTURES 0.04% (31.05.18: (0.05%))Germany Euro-BUND Futures 06/12/2018 260 210 0.11
South Korea 10 Year Bond Futures 18/12/2018 148 189 0.10
US Treasury Note 10 Year Futures 20/03/2019 173 48 0.02
US Treasury Note 5 Year Futures 29/03/2019 270 (2) –
US Long Bond Futures 20/03/2019 (71) (15) (0.01)
United Kingdom Long Gilt Futures 27/03/2019 (109) (73) (0.04)
Germany Euro-OAT Futures 06/12/2018 (364) (270) (0.14) –––––––––––––––––––––––––––––––––––––––––– 87 0.04 –––––––––––––––––––––––––––––––––––––––––DERIVATIVES – OPTIONS 0.04% (31.05.18: 0.10%)Goldman Sachs EUR 0.89878 Call Option 01/04/2019 4,430,000 88 0.04 –––––––––––––––––––––––––––––––––––––––––– 88 0.04 –––––––––––––––––––––––––––––––––––––––––DERIVATIVES – CREDIT DEFAULT SWAPS (0.30%) (31.05.18: 0.00%)Goldman Sachs Mexico Government International Bond 1% 20/12/2023 29,970,000 488 0.25
Goldman Sachs CDX NA HY Series 31 5% 20/12/2023 10,700,000 (435) (0.22)
JP Morgan iTraxx Euro Crossover 5% 20/12/2023 9,110,000 (656) (0.33) –––––––––––––––––––––––––––––––––––––––––– (603) (0.30) –––––––––––––––––––––––––––––––––––––––––DERIVATIVES – INTEREST RATE SWAPS 0.01% (31.05.18: (0.13%))Goldman Sachs Interest Rate Swap receive 1.4315% 06/02/2028 158,500,000 632 0.32
Goldman Sachs Interest Rate Swap receive 1.2555% 26/03/2028 85,000,000 196 0.09
Goldman Sachs Interest Rate Swap receive 0.1006% 01/12/2022 7,683,500,000 133 0.07
Goldman Sachs Interest Rate Swap receive 0.113% 13/11/2023 6,714,590,000 101 0.05
Goldman Sachs Interest Rate Swap receive 1.163% 09/07/2028 87,300,000 76 0.03
JP Morgan Interest Rate Swap receive 2.385% 23/11/2020 1,998,600,000 63 0.03
Goldman Sachs Interest Rate Swap receive 0.1378% 26/03/2020 444,000,000 3 –
Goldman Sachs Interest Rate Swap pay 1.7752% 01/06/2023 186,300,000 (7) (0.01)
Goldman Sachs Interest Rate Swap pay 0.0855% 09/07/2020 731,400,000 (38) (0.02)
Goldman Sachs Interest Rate Swap pay 1.8178% 08/06/2023 189,200,000 (40) (0.02)
HSBC Bank Interest Rate Swap pay 0.0479% 13/11/2020 285,090,000 (45) (0.02)
Goldman Sachs Interest Rate Swap pay 2.3% 29/11/2020 1,994,000,000 (57) (0.02)
Goldman Sachs Interest Rate Swap pay 0.083% 06/02/2020 837,300,000 (60) (0.03)
Goldman Sachs Interest Rate Swap pay 2.0185% 11/10/2020 238,800,000 (128) (0.06)
Goldman Sachs Interest Rate Swap pay 1.9107% 24/04/2023 175,100,000 (229) (0.11)
Goldman Sachs Interest Rate Swap pay 0.7313% 19/10/2037 1,666,900,000 (246) (0.12)
Goldman Sachs Interest Rate Swap pay 0.802% 13/11/2038 1,674,290,000 (332) (0.17) –––––––––––––––––––––––––––––––––––––––––– 22 0.01 –––––––––––––––––––––––––––––––––––––––––FORWARD FOREIGN EXCHANGE CONTRACTS (1.32%) (31.05.18: (3.32%))FORWARD CURRENCY CONTRACTSAustralian DollarBuy AUD 4,754,000 for GBP (2,587,647) 132 0.07
Sell AUD (7,170,000) for GBP 3,915,850 (185) (0.09)
Canadian DollarBuy CAD 4,755,569 for GBP (2,768,824) 30 0.02
Chinese Yuan (Offshore)Buy CNH 95,088,569 for GBP (10,501,486) 220 0.11
Czech KorunaSell CZK (596,925,595) for GBP 20,716,196 198 0.10
EuroBuy EUR 27,776,165 for GBP (24,838,482) (49) (0.02)
Sell EUR (58,635,119) for GBP 52,424,567 102 0.05
MARKET PERCENTAGE VALUE OF NET ASSETSASSET HOLDING (£’000) (%)

REPORT AND ACCOUNTS
68 Investec Funds Series iv
Portfolio statement continued
As at 30 November 2018
FORWARD CURRENCY CONTRACTS (continued)Israeli SheqelBuy ILS 80,390,000 for GBP (17,209,844) (213) (0.11)
Sell ILS (309,801,100) for GBP 66,530,778 1,036 0.52
Japanese YenBuy JPY 4,039,812,220 for GBP (28,002,214) (81) (0.04)
~Sell JPY (3,870,000) for GBP 26,435 – –
Norwegian KroneBuy NOK 124,388,499 for GBP (11,397,102) (13) (0.01)
~Sell NOK (1,120,000) for GBP 102,835 – –
Polish ZlotyBuy PLN 21,904,000 for GBP (4,514,773) 32 0.02
South African RandBuy ZAR 172,040,000 for GBP (8,430,730) 1,352 0.68
Sell ZAR (278,127,361) for GBP 13,793,228 (2,022) (1.02)
Swedish KronaBuy SEK 273,984,988 for GBP (23,383,464) 285 0.14
Sell SEK (580,000) for GBP 49,115 (1) –
Swiss FrancBuy CHF 874,193 for GBP (692,016) (5) –
US DollarBuy USD 219,627,566 for GBP (168,894,419) 3,152 1.58
Sell USD (303,618,182) for GBP 232,134,493 (5,701) (2.87) –––––––––––––––––––––––––––––––––––––––––– (1,731) (0.87) –––––––––––––––––––––––––––––––––––––––––FORWARD CROSS CURRENCY CONTRACTSBuy AUD 20,999,000 for NZD (22,410,137) (43) (0.02)
Buy AUD 6,294,000 for SEK (40,077,882) 138 0.07
Buy AUD 8,260,000 for SGD (8,260,463) 6 –
Buy AUD 26,204,000 for USD (18,908,636) 177 0.09
Buy BRL 73,000,006 for USD (18,413,626) 374 0.19
Buy CAD 27,807,000 for USD (21,411,138) (405) (0.20)
Buy COP 20,809,106,000 for USD (6,842,906) (332) (0.17)
Buy CZK 468,230,000 for EUR (18,282,379) (213) (0.11)
Buy CZK 229,394,000 for USD (10,181,335) (91) (0.05)
Buy EUR 8,743,930 for NZD (14,598,000) (53) (0.03)
Buy EUR 35,349,000 for USD (40,750,758) (392) (0.20)
Buy HUF 3,580,067,000 for PLN (47,853,541) (65) (0.03)
Buy ILS 32,754,000 for USD (9,063,043) (175) (0.09)
Buy INR 2,860,763,000 for USD (39,455,990) 1,182 0.59
Buy JPY 378,725,000 for USD (3,330,680) 8 –
Buy KRW 27,514,564,000 for USD (24,581,334) (47) (0.02)
Buy MXN 157,458,000 for USD (7,655,142) (28) (0.01)
Buy NOK 90,800,000 for USD (11,114,713) (397) (0.20)
Buy NZD 14,175,300 for USD (9,285,654) 351 0.18
Buy PEN 22,887,000 for USD (6,851,401) (64) (0.03)
Buy PLN 93,759,000 for USD (25,023,113) (138) (0.07)
Buy RUB 689,306,000 for USD (10,023,516) 206 0.10
Buy SEK 76,038,000 for USD (8,461,531) (60) (0.03)
Buy SGD 14,235,000 for USD (10,377,444) 4 –
Buy TRY 99,461,000 for USD (15,311,283) 2,335 1.17
Buy TWD 320,386,000 for USD (10,579,033) (133) (0.07)
Buy USD 19,446,894 for AUD (26,883,000) (144) (0.07)
Buy USD 18,350,140 for BRL (72,969,211) (426) (0.21)
Buy USD 21,265,545 for CAD (27,879,000) 248 0.13
Buy USD 13,686,877 for CNH (94,996,000) 10 0.01
Buy USD 6,717,801 for COP (20,885,644,000) 215 0.11
Buy USD 4,445,198 for CZK (100,728,000) 20 0.01
Buy USD 57,545,433 for EUR (50,072,000) 415 0.21
Buy USD 8,746,464 for ILS (31,677,500) 155 0.08
Buy USD 38,403,695 for INR (2,860,763,000) (2,006) (1.01)
Buy USD 27,936,205 for JPY (3,140,580,000) 178 0.09
Buy USD 37,207,782 for KRW (41,983,558,530) (162) (0.08)
Buy USD 7,586,191 for MXN (155,170,000) (24) (0.01)
Buy USD 3,851,262 for NOK (31,999,000) 88 0.04
Buy USD 19,120,994 for NZD (28,282,000) (234) (0.12)
Buy USD 16,993,176 for PEN (57,243,000) 48 0.02
Buy USD 10,643,909 for PLN (39,554,300) 127 0.06
MARKET PERCENTAGE VALUE OF NET ASSETSASSET HOLDING (£’000) (%)

69Investec Funds Series iv
REPORT AND ACCOUNTS
FORWARD CROSS CURRENCY CONTRACTS (continued)Buy USD 9,797,192 for RUB (694,253,525) (441) (0.22)
Buy USD 16,777,374 for SEK (151,342,200) 69 0.04
Buy USD 4,330,933 for SGD (5,978,000) (23) (0.01)
Buy USD 8,215,452 for TRY (51,022,000) (1,236) (0.62)
Buy USD 10,434,327 for TWD (320,386,000) 19 0.01
Buy USD 24,308,185 for ZAR (363,859,098) (1,649) (0.83)
Buy ZAR 469,946,000 for USD (31,928,043) 1,712 0.86 –––––––––––––––––––––––––––––––––––––––––– (896) (0.45) –––––––––––––––––––––––––––––––––––––––––Portfolio of investments^ 158,785 79.77
Net other assets 40,265 20.23* ––––––––––––––––––––––––––––––––––––––––––Net assets 199,050 100.00 –––––––––––––––––––––––––––––––––––––––––
^ Including derivative liabilities.
~ The market value of the holdings is below £500 and is therefore rounded down to £0.
* The net other assets fi gure includes bank and short term cash deposits.
Unless otherwise stated the above securities are ordinary shares or common stock and admitted to offi cial stock exchange listings.
The credit default swaps, interest rate swaps and the forward foreign exchange contracts are not listed.
Portfolio Analysis 30.11.18 31.05.18 MARKET PERCENTAGE MARKET PERCENTAGE VALUE OF NET ASSETS VALUE OF NET ASSETSASSET (£’000) (%) (£’000) (%)
Bonds 97,194 48.83 180,078 65.80
Commercial Papers 7,980 4.01 – –
Derivatives (406) (0.21) (202) (0.08)
Forward Foreign Exchange Contracts (2,627) (1.32) (9,109) (3.32)
Government Treasury Bills 56,644 28.46 – –
Net other assets 40,265 20.23 102,896 37.60
Net assets 199,050 100.00 273,663 100.00
Credit Breakdown* 30.11.18 31.05.18 MARKET PERCENTAGE MARKET PERCENTAGE VALUE OF NET ASSETS VALUE OF NET ASSETSASSET (£’000) (%) (£’000) (%)
AAA 9,569 4.81 91,603 33.47
AA 4,395 2.20 31,713 11.60
A 58,955 29.62 896 0.33
BBB 2,691 1.35 9,227 3.36
BB 13,023 6.55 28,425 10.39
B 8,561 4.30 16,792 6.13
CCC – – 1,422 0.52
Total Bonds 97,194 48.83 180,078 65.80
*Bond ratings are Investec approximations.
MARKET PERCENTAGE VALUE OF NET ASSETSASSET HOLDING (£’000) (%)

REPORT AND ACCOUNTS
70 Investec Funds Series iv
MARKET PERCENTAGE VALUE OF NET ASSETSASSET HOLDING (£’000) (%)
BONDS 10.20% (31.05.18: 6.28%)GOVERNMENT BONDSUnited Kingdom Gilt 2% 22/07/2020 GBP 18,012,000 18,379 10.20 –––––––––––––––––––––––––––––––––––––––––CONSUMER GOODS 7.28% (31.05.18: 6.28%) AUTOMOBILES & PARTSDelphi Technologies 160,343 2,118 1.18 –––––––––––––––––––––––––––––––––––––––––HOUSEHOLD GOODS & HOME CONSTRUCTIONMcCarthy & Stone 3,359,291 4,542 2.52
Headlam 625,795 2,666 1.48
Welbilt 147,840 1,615 0.90 –––––––––––––––––––––––––––––––––––––––––– 8,823 4.90 –––––––––––––––––––––––––––––––––––––––––LEISURE GOODSGames Workshop 10,691 310 0.17 –––––––––––––––––––––––––––––––––––––––––PERSONAL GOODSTapestry 62,055 1,849 1.03 –––––––––––––––––––––––––––––––––––––––––CONSUMER SERVICES 18.19% (31.05.18: 21.63%) FOOD & DRUG RETAILERSWm Morrison Supermarkets 1,485,149 3,543 1.97
J Sainsbury 1,060,451 3,236 1.80 –––––––––––––––––––––––––––––––––––––––––– 6,779 3.77 –––––––––––––––––––––––––––––––––––––––––GENERAL RETAILERSMarks & Spencer 2,000,251 5,933 3.29
Kingfi sher 1,521,893 3,926 2.18
Next 57,999 2,909 1.61
ScS 938,792 2,122 1.18
Abercrombie & Fitch 126,197 2,047 1.14
Topps Tiles 3,162,893 2,040 1.13
Carpetright 7,640,838 1,330 0.74 –––––––––––––––––––––––––––––––––––––––––– 20,307 11.27 –––––––––––––––––––––––––––––––––––––––––TRAVEL & LEISUREJ D Wetherspoon 263,048 3,001 1.67
Go-Ahead 157,730 2,659 1.48 –––––––––––––––––––––––––––––––––––––––––– 5,660 3.15 –––––––––––––––––––––––––––––––––––––––––FINANCIALS 18.78% (31.05.18: 20.00%) BANKSRoyal Bank of Scotland 2,884,153 6,256 3.47
Citigroup 97,415 4,956 2.75
Standard Chartered 762,249 4,579 2.54
Barclays 2,601,285 4,220 2.34
CYBG 3,168 6 – –––––––––––––––––––––––––––––––––––––––––– 20,017 11.10 –––––––––––––––––––––––––––––––––––––––––EQUITY INVESTMENT INSTRUMENTSHipgnosis Songs 1,107,800 1,180 0.66 –––––––––––––––––––––––––––––––––––––––––FINANCIAL SERVICESTullett Prebon 1,056,552 3,283 1.82 –––––––––––––––––––––––––––––––––––––––––REAL ESTATE INVESTMENT & SERVICESCountrywide 30,712,255 2,709 1.50
LSL Property Services 833,492 2,084 1.16 –––––––––––––––––––––––––––––––––––––––––– 4,793 2.66 –––––––––––––––––––––––––––––––––––––––––
Portfolio statement
As at 30 November 2018
UK Total Return Fund

71Investec Funds Series iv
REPORT AND ACCOUNTS
MARKET PERCENTAGE VALUE OF NET ASSETSASSET HOLDING (£’000) (%)
REAL ESTATE INVESTMENT TRUSTSGreen REIT 1,886,329 2,374 1.32
Land Securities 270,151 2,194 1.22 –––––––––––––––––––––––––––––––––––––––––– 4,568 2.54 –––––––––––––––––––––––––––––––––––––––––HEALTH CARE 4.22% (31.05.18: 3.83%) PHARMACEUTICALS & BIOTECHNOLOGYGlaxoSmithKline 474,818 7,602 4.22 –––––––––––––––––––––––––––––––––––––––––INDUSTRIALS 25.64% (31.05.18: 25.99%) CONSTRUCTION & MATERIALSForterra 1,523,118 3,290 1.83
CRH 103,118 2,231 1.24 –––––––––––––––––––––––––––––––––––––––––– 5,521 3.07 –––––––––––––––––––––––––––––––––––––––––SUPPORT SERVICESCapita 9,240,271 9,887 5.49
Travis Perkins 828,953 9,089 5.05
Grafton 1,106,542 7,840 4.35
SIG 5,249,883 5,686 3.16
Aggreko 719,282 5,389 2.99
Kin & Carta 2,603,477 2,749 1.53 –––––––––––––––––––––––––––––––––––––––––– 40,640 22.57 –––––––––––––––––––––––––––––––––––––––––OIL & GAS 2.73% (31.05.18: 2.62%) OIL EQUIPMENT, SERVICES & DISTRIBUTIONNOW 272,337 3,015 1.67
Helmerich & Payne 39,845 1,910 1.06 –––––––––––––––––––––––––––––––––––––––––– 4,925 2.73 –––––––––––––––––––––––––––––––––––––––––TELECOMMUNICATIONS 1.54% (31.05.18: 1.16%) FIXED LINE TELECOMMUNICATIONSBT 1,069,929 2,773 1.54 –––––––––––––––––––––––––––––––––––––––––UTILITIES 1.33% (31.05.18: 3.30%) ELECTRICITYDrax 616,690 2,394 1.33 –––––––––––––––––––––––––––––––––––––––––DERIVATIVES 1.34% (31.05.18: (1.79%)) DERIVATIVES – FUTURESFTSE 100 Index Futures 21/12/2018 (490) 1,193 0.66
FTSE 250 Index Futures 21/12/2018 (350) 1,233 0.68 –––––––––––––––––––––––––––––––––––––––––– 2,426 1.34 –––––––––––––––––––––––––––––––––––––––––FORWARD FOREIGN EXCHANGE CONTRACTS 0.14% (31.05.18: 0.00%)FORWARD CURRENCY CONTRACTSUS DollarBuy USD 12,117,059 for GBP (9,240,860) 251 0.14 –––––––––––––––––––––––––––––––––––––––––Portfolio of investments 164,598 91.39
Net other assets 15,499 8.61* ––––––––––––––––––––––––––––––––––––––––––Net assets 180,097 100.00 –––––––––––––––––––––––––––––––––––––––––* The net other assets fi gure includes bank and short term cash deposits.
Unless otherwise stated the above securities are ordinary shares or common stock and admitted to offi cial stock exchange listings.

REPORT AND ACCOUNTS
72 Investec Funds Series iv
Authorised Corporate Director’s Report
Authorised Corporate Director’s report
The Authorised Corporate Director (the “ACD”) of Investec Funds Series iv (the “Company”) is Investec Fund Managers
Limited. The ACD is the sole director of the Company.
Authorised status
The Company is an investment company with variable capital incorporated in England and Wales under registered number
IC392 and authorised by the Financial Conduct Authority (the “FCA”) (formerly the Financial Services Authority) with effect
from 10 June 2005.
The Company is structured as an umbrella company in that different sub-funds (the “Funds”) may be established from time
to time by the ACD with the approval of the FCA. The Company currently comprises twelve Funds.
The Company (and therefore the Funds) has been certifi ed by the FCA as complying with the conditions necessary for it to
enjoy rights conferred by the EC Directive on Undertakings for Collective Investment in Transferable Securities (“UCITS”). The
Company has an unlimited duration.
The assets of each Fund will be treated as separate from those of every other Fund and will be invested in accordance with
the investment objective and policy applicable to that Fund. Investment of the assets of each of the Funds must comply with
the FCA’s Collective Investment Scheme Sourcebook (“COLL”) and the investment objective and policy of the relevant Fund.
Under English law, the Funds are segregated portfolios of assets and the assets of a Fund belong exclusively to that Fund.
The assets of a Fund shall not be used or made available to discharge (directly or indirectly) the liabilities of, or claims
against, any other person or body, including the Company and any other Fund and shall not be available for any such
purpose.
Subject to the above, each Fund will be charged with the liabilities, expenses, costs and charges of the Company
attributable to that Fund, and within each Fund charges will be allocated between share classes in accordance with their
terms of issue. Any assets, liabilities, expenses, costs or charges not attributable to a particular Fund may be allocated by
the ACD in a manner which it believes is fair to the shareholders generally. This will normally be pro rata to the net asset
value of the relevant Funds.
Accounting period covered by these accounts
The accounting period covered in these accounts is from 1 June 2018 to 30 November 2018
Changes during the accounting period
Changes made following required notice:
After consultation with the Depositary and in accordance with the requirements of Section 4.3 of the COLL, shareholders
were given notice of the following:
On 5 October 2018, of Diversifi ed Growth Fund’s investment objective and policy change, summarised below:
• the investment objective of the Fund will be amended to include its performance target, which is a return of UK
Consumer Price Index (CPI) + 5% (gross of fees) per annum over a rolling 5 year period; and
• the investment policy of the Fund will be amended to clarify that the Fund can invest in other funds where Investec
Asset Management Limited or any of its affi liates act as an investment manager.

73Investec Funds Series iv
REPORT AND ACCOUNTS
On 5 October 2018, of Target Return Bond Fund’s investment objective and policy change, summarised below:
• the investment objective of the Fund will be amended to include its performance target, which is a return of overnight
GBP LIBOR + 2.5% (gross of fees) per annum over a rolling 3 year period; and
• the investment policy of the Fund will be amended to clarify that the Fund can invest in other funds where Investec
Asset Management Limited or any of its affi liates act as an investment manager.
On 5 October 2018, of an amendment to the Prospectus to permit the conversion of all shareholders in a share class to any
other share classes where it is in their interests and the rights are the same.
Other changes made:
Share class launches and closures:
The following share class was launched on 21 September 2018:
Global Special Situations Fund, K, Accumulation, GBP
The following share class was closed on 31 August 2018:
Global Quality Equity Income, L, Accumulation, GBP
Global Quality Equity Income, L, Income-2, GBP
K. McFarland D. AirdDirector of the ACD Director of the ACD
29 January 2019
Authorised Corporate Director’s Report continued

REPORT AND ACCOUNTS
74 Investec Funds Series iv
Comparative Tables
As at 30 November 2018
Diversifi ed Growth Fund
Net Asset Value and Ongoing Charges Figure ‘A’ Class (Accumulation shares) ‘A’ Class (Income shares) 30.11.18 31.05.18 31.05.17 31.05.16 30.11.18 31.05.18 31.05.17 31.05.16
Closing net asset value (£’000) 148 206 167 590 439 486 557 540
Closing number of shares 123,869 160,844 129,584 500,216 336,616 348,994 394,453 415,332
Closing net asset value per share (p) 119.74 128.10 129.04 117.90 130.32 139.36 141.14 130.12
Operating charges 1.60% 1.60% 1.61% 1.62% 1.60% 1.60% 1.61% 1.62%
‘I’ Class (Accumulation shares) ‘I’ Class (Income shares) 30.11.18 31.05.18 31.05.17 31.05.16 30.11.18 31.05.18 31.05.17 31.05.16
Closing net asset value (£’000) 1,583,701 1,713,260 1,578,587 1,182,290 448,261 469,247 315,276 63,724
Closing number of shares 1,255,461,119 1,274,895,478 1,173,170,825 967,373,357 382,856,494 376,181,989 249,516,462 54,720,916
Closing net asset value per share (p) 126.14 134.38 134.56 122.22 117.08 124.74 126.35 116.45
Operating charges 0.85% 0.85% 0.86% 0.87% 0.85% 0.85% 0.86% 0.87%
‘J’ Class (Accumulation shares) ‘R’ Class (Accumulation shares) 30.11.18 31.05.18 31.05.17 31.05.16 30.11.18 31.05.18 31.05.17 31.05.16
Closing net asset value (£’000) 550 518 433 412 8 9 8 7
Closing number of shares 491,939 434,948 363,385 380,744 6,250 6,877 6,250 6,250
Closing net asset value per share (p) 111.82 119.08 119.14 108.12 119.85 127.83 128.25 116.73
Operating charges 0.75% 0.75% 0.76% 0.77% 1.10% 1.10% 1.12% 1.11%
‘S’ Class (Accumulation shares) ‘S’ Class (EUR Hedged Accumulation shares) (1)
30.11.18 31.05.18 31.05.17 31.05.16 30.11.18 31.05.18 31.05.17 31.05.16
Closing net asset value (£’000)/(EUR’000) 243,302 229,253 183,593 130,811 – – 61,493 70,118
Closing number of shares 147,184,644 130,579,004 105,061,242 82,911,274 – – 50,613,598 63,215,739
Closing net asset value per share (p)/(c) 165.30 175.57 174.75 157.77 – – 121.50 110.91
Operating charges 0.10% 0.10% 0.11% 0.12% – – 0.16% 0.16%
(1) Closed 17 October 2017.

75Investec Funds Series iv
REPORT AND ACCOUNTS
Comparative Tables
As at 30 November 2018
Net Asset Value and Ongoing Charges Figure ‘A’ Class (Accumulation shares) ‘A’ Class (Accumulation shares)(1)
30.11.18 31.05.18 31.05.17 31.05.16 30.11.18 31.05.18 31.05.17 31.05.16
Closing net asset value (£’000) 713 129 175 171 – – – 8
Closing number of shares 627,773 110,237 146,981 180,889 – – – 8,354
Closing net asset value per share (p) 113.49 116.93 119.14 94.57 – – – 98.13
Operating charges 1.65% 1.65% 1.70% 1.67% – – – 1.67%
‘A’ Class (Income-2 shares) ‘I’ Class (Accumulation shares) 30.11.18 31.05.18 31.05.17 31.05.16 30.11.18 31.05.18 31.05.17 31.05.16
Closing net asset value (£’000) 78 83 91 73 85,392 85,069 75,516 3,533
Closing number of shares 94,430 94,311 94,364 90,574 65,152,783 63,231,465 55,512,863 3,294,191
Closing net asset value per share (p) 82.69 87.79 96.90 80.20 131.06 134.54 136.03 107.26
Operating charges 1.65% 1.65% 1.70% 1.67% 0.90% 0.90% 0.90% 0.92%
‘I’ Class (Accumulation shares)(1) ‘I’ Class (Income-2 shares) 30.11.18 31.05.18 31.05.17 31.05.16 30.11.18 31.05.18 31.05.17 31.05.16
Closing net asset value (£’000) – – – 712 21,158 13,781 8,299 991
Closing number of shares – – – 705,502 24,418,887 15,038,667 8,266,658 1,200,807
Closing net asset value per share (p) – – – 100.86 86.65 91.64 100.40 82.49
Operating charges – – – 0.92% 0.90% 0.90% 0.95% 0.92%
‘J’ Class (Accumulation shares) ‘J’ Class (Income-2 shares) 30.11.18 31.05.18 31.05.17 31.05.16 30.11.18 31.05.18 31.05.17 31.05.16
Closing net asset value (£’000) 1,537 590 435 280 863 1,933 325 76
Closing number of shares 1,230,049 460,056 335,793 274,242 910,015 1,929,084 296,429 84,254
Closing net asset value per share (p) 124.99 128.17 129.47 102.00 94.82 100.23 109.70 90.01
Operating charges 0.80% 0.80% 0.86% 0.82% 0.80% 0.80% 0.85% 0.83%
‘R’ Class (Accumulation shares) ‘R’ Class (Income-2 shares) 30.11.18 31.05.18 31.05.17 31.05.16 30.11.18 31.05.18 31.05.17 31.05.16
Closing net asset value (£’000) 7 8 8 6 7 7 7 5
Closing number of shares 6,358 6,358 6,358 6,314 7,857 7,617 7,131 6,722
Closing net asset value per share (p) 115.06 118.27 119.82 94.68 84.19 89.14 97.90 80.61
Operating charges 1.15% 1.15% 1.21% 1.18% 1.15% 1.15% 1.21% 1.17%
‘S’ Class (Accumulation shares) 30.11.18 31.05.18 31.05.17 31.05.16
Closing net asset value (£’000) 11,355 10,508 9,035 15,697
Closing number of shares 8,753,566 7,921,835 6,786,145 15,143,868
Closing net asset value per share (p) 129.72 132.66 133.13 103.65
Operating charges 0.15% 0.15% 0.21% 0.17%
(1) Closed 9 April 2017.
Emerging Markets Blended Debt Fund

REPORT AND ACCOUNTS
76
Comparative Tables
As at 30 November 2018
Emerging Markets Equity Fund
Net Asset Value and Ongoing Charges Figure ‘A’ Class (Accumulation shares) ‘I’ Class (Accumulation shares) 30.11.18 31.05.18 31.05.17 31.05.16 30.11.18 31.05.18 31.05.17 31.05.16
Closing net asset value (£’000) 817 862 552 388 158,163 167,895 137,050 103,902
Closing number of shares 593,052 573,050 406,204 405,472 109,256,869 106,579,724 97,193,685 105,473,025
Closing net asset value per share (p) 137.68 150.47 135.85 95.71 144.76 157.53 141.01 98.51
Operating charges 1.94% 1.94% 1.99% 2.01% 1.09% 1.09% 1.14% 1.16%
‘R’ Class (Accumulation shares) ‘S’ Class (Accumulation shares) 30.11.18 31.05.18 31.05.17 31.05.16 30.11.18 31.05.18 31.05.17 31.05.16
Closing net asset value (£’000) 64 69 179 46 425 1,145 24,153 16,216
Closing number of shares 48,014 47,137 136,522 50,140 278,342 692,361 16,460,879 15,963,209
Closing net asset value per share (p) 134.07 146.28 131.40 92.12 152.75 165.43 146.73 101.58
Operating charges 1.44% 1.44% 1.49% 1.51% 0.19% 0.19% 0.24% 0.25%
76 Investec Funds Series iv

77Investec Funds Series iv
REPORT AND ACCOUNTS
Global Dividend Fund
Comparative Tables
As at 30 November 2018
Net Asset Value and Ongoing Charges Figure ‘A’ Class (Accumulation shares) ‘A’ Class (Income-2 shares) 30.11.18 31.05.18 31.05.17 31.05.16 30.11.18 31.05.18 31.05.17 31.05.16
Closing net asset value (£’000) 1 1 1 16 36 37 37 2
Closing number of shares 650 650 650 16,001 30,213 30,199 31,198 1,681
Closing net asset value per share (p) 135.67 137.13 128.07 101.07 119.95 123.34 119.13 99.52
Operating charges 1.65% 1.65% 1.72% 1.61% 1.65% 1.65% 1.72% 1.61%
‘I’ Class (Accumulation shares) ‘I’ Class (Income-2 shares) 30.11.18 31.05.18 31.05.17 31.05.16 30.11.18 31.05.18 31.05.17 31.05.16
Closing net asset value (£’000) 242 224 128 21 401 133 44 7
Closing number of shares 173,821 159,982 98,388 20,908 324,989 105,297 36,113 6,710
Closing net asset value per share (p) 139.14 140.19 130.03 101.88 123.54 126.56 121.32 100.55
Operating charges 0.90% 0.90% 0.97% 0.86% 0.90% 0.90% 0.97% 0.86%
‘J’ Class (Accumulation shares)(1) ‘J’ Class (Income-2 shares)(1)
30.11.18 31.05.18 31.05.17 31.05.16 30.11.18 31.05.18 31.05.17 31.05.16
Closing net asset value (£’000) – – 1 1 – – 1 1
Closing number of shares – – 650 650 – – 681 659
Closing net asset value per share (p) – – 130.42 101.98 – – 121.66 100.65
Operating charges – – 0.87% 0.76% – – 0.87% 0.76%
‘S’ Class (Accumulation shares) 30.11.18 31.05.18 31.05.17 31.05.16
Closing net asset value (£’000) 12,078 12,161 12,988 8,964
Closing number of shares 8,459,027 8,485,785 9,844,639 8,736,362
Closing net asset value per share (p) 142.78 143.31 131.93 102.61
Operating charges 0.15% 0.15% 0.22% 0.11%
(1) Closed 31 August 2017.
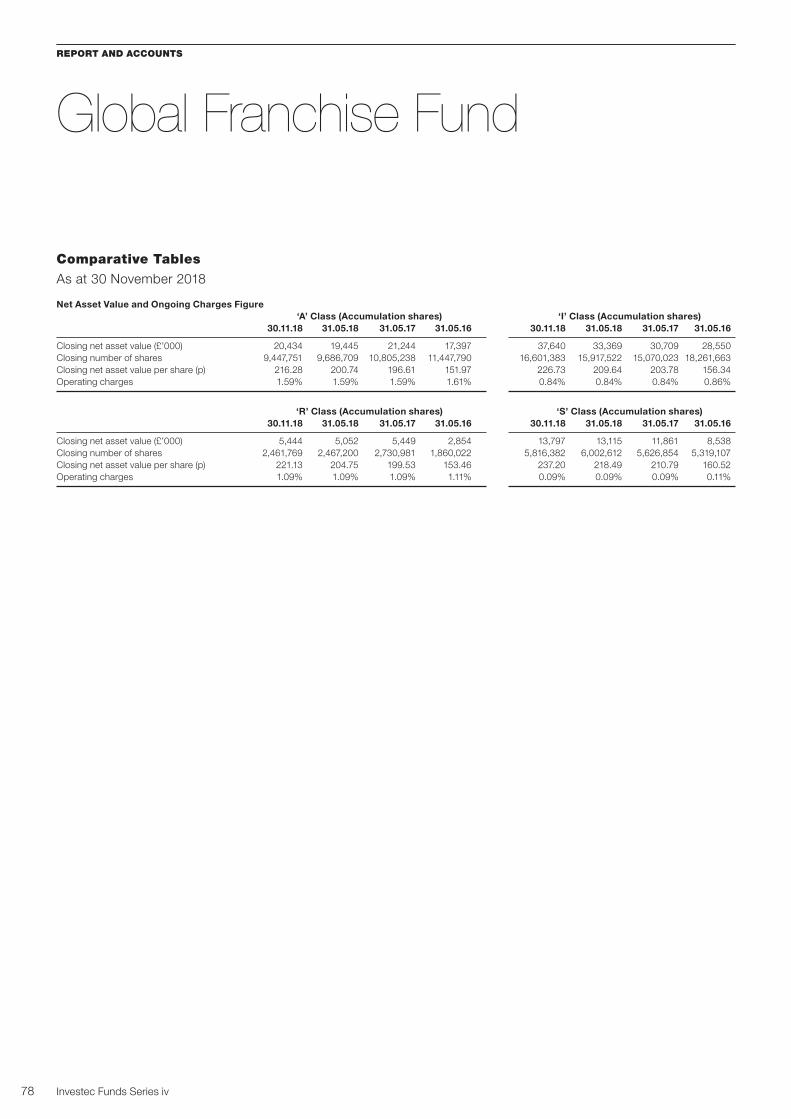
REPORT AND ACCOUNTS
78 Investec Funds Series iv
Global Franchise Fund
Net Asset Value and Ongoing Charges Figure ‘A’ Class (Accumulation shares) ‘I’ Class (Accumulation shares) 30.11.18 31.05.18 31.05.17 31.05.16 30.11.18 31.05.18 31.05.17 31.05.16
Closing net asset value (£’000) 20,434 19,445 21,244 17,397 37,640 33,369 30,709 28,550
Closing number of shares 9,447,751 9,686,709 10,805,238 11,447,790 16,601,383 15,917,522 15,070,023 18,261,663
Closing net asset value per share (p) 216.28 200.74 196.61 151.97 226.73 209.64 203.78 156.34
Operating charges 1.59% 1.59% 1.59% 1.61% 0.84% 0.84% 0.84% 0.86%
‘R’ Class (Accumulation shares) ‘S’ Class (Accumulation shares) 30.11.18 31.05.18 31.05.17 31.05.16 30.11.18 31.05.18 31.05.17 31.05.16
Closing net asset value (£’000) 5,444 5,052 5,449 2,854 13,797 13,115 11,861 8,538
Closing number of shares 2,461,769 2,467,200 2,730,981 1,860,022 5,816,382 6,002,612 5,626,854 5,319,107
Closing net asset value per share (p) 221.13 204.75 199.53 153.46 237.20 218.49 210.79 160.52
Operating charges 1.09% 1.09% 1.09% 1.11% 0.09% 0.09% 0.09% 0.11%
Comparative Tables
As at 30 November 2018

79Investec Funds Series iv
REPORT AND ACCOUNTS
Global Quality Equity Income Fund
Comparative Tables
As at 30 November 2018
Net Asset Value and Ongoing Charges Figure ‘A’ Class (Accumulation shares)(1) ‘A’ Class (Income-2 shares)(1)
30.11.18 31.05.18 31.05.17 31.05.16 30.11.18 31.05.18 31.05.17 31.05.16
Closing net asset value (£’000) 27 25 6 1 1 62 60 1
Closing number of shares 21,138 21,138 4,669 1,000 1,055 55,639 50,566 1,000
Closing net asset value per share (p) 124.89 117.71 122.28 99.81 116.52 111.18 118.77 99.81
Operating charges 1.61% 1.61% 1.62% 1.61% 1.61% 1.61% 1.62% 1.61%
‘I’ Class (Accumulation shares)(1) ‘I’ Class (Income-2 shares)(1)
30.11.18 31.05.18 31.05.17 31.05.16 30.11.18 31.05.18 31.05.17 31.05.16
Closing net asset value (£’000) 336 279 363 1 804 576 339 1
Closing number of shares 264,349 233,381 294,772 1,000 674,921 509,525 282,993 1,000
Closing net asset value per share (p) 127.25 119.48 123.20 99.81 119.12 113.13 119.94 99.81
Operating charges 0.86% 0.86% 0.87% 0.86% 0.86% 0.86% 0.87% 0.86%
‘J’ Class (Accumulation shares)(1) ‘J’ Class (Income-2 shares)(1)
30.11.18 31.05.18 31.05.17 31.05.16 30.11.18 31.05.18 31.05.17 31.05.16
Closing net asset value (£’000) 171 207 257 1 384 297 317 –
Closing number of shares 133,930 172,716 208,825 1,000 321,845 262,014 263,945 –
Closing net asset value per share (p) 127.55 119.70 123.29 99.81 119.37 113.32 120.01 –
Operating charges 0.76% 0.76% 0.77% 0.71% 0.76% 0.76% 0.77% –
‘K’ Class (Income-2 shares)(2) ‘L’ Class (Income-2 shares)(3)
30.11.18 31.05.18 31.05.17 31.05.16 30.11.18 31.05.18 31.05.17 31.05.16
Closing net asset value (£’000) 4,596 4,267 76,836 – 11,529 12,444 6,700 –
Closing number of shares 4,252,460 4,163,639 70,939,464 – 10,718,686 12,199,162 6,212,899 –
Closing net asset value per share (p) 108.08 102.49 108.31 – 107.56 102.01 107.83 –
Operating charges 0.56% 0.56% 0.57% – 0.56% 0.56% 0.57% –
‘L’ Class (Accumulation shares)(4) ‘S’ Class (Accumulation shares)(1))
30.11.18 31.05.18 31.05.17 31.05.16 30.11.18 31.05.18 31.05.17 31.05.16
Closing net asset value (£’000) 921 897 – – 787 796 846 680
Closing number of shares 879,800 914,800 – – 607,390 656,640 681,640 681,640
Closing net asset value per share (p) 104.62 98.08 – – 129.60 121.23 124.06 99.81
Operating charges 0.56% 0.56% – – 0.11% 0.11% 0.12% 0.11%
(1) Launched 31 May 2016.
(2) Launched 29 July 2016.
(3) Launched 31 August 2016.
(4) Launched 14 December 2017.

REPORT AND ACCOUNTS
80
Global Special Situations Fund
Comparative Tables
As at 30 November 2018
Net Asset Value and Ongoing Charges Figure ‘A’ Class (Accumulation shares) ‘A’ Class (Income shares) 30.11.18 31.05.18 31.05.17 31.05.16 30.11.18 31.05.18 31.05.17 31.05.16
Closing net asset value (£’000) 5,430 5,960 5,428 4,190 160 173 177 86
Closing number of shares 2,085,368 2,125,303 2,198,648 2,347,847 78,211 78,209 90,509 60,955
Closing net asset value per share (p) 260.39 280.43 246.88 178.48 204.93 220.70 194.93 140.92
Operating charges 1.66% 1.66% 1.69% 1.62% 1.66% 1.66% 1.69% 1.62%
‘I’ Class (Accumulation shares) ‘I’ Class (Income shares) 30.11.18 31.05.18 31.05.17 31.05.16 30.11.18 31.05.18 31.05.17 31.05.16
Closing net asset value (£’000) 30,818 22,204 15,490 4,968 4,094 2,874 727 351
Closing number of shares 10,939,320 7,345,769 5,864,744 2,621,322 1,984,144 1,298,186 371,863 248,788
Closing net asset value per share (p) 281.72 302.27 264.12 189.51 206.35 221.41 195.50 141.15
Operating charges 0.91% 0.91% 0.94% 0.87% 0.91% 0.91% 0.94% 0.87%
‘K’ Class (Accumulation shares)(1) ‘R’ Class (Accumulation shares) 30.11.18 31.05.18 31.05.17 31.05.16 30.11.18 31.05.18 31.05.17 31.05.16
Closing net asset value (£’000) 108,053 – – – 115 113 1 1
Closing number of shares 121,762,674 – – – 54,550 49,833 675 625
Closing net asset value per share (p) 88.74 – – – 211.14 226.82 198.61 142.80
Operating charges 0.40% – – – 1.16% 1.16% 1.19% 1.12%
‘S’ Class (Accumulation shares) ‘S’ Class (Income shares)(2)
30.11.18 31.05.18 31.05.17 31.05.16 30.11.18 31.05.18 31.05.17 31.05.16
Closing net asset value (£’000) 23,972 25,803 21,873 15,442 1 1 – –
Closing number of shares 7,847,294 7,902,914 7,724,580 7,657,500 20 20 – –
Closing net asset value per share (p) 305.48 326.50 283.16 201.65 5,191.67 5,547.92 – –
Operating charges 0.16% 0.16% 0.19% 0.12% 0.10% 0.16% – –
(1) Launched 21 September 2018.
(2) Launched 7 July 2017.
80 Investec Funds Series iv

81Investec Funds Series iv
REPORT AND ACCOUNTS
Net Asset Value and Ongoing Charges Figure
‘A’ Class (Accumulation shares) 30.11.18 31.05.18 31.05.17 31.05.16
Closing net asset value (£’000) 169,256 188,046 224,067 247,874
Closing number of shares 99,047,570 107,515,176 130,929,537 165,173,477
Closing net asset value per share (p) 170.88 174.90 171.14 150.07
Operating charges 1.82% 1.82% 1.91% 2.00%
Multi-Asset Protector Fund
Comparative Tables
As at 30 November 2018

REPORT AND ACCOUNTS
82
Net Asset Value and Ongoing Charges Figure
‘I’ Class (Accumulation shares) 30.11.18 31.05.18 31.05.17 31.05.16
Closing net asset value (£’000) 87,334 79,792 60,881 47,521
Closing number of shares 61,813,333 55,415,395 43,415,794 39,112,908
Closing net asset value per share (p) 141.29 143.99 140.23 121.50
Operating charges 1.03% 1.03% 1.12% 1.29%
Multi-Asset Protector Fund 2
Comparative Tables
As at 30 November 2018
82 Investec Funds Series iv

83Investec Funds Series iv
REPORT AND ACCOUNTS
Net Asset Value and Ongoing Charges Figure ‘A’ Class (Accumulation shares)# ‘A’ Class (Income shares)#
30.11.18 31.05.18 31.05.17 31.05.16 30.11.18 31.05.18 31.05.17 31.05.16
Closing net asset value (£’000) 35 2,696 2,874 214 14 14 15 63
Closing number of shares 35,397 2,650,951 2,725,701 202,177 15,885 15,885 15,885 66,416
Closing net asset value per share (p) 98.86 101.71 105.46 106.04 86.52 89.17 93.26 94.28
Operating charges 1.34% 1.34% 1.35% 1.36% 1.34% 1.34% 1.35% 1.36%
‘I’ Class (Accumulation shares)(1) ‘I’ Class (Accumulation shares)(1)(3)
30.11.18 31.05.18 31.05.17 31.05.16 30.11.18 31.05.18 31.05.17 31.05.16
Closing net asset value (£’000) 2,764 2,855 2,869 1,278 – – – 4,335
Closing number of shares 2,729,047 2,746,996 2,678,358 1,193,150 – – – 4,429,417
Closing net asset value per share (p) 101.29 103.93 107.11 107.13 – – – 97.87
Operating charges 0.74% 0.74% 0.75% 0.76% – – – 0.76%
‘I’ Class (Income shares)(2)# ‘I’ Class (Income shares)(2)(3)
30.11.18 31.05.18 31.05.17 31.05.16 30.11.18 31.05.18 31.05.17 31.05.16
Closing net asset value (£’000) 25,450 89,434 138,218 974 – – – 138,308
Closing number of shares 29,432,862 100,352,189 148,292,147 1,033,825 – – – 141,510,285
Closing net asset value per share (p) 86.47 89.12 93.21 94.24 – – – 97.74
Operating charges 0.74% 0.74% 0.75% 0.76% – – – 0.76%
‘R’ Class (Accumulation shares)# ‘S’ Class (Accumulation shares) 30.11.18 31.05.18 31.05.17 31.05.16 30.11.18 31.05.18 31.05.17 31.05.16
Closing net asset value (£’000) 6 6 6 6 15,148 19,976 15,460 25,197
Closing number of shares 6,377 6,377 6,275 6,265 12,099,025 15,600,231 11,791,234 19,365,121
Closing net asset value per share (p) 92.37 94.80 97.76 97.85 125.20 128.05 131.12 130.12
Operating charges 0.84% 0.84% 0.84% 0.86% 0.09% 0.09% 0.10% 0.11%
‘S’ Class (EUR Hedge Accumulation shares)(4) ‘S’ Class (USD Hedge Accumulation shares) 30.11.18 31.05.18 31.05.17 31.05.16 30.11.18 31.05.18 31.05.17 31.05.16
Closing net asset value (EUR’000)/(USD’000) – – – 1,434 198,509 211,458 169,267 168,696
Closing number of shares – – – 1,260,234 177,213,290 186,028,523 147,348,791 148,758,654
Closing net asset value per share (c) – – – 113.74 112.02 113.67 114.88 113.40
Operating charges – – – 0.16% 0.13% 0.13% 0.15% 0.16%
(1) Share classes ‘I Accumulation’ converted to one as of 7 April 2017.
(2) Share classes ‘I Income’ converted to one as of 7 April 2017.
(3) Closed 7 April 2017.
(4) Closed 10 February 2017.
# Share class converted from net to gross on 1 December 2016.
Target Return Bond Fund
Comparative Tables
As at 30 November 2018

REPORT AND ACCOUNTS
84 Investec Funds Series iv
Net Asset Value and Ongoing Charges Figure ‘A’ Class (Accumulation shares) ‘I’ Class (Accumulation shares) 30.11.18 31.05.18 31.05.17 31.05.16 30.11.18 31.05.18 31.05.17 31.05.16
Closing net asset value (£’000) 23,950 25,947 28,633 30,907 29,499 31,829 31,446 38,688
Closing number of shares 10,377,128 10,799,546 12,273,717 14,405,760 21,435,333 22,278,273 22,798,377 30,670,239
Closing net asset value per share (p) 230.80 240.26 233.29 214.55 137.62 142.87 137.93 126.14
Operating charges 1.33% 1.33% 1.36% 1.36% 0.73% 0.73% 0.76% 0.76%
‘R’ Class (Accumulation shares) ‘S’ Class (Accumulation shares)(1)
30.11.18 31.05.18 31.05.17 31.05.16 30.11.18 31.05.18 31.05.17 31.05.16
Closing net asset value (£’000) 453 375 402 314 126,195 130,714 144,483 27,894
Closing number of shares 350,495 279,038 309,772 264,393 11,429,302 11,439,104 13,181,370 2,800,465
Closing net asset value per share (p) 129.21 134.21 129.70 118.74 1,104.13 1,142.70 1,096.12 996.06
Operating charges 0.83% 0.83% 0.86% 0.86% 0.08% 0.08% 0.11% 0.11%
(1) Launched 30 March 2016.
UK Total Return Fund
Comparative Tables
As at 30 November 2018
Investec Funds Series iv 85
REPORT AND ACCOUNTS
Notes to the Aggregated Financial StatementsFor the period ended 30 November 2018
K. McFarland D. AirdDirector of the ACD Director of the ACD
29 January 2019
Accounting policies
The semi-annual fi nancial statements have been prepared in accordance with the Statement of Recommended Practice for
Authorised Funds issued by the Investment Management Association in May 2014.
The accounting policies applied are consistent with those of the annual fi nancial statements for the year ended 31 May 2018
and are described in those annual fi nancial statements.
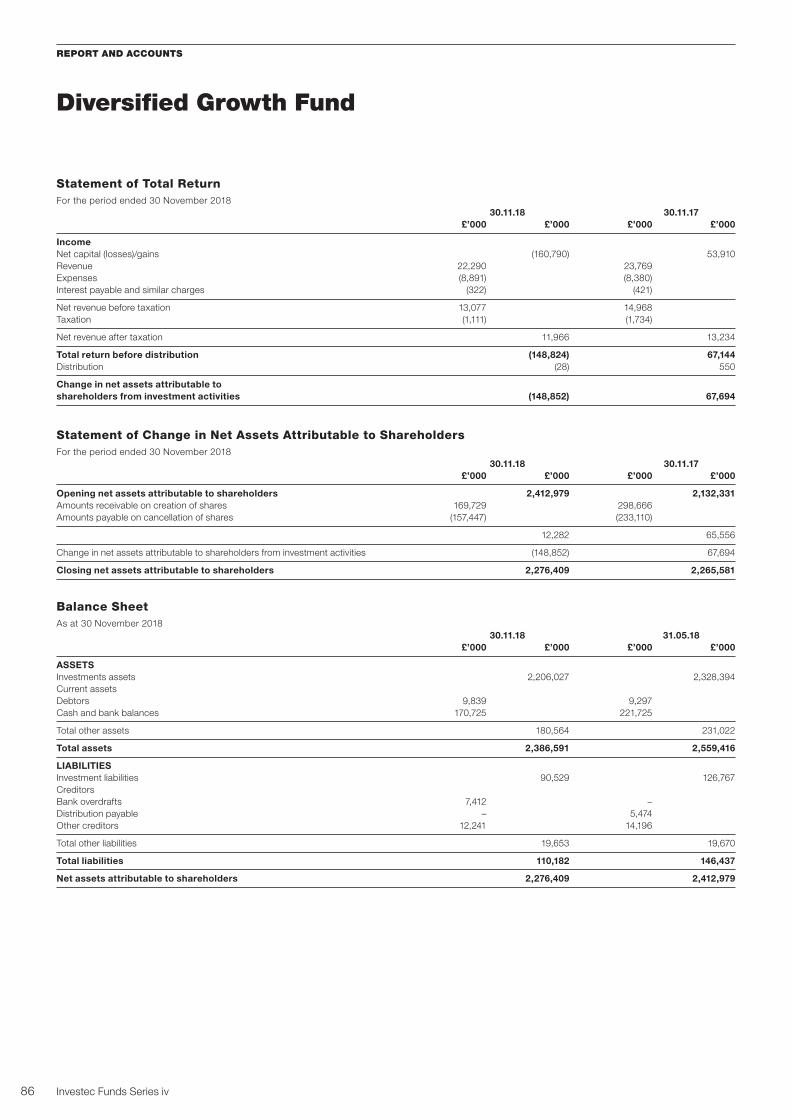
REPORT AND ACCOUNTS
Investec Funds Series iv86
Diversifi ed Growth Fund
Statement of Total Return
For the period ended 30 November 2018
30.11.18 30.11.17 £’000 £’000 £’000 £’000
IncomeNet capital (losses)/gains (160,790) 53,910
Revenue 22,290 23,769
Expenses (8,891) (8,380)
Interest payable and similar charges (322) (421)
Net revenue before taxation 13,077 14,968
Taxation (1,111) (1,734)
Net revenue after taxation 11,966 13,234
Total return before distribution (148,824) 67,144 Distribution (28) 550
Change in net assets attributable to shareholders from investment activities (148,852) 67,694
Statement of Change in Net Assets Attributable to Shareholders
For the period ended 30 November 2018
30.11.18 30.11.17 £’000 £’000 £’000 £’000
Opening net assets attributable to shareholders 2,412,979 2,132,331 Amounts receivable on creation of shares 169,729 298,666
Amounts payable on cancellation of shares (157,447) (233,110)
12,282 65,556
Change in net assets attributable to shareholders from investment activities (148,852) 67,694
Closing net assets attributable to shareholders 2,276,409 2,265,581
Balance Sheet
As at 30 November 2018
30.11.18 31.05.18 £’000 £’000 £’000 £’000
ASSETSInvestments assets 2,206,027 2,328,394
Current assets
Debtors 9,839 9,297
Cash and bank balances 170,725 221,725
Total other assets 180,564 231,022
Total assets 2,386,591 2,559,416
LIABILITIESInvestment liabilities 90,529 126,767
Creditors
Bank overdrafts 7,412 –
Distribution payable – 5,474
Other creditors 12,241 14,196
Total other liabilities 19,653 19,670
Total liabilities 110,182 146,437
Net assets attributable to shareholders 2,276,409 2,412,979

REPORT AND ACCOUNTS
Investec Funds Series iv 87
Emerging Markets Blended Debt Fund
Statement of Total Return
For the period ended 30 November 2018
30.11.18 30.11.17 £’000 £’000 £’000 £’000
IncomeNet capital losses (5,967) (3,452)
Revenue 3,488 3,233
Expenses (473) (423)
Interest payable and similar charges (9) (2)
Net revenue before taxation 3,006 2,808
Taxation (76) (7)
Net revenue after taxation 2,930 2,801
Total return before distributions (3,037) (651) Distributions (3,016) (2,849)
Change in net assets attributable to shareholders from investment activities (6,053) (3,500)
Statement of Change in Net Assets Attributable to Shareholders
For the period ended 30 November 2018
30.11.18 30.11.17 £’000 £’000 £’000 £’000
Opening net assets attributable to shareholders 112,108 93,748 Amounts receivable on creation of shares 15,228 17,790
Amounts payable on cancellation of shares (2,664) (1,047)
12,564 16,743
Dilution adjustment – 20
Change in net assets attributable to shareholders from investment activities (6,053) (3,500)
Retained distributions on accumulation shares 2,491 2,594
Closing net assets attributable to shareholders 121,110 109,605
Balance Sheet
As at 30 November 2018
30.11.18 31.05.18 £’000 £’000 £’000 £’000
ASSETSInvestments assets 114,438 103,241
Current assets
Debtors 7,050 4,229
Cash and bank balances 7,795 10,390
Total other assets 14,845 14,619
Total assets 129,283 117,860
LIABILITIESInvestment liabilities 5,180 4,674
Creditors
Bank overdrafts 435 147
Distribution payable 320 252
Other creditors 2,238 679
Total other liabilities 2,993 1,078
Total liabilities 8,173 5,752
Net assets attributable to shareholders 121,110 112,108

REPORT AND ACCOUNTS
88 Investec Funds Series iv
Emerging Markets Blended Debt Fund continued
Distribution Tables
For the period ended 30 November 2018
Interim distribution paid 31 October 2018Group 1 – Shares purchased before 1 June 2018
Group 2 – Shares purchased between 1 June and 31 August 2018
Distribution Distribution Net paid paid Income Equalisation 31.10.18 31.10.17 pence pence pence pence
‘A’ Class (Accumulation shares)Group 1 1.2745 – 1.2745 1.4935
Group 2 0.4570 0.8175 1.2745 1.4935
‘A’ Class (Income-2 shares)Group 1 1.2999 – 1.2999 1.5899
Group 2 1.2999 0.0000 1.2999 1.5899
‘I’ Class (Accumulation shares)Group 1 1.7051 – 1.7051 1.9654
Group 2 0.6070 1.0981 1.7051 1.9654
‘I’ Class (Income-2 shares)Group 1 1.3606 – 1.3606 1.6487
Group 2 0.4870 0.8736 1.3606 1.6487
‘J’ Class (Accumulation shares)Group 1 1.6575 – 1.6575 1.9051
Group 2 0.2777 1.3798 1.6575 1.9051
‘J’ Class (Income-2 shares)Group 1 1.4772 – 1.4772 1.8010
Group 2 0.5207 0.9565 1.4772 1.8010
‘R’ Class (Accumulation shares)Group 1 1.4223 – 1.4223 1.6650
Group 2 1.4223 0.0000 1.4223 1.6650
‘R’ Class (Income-2 shares)Group 1 1.3179 – 1.3179 1.6173
Group 2 0.4163 0.9016 1.3179 1.6173
‘S’ Class (Accumulation shares)Group 1 1.9321 – 1.9321 2.1804
Group 2 1.0621 0.8700 1.9321 2.1804

Investec Funds Series iv
REPORT AND ACCOUNTS
89
Distribution Tables
For the period ended 30 November 2018
Interim distribution paid 31 January 2019Group 1 – Shares purchased before 1 September 2018
Group 2 – Shares purchased between 1 September and 30 November 2018
Distribution Distribution Net payable paid Income Equalisation 31.01.19 31.01.18 pence pence pence pence
‘A’ Class (Accumulation shares)Group 1 1.1645 – 1.1645 1.2299
Group 2 0.5740 0.5905 1.1645 1.2299
‘A’ Class (Income-2 shares) Group 1 1.1982 – 1.1982 1.3490
Group 2 0.1744 1.0238 1.1982 1.3490
‘I’ Class (Accumulation shares) Group 1 1.5880 – 1.5880 1.6665
Group 2 0.5718 1.0162 1.5880 1.6665
‘I’ Class (Income-2 shares) Group 1 1.2552 – 1.2552 1.4000
Group 2 0.6253 0.6299 1.2552 1.4000
‘J’ Class (Accumulation shares) Group 1 1.5644 – 1.5644 1.6193
Group 2 0.7738 0.7906 1.5644 1.6193
‘J’ Class (Income-2 shares) Group 1 1.3732 – 1.3732 1.5298
Group 2 0.7906 0.5826 1.3732 1.5298
‘R’ Class (Accumulation shares) Group 1 1.3130 – 1.3130 1.4061
Group 2 1.3130 0.0000 1.3130 1.4061
‘R’ Class (Income-2 shares)
Group 1 1.2135 – 1.2135 1.3916
Group 2 0.3512 0.8623 1.2135 1.3916
‘S’ Class (Accumulation shares)
Group 1 1.8119 – 1.8119 1.8871
Group 2 0.9565 0.8554 1.8119 1.8871
EqualisationEqualisation applies only to shares purchased during the distribution period (Group 2 shares). It is the average amount of income included in the purchase price of
all Group 2 shares and is refunded to holders of these shares as a return of capital. Being capital, it is not liable to income tax but must be deducted from the cost
of shares for capital gains tax purposes.

REPORT AND ACCOUNTS
Investec Funds Series iv90
Emerging Markets Equity Fund
Statement of Total Return
For the period ended 30 November 2018
30.11.18 30.11.17 £’000 £’000 £’000 £’000
Income
Net capital (losses)/gains (15,559) 16,346
Revenue 2,976 2,201
Expenses (834) (816)
Net revenue before taxation 2,142 1,385
Taxation (268) (204)
Net revenue after taxation 1,874 1,181
Total return before distribution (13,685) 17,527 Distribution 28 (191)
Change in net assets attributable to shareholders from investment activities (13,657) 17,336
Statement of Change in Net Assets Attributable to Shareholders
For the period ended 30 November 2018
30.11.18 30.11.17 £’000 £’000 £’000 £’000
Opening net assets attributable to shareholders 169,972 161,934 Amounts receivable on creation of shares 8,356 11,689
Amounts payable on cancellation of shares (5,202) (28,493)
3,154 (16,804)
Dilution adjustment – 55
Change in net assets attributable to
shareholders from investment activities (13,657) 17,336
Closing net assets attributable to shareholders 159,469 162,521
Balance Sheet
As at 30 November 2018
30.11.18 31.05.18 £’000 £’000 £’000 £’000
ASSETSInvestments assets 148,888 163,847
Current assets
Debtors 1,302 754
Cash and bank balances 10,340 6,690
Total other assets 11,642 7,444
Total assets 160,530 171,291
LIABILITIESCreditors
Other creditors 1,061 1,319
Total liabilities 1,061 1,319
Net assets attributable to shareholders 159,469 169,972

REPORT AND ACCOUNTS
Investec Funds Series iv 91
Global Dividend Fund
Statement of Total Return
For the period ended 30 November 2018
30.11.18 30.11.17 £’000 £’000 £’000 £’000
IncomeNet capital (losses)/gains (245) 410
Revenue 225 190
Expenses (8) (9)
Interest payable and similar charges – –
Net revenue before taxation 217 181
Taxation (18) (18)
Net revenue after taxation 199 163
Total return before distributions (46) 573 Distributions (200) (164)
Change in net assets attributable to shareholders from investment activities (246) 409
Statement of Change in Net Assets Attributable to Shareholders
For the period ended 30 November 2018
30.11.18 30.11.17 £’000 £’000 £’000 £’000
Opening net assets attributable to shareholders 12,556 13,199 Amounts receivable on creation of shares 556 106
Amounts payable on cancellation of shares (306) (187)
250 (81)
Dilution adjustment 2 1
Change in net assets attributable to shareholders from investment activities (246) 409
Retained distributions on accumulation shares 196 162
Closing net assets attributable to shareholders 12,758 13,690
Balance Sheet
As at 30 November 2018
30.11.18 31.05.18 £’000 £’000 £’000 £’000
ASSETSInvestments assets 12,457 12,724
Current assets
Debtors 224 1,109
Cash and bank balances 91 506
Total other assets 315 1,615
Total assets 12,772 14,339
LIABILITIESCreditors
Distribution payable 7 3
Other creditors 7 1,780
Total liabilities 14 1,783
Net assets attributable to shareholders 12,758 12,556

REPORT AND ACCOUNTS
92 Investec Funds Series iv
Distribution Table
For the period ended 30 November 2018
Interim distribution payable 31 January 2019Group 1 - Shares purchased before 1 June 2018
Group 2 - Shares purchased between 1 June and 30 November 2018
Distribution Distribution Net payable paid Income Equalisation 31.01.19 31.01.18 pence pence pence pence
‘A’ Class (Accumulation shares)Group 1 1.1661 – 1.1661 0.6283
Group 2 1.1661 – 1.1661 0.6283
‘A’ Class (Income–2 shares)Group 1 2.0072 – 2.0072 1.5490
Group 2 1.3386 0.6686 2.0072 1.5490
‘I’ Class (Accumulation shares)
Group 1 1.7031 – 1.7031 1.1270
Group 2 0.6577 1.0454 1.7031 1.1270
‘I’ Class (Income–2 shares)Group 1 2.0525 – 2.0525 1.5797
Group 2 0.4958 1.5567 2.0525 1.5797
‘J’ Class (Accumulation shares)(1)Group 1 – – – –
Group 2 – – – –
‘J’ Class (Income–2 shares)(1)Group 1 – – – –
Group 2 – – – –
‘S’ Class (Accumulation shares)Group 1 2.2843 – 2.2843 1.6503
Group 2 1.5670 0.7173 2.2843 1.6503
EqualisationEqualisation applies only to shares purchased during the distribution period (Group 2 shares). It is the average amount of income included in the purchase price of
all Group 2 shares and is refunded to holders of these shares as a return of capital. Being capital, it is not liable to income tax but must be deducted from the cost
of shares for capital gains tax purposes.
Global Dividend Fund continued

REPORT AND ACCOUNTS
Investec Funds Series iv 93
Global Franchise Fund
Statement of Total Return
For the period ended 30 November 2018
30.11.18 30.11.17 £’000 £’000 £’000 £’000
IncomeNet capital gains 5,624 136
Revenue 633 592
Expenses (345) (330)
Interest payable and similar charges – –
Net revenue before taxation 288 262
Taxation (48) (50)
Net revenue after taxation 240 212
Total return before distribution 5,864 348 Distribution (1) (2)
Change in net assets attributable to shareholders from investment activities 5,863 346
Statement of Change in Net Assets Attributable to Shareholders
For the period ended 30 November 2018
30.11.18 30.11.17 £’000 £’000 £’000 £’000
Opening net assets attributable to shareholders 70,981 69,263 Amounts receivable on creation of shares 5,553 2,596
Amounts payable on cancellation of shares (5,082) (3,483)
471 (887)
Change in net assets attributable to shareholders from investment activities 5,863 346
Closing net assets attributable to shareholders 77,315 68,722
Balance Sheet
As at 30 November 2018
30.11.18 31.05.18 £’000 £’000 £’000 £’000
ASSETSInvestments assets 72,473 69,231
Current assets
Debtors 469 251
Cash and bank balances 4,434 2,408
Total other assets 4,903 2,659
Total assets 77,376 71,890
LIABILITIESCreditors
Bank overdrafts 1 –
Other creditors 60 909
Total liabilities 61 909
Net assets attributable to shareholders 77,315 70,981

REPORT AND ACCOUNTS
Investec Funds Series iv94
Global Quality Equity Income Fund
Statement of Total Return
For the period ended 30 November 2018
30.11.18 30.11.17 £’000 £’000 £’000 £’000
IncomeNet capital gains/(losses) 1,120 (2,769)
Revenue 236 1,194
Expenses (46) (268)
Net revenue before taxation 190 926
Taxation (16) (82)
Net revenue after taxation 174 844
Total return before distributions 1,294 (1,925)Distributions (218) (1,105)
Change in net assets attributable to shareholders from investment activities 1,076 (3,030)
Statement of Change in Net Assets Attributable to Shareholders
For the period ended 30 November 2018
30.11.18 30.11.17 £’000 £’000 £’000 £’000
Opening net assets attributable to shareholders 19,850 85,724 Amounts receivable on creation of shares 2,044 29,411
Amounts payable on cancellation of shares (3,435) (870)
(1,391) 28,541
Dilution adjustment – 46
Change in net assets attributable to shareholders from investment activities 1,076 (3,030)
Retained distributions on accumulation shares 21 13
Closing net assets attributable to shareholders 19,556 111,294
Balance Sheet
As at 30 November 2018
30.11.18 31.05.18 £’000 £’000 £’000 £’000
ASSETSInvestments assets 18,634 19,698
Current assets
Debtors 258 225
Cash and bank balances 886 335
Total other assets 1,144 560
Total assets 19,778 20,258
LIABILITIESCreditors
Distribution payable 197 292
Other creditors 25 116
Total other liabilities 222 408
Net assets attributable to shareholders 19,556 19,850

Investec Funds Series iv
REPORT AND ACCOUNTS
95
Distribution Table
For the period ended 30 November 2018
Interim distribution payable 31 January 2019Group 1 - Shares purchased before 1 June 2018
Group 2 - Shares purchased between 1 June and 30 November 2018
Distribution Distribution Net payable paid Income Equalisation 31.01.19 31.01.18 pence pence pence pence
‘A’ Class (Accumulation shares)Group 1 0.4568 – 0.4568 0.3935
Group 2 0.4568 0.0000 0.4568 0.3935
‘A’ Class (Income-2 shares)
Group 1 1.4581 – 1.4581 1.3039
Group 2 1.0619 0.3962 1.4581 1.3039
‘I’ Class (Accumulation shares)
Group 1 0.9382 – 0.9382 0.8442
Group 2 0.4529 0.4853 0.9382 0.8442
‘I’ Class (Income-2 shares)
Group 1 1.3533 – 1.3533 1.3191
Group 2 0.6042 0.7491 1.3533 1.3191
‘J’ Class (Accumulation shares)
Group 1 1.0031 – 1.0031 0.9077
Group 2 1.0031 0.0000 1.0031 0.9077
‘J’ Class (Income-2 shares)
Group 1 1.3544 – 1.3544 1.3203
Group 2 0.6471 0.7073 1.3544 1.3203
‘K’ Class (Income-2 shares)
Group 1 1.2301 – 1.2301 1.1882
Group 2 0.1289 1.1012 1.2301 1.1882
‘L’ Class (Income-2 shares)
Group 1 1.2241 – 1.2241 1.1869
Group 2 0.8005 0.4236 1.2241 1.1869
‘L’ Class (Accumulation shares)
Group 1 0.9264 – 0.9264 n/a
Group 2 0.6549 0.2715 0.9264 n/a
‘S’ Class (Accumulation shares)
Group 1 1.4301 – 1.4301 1.3146
Group 2 1.4301 0.0000 1.4301 1.3146
EqualisationEqualisation applies only to shares purchased during the distribution period (Group 2 shares). It is the average amount of income included in the purchase price of
all Group 2 shares and is refunded to holders of these shares as a return of capital. Being capital, it is not liable to income tax but must be deducted from the cost
of shares for capital gains tax purposes.

REPORT AND ACCOUNTS
Investec Funds Series iv96
Global Special Situations Fund
Statement of Total Return
For the period ended 30 November 2018
30.11.18 30.11.17 £’000 £’000 £’000 £’000
IncomeNet capital (losses)/gains (17,307) 3,901
Revenue 815 395
Expenses (256) (135)
Interest payable and similar charges (1) –
Net revenue before taxation 558 260
Taxation (49) (34)
Net revenue after taxation 509 226
Total return before distribution (16,798) 4,127 Distribution 596 44
Change in net assets attributable to shareholders from investment activities (16,202) 4,171
Statement of Change in Net Assets Attributable to Shareholders
For the period ended 30 November 2018
30.11.18 30.11.17 £’000 £’000 £’000 £’000
Opening net assets attributable to shareholders 57,128 43,696 Amounts receivable on creation of shares 133,509 17,634
Amounts payable on cancellation of shares (2,027) (4,835)
131,482 12,799
Dilution adjustment 235 24
Change in net assets attributable to shareholders from investment activities (16,202) 4,171
Closing net assets attributable to shareholders 172,643 60,690
Balance Sheet
As at 30 November 2018
30.11.18 31.05.18 £’000 £’000 £’000 £’000
ASSETSInvestments assets 160,470 53,715
Current assets
Debtors 11,652 203
Cash and bank balances 11,201 3,977
Total other assets 22,853 4,180
Total assets 183,323 57,895
LIABILITIESCreditors
Distribution payable – 31
Other creditors 10,680 736
Total liabilities 10,680 767
Net assets attributable to shareholders 172,643 57,128

REPORT AND ACCOUNTS
Investec Funds Series iv 97
Multi-Asset Protector Fund
Statement of Total Return
For the period ended 30 November 2018
30.11.18 30.11.17 £’000 £’000 £’000 £’000
IncomeNet capital (losses)/gains (4,074) 4,583
Revenue 1,517 1,696
Expenses (1,501) (1,784)
Interest payable and similar charges (2) (5)
Net revenue/(expense) before taxation 14 (93)
Taxation (17) (10)
Net expense after taxation (3) (103)
Total return before distribution (4,077) 4,480 Distribution (48) (14)
Change in net assets attributable toshareholders from investment activities (4,125) 4,466
Statement of Change in Net Assets Attributable to Shareholders
For the period ended 30 November 2018
30.11.18 30.11.17 £’000 £’000 £’000 £’000
Opening net assets attributable to shareholders 188,046 224,067 Amounts receivable on creation of shares 187 1,322
Amounts payable on cancellation of shares (14,852) (27,569)
(14,665) (26,247)
Change in net assets attributable to shareholders from investment activities (4,125) 4,466
Closing net assets attributable to shareholders 169,256 202,286
Balance Sheet
As at 30 November 2018
30.11.18 31.05.18 £’000 £’000 £’000 £’000
ASSETSInvestments assets 166,724 186,264
Current assets
Debtors 214 203
Cash and bank balances 7,758 6,256
Total other assets 7,972 6,459
Total assets 174,696 192,723
LIABILITIESInvestment liabilities 1,666 3,870
Creditors
Bank overdrafts 553 5
Other creditors 3,221 802
Total other liabilities 3,774 807
Total liabilities 5,440 4,677
Net assets attributable to shareholders 169,256 188,046

REPORT AND ACCOUNTS
Investec Funds Series iv98
Multi-Asset Protector Fund 2
Statement of Total Return
For the period ended 30 November 2018
30.11.18 30.11.17 £’000 £’000 £’000 £’000
IncomeNet capital (losses)/gains (1,941) 1,358
Revenue 666 506
Expenses (374) (290)
Interest payable and similar charges (1) (1)
Net revenue before taxation 291 215
Taxation (8) (3)
Net revenue after taxation 283 212
Total return before distributions (1,658) 1,570 Distribution 25 18
Change in net assets attributable to shareholders from investment activities (1,633) 1,588
Statement of Change in Net Assets Attributable to Shareholders
For the period ended 30 November 2018
30.11.18 30.11.17 £’000 £’000 £’000 £’000
Opening net assets attributable to shareholders 79,792 60,881 Amounts receivable on creation of shares 10,809 9,243
Amounts payable on cancellation of shares (1,634) (1,363)
9,175 7,880
Change in net assets attributable to shareholders from investment activities (1,633) 1,588
Closing net assets attributable to shareholders 87,334 70,349
Balance Sheet
As at 30 November 2018
30.11.18 31.05.18 £’000 £’000 £’000 £’000
ASSETSInvestments assets 86,586 76,972
Current assets
Debtors 343 535
Cash and bank balances 2,809 4,021
Total other assets 3,152 4,556
Total assets 89,738 81,528
LIABILITIESInvestment liabilities 777 1,590
Creditors
Other creditors 1,627 146
Total other liabilities 1,627 146
Total liabilities 2,404 1,736
Net assets attributable to shareholders 87,334 79,792

REPORT AND ACCOUNTS
Investec Funds Series iv 99
Target Return Bond Fund
Statement of Total Return
For the period ended 30 November 2018
30.11.18 30.11.17 £’000 £’000 £’000 £’000
IncomeNet capital gains/(losses) 1,368 (6,882)
Revenue 2,273 3,782
Expenses (319) (656)
Interest payable and similar charges (119) (78)
Net revenue before taxation 1,835 3,048
Taxation (180) (4)
Net revenue after taxation 1,655 3,044
Total return before distributions 3,023 (3,838) Distributions (1,655) (3,044)
Change in net assets attributable to shareholders from investment activities 1,368 (6,882)
Statement of Change in Net Assets Attributable to Shareholders
For the period ended 30 November 2018
30.11.18 30.11.17 £’000 £’000 £’000 £’000
Opening net assets attributable to shareholders 273,663 291,287 Amounts receivable on creation of shares 1,439 35,574
Amounts payable on cancellation of shares (78,779) (17,058)
(77,340) 18,516
Dilution adjustment 28 35
Change in net assets attributable to shareholders from investment activities 1,368 (6,882)
Retained distributions on accumulation shares 1,331 2,017
Closing net assets attributable to shareholders 199,050 304,973
Balance Sheet
As at 30 November 2018
30.11.18 31.05.18 £’000 £’000 £’000 £’000
ASSETSInvestments assets 178,669 190,898
Current assets
Debtors 981 2,094
Cash and bank balances 69,390 121,316
Total other assets 70,371 123,410
Total assets 249,040 314,308
LIABILITIESInvestment liabilities 19,884 20,131
Creditors
Bank overdrafts 22,028 20,065
Distribution payable 37 291
Other creditors 8,041 158
Total other liabilities 30,106 20,514
Total liabilities 49,990 40,645
Net assets attributable to shareholders 199,050 273,663

REPORT AND ACCOUNTS
100 Investec Funds Series iv
Target Return Bond Fund continued
Distribution Tables
For the period ended 30 November 2018
Interim distribution paid 31 October 2018Group 1 – Shares purchased before 1 June 2018
Group 2 – Shares purchased between 1 June and 31 August 2018
Distribution Distribution Gross paid paid Income Equalisation 31.10.18 31.10.17 pence pence pence pence
‘A’ Class (Accumulation shares)Group 1 – – – 0.3332
Group 2 – – – 0.3332
‘A’ Class (Income shares)Group 1 0.1303 – 0.1303 0.2965
Group 2 0.1303 – 0.1303 0.2965
‘I’ Class (Accumulation shares)Group 1 0.3068 – 0.3068 0.5018
Group 2 0.2402 0.0666 0.3068 0.5018
‘I’ Class (Income shares)Group 1 0.2631 – 0.2631 0.4371
Group 2 0.2182 0.0449 0.2631 0.4371
‘R’ Class (Accumulation shares)Group 1 0.2684 – 0.2684 0.4517
Group 2 0.2684 – 0.2684 0.4517
‘S’ Class (Accumulation shares)Group 1 0.5874 – 0.5874 0.8327
Group 2 0.0581 0.5293 0.5874 0.8327
Distribution Distribution Gross paid paid Income Equalisation 31.10.18 31.10.17 US cent US cent US cent US cent
‘S’ Class (USD Hedge Accumulation shares)Group 1 0.5017 – 0.5017 0.7153
Group 2 0.5017 – 0.5017 0.7153

Investec Funds Series iv
REPORT AND ACCOUNTS
101
Distribution Tables
For the period ended 30 November 2018
Interim distribution payable 31 January 2019Group 1 – Shares purchased before 1 September 2018
Group 2 – Shares purchased between 1 September and 30 November 2018
Distribution Distribution Gross payable paid Income Equalisation 31.01.19 31.01.18 pence pence pence pence
‘A’ Class (Accumulation shares)Group 1 – – – 0.1894
Group 2 – – – 0.1894
‘A’ Class (Income shares)Group 1 – – – 0.1682
Group 2 – – – 0.1682
‘I’ Class (Accumulation shares)Group 1 0.1472 – 0.1472 0.3558
Group 2 0.0960 0.0512 0.1472 0.3558
‘I’ Class (Income shares)Group 1 0.1245 – 0.1245 0.3078
Group 2 0.1089 0.0156 0.1245 0.3078
‘R’ Class (Accumulation shares)Group 1 0.1127 – 0.1127 0.3030
Group 2 0.1127 – 0.1127 0.3030
‘S’ Class (Accumulation shares)Group 1 0.3859 – 0.3859 0.6525
Group 2 0.1735 0.2124 0.3859 0.6525
Distribution Distribution Gross payable paid Income Equalisation 31.01.19 31.01.18 US cent US cent US cent US cent
‘S’ Class (USD Hedge Accumulation shares)Group 1 0.3317 – 0.3317 0.5681
Group 2 0.3317 – 0.3317 0.5681
EqualisationEqualisation applies only to shares purchased during the distribution period (Group 2 shares). It is the average amount of income included in the purchase price of
all Group 2 shares and is refunded to holders of these shares as a return of capital. Being capital, it is not liable to income tax but must be deducted from the cost of
shares for capital gains tax purposes.

REPORT AND ACCOUNTS
Investec Funds Series iv102
UK Total Return Fund
Statement of Total Return
For the period ended 30 November 2018
30.11.18 30.11.17 £’000 £’000 £’000 £’000
IncomeNet capital (losses)/gains (8,501) 987
Revenue 2,350 2,809
Expenses (328) (362)
Interest payable and similar charges – –
Net revenue before taxation 2,022 2,447
Taxation (37) (51)
Net revenue after taxation 1,985 2,396
Total return before distribution (6,516) 3,383 Distribution (3) (160)
Change in net assets attributable to shareholders from investment activities (6,519) 3,223
Statement of Change in Net Assets Attributable to Shareholders
For the period ended 30 November 2018
30.11.18 30.11.17 £’000 £’000 £’000 £’000
Opening net assets attributable to shareholders 188,865 204,965 Amounts receivable on creation of shares 950 2,461
Amounts payable on cancellation of shares (3,199) (22,782)
(2,249) (20,321)
Dilution adjustment – 24
Change in net assets attributable to shareholders from investment activities (6,519) 3,223
Closing net assets attributable to shareholders 180,097 187,891
Balance Sheet
As at 30 November 2018
30.11.18 31.05.18 £’000 £’000 £’000 £’000
ASSETSInvestments assets 164,598 172,029
Current assets
Debtors 569 10,134
Cash and bank balances 15,037 10,901
Total other assets 15,606 21,035
Total assets 180,204 193,064
LIABILITIESInvestment liabilities – 3,377
Creditors
Other creditors 107 822
Total other liabilities 107 822
Total liabilities 107 4,199
Net assets attributable to shareholders 180,097 188,865

REPORT AND ACCOUNTS
Investec Funds Series iv 103
Securities Financing Transactions (‘SFTs’) As at 30 November 2018
At 30 November 2018 there were no securities out on loan and no collateral held.
GLOBAL DATA Fund assets under management Assets engaged in SFTs and total return swaps (AUM) £’000
Diversifi ed Growth Fund 2,276,409
Emerging Markets Blended Debt Fund 121,110
Underlying exposure valueAbsolute value of assets engaged in total return swaps: £’000 % of net assets
Diversifi ed Growth Fund (10,836) (0.47%)
Emerging Markets Blended Debt Fund 983 0.81%
CONCENTRATION DATA
Counterparty’s Underlying country of exposure value SettlementCounterparty establishment £’000 and clearing
Diversifi ed Growth Fund
Goldman Sachs United States of America (452) Bi-lateral
JP Morgan United States of America (10,384) Bi-lateral
Emerging Markets Blended Debt Fund
Citi UK 511 Bi-lateral
Standard Chartered UK 275 Bi-lateral
Deutsche Bank Germany 197 Bi-lateral
AGGREGATE TRANSACTION DATA
Type, Quality and Currency of Collateral
Type Quality Currencies
Total return swaps Diversifi ed Growth Fund n/a n/a n/a
Emerging Markets Blended Debt Fundn/a n/a n/a
Maturity Tenor of SFTs and Total Return Swaps (remaining period to maturity)
Less than One day to One week to One to three Three months Above Open one day one week one month months to one year one year transactions Total £’000 £’000 £’000 £’000 £’000 £’000 £’000 £’000
Diversifi ed Growth Fund
Total return swaps – – – – (10,836) – – (10,836)
Emerging MarketsBlended Debt Fund
Total return swaps – – – – 186 797 – 983
RETURN AND COST
Manager of Collective Collective Investment Investment Third Parties Undertaking Undertaking (e.g. lending agent) Total £’000 £’000 £’000 £’000
Diversifi ed Growth Fund
Total return swaps
Gross return – – – –
% of total gross return 0.00% 0.00% 0.00% –
Cost – – – –
Emerging Markets Blended Debt Fund
Total return swaps
Gross return 33 – – 33
% of total gross return 100.00% 0.00% 0.00% –
Cost – – – –

REPORT AND ACCOUNTS
Investec Funds Series iv104
Other Information
ISA status
During the period under review, the shares of the funds met the requirements for eligibility to be held in a stocks and shares
ISA as determined by the regulations which govern ISAs.
Investec Fund Managers Limited offer the ‘A’ shares of the funds through its own ISA plan.
* Please note that while the Multi Asset Protector Fund became a qualifying investment for a stocks and shares ISA as of
1 January 2011, this may change over time. Please refer to the section of the Supplementary Information Document titled
‘ISA investment in the Multi Protector Fund’ for further information.
Distributions
Where a distribution is to be paid, it has been calculated as at 30 November 2018 and will be distributed to shareholders,
where applicable, on 30 January 2019. For accumulations shares income distribution payments are deemed to be paid on
30 January 2019.
Telephone calls
Telephone calls may be recorded for training and quality assurance purposes.
Cross holding table
There were no cross holdings between sub-funds in Investec Funds Series iv as at 30 November 2018.

REPORT AND ACCOUNTS
Investec Funds Series iv 105
Active management
An active investment approach is one where a portfolio
manager aims to beat the market through research, analysis
and his/her judgement. (See also passive management).
Asset allocation
A fund’s allotment to different asset classes.
Asset class
The main types of investment available. The traditional asset
classes are equities, bonds and cash.
Bear market
A market where prices fall consistently over a long period of
time. Investors are referred to as ‘bearish’ if they believe
prices are going to fall.
Benchmark
A comparative performance index.
Bond
A form of loan issued by a government or company.
Typically, an investor should receive a regular coupon and
the return of the principal originally lent when the bond
matures. Note: Not all bonds are interest bearing (see zero
coupon bond), and not all bonds are fi xed rate (e.g. index
linked, fl oating rate and stepped rate bonds).
Bottom-up investing
An investment approach that concentrates on the analysis of
individual companies and considers the company’s history,
management and potential as more important than
macroeconomic trends.
Bull market
A market where prices rise consistently over a long period of
time. Investors are referred to as ‘bullish’ if they believe
prices are going to rise.
Cash
The most liquid form in which to store capital. While it is
regarded as a safe asset class, over time the purchasing
power of cash tends to be eroded by infl ation.
Central bank base rate
The basic rate of interest set by a central bank that
determines the cost of borrowing.
Commodities
An asset class which comprises physical assets such as oil,
base and precious metals and agricultural produce.
Credit rating agency
An institution that assigns credit ratings to debt issuers,
such as companies and governments. Standard & Poor’s
and Moody’s are well-known examples.
Credit risk
The risk that a bond issuer or borrower will be unable to
meet their contractual obligations.
Credit spread
The differences in yield between ‘risk-free’ bonds, such as
gilts or US treasuries, and non-treasury (or gilt) bonds, which
are identical in all respects except for the quality of their
rating. Corporate bonds tend to offer additional yield to
compensate investors for the potential risk of default.
Currency risk
The risk of incurring losses of foreign assets due to adverse
movements in exchange rates between domestic and foreign
currencies.
Defl ation
As opposed to infl ation, it describes conditions in which
there is a widespread, consistent decline in prices. It conveys
the rarer occurrence of the money in one’s pocket actually
increasing in buying power, rather than the more usual
opposite.
Derivatives
An instrument whose value depends on the performance of
an underlying security or rate which requires no initial
exchange of principal. Options, futures and swaps are all
examples of derivatives.
Developed markets
Refers to industrialised countries with relatively high levels of
economic productivity, high standards of living and stable
economies.
Disinfl ation
Refers to a slowing down in price growth, as opposed to
defl ation where prices are already falling.
Diversifi cation
Holding a range of assets to reduce risk.
Dividend
The portion of company net profi ts paid out to shareholders.
Glossary

REPORT AND ACCOUNTS
Investec Funds Series iv106
Glossary continued
Dividend yield
The annual dividend per share divided by the current share
price.
Duration
A measure of a bond investment’s sensitivity to changes in
interest rates. The longer the duration, the more sensitive it
is. Calculating ‘duration’ for a fi xed income investment such
as a bond is a complicated sum. It takes into account the
current value of the bond, the coupon or interest payment,
the book cost, and the number of years the bond has left to
run. Put simply, the higher the duration number the higher
the potential return (and the greater the risk).
Emerging markets
Countries in the process of industrialising which tend to have
rapidly growing economies.
Emerging market debt
Debt issued by governments and corporates in emerging
markets.
Equity
Refers to shares. A share in a company provides an investor
with part ownership of that company.
Fixed Income
An investment that provides a return in the form of fi xed
periodic payments and the eventual return of principal at
maturity.
Future
An obligation to buy or sell an asset on a specifi c date in the
future at an agreed price.
Gilt
A bond that is issued by the British government which is
generally considered low risk. Bonds issued by South
African and Irish governments are also referred to as gilts.
Hedging
A technique seeking to offset or minimise the exposure to
specifi c risk by entering an opposing position.
High yield bond
A below investment grade rated bond, providing the investor
with greater returns due to its higher default risk. (See Junk
bond).
Index-linked bonds
Bonds whose coupons and principal payment are linked to
movements in infl ation.
Infl ation
Describes conditions in which there have been a consistent
rise in prices.
Initial public offering (IPO)
The fi rst public sale of a company’s equity resulting in a
quoted stock price on a stock exchange.
Interest
The return earned on funds which have been deposited,
loaned, or invested.
Investment grade bonds
Bonds considered of the highest quality by credit rating
agencies. The threshold credit rating for Standard & Poor’s
is BBB and Baa3 for Moody’s.
Liabilities
Financial obligations that must be met.
Liquidity
The ease with which an asset can be sold at a reasonable
price for cash.
Long dated bond
A bond with usually 15 years or more remaining before
redemption, at which point the principal is paid to the holder.
Long-term investment
Holding an asset for an extended period of time. Depending
on the security, a long-term asset can be held for as little as
one year or for as long as 30 years.
Macroeconomic
Refers to the big trends in an economy as a whole, such as
infl ation and unemployment, while microeconomic forces
refer to the factors affecting individual situations or
companies.
Market capitalisation
The total value of a company’s equity, calculated by the
number of shares multiplied by their market price.

REPORT AND ACCOUNTS
Investec Funds Series iv 107
Maturity
With regards to bonds, maturity refers to the time at which
the principal of the bond is repayable and it ceases to exist.
In terms of a pension fund, it conveys the average age of the
membership and the time until benefi ts are payable.
Outperformance
The return of a fund in excess of the comparative
performance index.
Overweight
When a fund has greater exposure to an asset than the
comparative performance index.
Peer group
A group of funds that can be compared with one another for
performance purposes. A peer group will usually be based
on the funds’ investment scope, for example UK equities.
Performance
The results of an investment over a given period.
Portfolio
A grouping of fi nancial assets, such as equities, bonds and
cash equivalents. Portfolios are held directly by investors
and/or managed by fi nancial professionals.
Rally
A swift rise.
Real estate
An asset class comprising buildings and land.
Risk premium
The extra return expected by an investor in compensation for
holding a risky asset.
Security
A general term for a tradable fi nancial instrument.
Short-term investment
Investments that are held for or mature in 12 months or less.
Standard deviation
A measure of risk, deriving from the historic volatility of a
particular asset.
Top-down investing
Contrasting with bottom-up analysis, a top-down approach
to investment analysis begins with an assessment of
macroeconomic factors, then business cycles before moving
on to look at individual sectors and companies.
Treasuries
Debt securities issued by the US government. Treasuries fall
under three categories: treasury bills (T-bills), treasury notes
(T-notes) and treasury bonds (T-bonds).
Underweight
When a fund has less exposure to an asset than the
benchmark.
Volatility
Price movements. Standard deviation is a measure of an
asset’s historic volatility.
Year-to-date (YTD)
Refers to the period extending from the beginning of the
current calendar year to the present date.
Yield
A measure of the income return earned on an investment.
In the case of a share the yield expresses the annual
dividend payment as the percentage of the market price of
the share. In the case of a property, it is the rental income as
a percentage of the capital value. In the case of a bond the
running yield (or fl at or current yield) is the annual interest
payable as a percentage of the current market price.
The redemption yield (or yield to maturity) allows for any gain
or loss of capital which will be realised at the maturity date.
Yield curve
A graphical representation off all the yields of bonds of the
same quality with maturities ranging from the shortest to the
longest available.
Yield spread
The difference in yield between different bonds.
Yield to maturity
The annualised return (internal rate of return) that would be
earned on a bond if held to maturity.

REPORT AND ACCOUNTS
Investec Funds Series iv108
Directory
Authorised Corporate Director (ACD)
Investec Fund Managers LimitedContact address PO Box 9042, Chelmsford CM99 2XL
Telephone +44 (0)20 7597 1900
Free phone 0800 389 2299
Email [email protected]
Indicator online valuation service
www.investecassetmanagement.com
Registered address Woolgate Exchange
25 Basinghall Street
London EC2V 5HA
Investment ManagerInvestec Asset Management LimitedWoolgate Exchange
25 Basinghall Street
London EC2V 5HA
Registered number for Investec Funds Series ivIC392 England and Wales
RegistrarDST Financial Services Europe LimitedDST House
St. Nicholas Lane
Basildon
Essex SS15 5FS
DepositaryState Street Trustees Limited20 Churchill Place
London E14 5HJ
Fund AccountingState Street Bank and Trust Company Limited20 Churchill Place
London E14 5HJ
Independent AuditorsKPMG LLP15 Canada Square
Canary Wharf
London E14 5GL
Issued by Investec Fund Managers Limited, January 2019.
Authorised and regulated by the Financial Conduct Authority.
