investec capital markets day bank and wealth...2019/02/26 · investec capital markets day bank and...
TRANSCRIPT

Investec Capital Markets DayBank and Wealth
Investec Group
26 February 2019

Page 2
Today’s presenters
Fani TitiJoint CEO of the Investec Group
Introduction
David van der WaltJoint Global Head of the Specialist
Bank and CEO of Investec Bank plcUK Specialist Bank
Steve ElliottGlobal Head of Wealth & Investment
Wealth & Investment SA & UK
Nishlan SamujhCFO of the Investec Group
Performance
Richard WainwrightJoint Global Head of the Specialist
Bank and CEO of Investec Bank LtdSA Specialist Bank

Page 3
5 Performance
6 Summary and Conclusion
7 Appendix
4 Wealth & Investment business
3 SA Specialist Bank
2 UK Specialist Bank
1 Introduction
88
77
64
47
23
4
90
1 Introduction 4

Page 4
Objectives for today’s presentation
Demonstrate sustainable organic capital generationDemonstrate sustainable organic capital generation
Highlight initiatives to enhance returnsHighlight initiatives to enhance returns
Focus on Investec’s strategic positioningFocus on Investec’s strategic positioning
Recap on the demerger rationaleRecap on the demerger rationale

Page 5
Rationale for the demergerWhy we are proposing to demerge Investec Asset Management from Investec Bank and Wealth
• Investec Group comprises a number of successful businesses operating across two core geographies, with different capital requirements and growth trajectories
• Clear synergies between the Specialist Bank and Wealth & Investment business
• Group should be simplified to improve resource allocation, performance and growth trajectory
• Limited synergies between Investec Asset Management and the wider Investec Group
• Simplifies the Group, allowing the Specialist Bank and Wealth & Investment businesses to focus on their growth paths
• Opportunity to build on compelling existing linkages between the Specialist Bank and Wealth & Investment businesses
• Heightened focus leading to improved cost discipline
• Allows Investec Asset Management to accelerate its own growth, with enhanced ability to attract and retain talent
Conclusions of strategic review Demerger benefits
Enhance the long-term prospects of both businesses for the benefit of all stakeholders

Page 6
A business with nearly 40 years of heritage
Investec Bank & Wealth
Investec Bank & Wealth
Investec Asset
Management
Investec Asset
Management
19811981 19921992 20022002 20192019
10
20
30
40
50
60
FUM Core Loans and Advances
0
20
40
60
80
100
120
Focused on core markets
Leading specialist client franchises
Growing connectivity between the specialist bank and wealth business
Well capitalised, lowly leveraged balance sheet
Diversified mix of business by geography, income and business
Highly scalable platform
Established global asset manager with a unique emerging market heritage
Long-term growth track record
Well diversified by asset class and region
Strong investment performance over prolonged period
Few linkages with wider group
Opportune time to consider strategic fit and shape of the Investec Group
FUM and core loans and advances (£’bn)
Assets under management (£’bn)
Launch of Investec Asset Management
UK listing
20102010
Acquired Rensburg Sheppards
Management succession

Page 7
A distinctive specialist bank and wealth manager…
Dedicated partnerships
Cast-iron integrityClient focus Distinctive
performance
We seek to attract and retain highly talented professionals by maintaining an environment that stimulates high performance and encourages creativity and entrepreneurship
The careful selection of people, their ongoing education and uncompromising commitment to our stated values will continue to be a distinctive characteristic of Investec’s culture and drive
Stable senior management team with a long tenure at Investec
We have a client-centric, high-tech, high-touch approach – distinction in our ability to be nimble, flexible and innovative, and to provide a high level of client service
We integrate social, ethical and environmental considerations into day-to-day operations and our sustainability approach is based on the integration of people, planet and profit
We are driven by a commitment to our core values and philosophies
…facilitating the creation and management of wealth
Embodied in our distinctive culture

Page 8
Overview of Investec post demergerA domestically relevant, internationally connected specialist banking and wealth management group
Information on this slide is as at 30 September 2018, unless otherwise indicated. * Before taxation and central costs of £50mn. Based on the results of the ongoing business (excluding UK Specialist Bank legacy assets and businesses sold) and excluding IAM, unless otherwise specified.
Specialist Banking Wealth & Investment
Corporate / Institutional / Government / Intermediary Private client (HNW / high income) / charities / trusts
Lending
Transactional banking
Advisory
Treasury solutions
Investment activities
Deposit raising activities
Discretionary wealth management
Investment advisory services
8,000+Employees
2Core areas of activity
2Principal geographies
Financial planning
Stockbroking / execution only
56%27%
17%
SA Bank UK Bank Wealth & Investment SA and UK
March 2018 Group profit*
£573mn
£24bnCore loans
£57bnThird party FUM
£30bnCustomer deposits

Page 9
We have market-leading specialist client franchises
SA Specialist Bank UK Specialist Bank
Wealth & Investment SA and UK
We are not all things to all people: we serve select niches where we can compete effectively
Top Private Bank
#1
One of the leading Wealth Managers in SA
Corporate Advisory and Equity Sales
Top tier
5th largest bank by assets
#5
One of the largest Wealth Managers
in the UK
Top tier
Small Ticket Asset Finance
provider
Toptier
Treasury Risk Solutions
Toptier
Corporate Advisory and Equity Sales
Top tier
Specialist client franchises span Infrastructure, fund finance, aviation…
Top tier

Page 10
We have a diversified mix of businesses
Geography Income streamBusiness
54%
46%
79%
21%
56%
44%
Balance sheet driven Capital light
Information on this slide is based on the results of the ongoing business (excluding UK Specialist Bank legacy assets and businesses sold) and excluding IAM, unless otherwise specified. 1Before tax, goodwill, acquired intangibles, non-operating items but after adjusting for earnings attributable to other non-controlling interests and central costs. 2Before tax, goodwill, acquired intangibles, non-operating items and central costs but after adjusting for earnings attributable to other non-controlling interests.
2018 Operating income 2018 Operating income2018 Operating income
Diversified geographic business model with growing capital light revenues
36%
64%
UK and Other Southern Africa
83%
17%
Specialist Banking Wealth & Investment
2018 Operating profit22018 Operating profit1

Page 11
We have positive organic capital generation across our business
10.3% 10.4%
14.7%15.4%
Investec Limited Investec plc
Common equity Tier 1 ratio
Total capital adequacy ratio+
Existing capital generation supports growth and dividendsHealthy capital position
Leverage Ratio
7.7%7.5%
H1 2019 (standardised approach) as reported, including IAM Positive capital generation across all three core businesses
• All businesses are capital self-sufficient
• Supports RWA growth of c.8% to 10% p.a.
• Supports proposed dividend policy of 30% to 50%
• Maintain appropriate capital adequacy / buffer across Investec plc and Investec Limited
• Any dividends from the Wealth & Investment business passed through to shareholders
Well capitalised, lowly leveraged balance sheet with improving capital generation

Page 12
We have successfully transitioned to the next generation of management
Smooth transition of senior leadership
Long history working together at Investec with average tenure of 20 years for executive team
Supported by strong management teams across the business units
Average tenure of 18 years for top 50 senior managers
Passionate and entrepreneurial culture

Page 13
Solid foundations but more to be done
• Client-centric approach is in our DNA
• Market leading specialist client franchises with an established brand
• Locally responsive and internationally networked
• Addressed legacy / non-core businesses
• Invested in our platforms
• Sustainable organic capital generation to fund growth ambitions and dividends
Solid foundations Current ROE* performance
Simplifying and refocusing the Group to improve shareholder returns
Our targets
13.0%
9.1%
Total SA Total UK
Group ROE at H1 2019: 11.0%
Group: 12%-16%
We are focused on improving ROE
• Our franchise businesses in both SA and UK have ROEs at the lower end of our geographic target ranges
• Our ROE in SA is affected by lower returns on our investment portfolio, which we have plans to address
• Our ROE in the UK reflects significant investment into our business, notably the Private Bank, the benefits of which will emerge in the medium-term
• We aim to deliver on these targets over the next three years
SA**:15% to 18%
UK:11% to 15%
*ROE targets take into consideration Group Central Costs and reported information is post the deduction of these Group Central Costs. **Target set in Rands.

Page 14
Capital Discipline
Capital Discipline
CostManagement
CostManagement
ConnectivityConnectivity DigitalisationDigitalisationGrowth InitiativesGrowth
Initiatives
Our initiatives to enhance shareholder returnsWe are focused on five key initiatives to enhance returns for shareholders
More disciplined approach to capital
allocation, particularly where
businesses are non-core to our long-term
strategy
More disciplined approach to capital
allocation, particularly where
businesses are non-core to our long-term
strategy
Improved management of cost base, with increased focus and benefits to
be gained through simplicity
Improved management of cost base, with increased focus and benefits to
be gained through simplicity
Drive greater connectivity and
linkages through the organisation
Drive greater connectivity and
linkages through the organisation
Continue to invest in digital capabilities,
creating a better proposition for
clients and reducing costs
Continue to invest in digital capabilities,
creating a better proposition for
clients and reducing costs
1 3 4 5
Clear set of opportunities to deliver revenue
growth
Clear set of opportunities to deliver revenue
growth
2
Enhancing returns for shareholders

Page 15
More disciplined approach to capital allocationFocusing on businesses generating below target ROEs
• Simplified and de-risked our business through:
- Strategic sales
- Re-balanced the loan book
- Run-down the legacy portfolio
• Grown our client franchises
• Invested substantially in our UK Private Banking franchise
• Made substantial investment in digital channels and solutions, including Click & Invest and One Place
Actions taken to date
• Optimise capital allocation
• Review and address underperforming business units
• Manage down non-core equity investments portfolio in SA
• Focus on co-investment alongside clients to fund investment opportunities
• Leverage third party capital into funds that are relevant to our client base
• Leverage distribution strengths to grow capital light income stream
Planned actions
Maintain self-sustaining capital model in both the UK and SA
1C
apita
l Str
ateg
y

Page 16
Pursuing our growth plans
Extend Specialist Banking proposition
• More holistic client-centric offering to mid-sized corporates (SA Investec for Business and UK Corporate Banking)
• Investec Life
• Integrated offering for intermediaries in SA
• Transactional banking offering for corporates
• Expand the Specialist Bank’s funds and investment product businesses
Further develop Wealth & Investment offering
• Expand financial planning (UK) and fiduciary capabilities (SA)
• Increase collaboration with Investec Private Bank
• Focus on investing and developing digital channel
• Extend breadth of global investment offering, particularly in alternative asset classes such as private equity
UK Private Bank shift from platform build to client growth
• Focus on client acquisition and retention
• New private client lending platform initially focused on mortgages
2
Multiple opportunities to drive further growth

Page 17
Increased focus on effective cost managementHistorical increases in our cost to income ratio reflect strategic investment in the business
66.8% 67.7% 68.2% 68.5%
< 63%
2016 2017 2018 H1 2019 Medium-termtarget*
Improving cost to income ratio^ in the medium-term
Achieving our medium-term target* of < 63%
• We expect historical investment to accelerate revenue growth as we leverage the investment in our business
• Areas identified for improvement in our cost base:
- Reduction in Group Costs
- Greater shared use of technology across the Group, optimising our operational platforms
- Further utilisation of lower cost operations, including SA
Delivering positive jaws
3
Historical cost to income ratio development
• The increase in our cost to income ratio historically reflects a period of strategic investment in the business:
- Development of scalable UK Private Bank platform
- Focus on digitalisation and technology development
- Investment in talent
• Our growth initiatives have been fully expensed
*Which we aim to deliver on over the next three years. ^Calculation adjusts for the Group’s 26.57% interest held in the Investec Property Fund (IPF), by deducting the IPF minority interests from income.

Page 18
Connectivity: Locally relevant and internationally networked
Existing connectivity
Between SA and the UK Between Specialist Bank and Wealth & Investment
Opportunities for greater
connectivity
• Seamlessly serving SA HNW and corporate clients who have international financial needs
• Leveraging expertise in specialist client franchises
• Shared use of operations (e.g. SA customer service centre)
• Single global investment process for Wealth & Investment
• Private Bank / Wealth offering: One Place
• Wealth & Investment access to products (where suitable) originated/sourced/developed in the Bank
• Client journeys – interconnections across corporate bank, investment bank, private bank and wealth
• Global digital platforms for private clients and IFAs
• Greater cross collaboration between the various banking businesses
• Cross border M&A transactions
• Providing international investment products to our intermediary client base
• Leverage the transactional banking platform between SA and the UK
• Greater cross referrals between the Specialist Bank and Wealth & Investment business particularly in the UK
• Further digital platform integration around client type
• Potential for further shared operational linkages
• Alternative investment products
Meeting the needs of our sophisticated, and internationally orientated clients
4

Page 19
Continuing to invest in Digitalisation5
Best Digital Bank in SA
Most Innovative Digital Bank in Africa
Our digitalisation strategy integrates services across business and geography, to bring to life a high-touch, high-tech experience
Technology is not only a business enabler, but also a catalyst for continuous improvement in executing strategy in a digital era
Private clients
Integrated access to Investec’s banking and
investment services
Complete digital offering providing
advice online
Joint 2nd for One Place Mobile App Joint 1st Robo-Advisor for Click & Invest
Unified experience for SA Intermediary clients allowing them
to transact, save and trade
UK Corporate Banking
SA Investec for Business
Intermediary clients Corporate clients

Page 20Information on this slide is based on the results of the ongoing business (excluding UK Specialist Bank legacy assets and businesses sold) and excluding IAM, unless otherwise specified.
Enhancing shareholder returns over the medium-term
8.3%
4.9%
6.5%7.5% 8.0%
9.3%10.0%
9.8%
11.1%
8.9%
11.2%10.6%
11.3%11.9% 11.9% 11.9%
11.0%
2011 2012 2013 2014 2015 2016 2017 2018 H1 2019
Statutory ROE ROE from ongoing business+
More efficient approach to capital allocation
Clear set of strategic initiatives to support income growth
Increased focus on delivering cost improvements
Drive greater connectivity and linkages across the business
Narrowing gap between statutory and ongoing ROE Drivers for ROE enhancement
Enhancing ROE supports investment for growth and attractive returns for shareholders
Group ROE Target*:
12% to 16%
Group ROE Target*:
12% to 16%
Continue to invest in digital capabilities
ROE evolution since 2011>
>
>
>
>
*Which we aim to deliver on over the next three years.
Page 21
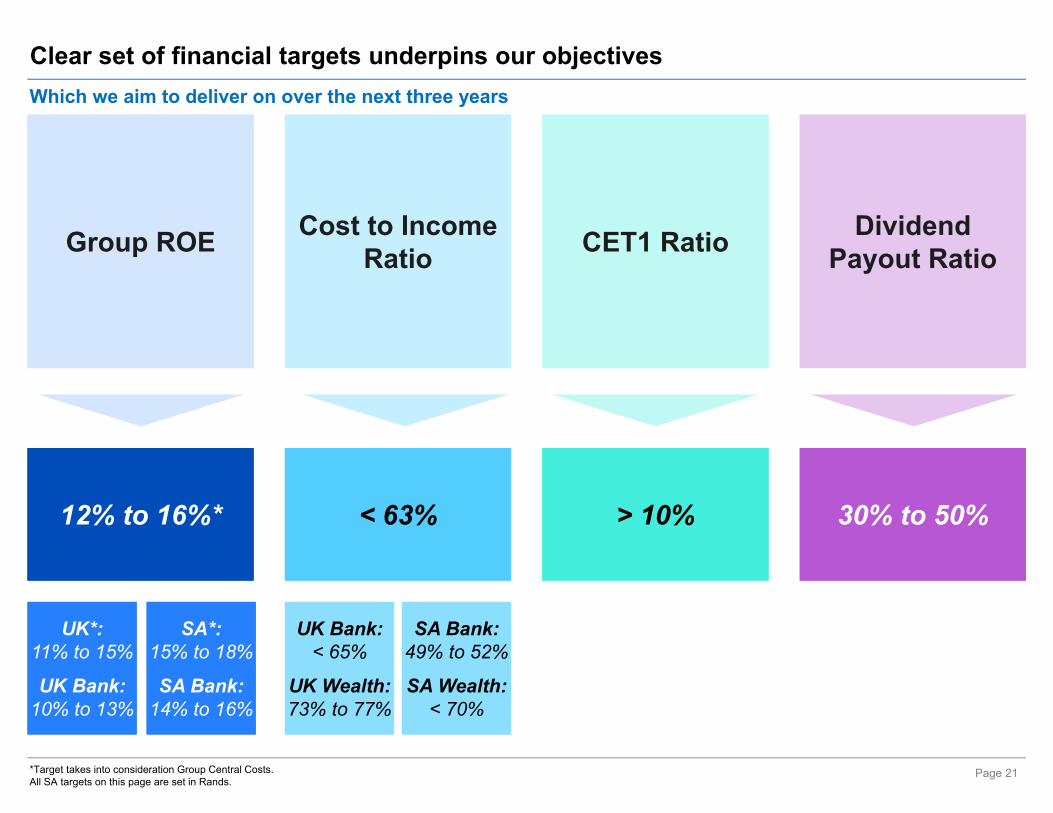
Clear set of financial targets underpins our objectives
Group ROEGroup ROE Cost to Income Ratio
Cost to Income Ratio CET1 RatioCET1 Ratio Dividend
Payout RatioDividend
Payout Ratio
12% to 16%*12% to 16%* < 63%< 63% > 10%> 10% 30% to 50%30% to 50%
UK*:11% to 15%
UK Bank:10% to 13%
UK*:11% to 15%
UK Bank:10% to 13%
UK Bank:< 65%
UK Wealth:73% to 77%
UK Bank:< 65%
UK Wealth:73% to 77%
SA*:15% to 18%
SA Bank:14% to 16%
SA*:15% to 18%
SA Bank:14% to 16%
SA Bank:49% to 52%
SA Wealth:< 70%
SA Bank:49% to 52%
SA Wealth:< 70%
*Target takes into consideration Group Central Costs.All SA targets on this page are set in Rands.
Which we aim to deliver on over the next three years

Page 22
5 Performance
6 Summary and Conclusion
7 Appendix
4 Wealth & Investment business
3 SA Specialist Bank
2 UK Specialist Bank
1 Introduction
88
77
64
47
23
4
90
2 UK Specialist Bank 23

Page 23
0
2
4
6
8
10
12
2011 2012 2013 2014 2015 2016 2017 2018 H1 2019
UK Specialist Bank overview
Corporate and Investment Banking Private Banking
Our offering
Our clients
Capital, advice and ideas, risk management and treasury solutions
HNW and high income active wealth creators, SA Investec clients and UK retail savers
Lending, savings, transactional banking and foreign exchange
Banking
UK
Our growth story
CAGR: 9%£’bn Loan growth over time
Information on this slide is based on the results of the Ongoing business (excluding UK Specialist Bank legacy assets and businesses sold) as at 31 March 2018, unless otherwise specified.*Before tax, goodwill, acquired intangibles, non-operating items and central costs but after adjusting for earnings attributable to other non-controlling interests.
Strong domestic client franchises complemented by international specialist capabilities
Employees
% Loan book
% Operating profit*
contribution
c.2,300
27%
38%
Mid to large UK corporates, private equity sponsors and specialist international businesses
Small to mid-sized UK corporates

Page 24
We have evolved our business model and are strategically well positioned
• Simplified and de-risked our business as a basis from which to grow
• Fully invested Private Banking franchise with a clear market opportunity set to realise benefits of increased scale
• Enhanced connectivity across the businesses with strong potential for further collaboration
• Achieved considerable scale in our competitively positioned Corporate and Investment Banking franchises with sustainable growth opportunities
• Improved revenue mix –client-driven, high annuity and increased capital light
Going forward:
- Strong growth strategies
- Focusing on cost discipline
- Improving returns
- Delivering sustainable organic capital generation
Well positioned for future growth
1
2
3
4
5
6
Banking
UK

Page 25
Simplified and de-risked our business
Our UK legacy portfolio is pre-2008 business with very low/negative margins, and assets relating to discontinued business.*Total effective coverage on the overall legacy portfolio (including assets held at fair value through profit and loss), calculated as if fair value adjustments are equivalent to balance sheet impairments). ^Credit Ratings shown relate to Investec Bank plc deposit and long-term senior debt ratings.
1
52%
25%
23%
Lending collateralised by property
HNW and other private client lending
Corporate and other lending
2008 2013 2014 2015 2016 2017 2018 H1 2019
Other Private Bank assetsPrivate Bank Irish planning and development assetsOther corporate assets and securitisation activities
20.2%17.2% 17.6%
26.6%
31.7%*
2015 2016 2017 2018 H1 2019
9.9%
7.5%
5.5%
3.2%1.9%
2015 2016 2017 2018 H1 2019
Ongoing – 96.8%
16%
22%62%2010 H1 2019
Run-off of Legacy assets
0.2
Baa3 / BBB-
A3
A2 A2 (positive)
BBB
BBB+
Jun15 Oct15 Feb16 Sep17
Moody’s
Fitch
A1
Feb19
Banking
UK
4.8
2.62.2
0.7 0.6 0.5 0.3
£’bn
Significantly reduced Legacy portfolio
Reduction of Legacy as % of UK loan book Increase in Legacy coverage
Significantly reduced Property as % of UK loan book Significantly improved Credit Ratings^

Page 26
UK Corporate and Investment Banking (CIB) overview
• Delivering a ‘private banking’ experience with investment banking quality of advice and serviceAmbition
Clear target market
• Small to mid-sized UK corporates (c.£10mn - £100mn revenue)
• High probability of corporate activity or growth
Our value proposition
• Client-centric, solution-driven offering – opportunity to drive client acquisition and increase market share
• Tailored offering focused on UK mid-market corporates, financial sponsors and specialist international franchises
2018Best service from an
Asset Finance Provider
2017Best Commercial
Lender – Commercial Finance Awards
2017Innovation in the SME
Finance Sector
2018Best Asset Finance
Provider: Winner
2018• Sole Corporate
Broker & Joint Sponsor
• £8.1bn hostile offer for GKN plc
2018• Sole Sponsor &
Corporate Broker• GVC’s £3.2bn
takeover of Ladbrokes Coral
2018Bank Lender of the
Year
Corporate Banking Investment Banking
Banking
UK
• Creating a premier UK mid-market investment bank by offering boutique service and bulge bracket capability to our target clients
• Specialist international franchises: building deep relevance in our chosen sectors through our expertise
• UK Investment Banking: Larger mid-market UK corporates (£100mn - £1bn revenue) and the financial sponsors that operate in that space
• Specialist international franchises: aviation, fund finance, power and infrastructure finance and resource finance
2
Shared infrastructure
2018Sole Arranged $2bn of financing for Emirates
between 2016 and 2018

Page 27
CIB: Creating a leading Corporate Banking offering…2
…with a joined up, client-centric approach for our target market (£10mn - £100mn corporates)
Banking
UK
£1bn+
Specialists
Generalists
Size of client
High Street Banks
£10mn £100mn
Our differentiation:
Agile, personalised service, tailored to meet needs of small to mid cap corporates
We offer:• Lending• Working capital• Treasury and risk solutions• Advisory

Page 28
Boutique service with ‘Bulge Bracket’ capability and award winning franchises
2 Banking
UKCIB: Uniquely positioned Investment Banking with a holistic proposition
Securities Lending Advisory Risk
• Tailored offering to meet the needs of UK mid-market corporates (£100mn – £1bn revenue) and financial sponsors
• Our specialist international franchises sector businesses are differentiated by our deep expertise and relationships and our ability to innovate alongside our clients
Glo
bal
inve
stm
ent
bank
sSp
ecia
lists
/ hi
gh s
treet
ban
ks
Core offering Ability/Non-core offering to mid cap market No offering
We offer the capabilities of the global investment banks to the UK mid-market where the global investment banks typically do not focus
We compete on the basis of our breadth of capabilities and personalised service

Page 29
97%
2018
Client driven income
Investment and other income
CIB: Achieved considerable scale in the business2
Growth in sustainable core corporate client franchises
2006 2006
2006
Banking
UK
Improved revenue sustainability and mix underpinned by client franchises
81%
2011
Investment and other income
• Significant growth since inception to become well-established, award-winning franchises
• Built sustainably through organic growth and diversification into new markets and specialisms
• Differentiated, high calibre offering with strong relationship management and deep expertise
Consistently contributed 35-40% of Global Specialist Bank revenue
2006
140 (high value, event
driven clients)80
YTD 2019
Increased scale creates opportunity to provide our full service offering to our clients
YTD 2019 YTD 2019
YTD 2019
Client driven income
0
1,800
►
80
86,000
600
300
Corporate Banking Investment Banking

Page 30
1.72.3
2.63.2 3.0
3.74.3
5.1
5.96.3
0
1
2
3
4
5
6
7
2010 2011 2012 2013 2014 2015 2016 2017 2018 H1 2019
CIB: Delivering attractive and sustained growth2
*As at 30 September 2018.
Banking
UK
Growth in corporate loan book
CAGR: 17%£’bn
23%
30%34%
40%37%
52%
55%
60%
61%
62%
26%
5%
20%11%
24%
6%
8%
Corporate and acquisition finance
Asset-based lendingSmall ticket asset finance
Other corporate and financial institutions and governments
Large ticket asset finance
Project finance
Fund finance
Diversified corporate loan book
Net book size in £’bn and as a % of total UK net core loans Net corporate loan book by risk category*

Page 31
0.7
1.3
2.7
2.0
3.8
0
1
2
3
4
2015 2016 2017 2018 2019 YTD
Evolved to build a capital sustaining business model
19
29
4643
54
0
10
20
30
40
50
60
2015 2016 2017 2018 2019 YTD
2
Selling more deals… …and bigger in size
Number of deals sold
Banking
UK
Highly successful origination and distribution capability and growing fund management capability
Maintains diversity of loan book
Raises Investec’s
profile among institutional
investors globally
Provides valuable
market intel, aiding
origination of new deals
Enhances returns by recycling
capital
Allows us to punch above
our benchmark in
alternative space
Generates additional
capital light revenue
Increases client
relevance off-balance sheet
£’bn
…and growing our fund management capability, with £1.3bn of third party assets raised year to date

Page 32
0
1,000
2,000
3,000
4,000
5,000
6,000
7,000
8,000
2008 2009 2010 2010 2011 2012 2013 2014 2015 2016 2017 2018 H1 2019
IGAF IASL Goshawk Aircraft Investments (Third Party) Debt Funds
Where IGAF is Investec Global Aircraft Fund, IASL is Investec Aircraft Syndicate Limited.
c.US$1.1bn debt AuM
c.US$4.0bn equity AuM
Evolved to build a capital sustaining business model (cont.)2
Launched IGAF –
acquisition value: $1bn
Launched IASL No.1 –acquisition value: $600mn Launched
Goshawk
Launched Debt Funds
Sold Goshawk after growing to
US$3bn+
Sold IGAF and IASL No 1 portfolios
Case study: Building a world-leading Aviation franchise
Banking
UK
Client franchise • Well-established aviation franchise built on deep sector expertise and client relationships
Innovation and relevance
• We continually innovate to remain relevant by launching and managing third party aircraft leasing and debt funds
Connectivity • Global team leverages experience and relationships across the globe
Fund management track record
• 10 year fund management track record with over c.$5bn of third party AUM across debt and equity funds – providing recurring capital light revenue
$’mn
Aviation third party assets under management

Page 33
UK Private Banking overview
HNW Retail savings and SA clients
Business model
Offering
Channels
Target client
Foun
datio
nN
iche
s
LendLend TransactTransact SaveSave
BankerBanker DigitalDigital Telephone(GCSC*)
Telephone(GCSC*)
TransactTransact SaveSave
DigitalDigital Telephone (GCSC*)
Telephone (GCSC*)
QuantitativeIncome £300k+ and NAV £3mn+
QualitativeTime poor, active,
wealth creators
Client acquisition and relationship building3,500 clients
Client acquisition and funding56,000 savings + 8,500 SA clients
Mass affluent and SA Investec clients
Bank accounts Savings
Banking
UK
Structured property finance
Income producing real estate
Private capital
HNW investment banking
BankingOnshore and Offshore transactional banking, mortgages, personal
finance, FX
• To build an aspirational HNW private bank which facilitates wealth creation integrated with wealth management
• HNW active wealth creators
Our value proposition
Ambition
Clear target market
HNW• Client led (not product)• High touch, relationship based• Expertise and speed
Retail savings and SA clients• Product led• High tech, digital, self service• Innovative products
• SA Investec clients
• UK retail savers
3
*Global client service centre.
Shared platforms

Page 34
Allows us to deal directly with clients, avoiding restrictive regulations requiring the broader retail market to deal via an IFA
Size of opportunity*…
90,000 meet NAV,Earnings and
Qualitativecriteria
296,000 meetNAV criteria
178,000meet NAV +
Earnings criteria
Private Banking: Clearly defined target market
Target market
7-10% of target market
3 year Objective:
3
*Source: As per research from Scorpio, Oliver Wyman Ltd and Investec’s Private Banking marketing team.
Banking
UK
Quantitative criteria
Qualitative criteria
£3mn NAV+£300k earnings
• Actively creating wealth• Entrepreneurially minded • Time poor
Our proposition is aligned with a clearly defined target client base
Current target market client base: 3,500

Page 35
• High volume and low price
• Low flexibility
• Impersonal and product-led
• Time consuming and bureaucratic
• Primarily investment-led
• Low volume, high price
• Focused on wealth preservation
• High minimum AUM thresholds for clients
Traditional Retail Banks
For customers that need a homogenous product
Traditional Private Banks
For clients that need wealth preservation
• Primarily capital-led, with transactional banking and savings capability
• Flexible but rigorous lending criteria
• Not constrained by minimum client AUM
• Individual tailored service within a niche market seeking wealth creation
• Refreshingly human with high service level – ability to deal with complexity and execute quickly
A different kind of private bank
For clients that need a risk-partner to grow their wealth
Private Banking: Clear market opportunity 3 Banking
UK

Page 36
Successful client acquisitionSuccessful client acquisitionBanking loan bookBanking loan bookInvestment into our people* Investment into our people*
1.0 1.1 1.21.5 1.7
0.20.3
0.4
0.40.4
0
1
2
3
2015 2016 2017 2018 H1 2019Mortgages HNW and specialised lending
0
50
100
150
200
250
300
350
400
450
500
2015 2016 2017 2018 H1 2019
Private Banking: Fully invested for the futureNew Banking proposition – invested to achieve a scalable platform
3 Banking
UK
#
0
5
10
15
20
25
30
2015 2016 2017 2018 2019 estimate
£’mn
56,000
46,000
3,500
950
2014 2019
8,500
140
• Investment phase complete -c.£67mn will have been invested by Mar 2019:• People• Platforms• Marketing• Digital
Average mortgage risk weight of 37%£’bn
Ambition over 3 years: c.£3bn new mortgages @ £2mn average size = 1,500 mortgages (with c.1% NIM)
CAGR: 17%
*Represents headcount for total Private Banking business (i.e. Structured property finance, Private capital, Banking, Bank accounts and Savings).
Investment into new Banking
proposition

Page 37
Enhancing connectivity across the businessConnecting Specialist Banking and Wealth & Investment
Opportunity to seamlessly service the financial needs of our clients
Wealth & Investment CIB
We seek to establish greater connectivity by pursuing:• Cross referrals between the Private Bank and Wealth &
Investment for the HNW and family office client
• Cross referrals from the Corporate and Investment Bank to Wealth & Investment and Private Bank, with respect to directors and shareholders
• Shared brand and infrastructure costs
• Shared digital platform and client access, with potential for single client sign on
• Additional potential for shared operational services
Private Bank
Banking
UK
4
171 referrals, 44 converted with
£65mn of AUM
35 referrals, 21 converted with
£27mn drawn, £10mn pipeline
63 referrals, 23 converted with >£60mn of AUM,
and >£30mn pipeline
YTD 2019 referral statistics

Page 38
Case study: Supporting our clients through their lifecycle
Private Banking
Investment Banking
Corporate Banking
Wealth & Investment
Advised, floated company, then provided ongoing strategic and corporate broking advice
Management became personal clients of Wealth & Investment
Advised on FX hedging and provided small asset finance loans
New private banking client
Banking
UK
Leading consumer brand
and FTSE company
4
Investec has supported this client since 2013, through IPO in 2014 at a market cap of £154mn, to its current market cap of >£3bn

Page 39
Case study: Private bank and wealth collaboration across border
Assisted a HNW SA non-client open offshore bank accounts in the Channel Islands
Private Bank UK provided a UK primary residential mortgage
Private Bank UK provided client with a HNW private bank account
Private Bank UK referred client to Wealth & Investment SA, for an Investment portfolio
Private Bank UK referred client to Private Bank SA
Client transferred private bank account from a competitor to Investec Private Bank SA
All client funds transferred from a competitor to Investec Wealth & Investment (SA and UK)
Banking
UK
June 2015 August 2015 2017 2018
20182017July 2015
Customer
journey
4

Page 40
Improved revenue sustainability by growing our client franchises
*Where annuity income is net interest income and annuity fees.
Evolution of revenue mix
Information on this slide is based on the results of the ongoing business (excluding UK Specialist Bank legacy assets and businesses sold).
130
33235
70
178
140
49
113
139
58
0
100
200
300
400
500
600
700
800
2011 2018
£’mn
Investment and associate income Customer flow trading income
Other fees and other operating income Annuity fees and commissions
Net interest income
Annuity income* 2011: 31%
Annuity income* 2018: 56% • Increased level of annuity* income
• Improved revenue mix - increase in quality, quantum and sustainability of earnings:
- Strong lending franchises driving high level of net interest income – c.47% of revenue
- Strong advisory and corporate franchise generating sound level of fees
- Strong client treasury franchise resulting in recurring level of client flow
• Capital light banking activities = c.30% of revenue
• Net interest margin of 2.19% – increased in recentyears largely due to improved cost of funding
Banking
UK
713
531
5

Page 41
• More joined-up, client-centric approach driving increased client relevance and client acquisition; aided by our reorganised internal business structure
• Build on our growing success in credit distribution and third-party funds management
• Greater focus on cross-border client opportunities from enhanced connectivity with the SA Specialist Bank
• Shift from platform build to client growth, with focus on client acquisition and retention
• Use mortgages as primary client acquisition proposition to leverage relationships into our Structured Property Finance and Private Capital offerings
• Grow Private Capital proposition
• Further leverage our Banking platform to SA clients
Going forward: Growth strategies 6 Banking
UK
Wealth & Investment
Corporate and Investment Banking
Private Banking
Refer to Wealth & Investment growth initiatives further on in this document which include enhanced
connectivity with the UK Specialist Bank
Bringing full
proposition to all clients

Page 42
Going forward: Focused on cost discipline
77%75%
70%74%
76%71%
73%76% 77%
0%
20%
40%
60%
80%
100%
0
100
200
300
400
500
600
2011 2012 2013 2014 2015 2016 2017 2018 H1 2019
£’mn
Costs £'mn (LHS) Cost to income ratio (RHS)
Information on this slide is based on the results of the ongoing business, excluding UK Specialist Bank legacy assets and businesses sold.
Banking
UK
Leverage substantial investment in our Private Banking business which is fully
expensed
No longer incurring double premises costs
Restructured our expensive sub-debt
Leverage technology and existing capabilities to improve client experience
and reduce cost
6
Strategic review of business model and cost infrastructure to effect cost
efficiencies
Target*:< 65%
Target*:< 65%
>
*Which we aim to deliver on over the next three years.
Costs and cost to income ratio A clear path for achieving our targets
>
>
>
>

Page 43
Going forward: Capital generation and allocation 6
Capital strategy
• Specialist Bank internal capital generation sufficient to sustain growth and achieve target ROE
• Dividend from Wealth & Investment business passed through to shareholders
• Able to self-sustain c.7-8% RWA growth p.a.
• Supported by sound capital position
• Facilitated in the short term by SA dividend cover to Investec plc shareholders registered on the SA branch register
• Strict capital management and allocation to achieve medium-term targets
• Strategic shift away from Private Equity to client led principal investments
Banking
UK

Page 44
Going forward: Focused on ROE6
• ROE track record of ongoing business excluding new Banking proposition is within target range
Banking
UK
Target*:
10% to 13%
Target*:
10% to 13%
UK Specialist Bank ROE** trend
2.1%
5.5%
7.0%
3.2%
9.3%9.6%
11.4% 11.5%
8.5%
10.5%
12.7%13.5%
11.1%11.6%
2015 2016 2017 2018 H1 2019
ROE statutoryROE ongoing^ businessROE ongoing^ business ex new Banking proposition
Accelerated legacy impairments
**All ROEs are post tax^Ongoing business is excluding UK Specialist Bank legacy assets and businesses sold.
A clear path for achieving our targets
Enhanced cost discipline
Optimising capital allocation
Leveraging the investment in the Private Bank
RWA growth of c.7%-8% p.a.
Increasing capital light revenue
>
Growing our client base and revenue>
>
>
>
>
*Which we aim to deliver on over the next three years.

Page 45
Initiatives to enhance shareholder returns: UK Specialist BankWe are well aligned to the Group’s identified five key initiatives to improve returns for shareholders
More disciplined approach to capital
allocation, and effectively managing
our capital base
More disciplined approach to capital
allocation, and effectively managing
our capital base
Fully invested growth initiatives and anticipate an
improving jaws ratio
Fully invested growth initiatives and anticipate an
improving jaws ratio
Greater collaboration across the Corporate and Investment Bank,
Private Bank and Wealth & Investment
Greater collaboration across the Corporate and Investment Bank,
Private Bank and Wealth & Investment
Driving ahigh-tech and
high-touchoffering
Continuing to invest in our
technologyplatforms
Driving ahigh-tech and
high-touchoffering
Continuing to invest in our
technologyplatforms
1 3 4 5
Target marketclient acquisition
and deepening ourclient
relationships
Increasing capital light activities
Target marketclient acquisition
and deepening ourclient
relationships
Increasing capital light activities
2
Capital Discipline
CostManagement
Connectivity DigitalisationGrowth Initiatives
Banking
UK

Page 46
5 Performance
6 Summary and Conclusion
7 Appendix
4 Wealth & Investment business
3 SA Specialist Bank
2 UK Specialist Bank
1 Introduction
88
77
64
47
23
4
90
3 SA Specialist Bank 47

Page 47
0
50
100
150
200
250
2011 2012 2013 2014 2015 2016 2017 2018 H1 2019
SA Specialist Bank overview
Corporate and Institutional Banking Private Banking Investec for Business
Our offering
Our clients
Global markets and various specialist lending activities
Corporates (mid to large size), intermediaries,
institutions, government and SOEs
Lending, transactional banking, property finance, savings
HNW, professionals and emerging entrepreneurs
Smaller and mid-tier corporates
Import and trade finance, borrowing and cash flow lending, asset
finance
Banking
SA
Investment Banking and Principal Investments
Corporates, institutions, property partners
Advisory, debt, ECM, client led private equity, property development,
property fund management
Our growth story
CAGR: 11%R’bn Loan growth over time
*Before tax, goodwill, acquired intangibles, non-operating items and central costs but after adjusting for earnings attributable to other non-controlling interests.
c.4,000
56%
62%
Information on this slide is at 31 March 2018, unless otherwise specified.
Employees
% Loan book
% Operating profit*
contribution

Page 48
We have a solid franchise and positioning in the market
• Invested in our business, sustainably growing our client base and franchise
• Deepening our existing client relationships and client acquisition through the collaboration of product offerings
• We have a number of growth initiatives
• Our growth initiatives and strong franchise support our solid revenue base
• Strong technology and digital platforms underpin our high-tech and high-touch offering
• Continuous investment to maintain leading position (One Place, Investec Life, Transactional Banking)
• Maintaining sound capital ratios and low credit loss ratios through varying market conditions
• Enhancing our capital light revenue base
• Disciplined capital allocation
• We remain focused on improving ROE
Well positioned for future growth
1
2
3
4
5
We have a specialised niche offering to a select target market
Banking
SA
6
• Maintaining cost efficiency with low cost to income ratios

Page 49
SA Corporate and Institutional Banking overviewStrong franchise value and leading market position in our niche markets
• Tailored offering and deep relationships with our target markets
– large to mid-tier corporates and private equity funds
• Differentiated through deep sector expertise and international
reach
- Leveraged finance
- Supplier finance
- Power and infrastructure finance
- Fund finance
- Aviation finance
- Export and agency finance
• Award-winning specialist franchises by innovating alongside our
clients
• Well-established, award-winning franchises across:
• Trading (FICC, Equities, ECM and DCM)
• Investment products
• Treasury solutions and sales
• Credit investments
• Built sustainably through organic growth and diversification into
new markets
Global Markets Specialised Lending
Banking
SA
• To be a top tier corporate and institutional bank
Our value proposition
Ambition
Clear target market
• Diversified client-centric offering • Sustainable growth driven through collaboration between business units
• Corporates (mid to large size), intermediaries, government and SOEs
1

Page 50
Growth in our corporate client base and franchise1
Overall Number of clients
Large corporates (NAV>R3bn) c.150
Mid-tier corporates (NAV: R500mn – R3bn) c.200
Small to mid-tier corporates c.4,600
Corporate client positioning
Best Performance in SA 2016, 2017
Best Distributor in SA 2016, 2017
Best House Africa 2017
Deal of the Year 2017
2016-17Best Prime Services
Best Capital Introduction
Best Technology
2018
Africa Finance Deal of the Year
2016
c.4,950Specialist activities Number of
clients
Average transaction
sizeBook size
Fund Finance c.25 R180mn R5bn
Power andInfrastructure Finance c.20 R480mn R10bn
Aviation Finance c.18 R271mn R6bn
Retail Structured Products
c.9,000 investments R2mn FUM: R17bn
0
5
10
15
20
2011 2012 2013 2014 2015 2016 2017 2018 H1 2019
R’bn
Banking
SA
2016-17African Power Deal of the Year 2016
African Transport Deal of the Year 2017
2017Best African ECA
Finance Deal
17
Recognition Retail Structured Products FUM
Number of clients: R80bnLoan book:

Page 51
UK Private Bank
UK Private Bank
SA Private Banking overview
Business model
Offering
Channels
LendLend TransactTransact SaveSave
BankerBanker DigitalDigital Telephone(GCSC*)
Telephone(GCSC*)
Shared platformsWealth &
InvestmentInvestec
Life
Banking
SA
• To be a leading domestic and international Private Bank
• HNW individuals, emerging entrepreneurs, professionals
Ambition
Clear target market
Client acquisition and relationship buildingc.75,000 clients
Foun
datio
nN
iche
s
Structured property finance
Income producing real estate
Private capital
HNW investment banking
BankingOnshore and Offshore transactional banking, mortgages, personal
finance, FX
Our value proposition • Bank, borrow, save and invest in One Place
ProtectProtect InvestInvest
1
*Global client service centre.

Page 52
Growth in our private client base and franchise1
75,000
0
10,000
20,000
30,000
40,000
50,000
60,000
70,000
80,000
2014 2015 2016 2017 2018 2019
#Ranked #1 in Private Banking Survey 7th
Year in a row
2013-19
Best Private Bank and Wealth Manager in SA
2018
Number Private Bank clients
Of which are Wealth clients
Private clients c.75,000 clientsc.113,000 accounts c.9,000 clients
Property clients c.900
Private Capital clients c.200
Private client positioning
Banking
SA
Investec Private Bank wins People’s Choice award for the 5th time
CAGR: 6%
Growth in private banking clients
c.75,000Number of clients:
R180bnLoan book:
Recognition

Page 53
SA Investec for Business overviewBanking
SA
• Combining bespoke lending with Investec’s other transactional, advisory and investment offerings
• High-touch and high-tech tailored offering that affords simplicity to clients
Bespoke lending offerings are
packaged to align and optimise the working capital
cycle and to provide the headroom
needed for business growth
INVOICE
Bespoke lending offerings for working capital optimisation and business growth
Import and Trade Finance Funds the purchase of stock and services
on terms that closely align with the working capital cycle
Borrowing Base and Cash Flow Lending
Leverages client balance sheet (debtors, stock and other assets) to provide niche working capital solutions or longer term growth
funding
Asset FinanceNiche funding for the
purchase of the productive assets and equipment
• Develop an integrated niche offering to our target clients
• Smaller and mid-tier corporates
Ambition
Clear target market
Our value proposition
1

Page 54
Business model and offering
International access
Channels
AustraliaAustralia Hong Kong India SA UK
AdvisoryAdvisory Debt
Equity capital
markets
SA Investment Banking and Principal Investments overview
Relationships
Ass
ets
Capability
People
Ideas
Capital
Debt Equity
NetworkShared skill set
Independent teams
Investment Banking
ideas
Direct property development and
fund platform
Client led private equity
Investment Banking Origination
Investment Banking Origination CoverageCoverage Private BankPrivate Bank CIBCIB Wealth & InvestmentWealth & Investment
Banking
SA
• To be the leading Investment Bank with an international footprint
• Corporates
Ambition
Clear target market
Our value proposition
• To leverage our capabilities, relationships and capital to deliver holistic solutions to our clients
Investment Banking
• Using our collective skill set to optimise capital allocation in principal investments and generate a high IRR on these investments
• Focus on co-investment alongside clients to fund investment opportunities or leverage third party capital into funds that are relevant to our client base
Principal Investment activities
• Corporates and institutions, property partners
1

Page 55
We have a high-tech and high-touch specialised offering
High-tech | High-touch
Private Bankers and Wealth managers, Private Capital team, Property Finance team, Global CSC, digitalHow we engage
Client experience
Investec sees, treats, protects, advises and rewards each client as an individual. “It feels like it’s about me, my family and business, now and in the future.”
We solve their needs through compelling
segmented propositions
Local banking
International banking
Local investments
International investments
Structured property finance, local and
international
In partnership with like-minded individuals, we
turn entrepreneurial vision and aspiration into commercial reality
Technological and digital leadership are real differentiators for our clients……Our One Place offering is one such example
2
• Total logins for Private Bank SA grew to almost 17mn during 2018
• Current average is over 1.4mn logins p/m compared to 135k logins p/m in 2014
Banking
SA
-
2
4
6
8
10
12
14
2014 2015 2016 2017 2018
# mn
0.6 0.7 0.7 0.7
0.20.4
0.6 0.7
0.0
0.2
0.4
0.6
0.8
1.0
1.2
1.4
1.6
2014 2015 2016 2017 2018
# mn
Average monthly online logins Average monthly app logins
0.8
1.11.3
1.4
CAGR: 13%
Growth in online transactions Client engagement

Page 56
Deepening our client relationships and focused on our growth initiatives3 Banking
SA
*Investec Life: target market currently only to Private Bank clients.
Investec For Business
• Effectively leveraging the Group’s current client base
• Launch of digital transactional banking
• Transactional business banking solution: positioning ourselves as a specialist business bank
Corporate and Institutional
Banking
• Investec Specialist Investments business
• Investec Life*
• One Place for intermediaries: creating a digital product that is seamless
• Transactional business banking to reduce cost of funds
Private Banking
• Further expansion of our One Place offering and collaboration with Wealth & Investment
‒ Fiduciary offering
‒ My Investments
• Leverage our Young Professionals strategy
• Private Capital – partnering with start up Fintech opportunities
Investment Banking and
Principal Investments
• Focus on a client centric approach to equity investments
• Grow our property fund management business

Page 57
Solid growth in revenue with a high annuity income base
*Where annuity income is net interest income and annuity fees.
3,720
7,084781
3,300
951
854
303
423
1,271
1,808
0
2,000
4,000
6,000
8,000
10,000
12,000
14,000
16,000
2011 2018
R’mn
Investment and associate income Customer flow trading income
Other fees and other operating income Annuity fees and commissions
Net interest income
Annuity income* 2011: 64%
Annuity income* 2018: 77%
• CAGR in revenue since 2011 of c.10%
• Increased level of annuity* income
• Strong lending franchises driving high level of net interest income – c.53% of revenue
• Net interest margins stable at c.2%
• Strong advisory and corporate franchise generating sound level of fees
• Strong client treasury franchise resulting in recurring level of client flow
13,469
7,026
4 Banking
SA
Growth in revenue over time

Page 58
We are maintaining efficiency in our cost base
Going forward: aim to create positive jaws
Optimise our operational platforms
We have no capitalised costs
53% 54% 55%53%
50% 50%51% 51% 50%
0%
10%
20%
30%
40%
50%
60%
0
1,000
2,000
3,000
4,000
5,000
6,000
7,000
2011 2012 2013 2014 2015 2016 2017 2018 H1 2019
R’mn
Costs R'mn (LHS) Cost to income ratio (RHS)
Banking
SA
Invested in the business while maintaining the cost to income ratio
Target*:49% to
52%
Target*:49% to
52%
5
>
*Which we aim to deliver on over the next three years. Target set in Rands.
Costs and cost to income ratio^ Overview and objectives
>
>
>
^Calculation adjusts for the Group’s 26.57% interest held in the Investec Property Fund (IPF), by deducting the IPF minority interests from income.

Page 59
Optimise capital by focusing on client driven private equity activity
• Focus on co-investment alongside clients to fund investment opportunities or leverage third party capital into funds that are relevant to our client base
• Create flow for and partner with other bank divisions
• Part of the bank’s wider offering to provide a full service to clients across the entire capital structure
• Leverage fund activity more broadly across the business / create broader fund franchise
*Comprising listed and unlisted investments; warrants, profit shares and embedded derivatives; the Group’s 45% interest held in the IEP Group; the Group’s 26.57% interest held in the Investec Property Fund (IPF) and the Group’s 15.0% investment in the Investec Australian Property Fund (IAPF). ^Other equity and related loan exposures, not including investment activities arising from the franchise businesses.
6
SA investment portfolio* excluding investments in franchise businesses (H1 2019)
Book sizeR’bn
Ave capital allocated
R’bn
Post-taxROE
Investment held in IEP group 6.4 4.3 13.9%
Investment held in propertyinvestments 4.4 1.3 30.2%
Other principal investments^ 2.0 1.2 -44.7%
Total SA investment portfolio 12.8 6.7 6.9%
Banking
SA
Manage down our non core equity investments portfolio
We will manage down our investments whilst recognising our responsibilities as a shareholder
Will release material capital which offers optionality
Reduce volatility in ROE
What are we seeking to do

Page 60
Capital generation and allocationBanking
SA
• Supported by sound capital position and strong capital generation
• Able to self-sustain 8%-10% RWA growth p.a.
• Capital resources are allocated based on our internal capital generation and maintenance targets
• We will manage down our non core equity investments portfolio, releasing material capital and offering optionality
Capital strategy
6

Page 61
SA Specialist Bank ROE trend A clear path for achieving our targets
Focused on ROEBanking
SA
Target*:
14% to 16%
Target*:
14% to 16%
10.7%
9.6% 10.0%
12.5%
15.2% 15.1%
12.7% 12.8% 12.4%
0%
2%
4%
6%
8%
10%
12%
14%
16%
18%
20%
2011 2012 2013 2014 2015 2016 2017 2018 H1 2019
^Comprising the Group’s 45% interest held in the IEP Group; the Group’s 26.57% interest held in the Investec Property Fund (IPF) and the Group’s 15.0% investment in the Investec Australian Property Fund (IAPF); and other equity and related loan exposures, not including investment activities arising from the franchise businesses.
6
Growing our client base and franchise>
*Which we aim to deliver on over the next three years. Target set in Rands.
• Underlying franchise businesses have an ROE in excess of 14%
• ROE drag from SA investment portfolio^, where the ROE is less than 7%
Continued cost discipline>
Investment in new growth initiatives>
Optimising capital allocation>
Managing down our non core equity investments portfolio>

Page 62
Initiatives to enhance shareholder returns: SA Specialist BankWe are well aligned to the Group’s identified five key initiatives to improve returns for shareholders
Management ofour capital allocation to
optimise returns
Management ofour capital allocation to
optimise returns
Maintain adisciplined clientcentric approach
to ourinvestments
whilst investing inareas of
specialisation
Maintain adisciplined clientcentric approach
to ourinvestments
whilst investing inareas of
specialisation
Ensuring we remain at the frontier of technological
innovation, and develop new integrated initiatives beyond One
Place
Ensuring we remain at the frontier of technological
innovation, and develop new integrated initiatives beyond One
Place
Continue to investin our digital and
technologyplatforms in order
to remaincompetitive
Continue to investin our digital and
technologyplatforms in order
to remaincompetitive
1 3 4 5
Build newsources of
revenue acrossour client
base e.g. Investec Life, Investec for Business
Build newsources of
revenue acrossour client
base e.g. Investec Life, Investec for Business
2
Capital Discipline
CostManagement
Connectivity DigitalisationGrowth initiatives
Banking
SA

Page 63
5 Performance
6 Summary and Conclusion
7 Appendix
4 Wealth & Investment business
3 SA Specialist Bank
2 UK Specialist Bank
1 Introduction
88
77
64
47
23
4
90
4 Wealth & Investment business 64

Page 64
Investec Wealth & Investment (IW&I) overviewIW&I
SA & UK
Our offering
• Wealth management
• Discretionary investment management
• Stockbroking
Our clients
• Private clients
• Charities
• Trusts
Our distribution
channels
• Direct• Intermediaries• Investec Private Bank• International• Digital
FUM development
International presence
0
10
20
30
40
50
60
2011 2012 2013 2014 2015 2016 2017 2018 H1 2019Discretionary Non-Discretionary
FUM (£’bn)
UK and OtherA leading UK wealth
manager with £39.4bn in FUM
SAA leading private wealth
manager in SA with £17.3bn in FUM
International recognition
UK and Other
IW&I manages c.£57bn of FUM globally
£29bn
£57bn
SA

Page 65
What differentiates IW&I?
Recognised international brand and balance sheet strength attracts investment managers and supports client acquisition
Size allows us to be agile but with the scale and strength to compete successfully
Well-positioned for evolving domestic market trends (e.g. financial planning, digital)
Single consistent global investment process, delivering tailor-made and innovative solutions across jurisdictions
Domestically relevant with international offering, including offshore capabilities and providing access to clients to leading global financial centre in London
Relationship-driven approach to serving private clients in partnership with Investec Private Bank
Experienced leadership team with proven ability to execute M&A successfully, ensuring IW&I is well placed for expected industry consolidation
IW&I
SA & UK

Page 66
0
10
20
30
40
50
60
2011 2012 2013 2014 2015 2016 2017 2018 H1 2019
UK and Other SA
CAGR: 9%
UK & Other: Rensburg Sheppards
becomes IW&I
UK & Other: Williams de
Broe becomes part of IW&I
FUM (£’bn)
£1.7bn £(0.2)bn* £0.7bn £1.4bn £2.7bn £2.1bn £1.2bn £2.0bn £0.7bn
Our growth story
Net Flows:
*Largely related to one client who moved their portfolio to another institution to serve as collateral in a transaction they were concluding. Excludes sale of unit trust business in the UK.
IW&I has a strong track record of consistent growth, with over 40% of the increase in FUM since 2011 driven by net inflows
IW&I
SA & UK

Page 67
Generates ideas
Domestic-focused investment committees
Global research team – 32 dedicated FTEs
A single global investment process
Exceptional global research capabilities Access to broad investment universe
• Global reach with truly international perspective
• Sole focus on supporting IW&I’s investment managers with no external clients
• Well-resourced with 32 individuals dedicated to investment research - independent team with no dependencies or cross-over with Investec Asset Management
• Able to offer global access to distinctive investment opportunities for clients
- Includes access to alternative assets through collectives
• Consistently delivering product innovation, leveraging the breadth of direct access (e.g. Global Leaders Portfolio)
Key characteristics
External information
Meetings with fund
managers
Research from major investment
houses
Quantitative and technical
analysis
Equities Fixed income Collectives Structured products
Asset allocation Stock selection Collective funds selection
Investment managers
Clients
Alternatives
Property Cash
Equities
CollectivesBondsOpen tool box to create genuinely
bespoke portfolios for clients
Monitoring
Research inputs
Define client suitability
Bespoke portfolio construction within set risk parameters
IW&I
SA & UK

Page 68
Total FUM £39.4bn^
% UK Discretionary 84%
% UK Direct 84%
Target Client > £250k
# of UK Clients c.60,000
# of UK Offices 15
# of UK IMs 378
# of UK FPs 31
84%
16%
Discretionary
Non-discretionary
FUM by Mandate**:
£39.4bn
Snapshot of IW&I UK & Other
Discretionary(Target > 90% of FUM within three years**)
Financial Planning
Private Bank
Click & Invest
• Recruit high quality investment managers
• Further develop proposition to serve growing IFA channel
• Continue to expand financial planning capability
• Develop ways to deliver this advice as a central component of our core offering
• Focus on collaborating further with the UK Private Bank
• Attract new clients through Click & Invest digital proposition
Well placed to benefit from evolving UK market
• Supportive demographic factors with continued growth in household wealth
• “Advice gap” post RDR and Pension Freedoms underpinning strong demand for financial advice and long-term savings solutions
• Competitive market remains relatively fragmented, providing opportunities for potential consolidation
• Trend towards integrating technology-led solutions
*Information as at 30 September 2018. **Split / target based on UK business only. ^Comprises UK, Guernsey, Switzerland, Ireland and Hong Kong. UK comprises c.90% of total FUM. Where IMs is investment managers and FPs is financial planners.
A leading UK private client manager, offering bespoke discretionary investment management services to a higher-end mass affluent and increasing high-net-worth client base
Future growth driversKey facts*
IW&I
SA & UK

Page 69
Total FUM R320bn
% Discretionary and annuity 40%
% of which is offshore 51%
% Direct 91%
Target Client > R5mn
# of Clients c.27,000
# of Offices 10
# of IMs 100
40%
60%
Discretionary and annuityNon-discretionary
Snapshot of IW&I SA
Well positioned to capitalise on market changes
FUM by Mandate: R320bn
Discretionary/annuity
Offshore
Private Bank
Fiduciary
• Increase collaboration with Private Bank which has a very similar target client base
• Developing single operating platform for SA and Swiss businesses to combine offshore proposition
A leading private client manager in SA, providing domestic and offshore wealth management to an international-minded client base
Future growth driversKey facts*
• Increasing demand for “financial emigration” to offshore jurisdictions (e.g. Switzerland and UK markets)
• Growing appetite for non-domestic investment opportunities (e.g. global equities)
• Increasing demand for advisory mandates – significant shift in market landscape from stockbroking to discretionary fund management
• HNW investors focused on further diversifying portfolios, particularly in alternatives
• We continue to enhance all levels of access for our clients, augmenting our digital access and reporting, while retaining the increasingly important human touch
• Our wealth managers, working with our fiduciary and tax teams, are playing key roles in assisting clients with retirement and estate planning
IW&I
SA & UK
*Information as at 30 September 2018.

Page 70
WealthPrivate Bank
Investment Bank
Enhancing connectivity across the Group
One Place proposition in SA
Illustrative client journey
IW&I has a collaborative approach with the Specialist Bank to serving private clients and is widely recognised as one of the top international private bank and wealth managers
Benefits for clients
• Access to IW&I’s leading wealth management services, backed by the security of Investec’s balance sheet
• Improved client experience with more integrated approach to wealth management / private banking
• Market-leading digital proposition, with access to full suite of banking and investment services (e.g. One Place)
• Access to lending products (e.g. Lombard lending for private clients)
Benefits for
Investec
• Provides significant competitive advantagein client acquisition
• Allows IW&I and Investec Private Bank to remain focused on core competencies
• More embedded with clients if providing both wealth management and private banking, benefitting client retention
• Beneficial in attracting and recruiting top investment managers / financial planners from competitors (particularly global banks)
Local banking
International banking
Local investments
International investments
• One Place provides clients seamless, integrated access to banking and investment services, both locally and internationally
• Evidences how IW&I successfully uses technology and data to enhance the client experience, while still offering exceptional personal service in private banking and wealth management
Corporate Bank
Work with company from
early stage, providing
bridge / term / acquisition financing
Advisory role on eventual
liquidity event (e.g. IPO)
Management introduced to Private Bank
early in Investec
relationship
IW&I manages proceeds
generated on liquidity event
IW&I
SA & UK

Page 71
2.65.8
11.1
18.3
26.8
35.9
2017 2018 2019 2020 2021 2022
Digital case study: Investment in Click & Invest
Click & Invest proposition
• “Robo-advice” – automated simplified advice service for UK clients who fall below the threshold for core discretionary services
• Target client: Minimum of £2,500 of investable assets
• Product offering: Five actively-managed, risk-rated portfolios across a range of wrappers
• Leverages IW&I’s established global investment process
• Exceptional service-led proposition, with 24/7/365 customer service complementing the automated advice process
Presents significant market opportunity
• “Robo-advice” market already well established in the US and UK
UK market forecast to grow to c.£36bn of FUM by 20221
• Growth driven by demand for low-cost, digital savings and investments solution
• Institutions actively investing in robo-advice start-ups
Click & Invest’s strategy for growth
Why Click & Invest is important for Investec
Award-winning content
Service-led proposition
Active investment
management
Continued organic growth, leveraging Investec’s strong and trusted brand
Next step is to launch self-invested personal pension (SIPP) product on platform
Seek to develop strategic partnerships
Develop IFA proposition
• Diversifies IW&I’s distribution capabilities, recognising demand for low-cost digital savings and investment solutions
• Natural feeder into core discretionary business as Click & Invest clients accumulate wealth
• Potential to service smaller accounts better and more efficiently, enhancing retention of existing core clients
• Leverage Click & Invest technology to support digitalisation strategy in wider Investec Group
• Potential to extend proposition as a solution for IFAs and third party wealth managers
1. Statista, July 2018..
Forecast Robo-Advice Market Growth (FUM, £’bn)1
IW&I
SA & UK

Page 72
25 2334
4657 63 65 69
33
15 16
17
20
2223
2829
1340 39
51
66
7986
9398
46
0%
5%
10%
15%
20%
25%
30%
35%
40%
-
20
40
60
80
100
120
2011 2012 2013 2014 2015 2016 2017 2018 H1 2019
£’mn
South Africa UK and Other
SA Operating Profit Margin UK and Other Operating Profit Margin
IW&I key financials
Operating profit before taxOperating income
• Track record of increasing AUM, driving consistent operating income growth
- 87% of operating income in H1 2019 was annuity income
- Operating income linked to market movements
• Income margin in the UK & Other has remained relatively constant in recent years at 84bps for H1 2019
- Reflects increase in UK discretionary FUM, which generates higher fee margins
• Income margin in SA has increased, reflecting the growth in the discretionary business
- Reached 48bps for H1 2019
• Consistent profit growth with high cash conversion
• UK & Other operating profit margin decrease in recent years reflects investment in:
- Headcount to support investment in technology development (both the core business and Click & Invest)
- New business growth with recruitment of experienced investment managers and financial planners
- Headcount and systems to ensure compliance with recent regulatory changes (e.g. MiFID II, GDPR etc.)
• SA operating margin has remained relatively stable
102142
195229 251 257 277
314
160
54
54
54
5962 68
84
91
43156
196
249
288313 325
361
405
203
-
50
100
150
200
250
300
350
400
450
2011 2012 2013 2014 2015 2016 2017 2018 H1 2019
£’mn
UK and Other South Africa
Operating cost base of £306mn comprises £223mn of staff costs
and £83mn of non-staff costs
IW&I
SA & UK

Page 73
Investment whilst maintaining cost discipline
• Recruitment: We continue to invest in hiring experienced investment managers and financial planners to drive client acquisition
• Digitalisation: Further development of client platforms (e.g. One Place and Click & Invest)
- The development of Click & Invest has driven innovative change across other areas of the business (e.g. online valuations)
• Scalability: Focused approach to investment in technology to drive growth (e.g. new operating platform being implemented across SA and Switzerland)
• Consolidation: We will selectively consider acquisition opportunities (including investment teams) where additive to our existing capabilities
• Experienced management team across the UK and SA that will act accordingly depending on market conditions
- Range of management actions available to mitigate impact of market volatility
• Leverage existing operating platform to realise scale benefits from organic and inorganic growth
• Disciplined approach to capital spend and ongoing maintenance costs
• Seek to leverage lower cost SA operational capacity where possible (e.g. customer service centre)
We will continue to invest in our franchise… …while maintaining our cost discipline
We will continue to invest in building a scalable platform for the benefit of all our stakeholders
IW&I
SA & UK
UK & Other cost to income target*
73% - 77%
*Which we aim to deliver on over the next three years. SA target set in Rands.
SA cost to income target*< 70%

Page 74
IW&I’s strategic focus areas
Increase collaboration with wider Investec Group
Increase collaboration with wider Investec Group
1
Expand financial planning (UK) and fiduciary capabilities (SA)Expand financial planning (UK) and fiduciary capabilities (SA)
Focus on investing and developing digital channel
Focus on investing and developing digital channel
Extend breadth of global investment offering, particularly in
alternative asset classes
Extend breadth of global investment offering, particularly in
alternative asset classes
Consolidate internal collective fund platforms (e.g. World Axis,
Fund of Funds) and market externally
Consolidate internal collective fund platforms (e.g. World Axis,
Fund of Funds) and market externally
2
3
4
5
Continue to build a scalable operating platform to support
future growth and margin expansion in the medium-term
Continue to build a scalable operating platform to support
future growth and margin expansion in the medium-term
6
IW&I
SA & UK

Page 75
Initiatives to enhance shareholder returns: Wealth & InvestmentWe are well aligned to the Group’s identified five key initiatives to improve returns for shareholders
Capital light business generating attractive
RoEs
Capital light business generating attractive
RoEs
We will continue to invest in building a scalable platform,
whilst maintaining a disciplined approach
to costs
We will continue to invest in building a scalable platform,
whilst maintaining a disciplined approach
to costs
Focus on increasing our collaboration with the Private
Bank, both in the UK and SA
Focus on increasing our collaboration with the Private
Bank, both in the UK and SA
We will invest in further developing
our digital platforms to enhance our client
proposition
We will invest in further developing
our digital platforms to enhance our client
proposition
1 3 4 5
Clear set of strategic initiatives designed to deliver revenue
growth
Clear set of strategic initiatives designed to deliver revenue
growth
2
Capital Discipline
CostManagement
Connectivity DigitalisationGrowth Initiatives

Page 76
5 Performance
6 Summary and Conclusion
7 Appendix
4 Wealth & Investment business
3 SA Specialist Bank
2 UK Specialist Bank
1 Introduction
88
77
64
47
23
4
90
5 Performance 77

Page 77
Summary of key financials
Net core loans and advances
0
5
10
15
20
25
30
35
2014 2015 2016 2017 2018 H1 2019
UK and Other Southern Africa
Information on this slide is based on the results of the ongoing business (excluding UK Specialist Bank legacy assets and businesses sold) and excluding IAM, unless otherwise specified.
0
10
20
30
2014 2015 2016 2017 2018 H1 2019
UK and Other Southern Africa
0
10
20
30
40
50
60
70
2014 2015 2016 2017 2018 H1 2019
UK and Other Southern Africa
£’bn
0
2
4
6
8
10
12
14
2014 2015 2016 2017 2018 H1 2019
UK and Other Southern Africa
Strong growth in key earnings drivers… …supported by robust balance sheet
FUM
£’bn
Customer deposits
Cash and near cash balances
£’bn
£’bn
• We have strong momentum across our businesses, underpinned by our high-quality client franchises
• Net core loans and advances have grown from £14.3bn in 2014 to £24.2bn in H1 2019, a CAGR of 12%
• FUM has increased from £41.9bn in 2014 to £57.3bn in H1 2019, a CAGR of 7%
• Robust balance sheet, with significant portion of cash and near cash balances

Page 78
Summary of key financials (cont.)
0
200
400
600
800
1,000
1,200
1,400
1,600
1,800
2,000
2014 2015 2016 2017 2018 H1 2019
UK and Other Southern Africa
Information on this slide is based on the results of the ongoing business (excluding UK Specialist Bank legacy assets and businesses sold) and excluding IAM, unless otherwise specified.
55%
57%
59%
61%
63%
65%
67%
69%
71%
0
200
400
600
800
1,000
1,200
1,400
2014 2015 2016 2017 2018 H1 2019
£’mn
UK and Other costs (LHS) Southern Africa costs (LHS) Cost to income ratio^ (RHS)
£’mn
Resulting in a growing
revenue base
Resulting in a growing
revenue base
Our cost to income reflects
investment
Our cost to income reflects
investment
We have delivered strong growth in our revenue base, with over 50% generated in the UK
We have made strategic investments across our
core businesses to build a highly scalable platform capable of supporting our
growth ambitions
^Calculation adjusts for the Group’s 26.57% interest held in the Investec Property Fund (IPF), by deducting the IPF minority interests from income.

Page 79
Impairments have reduced in recent years
Core loans and credit loss ratio • Asset quality has improved as the legacy portfolio has been managed down (less than 0.8% of global loan book)
• Ongoing portfolio continues to have low levels of impairments and defaults
- Credit loss charge of 0.34% in H1 2019
- Stage 3 loans net of ECL as a percentage of net core loans of 1.7% in H1 2019
Core loan analysis (H1 2019)
0%
1%
2%
3%
4%
5%
0
5
10
15
20
25
30
2011 2012 2013 2014 2015 2016 2017 2018 H1 2019
£’bn
Core loans(LHS)Credit loss ratio (RHS)Stage 3 loans before collateral as a % of net core loans (RHS)
16%
39%
45%
Lending collateralised by propertyHNW and other private client lendingCorporate and other
£24.2bn
Largest sub-categories
Commercial investment property
11%
HNW and private client mortgages
22%
HNW and specialisedlending
16%
General corporate 13%
Acquisition finance 10%
Small ticket asset finance
7%
Fund finance 6%
Information on this slide is based on the results of the ongoing business (excluding UK Specialist Bank legacy assets and businesses sold) and excluding IAM, unless otherwise specified.
04080
120160200240280320360400
2011 2012 2013 2014 2015 2016 2017 2018 H1 2019
£’mn
UK and Other South Africa Legacy and sales*
* Refers to the remaining UK legacy business and Group assets that were sold in the 2015 financial year.
Impairments

Page 80
We have a balanced portfolio of businesses with a solid capital light revenue base
Stable geographic balance
With significant capital light businesses
And growing recurring revenues
Operating income Operating income Operating income
Information on this slide is based on the results of the ongoing business (excluding UK Specialist Bank legacy assets and businesses sold) and excluding IAM, unless otherwise specified.
54%
46%
UK and Other Southern Africa
57%
43%
56%
44%
Balance sheet driven Capital light
58%
42%
^Where annuity income is net interest income and annuity fees.
71%
29%
Annuity ^ income Other income
61%
39%2014
2018

Page 81
43%
29%
19%
5%4%
UK Bank SA Bank UK IW&I
SA IW&I Group costs
We are focused on cost discipline
Breakdown of costs (2018)
Analysis of Group Costs (2018)
• We are focused on cost discipline
- Targeting a Group cost to income ratio of less than 63% in the medium-term
• We have set clear divisional cost to income targets:
- UK Bank: < 65%
- UK Wealth: 73% -77%
- SA Bank: 49% - 52%
- SA Wealth: < 70%
• We have already taken action to reduce Group Costs with opportunities to do more in the medium-term
£1,271mn
UK SA
48%
12%1%
1%
39%
Personnel BusinessPremises Fixed assetsMarketing and CSI
46%
8%1%
45%
£16mn£34mn
By business unit
51%
22%
11%
4%5%
5% 2%
Fixed staff Variable staff BusinessPremises Equipment MarketingDepreciation
By type
£1,271mn

Page 82
SA Specialist Bank1SA Specialist Bank1
Contribution to Group ROE by business
UK Specialist Bank Investec Group
H1 2019 ROE, in £’s unless otherwise stated
11.6%
9.3%
UK Bank ex newbanking
proposition
New bankingproposition
TotalUK Bank
26.4%
Wealth &Investment
13.0%
9.1%
Investec Ltd Investec plc
Information on this slide is based on the results of the ongoing business (excluding UK Specialist Bank legacy assets and businesses sold) and excluding IAM, unless otherwise specified; 1. Shown on Rand currency basis; 2. Does not include equity investments residing in our franchise client businesses; 3. Using a normalised tax rate of 18%; 4. Excludes goodwill associated with Rensburg Sheppards acquisition. Including goodwill on Rensburg Sheppards acquisition, Wealth & Investment generated an ROE of 16.0% in H1 2019.
n.m.
82% 18% 100% 96% 4% 100%
SA Bank Capital allocation (Sep-18)£1,965mn
UK Bank Capital allocation (Sep-18)£1,413mn
UK Specialist BankUK Specialist Bank IWI SA and UK
IWI SA and UK Group CostsGroup Costs Investec GroupInvestec Group
4 Group: 11.0%
1
14.0%
6.9%
12.4%
SA Bank exInvestment
Portfolio
InvestmentPortfolio
TotalSA Bank2
-47.8%
3

Page 83
Simplifying and refocusing the Group to improve ROE in the medium-termA number of our specialist businesses are already operating at attractive ROEs, however, we recognise that we need to address a number of areas to improve ROE
UK Private Bank
UK Private Bank
• The business has undergone a period of investment to build out the platform which has impacted returns
- The legacy portfolio was also a drag on the Private Bank historically
• Strategy has now shifted from platform build to client growth and we are already seeing good traction
Optimise Capital
Allocation in SA
Optimise Capital
Allocation in SA
• We are focused on optimising the capital allocation in our core businesses
• We are buying back shares from the market to meet long term share awards and variable remuneration in the form of shares
Cost Management
Cost Management
• More disciplined approach to cost management, particularly within our central functions
• We have also set clear targets within our business units, and there will be much greater accountability to ensure we achieve these
Investment Portfolio* in
SA
Investment Portfolio* in
SA
• We are focused on managing down our non-core equity investments portfolio
• Made up of attractive assets, however from an income perspective these assets derive revenue which is very lumpy in nature
• Releases material capital which can be re-deployed in our higher ROE businesses or returned to shareholders
*Comprising the Group’s 45% interest held in the IEP Group; the Group’s 26.57% interest held in the Investec Property Fund (IPF) and the Group’s 15.0% investment in the Investec Australian Property Fund (IAPF); and other equity and related loan exposures, not including investment activities arising from the franchise businesses.

Page 84
Diversified funding strategy
Maintaining a base of high quality liquid assets 1
Diversifying funding sources to enhance net interest margin2
Limited concentration risk3
Low reliance on interbank funding4
Maintaining a stable retail deposit franchise5
Conservative and prudent funding strategy Funding primarily consists of customer deposits
Fully self-funded: healthy loan to deposit ratio
UK and Other SA
Global – March 2018. Total funding £38.4bn
57%62%
67%74%
81% 80%
2014 2015 2016 2017 2018 H12019
73% 79% 75% 75% 77% 76%
2014 2015 2016 2017 2018 H12019
81%
8%
7%1% 4%
Customer deposits
Interbank deposits
Debt securities in issue
Liabilities arising on securitisation ofassets
Subordinated liabilities

Page 85
Underlying capital generation supports future growth and dividends
• There is positive capital generation across all our core businesses, with all businesses self-sufficient
• UK Bank has sufficient capital to grow the Private Bank to scale, while also supporting c.7%-8% growth in RWA p.a.
• Dividends from the Wealth & Investment business passed straight through to shareholders
• The SA Bank has a long history of strong capital generation
Generate sufficient capital, post dividends to support c.8%-10% growth in RWA p.a.
Will release material capital through managing down our non-core equity investments portfolio in SA
SA has covered the dividend for those Investec plc shareholders on the SA branch register
Target Group RoE*:
12%-16%
Target Group RoE*:
12%-16%
Supports RWA Growth:
c.8%-10%
Supports RWA Growth:
c.8%-10%
Supports Dividend Payout:
30%-50%
Supports Dividend Payout:
30%-50%
*Which we aim to deliver on over the next three years.

Page 86
Clear set of financial targets underpins our objectivesWhich we aim to deliver on over the next three years
Metric: FY 2018 H1 2019 Medium-term target
Commentary**
Group ROE 9.8% 11.0% 12% to 16%*
UK Combined Target: 11% to 15%*
SA Combined Target: 15% to 18%*
Cost to Income Ratio^^ 68.2% 68.5% < 63%
Investec Limited CET1 10.2%^ 10.3%^ > 10%
Investec plc CET1 11.0%^ 10.4%^ > 10%
Dividend Payout Ratio n.a. n.a. 30% to 50%
UK Bank Target: 10% to 13%
UK Bank Target: < 65%UK Wealth Target: 73% to 77%
SA Bank Target: 14% to 16%
SA Bank Target^^: 49% to 52%SA Wealth Target: < 70%
*Target takes into consideration Group Central Costs. **All SA targets are set in Rands. ^As reported including IAM.
Will also benefit from the implementation of FIRB which is not reflected in ratios presented
Capital adequacy target range of between 14% and 17% on a consolidated basis for Investec plc and Investec Limited
^^Calculation adjusts for the Group’s 26.57% interest held in the Investec Property Fund (IPF), by deducting the IPF minority interests from income.

Page 87
5 Performance
6 Summary and Conclusion
7 Appendix
4 Wealth & Investment business
3 SA Specialist Bank
2 UK Specialist Bank
1 Introduction
88
77
64
47
23
4
90
886 Summary and Conclusion

Page 88
Objectives for today’s presentation
Highlight initiatives to
enhance returns
Highlight initiatives to
enhance returns
• More disciplined approach to capital allocation
• Clear set of growth and cost initiatives
• Drive greater connectivity and continue to invest in digital capabilities
Focus on Investec’s strategic
positioning
Focus on Investec’s strategic
positioning
• International specialist bank with leading market positions in select niches
• One of the leading private client wealth managers in the UK and SA
• Ability to leverage cross-border platforms – domestically relevant and international networked
Demonstrate sustainable
organic capital generation
Demonstrate sustainable
organic capital generation
• All businesses are self-sufficient
• Existing capital generation supports growth and dividends
• Maintain appropriate capital adequacy / buffer across Investec plc and Investec Limited
Recap on demerger rationale
Recap on demerger rationale
• Simplification and greater focus to enhance the long-term prospects of both businesses
• Opportunity to build on linkages between the Specialist Bank and Wealth & Investment businesses

Page 89
5 Performance
6 Summary and Conclusion
7 Appendix
4 Wealth & Investment business
3 SA Specialist Bank
2 UK Specialist Bank
1 Introduction
88
77
64
47
23
4
907 Appendix 90

Page 90
Our commitment to sustainabilityAt Investec, sustainability is about building resilient profitable businesses that are focused on growing and preserving stakeholders long-term wealth, whilst contributing in a responsible way to the health of our economy, our people, our communities and the environment for a prosperous, sustainable future for all.
• Voted third most attractive employer in SA in the 2018 Universum awards in the business/commerce sector
• Ranked 27th in the world and 4th in the UK for progress in gender equality and reporting by Equileap in 2018
• Investec Group was awarded a B rating for the Carbon Disclosure Project (CDP)
• Finalist in the 2018 Thomson Reuters Southern Africa Excellence Awards in the Most Impactful Business: Doing Good and Doing Well Award category
• Winner of the Business of the Year Award by Business Charity Awards 2017 (for Beyond Business programme) in the UK
• Winner of the National CSR Awards in the individual Community (Legacy) Project Award category (for Beyond Business)
• Winner of the Community Partners award in the Lord Mayor’s Dragon Awards (for Beyond Business)
People
Planet
Profit(Prosperity)
We integrate social, ethical and environmental considerations into day-to-day operations and our sustainability approach is based on the integration of people, planet and profit
Recognition• We depend on the experience and proficiency of our people to perform and deliver superior client services
• We use our specialist financial skills and expertise to provide efficient solutions for clients
• We leverage key stakeholder relationships to enhance our impact on society and the macro-economy
• We play a critical role in funding a stable and sustainable economy that is cognisant of the world’s limited natural resources
• We support the transition to a low-carbon economy and believe we can make a meaningful impact in addressing climate change
• We consider any meaningful activity that either reduces the negative impact on, or prolongs the life of, our planet
• We create sustained long-term wealth by organically growing our core businesses and maintaining a balanced and resilient business model
• We aim to improve returns and operational efficiency while maintaining a sound capital base and strong liquidity
• We are entrepreneurial and focus on creating value for shareholders
We recognise the role that the private sector can play in advancing the Sustainable Development Goals to build a more resilient and inclusive world. Investec has committed to participate and collaborate with clients and stakeholders to support delivery of the goals.

Page 91
Our environmental, social and governance (ESG) performance
UK Banking peer groupCDP (Carbon disclosure project)
Goldman Sachs Lloyds Banking groupBarclays plc Investec plcClose Brothers Macquarie
A
A-
B
B-
C
C-
D
D-
E
E-
F
BA-
C
A A
C
FirstRand Nedbank Investec Limited Standard Bank ABSA
SA Banking peer group
A
A-
B
B-
C
C-
D
D-
E
E-
F
A-B
B-C
CDP (Carbon disclosure project)
Investec plc ranked in the Dow Jones Sustainability Investment (DJSI) Index as one of 15 industry leaders on the DJSI World and one of nine in the DJSI Europe indices
Investec Limited ranked in Dow Jones Sustainability Investment (DJSI) Index as one of four industry leaders on the DJSI Emerging Markets Index
Included in the FTSE4Good Index
Constituent of the ECPI Index
Constituent of the FTSE/JSE Responsible Investment Index Series
Rated as AAA on the MSCI Global Sustainability Index Series
Member of the STOXX Global ESG Leaders Indices
Carbon footprint
Carbon footprint
-
50,000
100,000
150,000
200,000
250,000
300,000
350,000
Barclaysplc
LloydsBankinggroup
GoldmanSachs
Maquarie Investecplc
CloseBrothers
tCO2
* Excludes scope 3
*
A-
Included in the following sustainability indices:
-
50,000
100,000
150,000
200,000
250,000
300,000
StandardBank
ABSA FirstRand Nedbank InvestecLimited
tCO2

Page 92
Driving ESG impact
Power and infrastructure finance
Committed to supporting the transition to a clean and energy-efficient global economy
• Participated in £1.2bn of renewable energy projects• Clean energy makes up 88% of our total energy lending portfolio• Investec and UK Climate Investments committed R1bn to a dedicated
renewable energy investment (Revego Africa Energy)• Eight Investec funded projects have an installed capacity of approximately 1
450MW of clean energy• £200mn funding arranged, acting as joint arranger and underwriter for the
acquisition of six UK operational photovoltaic plants
Exploring alternate renewable energy sources and energy efficiency opportunities
• Implementation of Solar rooftops in commercial properties providing approximately ¼ of their monthly energy consumption
Investec Property Fund
Supporting our clients and stakeholders in attaining their social and environmental aspirations
• 50% of charitable investments go to education initiatives• Creating opportunities for clients to invest in funds that grow qualifying
privately-owned SMMEs
Wealth & Investment and Private Client activities
Providing equity / capital investment for innovation in sustainable water supply and electric vehicles
Corporate
Examples of how we are deploying our balance sheet to maximise social and environmental impact
• Investec has taken an £8mn equity stake in UK based company that uses innovation to reduce water consumption from cistern flushing by up to 84%
• Provided capital investment to a London-based company specialising in electric vehicle rapid charging, which will allow 1500 rapid chargers across the UK, improving pollution in the city of London

Page 93
Embedding ESG into daily operations
Lending policy
Investing policy
ESG Guidelines
Gender equality
Human rights
Our ESG Lending policy requires an evaluation of lending exposures to manage potential adverse impacts to the environment and to human rights
Our ESG Investing policy includes consideration of our responsibility in managing potential adverse impacts to the environment and to human rights
We have established ESG guidelines for our lending and investing businesses based on the IFC definitions of high and medium risk industries
Economic growth and decent jobs
Participant - 10 principles United Nations Global Compact Support the international agenda to abolish human trafficking, slavery, forced and child labour including the legislated UK Modern Slavery Act 2015
Signatory - 30% Club in both SA and the UK InvestecSignatory - HM Treasury Women in Finance Charter (Investec Bank plc and Investec Wealth & Investment UK )
One of the first signatories to the Youth Employment Service (YES) initiative in SA, committing to finding employment for approximately 1 200 youth annually for the next three year
Climate change statement Investec supports the transition to a low carbon economy and believe we can make a meaningful impact in addressing climate change

Page 94
Uncertainty with respect to Brexit, but our business remains resilient
• c.77% of the portfolio is in the UK (largely London and Home Counties). Of thenon-UK portion the majority of the exposure is in Germany
• The book is income producing supported by leases with good quality tenants thatprovide consistent cash flows
• Average loan to value c.60-70%. Average loan size generally <£10mn
• In addition to the property security value and lease cash flow streams, personalguarantees from principals are held
• Net loan book: £189mn at 30 September 2018 (1.9% of total UK net core loans)
• No repeat of substantial impairments expected
• Low levels of impairments
• Credit loss ratio long term trend: 30bps to 40bps (current: 41bps)
• Focused on target clients with lending in established areas (London and theSouth East)
• Average loan to value c.50-60%
• Recourse to principal and high level of cash equity contributions into transactions
• Restructure of Irish branch into MiFID licensed entity
• Costs related to the consequential unwinding of Irish deposits and other restructuring costs are anticipated in the coming months
• Significant additional liquidity raised in anticipation of this
High cash balances at £6.5bn Good quality commercial property portfolio that has held up in times of stress
Asset quality remains sound
Legacy book has been managed down
EU access via Irish business HNW and high income residential mortgages
Key points• We have limited European business outside of Ireland and so the overall impact of Brexit on our client
franchise will be limited
• Brexit will result in a restructure and downscaling of our Irish operations, giving rise to some one off restructuring costs
• The giving up of the Irish branch license would mean repaying c.€1.3bn of deposits as a one off cost
• Should there be a significant slowdown in economic activity due to Brexit developments and subsequent reduced client activity or deferral of investment decisions, this could impact revenue and impairments

Page 95
UK Specialist Bank: Key metrics
0%
10%
20%
30%
40%
50%
60%
70%
80%
90%
0
2
4
6
8
10
12
14
2011 2012 2013 2014 2015 2016 2017 2018 H1 2019
£’bn
Customer accounts (deposits) Net core loans and advances Loan to deposit ratio
1.39% 1.45% 1.54%
1.60%
1.85% 1.82%1.96%
2.11%2.19%
0.0%
0.5%
1.0%
1.5%
2.0%
2.5%
0
5,000
10,000
15,000
20,000
2011 2012 2013 2014 2015 2016 2017 2018 H1 2019
£’mn
Interest earning assets £'mn (LHS) Net interest margin (RHS)
0.4% 0.4%
0.7%
0.5%
0.7% 0.7%0.8% 0.7%
0.7%
1.1%1.0%
1.4%
1.0%
1.2%
1.2%1.2%
1.0% 1.1%
0.0%
0.2%
0.4%
0.6%
0.8%
1.0%
1.2%
1.4%
1.6%
0
5,000
10,000
15,000
20,000
2011 2012 2013 2014 2015 2016 2017 2018 H1 2019
£’mn
Total assets £'mn (LHS) Total risk-weighted assets £'mn (LHS)
RoA (RHS) RoRWA (RHS)
Customer loans and deposits
Net interest margin RoA and RoRWA
Information on this slide is based on the results of the ongoing business (excluding UK Specialist Bank legacy assets and businesses sold), unless otherwise specified.

Page 96
UK Specialist Bank: Key metrics (cont.)
^Where annuity income is net interest income and annuity fees. *Refers to the remaining UK legacy business and Group assets that were sold in the 2015 financial year.
77% 75%70%
74% 76% 71%73% 76% 77%
0%
20%
40%
60%
80%
100%
0
100
200
300
400
500
600
2011 2012 2013 2014 2015 2016 2017 2018 H1 2019
£’mn
Costs £'mn (LHS) Cost to income ratio (RHS)
Revenue Costs
Impairments and credit loss ratio Profit and returns
31% 35%43% 47%
60%56%
48%56% 57%
0%
20%
40%
60%
80%
100%
0
100
200
300
400
500
600
700
800
2011 2012 2013 2014 2015 2016 2017 2018 H1 2019
£’mn
Net interest income Annuity fees and commissions
Other fees and other operating income Customer flow trading income
Investment and associate income Annuity income^ as a % of total income
0.71% 0.72%
0.10%0.46%
0.12%0.26% 0.27% 0.24% 0.41%
0.0%
0.5%
1.0%
1.5%
2.0%
2.5%
0
40
80
120
160
200
240
280
2011 2012 2013 2014 2015 2016 2017 2018 H1 2019
£’mn
Impairments UK and Other (LHS) Impairments Legacy and sales* (LHS)
credit loss ratio Ongoing (RHS) credit loss ratio Statutory (RHS)
2.6%-1.8%
1.7%3.6% 2.1% 5.5%
7.0%
3.2%
10.6%10.0%
16.8%
10.9%9.6%
11.4% 11.5%8.5% 9.3%
-3%
2%
7%
12%
17%
0
50
100
150
200
2011 2012 2013 2014 2015 2016 2017 2018 H1 2019
£’mn
Net profit before tax £'mn (LHS) ROE post tax statutory (RHS)
ROE post tax onging business (RHS)
Information on this slide is based on the results of the ongoing business (excluding UK Specialist Bank legacy assets and businesses sold), unless otherwise specified.

Page 97
0%
10%
20%
30%
40%
50%
60%
70%
80%
90%
0
50
100
150
200
250
300
350
2011 2012 2013 2014 2015 2016 2017 2018 H1 2019
R’bn
Customer accounts (deposits) Net core loans and advances Loan to deposit ratio
SA Specialist Bank: Key metrics
Customer loans and deposits
Net interest margin* RoA and RoRWA
1.84% 1.89% 1.90%1.79% 1.90%
1.98% 1.99% 1.99% 2.05%
0.0%
0.5%
1.0%
1.5%
2.0%
2.5%
0
100,000
200,000
300,000
400,000
2011 2012 2013 2014 2015 2016 2017 2018 H1 2019
R’mn
Interest earning assets R'mn (LHS) Net interest margin (RHS)
0.8%
0.7% 0.7%
0.8%
1.0% 1.0%
0.9%
0.9% 1.0%1.1%
1.0% 0.9%1.1%
1.4% 1.4%1.2%
1.3%1.3%
0.0%
0.2%
0.4%
0.6%
0.8%
1.0%
1.2%
1.4%
1.6%
0
100,000
200,000
300,000
400,000
500,000
2011 2012 2013 2014 2015 2016 2017 2018 H1 2019
R’mn
Total assets R'mn (LHS) Total risk-weighted assets R'mn (LHS)RoA (RHS) RoRWA (RHS)
*Excluding funding issued by the Investec Property Fund (IPF) in which the Group has a 26.57% interest.

Page 98
SA Specialist Bank: Key metrics (cont.)
^Where annuity income is net interest income and annuity fees; *Cost to income calculation adjusts for the Group’s 26.57% interest held in the Investec Property Fund (IPF), by deducting the IPF minority interests from income.
Revenue Costs*
Impairments and credit loss ratio Profit and returns
10.7%9.6%
10.0%
12.5%
15.2% 15.1%
12.7%
12.8%
12.4%
0%
2%
4%
6%
8%
10%
12%
14%
16%
-
1,000
2,000
3,000
4,000
5,000
6,000
2011 2012 2013 2014 2015 2016 2017 2018 H1 2019
R’mn
Net profit before tax R'mn (LHS) ROE post tax (RHS)
53% 54% 55% 53% 50% 50% 51% 51% 50%
0%
10%
20%
30%
40%
50%
60%
0
1,000
2,000
3,000
4,000
5,000
6,000
7,000
2011 2012 2013 2014 2015 2016 2017 2018 H1 2019
R’mn
Costs R'mn (LHS) Cost to income ratio (RHS)
0.71%0.65%
0.61%
0.42%
0.28%0.26% 0.29% 0.28%
0.28%
0.0%
0.1%
0.2%
0.3%
0.4%
0.5%
0.6%
0.7%
0.8%
0
200
400
600
800
1,000
2011 2012 2013 2014 2015 2016 2017 2018 H1 2019
R’mn
Impairment charge R'mn (LHS) Credit loss ratio ratio (RHS)
64%70% 73%
68% 65% 68%76% 77%
72%
0%
10%
20%
30%
40%
50%
60%
70%
80%
90%
-
2,000
4,000
6,000
8,000
10,000
12,000
14,000
16,000
2011 2012 2013 2014 2015 2016 2017 2018 H1 2019
R’mn
Investment and associate income Customer flow trading income
Other fees and other operating income Annuity fees and commissions
Net interest income Annuity income^ as a % of total income