invesco real estate house view · global market outlook autumn 2011 this document is for...
TRANSCRIPT

Invesco Real Estate House ViewGlobal Market Outlook
Autumn 2011
This document is for Professional Clients only in Dubai, Continental Europe, Ireland and the UK, for Institutional Investors only in the United States, Australia and Singapore, and for Professional Investors only in Hong Kong and in Japan as defined under the Financial Instruments and Exchange Law of Japan. In Canada, the document is intended only for accredited investors as defined under National Instrument 45–106. It is not intended for and should not be distributed to, or relied upon by, the public or retail investors.

(Cover Image: London, UK)
For Further Information
Copies of our House Views from across the globe are available from the individuals indicated below:
Vanessa NgSecretary — Asia+852 3128 6699
Lisa NellEuropean Marketing Manager+44 207 543 3535
Joyce GalvanNorth American Research Associate+1 972 715 7437
[email protected] [email protected] [email protected]
In Continental Europe, please contact your local Invesco office:
Amsterdam +31 20 561 62 61 www.invesco.nl
Brussels +32 2 64 10 17 0 www.invesco.be
Frankfurt +49 69 29807 800 www.de.invesco.com
Madrid +34 91 78 13 02 0 www.invesco.es
Milan +39 02 88074 1 www.invesco.it
Munich +49 89 20 60 60 00 www.invescorealestate.de
Paris +33 1 56 62 43 71 www.invesco.fr
Stockholm +46 708 40 84 46 www.invescoeurope.com
Vienna +43 1 316 20 0 www.invesco.at
Zurich +41 44 287 90 00 www.invesco.ch
Global Real Estate Research Team
Thomas AuDirector of Asian Research +852 3128 6663
Simon MallinsonDirector of European Research+44 207 543 3573
[email protected] [email protected]
Mike Sobolik, CFA®, CRERegional Director of Research, North America+1 972 715 5807
Nicholas Buss, Ph.D.North American Director of Research +1 972 715 7454
[email protected] [email protected]
Kim PolitzerDirector of European Research+44 207 543 3589
Joyce GalvanNorth American Research Associate +1 972 715 7437
[email protected] [email protected]
Guy-Young LaméEuropean Senior Research Analyst+33 1 56 62 43 23
Sara R. Rutledge North American Senior Research Analyst+1 972 715 7448
[email protected] [email protected]
Matthias Naumann European Research Analyst+49 89 20 60 61 31
Gordon YuAsian Research Analyst +852 3128 6664

Table of Contents
3 Executive Summary
5 Global Real Estate Capital Market Trends
9 Global Economic Trends and Outlook
17 Global Real Estate Opportunities


3 Global Market Outlook, Autumn 2011
Executive Summary
Our recent House Views have consistently pointed to the gradual and sometimes anemic recovery that follows a balance sheet recession. This slow economic growth faces further headwinds from political decisions required to deal with the long-term fiscal imbalances particularly in the Western world. Political decisions are made more difficult by their effect on long-term growth and stability rather than short-term political gains. In addition, markets have become unsettled by the difficulties finding consensus between competing ideological doctrine in the U.S. and cultural differences across the eurozone and by the challenges facing Asia in balancing between inflation and growth.
This House View has been written against the backdrop of economic uncertainty, resulting in stock market volatility not seen since Lehman’s crash in 2008. The downgrading of the U.S. government credit rating from AAA to AA+ by Standard & Poor’s (S&P) coupled with weak H1 2011 U.S. growth, eurozone sovereign debt problems and slowing gross domestic product (GDP) growth across Western Europe, government tightening in China and the after-effects of the March 2011 Japanese earthquake are all adding to the uncertainty.
This isn’t 2008What does the recent turmoil mean for commercial real estate markets? Recent stock market volatility has been reminiscent of the period following Lehman 2008. Lehman 2008 led to the deepest recession in the post WWII era and subsequent corrections in values for real estate markets globally. However, significant differences between 2008 and today lead us to believe that real estate values going forward will hold up better than three years ago:
• Liquidity exists, albeit selective. While financing costs have risen in recent months, banks are still willing to lend to businesses with growth prospects. Bank lending is available at reasonable rates for solid “core” real estate. Assets with incrementally higher risk are treated much more adversely. We expect this situation to hold until banks adjust their balance sheets and reduce their current high exposures to real estate. This could take at least an additional 12 months.
• Real estate values in developed markets remain well below prior peaks. Lehman’s demise and the subsequent credit crisis followed a long period of global real estate value appreciation. While we have seen some value recovery over the last 12 months, values in most developed markets are still well below peaks across most sectors.
• Fundamentals in the developed world are starting at a different place. While inventory growth peaked in 2008, the current development pipeline is sparse across most markets and constrained by the lending environment. This is expected to mitigate further erosion in fundamentals.
• GDP drivers shifting to the private sector. Economies are rebalancing from the public to private sector as governments address fiscal issues. The drag on growth from public sector contraction will likely weaken real estate occupier demand in the short term, but this rebalancing to the private sector sets the stage for more sustainable long-term growth.
Despite recent equity and bond market turmoil we believe real estate continues to offer attractive risk-adjusted returns. We expect an elongated recovery period in the developed world with growth opportunities in emerging markets.

4 Invesco Real Estate House View
The following highlights our expectations for global real estate and outlines strategies Invesco Real Estate intends to pursue to optimize risk-adjusted returns:
• Investors, particularly those with long-term liabilities to match, are looking for income security from buildings with high occupancy, long leases and liquidity, and hence, would continue to invest in the prime1 segment of the real estate market. However, it should be recognized that these markets are becoming well bid and investors may have to sacrifice total return for security.
• While real estate continues to look attractive versus sovereign bonds in the short term, over the course of 2013–2015 we expect bond yields to begin to rise back to more “normal” levels. This in turn is likely to put some upward pressure on real estate yields although we would expect this to be offset by improving fundamentals.
• In the developed world, office markets are expected to deliver the most attractive revenue growth of all the sectors over the period 2011–2013 through a combination of subdued development pipelines and increasing occupier demand for limited available prime space. The best risk-adjusted returns offering income security are expected from prime quality buildings in key supply constrained locations driven by short term yield movements. Comparatively stronger growth in the emerging world is expected to drive returns as international and domestic occupiers continue their expansion plans and require new prime grade A office space. Reducing supply pipeline is also likely to support rents.
• We would be cautious of developed world retail until consumer demand improves, possibly towards the end of 2012. In the developed world, key retail locations are expected to deliver better income security than non-core locations. We expect grocery-anchored retail units leased to well-capitalized retailers to perform relatively well compared to other retail sectors. In the emerging markets, retail growth is expected to be more robust with retail sales supported by a growing middle class with rising disposable incomes. We caution that there are long-term structural risks from the rise of internet retailing, with key retail locations (main high streets, key shopping centers and dominant retail parks) less vulnerable.
• In the short term, industrial/logistics are not expected to deliver exciting total returns but can offer stable income returns. Longer term we believe the rise of internet retailing is expected to benefit distributors and feed positively through to logistic rents.
• We are generally cautious in the residential sectors in Asian markets except for multi-family in Japan and countries where government efforts to curb lending and speculation have less impact. In the U.S., apartment markets are expected to offer attractive opportunities for income growth in supply constrained markets with historically high occupancy rates. Yet, the potential for strong income growth across markets should be scrutinized in light of very competitive pricing.
1 Prime refers to assets of the best quality in the best locations let to strong tenant covenants on standard market terms.
5 Global Market Outlook, Autumn 2011
1 Secondary refers to assets in non-core locations or older assets that do not reflect modern tenant requirements.
Global Real Estate Capital Market Trends
While the pace of real estate value recovery has slowed in recent months it remains positive as rental levels have stabilized in prime markets and investors continue to target real estate. Secondary assets1 remain out of fashion as investors focus on income security that prime, well-let assets offer.
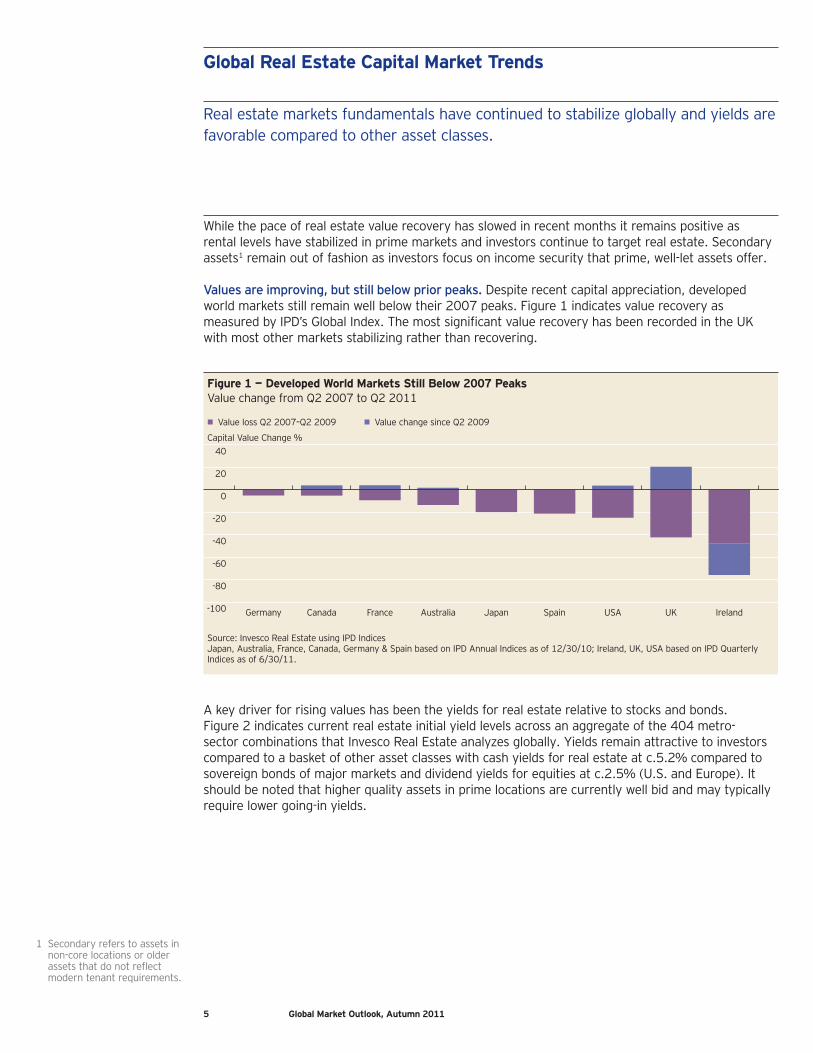
Values are improving, but still below prior peaks. Despite recent capital appreciation, developed world markets still remain well below their 2007 peaks. Figure 1 indicates value recovery as measured by IPD’s Global Index. The most significant value recovery has been recorded in the UK with most other markets stabilizing rather than recovering.
Figure 1 — Developed World Markets Still Below 2007 PeaksValue change from Q2 2007 to Q2 2011
• Value loss Q2 2007–Q2 2009 • Value change since Q2 2009
-100
-80
-60
-40
-20
0
20
40
IrelandUKUSASpainJapanAustraliaFranceCanadaGermany
Capital Value Change %
Source: Invesco Real Estate using IPD IndicesJapan, Australia, France, Canada, Germany & Spain based on IPD Annual Indices as of 12/30/10; Ireland, UK, USA based on IPD Quarterly Indices as of 6/30/11.
A key driver for rising values has been the yields for real estate relative to stocks and bonds. Figure 2 indicates current real estate initial yield levels across an aggregate of the 404 metro-sector combinations that Invesco Real Estate analyzes globally. Yields remain attractive to investors compared to a basket of other asset classes with cash yields for real estate at c.5.2% compared to sovereign bonds of major markets and dividend yields for equities at c.2.5% (U.S. and Europe). It should be noted that higher quality assets in prime locations are currently well bid and may typically require lower going-in yields.
Real estate markets fundamentals have continued to stabilize globally and yields are favorable compared to other asset classes.

6 Invesco Real Estate House View
Figure 2 — Current Real Estate Initial Yields as of Q2 2011
• United States • Europe • Asia
0
1
2
3
4
5
6
7
8
9
Resi
dent
ial
Reta
il
Offi
ces
Resi
dent
ial
Reta
il
Offi
ces
Logi
stic
s
Reta
il
Offi
ces
Logi
stic
s
Reta
il
Offi
ces
Resi
dent
ial
Indu
stria
l
Reta
il
Offi
ces
Real Estate Initial Yields %
United States Developed Europe Emerging Europe Emerging AsiaDeveloped Asia
Sources: Invesco Real Estate, CB Richard Ellis, Jones Lang LaSalle, NCREIF, August 2011 Yields represent equal-weighted aggregates for each of the regions based on end Q2 2011 data.
Since real estate markets began to bottom out across the world during 2009, transaction volumes have begun to recover. Recent data from Real Capital Analytics (Figure 3) indicate that volumes have stabilized for the first half of 2011 at around US$85 billion per quarter.
Figure 3 — Global Real Estate Transaction Volumes Have Stabilized
• EMEA • Asia-Pacific • Americas
0
50
100
150
200
250
Q2Q12011
Q4Q3Q2Q12010
Q4Q3Q2Q12009
Q4Q3Q2Q12008
Q4Q3Q2Q12007
Transactions $bn per Q
Source: Real Capital Analytics, July 2011 (commercial real estate only, excludes land transactions)
What has changed during the recovery period since 2009 is each region’s share of the total. Most notably the Asia-Pacific market has moved from representing 14% of the total during 2007, 26% of the total during 2010 and dropping slightly to 19% in Q2 2011. We expect Asia-Pacific to continue to represent a larger proportion of the absolute volumes as we believe Asian core is becoming more readily available and of growing interest to cross-border investors. Long-term we expect Asia-Pacific to become a larger part of a global core investor’s asset allocation. Holders of real estate in this region should experience an increase in liquidity and therefore further capital appreciation as more international investors target the region.

7 Global Market Outlook, Autumn 2011
Cross-border investing stays close to home. One of the interesting trends of the past 18 months has been the focus on regional rather than continental investment opportunities. Real Capital Analytics data indicate that of the US$108 billion of cross-border acquisitions over the past 12 months, 60% flowed between countries of the same continent.
This continental, rather than global, focus is confirmed by DTZ survey numbers (Figure 4). The DTZ report “The Great Wall of Money” (March 2011) indicates that close to 90% of Asia-Pacific capital is focused on the Asia-Pacific region while 80% of EMEA capital is focused on EMEA opportunities. The Americas does indicate a different story with only 35% focused on the region with another 35% focused on EMEA and 25% on global investments. This is likely because of the wider range of opportunities available regionally for EMEA or Asia-Pacific capital, and a smaller number of opportunities for Americas capital (largely U.S.) to diversify country focus. It is also reflective of the depth of the U.S. market in delivering diversification within the country.
Figure 4 — Regional vs. Continental Investment Opportunities
• Asia-Pacific • Global • EMEA • Americas
0
10
20
30
40
50
60
70
80
90
100
AmericasEMEAAsia Pacific
Capital Flow %
Source: DTZ Research “The Great Wall of Money”, March 2011
Allocated capital could sustain near-term values. The measured transaction volume from Real Capital Analytics captures only a small part of the story about the recent value recovery. The larger story is shown by the harder to measure “benched” capital, which is real estate allocated capital sitting either with managers awaiting deployment or is represented within pension and other institutional allocations that are yet to be placed with managers. It is this capital that is putting the pressure on real estate pricing and DTZ estimates capital available for investment in 2011 to total US$329 billion (DTZ “Great Wall of Money” report, March 2011).
Prime assets remain the focus. A key driver of value recovery in recent quarters has been fundamental demand and supply dynamics that have pushed down yield levels. Investors have largely focused only on the best buildings in the most core locations with the longest leases and strongest tenant covenants. These buildings are in short supply even in the most stable of market circumstances, but at a time when existing long-term holders of real estate are concerned about liability matching, inflationary pressures and the performance of equity and bond markets, these assets are simply not up for sale unless in distressed situations.
Up until very recently, we had seen investors begin to look outside the top end of the prime market and begin to investigate prime buildings with “curable deficiencies” and in some cases, begin to even look at the top end of the non-core markets and development opportunities in primary markets. Curable deficiencies relates to problems such as short leases, financing issues or minor refurbishment needs that are curable by an experienced real estate manager to boost performance.
8 Invesco Real Estate House View
With the recent market turmoil and weak GDP growth recorded in a number of markets for Q2 2011, we expect a number of investors to pull back from risky assets and refocus on prime. This will likely have the effect of putting further pressure on prime real estate pricing. We also expect bank financing to be priced at higher margins for riskier assets. However, longer-term investors who can acquire assets with equity should be able to acquire attractive core plus and value-add assets with limited competition from other investors.
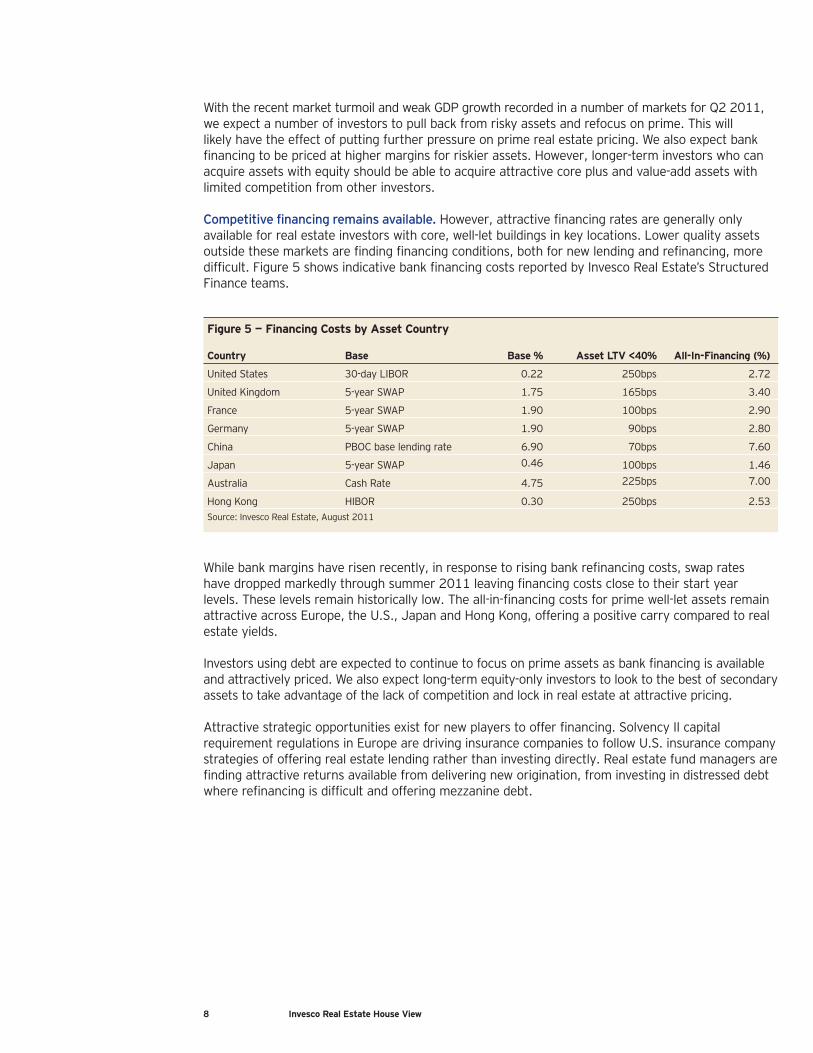
Competitive financing remains available. However, attractive financing rates are generally only available for real estate investors with core, well-let buildings in key locations. Lower quality assets outside these markets are finding financing conditions, both for new lending and refinancing, more difficult. Figure 5 shows indicative bank financing costs reported by Invesco Real Estate’s Structured Finance teams.
Figure 5 — Financing Costs by Asset Country
Country Base Base % Asset LTV <40% All-In-Financing (%)
United States 30-day LIBOR 0.22 250bps 2.72
United Kingdom 5-year SWAP 1.75 165bps 3.40
France 5-year SWAP 1.90 100bps 2.90
Germany 5-year SWAP 1.90 90bps 2.80
China PBOC base lending rate 6.90 70bps 7.60
Japan 5-year SWAP 0.46 100bps 1.46
Australia Cash Rate 4.75 225bps 7.00
Hong Kong HIBOR 0.30 250bps 2.53Source: Invesco Real Estate, August 2011
While bank margins have risen recently, in response to rising bank refinancing costs, swap rates have dropped markedly through summer 2011 leaving financing costs close to their start year levels. These levels remain historically low. The all-in-financing costs for prime well-let assets remain attractive across Europe, the U.S., Japan and Hong Kong, offering a positive carry compared to real estate yields.
Investors using debt are expected to continue to focus on prime assets as bank financing is available and attractively priced. We also expect long-term equity-only investors to look to the best of secondary assets to take advantage of the lack of competition and lock in real estate at attractive pricing.
Attractive strategic opportunities exist for new players to offer financing. Solvency II capital requirement regulations in Europe are driving insurance companies to follow U.S. insurance company strategies of offering real estate lending rather than investing directly. Real estate fund managers are finding attractive returns available from delivering new origination, from investing in distressed debt where refinancing is difficult and offering mezzanine debt.

9 Global Market Outlook, Autumn 2011
Global Economic Trends and Outlook
The recent uncertainty, coupled with the gathering pace of austerity measures, means that the recovery in the developed world is likely to be a slower and more elongated period than originally anticipated. This will have a knock-on effect to emerging countries which depend on the developed world as trade partners. However, there are a number of emerging countries that have growing domestic demand bases. In addition, the increasing level of intra-regional trade, as well as trade between emerging markets of different regions could help cushion the negative impact from the slowdown in the developed world.
The Developed WorldAs highlighted in our previous House Views, we do not subscribe to the decoupling theme. Yet, there are some differences in economic drivers in the developed and emerging economies that could lead to various implications to the corresponding real estate markets.
Our research includes the following developed regions — the U.S., Japan, the UK, Western Europe, Southern Europe, Australia, the Nordics, Hong Kong and Singapore.
A number of the developed nations have come through the global financial crisis and the more recent sovereign debt turmoil with strong underlying growth potential. Others have not. Figure 6 shows our GDP growth expectations for developed nations.
Figure 6 — GDP Growth Expectations for Developed Nations From 2011 to 2015
• 2011f • 2012f • 2013–15f
-1
0
1
2
3
4
5
6
7
SwedenFinlandSpainItalyGermanyFranceUKSingaporeJapanHKAustraliaUSA
Annualized GDP Growth %
Asia-Pacific Europe
Sources: Invesco Real Estate and Experian Business Strategies, August 2011f = forecast
The markets that initially stand out are the Asia-Pacific growth markets of Singapore and Hong Kong together with Australia. We expect Singapore and Hong Kong to continue benefitting as centers of finance in the Asia-Pacific region, more so as the region continues to develop strongly and intra-regional trade expands in the medium to long term. Yet, these two small, open economies could be more vulnerable to the slowdown in the western markets in the near term. We expect Australian growth, whilst strong, will wane a little as it recovers from its natural disasters and as commodity prices cool.
We believe that uncertainty spurred by substantial economic risks both globally and within individual countries has diminished the confidence of investors and consumers, which in turn has stalled growth.

10 Invesco Real Estate House View
While we expect weak growth for Japan in 2011, a bounce back from the earthquake and tsunami is expected from 2012. Japan is already on track with its recovery. Many quake hit facilities are already back in operation as of August 2011, which should drive better Q4 2011 GDP growth, although the year as a whole is likely to be negative. The Bank of Japan’s monetary easing should also lend support to the recovery and provide liquidity to the capital markets. A key concern for Japan is the strength of the currency, which could negatively impact exports and dampen short term economic recovery.
In Europe, the growth nations include the Nordics, however, only Sweden and Finland are shown in Figure 6, but it also includes Norway. These markets are not suffering from the credit problems of other developed nations. Sweden went through its own banking crisis in the nineties and emerged with a banking system governed by “safety valves” that prevent excess risk taking. It has worked so well that many governments are looking to the Swedish model when rebuilding their own banking regulatory systems.
The U.S., UK, France, Ireland and the Southern European markets of Spain, Italy and Portugal all share a number of common problems, namely high debt levels at both consumer and sovereign level. Following a balance sheet recession of the type recently experienced, the deleveraging stage of the recovery takes a long time and results in low growth as consumers and the public sector cut back on spending. We expect the growth rates of these countries to moderate to below long-term trends for the next five years.
Germany, the economic engine of the eurozone, is also expected to show weaker growth as it experiences a level of austerity. It does not require as much austerity measures as other countries, however, its consumer is very sensitive to confidence levels and is historically a saver rather than spender. This means the German growth story has largely been driven through exports to the countries that are suffering from excess spending and are currently in deleveraging mode. This is expected to hold back German growth.
However, there are some bright spots across the developed world. While GDP growth is expected to be low, the growth that does exist is expected to be the “good kind” in that it is expected to be driven by the private sector, namely business expansion. Our base case expects a significant fall in public sector spending in most developed countries (with Japan a notable exception) with private sector growth to be positive. Figure 7 demonstrates this for a number of countries.
Figure 7 — GDP Drivers From 2001 to 2015f
• Trade Balance • Business Investment • Government Consumption • Private Consumption • GDP Growth
-1.0
-0.5
0.0
0.5
1.0
1.5
2.0
2.5
3.0
USAUKJapanEurozoneUSAUKJapanEurozone
Components of GDP %
Last 10 years (2001 to 2010) Forecast (2011 to 2015f)
Sources: Invesco Real Estate and Experian Business Strategies, August 2011. The “trade balance” represents export growth less import growth.f = forecast

11 Global Market Outlook, Autumn 2011
1 Source: Wall Street Journal, 29 July 2011 “Apple: More Cash Than Uncle Sam”
Corporate entities across the world are holding significant cash reserves that could be available for business investment and expansion, which we expect them to invest once there are clear signs of sustainable economic recovery. So much so that for a time, during August 2011, Apple Corp. was reported to be holding more cash reserves than the United States Treasury1 at US$76 billion. A number of corporate entities holding vast cash reserves are thought to be holding this cash around the world. Tax liabilities in home countries often make it unattractive to repatriate the money and so it is spread globally for investment locally.
The Emerging WorldOur research includes the following emerging regions — China, Central and Eastern Europe, Korea, Malaysia, Taiwan and Thailand.
Emerging markets share an implicit economic growth potential. As core and value-add real estate investors we focus on those markets that have already begun the transition from emerging to developed status. Opportunistic investment strategies often focus on the markets that are only beginning this transition.
Figure 8 — GDP Growth Expectations for Emerging Markets From 2011 to 2015
• 2011f • 2012f • 2013–15f
0
1
2
3
4
5
6
7
8
9
10
SlovakiaRussiaRomaniaPolandHungaryCzech Rep.BulgariaThailandTaiwanMalaysiaKoreaChina
Annualized GDP Growth %
Asia-Pacific Europe
Sources: Invesco Real Estate and Experian Business Strategies, August 2011f = forecast
Figure 8 demonstrates the growth rates expected for the emerging markets we analyze. We have separated the markets into those in Asia-Pacific and those in Central and Eastern Europe. One of the traits of emerging markets is that their high growth rates are linked to the fast growth of the private sector but also that they are growing from relatively small GDP starting values compared to the developed world. As their absolute GDP values grow, then the level of GDP growth begins to shrink. We are beginning to see this in markets such as Czech Republic, Poland and parts of China, emerging markets that are further down the path to becoming developed nations.
Emerging markets are still expected to deliver higher growth rates than developed markets over the coming five years. Yet, emerging markets are implicitly more risky and depend on a certain level of global stability to deliver growth — they are likely more susceptible to market shocks.

12 Invesco Real Estate House View
A way of mitigating this risk is to focus on emerging markets that are not as susceptible to external shocks. Markets such as Poland, the Czech Republic and to a lesser extent China have significant domestic demand bases that are beginning to offset the dependence on foreign trade. Poland avoided a recession in 2008–2009 partly through its developing wealthier middle class aspiring to become more “Western”, which means more consumer spending. While China still has a significant part of the rural population below the poverty line, the growing urban population with rising disposable incomes represents an emerging driver of the Chinese economy mitigating dependence on Western consumers for Chinese goods.
Inflation and Interest RatesBalancing between inflation, interest rates and growth is difficult. Dealing with inflation is a common theme for many central banks globally, and of concern to institutional investors needing to deliver inflation-hedged returns to match liabilities. Inflation has been running higher than average levels across much of the world. Figure 9 shows a comparison of current annual inflation compared to short- and medium-term rates (two and five-year averages).
Figure 9 — Inflation Rates vs. Short- And Medium-Term Rates
• Last 5 years • Last 2 Years • End June 2011
Annual Inflation Rates %
0
1
2
3
4
5
6
7
USAUKSwedenEurozoneChina
Source: Thomson Reuters Datastream, August 2011
However, government responses have been markedly different. The Chinese government, the European Central Bank and the Swedish National Bank have all moved base interest rates upwards in the past 12 months to counter rising inflation. The UK and the U.S. have opted to maintain interest rates at their historically low levels.
Getting the balance right between inflation, interest rates, foreign exchange and GDP growth always exercises the minds of central bankers but we expect their task to be harder for the foreseeable future as small changes in inflation and financing costs are having a large impact on market sentiment and confidence. We continue to believe that the currently high inflation rates are the result of short term temporary price pressures and will dissipate from mid-2012 onwards.
13 Global Market Outlook, Autumn 2011
On the “supply side” over the last 12 to 24 months, All Items Inflation has been driven by short term pressures such as weak 2010 wheat harvests in Russia, poor cotton crops in Pakistan (destroyed by floods) and failed crops in India, increasing oil and other energy and commodity prices. For 2011, India is expected to have a bumper food and cotton crop while harvests in Russia seem to be going to plan. Energy and commodity prices are finally stabilizing and falling, partly linked to reduced demand as economic activity slows. Other impacts that are likely to increase inflation but are limited to the short term include the slowdown in production of electronic parts in Japan following the earthquake and tsunami. As production restarts, the short term impact of a parts shortage will be reduced.
On the “demand side” of inflation, wage growth has been weak across the developed world and unemployment levels remain stubbornly high in the Western markets. This has had an impact on consumer spending and retail sales and will lead to price reductions rather than price increases in the medium term. We do expect pent-up consumer demand to be released from the end of 2012, which should increase inflationary pressures requiring offsetting interest rate rises. To date international retailers have been able to maintain pricing levels, but as slow economic growth continues, price reductions are expected. In the meantime, as China aims to slow economic growth, demand for raw materials from real estate and infrastructure construction could moderate.
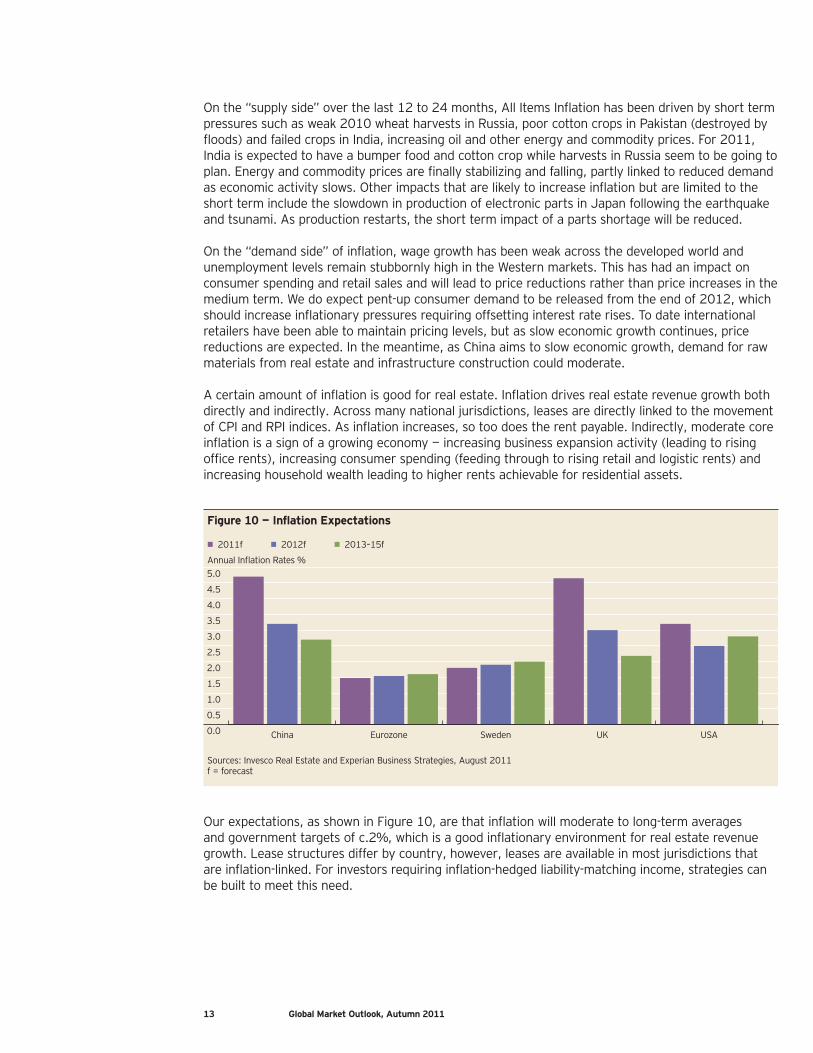
A certain amount of inflation is good for real estate. Inflation drives real estate revenue growth both directly and indirectly. Across many national jurisdictions, leases are directly linked to the movement of CPI and RPI indices. As inflation increases, so too does the rent payable. Indirectly, moderate core inflation is a sign of a growing economy — increasing business expansion activity (leading to rising office rents), increasing consumer spending (feeding through to rising retail and logistic rents) and increasing household wealth leading to higher rents achievable for residential assets.
Figure 10 — Inflation Expectations
• 2011f • 2012f • 2013–15f
0.0
0.5
1.0
1.5
2.0
2.5
3.0
3.5
4.0
4.5
5.0
USAUKSwedenEurozoneChina
Annual Inflation Rates %
Sources: Invesco Real Estate and Experian Business Strategies, August 2011f = forecast
Our expectations, as shown in Figure 10, are that inflation will moderate to long-term averages and government targets of c.2%, which is a good inflationary environment for real estate revenue growth. Lease structures differ by country, however, leases are available in most jurisdictions that are inflation-linked. For investors requiring inflation-hedged liability-matching income, strategies can be built to meet this need.

14 Invesco Real Estate House View
Pricing real estate off sovereign bonds has grown more difficult. Traditionally, real estate is priced relative to a “risk-free rate”, which is typically a five to 15 year government bond yield. At present, when compared to long-term government bond yields, real estate continues to look attractive in most countries (Figure 11). However, this yield spread is artificially high at the present time due to the on-going wider asset class “flight to quality”, which has seen investors invest heavily in so-called risk-free investments such as bonds. In addition various forms of quantitative easing by key central banks have also skewed pricing for bonds.
Ironically, the turmoil seen in early August 2011, following the second bail out of Greece, the ECB’s intervention to shore up Spanish and Italian bond markets, and the U.S. downgrade by S&P has only resulted in yields being pushed down further.
Figure 11 — Widening Initial Yield Spreads in the Short Term
• United Kingdom • Japan • France • United States • Spain • Long-Term Spread
-100
0
100
200
300
400
500
Q2Q1Q42010
Q3Q2Q1Q42009
Q3Q2Q1Q42008
Q3Q2Q1Q42007
Office Initial Yields less 10-Year Govt Yield, bps
Sources: Invesco Real Estate, CB Richard Ellis, Jones Lang LaSalle and NCREIF, August 2011
Nevertheless, investors have to weigh up the relative merits of “safe” government bonds, which in some circumstances are currently trading at negative real interest rates or higher return opportunities with a greater risk profile. Such an analysis is leading investors to accept surprisingly low prime real estate yields given where we are in the current cycle.
In Europe there is a further dilemma as investors attempt to analyze an acceptable yield for real estate in those countries in the periphery experiencing distress in their sovereign debt markets. Government bond yields are no longer “risk-free” and, therefore, the traditional relative pricing approach breaks down. However, using a benchmark yield such as the bund does not capture the economic and political risk facing investors in these countries. While this dilemma is causing cross-border investors to shy away from these markets, domestic investors are taking a more pragmatic approach and using other indicators such as market value per square meter to gauge appropriate pricing.
While real estate continues to look attractive versus sovereign bonds in the short term, over the course of 2013–2015 as the balance sheet recession of the Western world continues to unwind, we expect bond yields to begin to rise back to more “normal” levels and this in turn is likely to put some upward pressure on real estate yields although we would expect improving fundamentals to offset this.

15 Global Market Outlook, Autumn 2011
There are a number of threats to global economic stability that we are monitoring closely and considering their potential impact on our base case scenarios:
• Banks. The interlinked exposure of banks to a multitude of complex financing instruments was a key reason for the credit crisis of 2008. National governments have undertaken various policies, both domestically and with international co-operation, including semi- or full-nationalization, recapitalization and increased regulation. Despite this, three years later, international banks remain a source of instability. Direct bank exposure to sovereign debt in troubled eurozone countries such as Greece, Portugal and Ireland as well as to Italy and Spain is largely known. We know, for instance, that the key banks at direct risk are German and French. However, we do not know how the inter-linkage of international banks will be impacted by any serious default or failure of one of these banks.
• The eurozone. The eurozone is a monetary union without fiscal union. Structures do not exist to allow a country to exit the eurozone and the impact of this happening is unknown. Presently, political efforts are going towards holding the union together with the aim of attempting to bring fiscal policy making closer in line across the federation and putting in place debt ratio limits. However, this does not help the long-term structural problems the zone faces, particularly those of competitiveness. The core eurozone (France and Germany) are far more competitive than those in the south and the current redistribution of funds across the zone does not offset this. Long-term solutions are needed to ensure the stability of the zone. The probability of a eurozone collapse remains low as the political will is for a continued union and a collapse is not in our base case scenario.
• U.S. downgrade. The downgrade of the U.S. was not unexpected. S&P had raised the possibility far in advance. However, it pulled into focus the problems the developed world faces and triggered a loss of confidence in both economic growth forecasts and politicians’ abilities to move in the right direction. Since the downgrade, the cost of U.S. borrowing continued to decline as investors “flight to quality” drove them into U.S. sovereign debt from equities. The key risk to our base case is further downgrades and for S&P to be joined by the other big rating agencies Fitch and Moody’s. This risk, tied to the risk of sovereign default in the eurozone, could push Western developed economies back into recession.
• Chinese hard-landing. China is the U.S.’s largest foreign creditor at +US$1 trillion, and recently has diversified its foreign holdings to include exposure to eurozone debt, particularly Spain. With Western markets being a key export market for China, significant slowdown in these markets, and recession, coupled with potential debt defaults would be enough to create a hard-landing for the Chinese economy. This would have a knock-on effect on other Asian economies as well as for Western sovereign debt markets as a significant buyer pulls back. Soaring debt costs could begin a vicious recessionary cycle as a prelude to a credit crisis more severe than 2008.


17 Global Market Outlook, Autumn 2011
Global Real Estate Opportunities
Global real estate investors are expected to find significant investment opportunities globally to meet their investment return hurdles, investment time-horizons and deliver diversification benefits.
Figure 12 — Forecasted Total Returns from Mid-2011 to Mid-2016
• United States • Europe • Asia • Low Range • High Range
-10
-5
0
5
10
15
20
Resi
dent
ial
Reta
il
Offi
ces
Resi
dent
ial
Reta
il
Offi
ces
Logi
stic
s
Reta
il
Offi
ces
Logi
stic
s
Reta
il
Offi
ces
Resi
dent
ial
Indu
stria
l
Reta
il
Offi
ces
Total Returns %
United States Developed Europe Emerging Europe Emerging AsiaDeveloped Asia
Source: Invesco Real Estate, August 2011Note: U.S. and Europe represent a five-year outlook. Asia represents a three-year outlook (2012-2014). Total Returns are gross unleveraged returns before transactions costs and property-level taxes.
The Developed WorldWe expect the most stable risk-adjusted returns to come from key locations across developed Europe (such as London, Paris and Stockholm) and Asia (such as Tokyo, Sydney and Hong Kong) and among most of the major U.S. coastal markets and higher-quality assets in select non-coastal markets with stronger occupancies and tenant demand drivers. These markets will likely attract the widest array of investors which should put short term downward pressure on yields.
Despite weak occupier demand there is limited available prime space. Despite weak levels of occupier demand, it is coupled with very low development pipelines as a result of limited bank financing for new development and high occupancy rates for prime quality space. In addition, existing occupiers are looking to upgrade from poorer quality space to prime space locking in lower rental levels. This is expected to stabilize prime rental levels and, in significantly supply constrained centers (such as London and Paris), drive rental growth. Prime offices and high barrier retail locations are expected to deliver secure income for investors in the short term. Cash-rich corporates are expected to react quickly to any signs of economic recovery and invest in business expansion. This is expected to drive further rental growth in the medium term.
We believe real estate continues to offer investment opportunities globally that deliver attractive risk-adjusted returns.

18 Invesco Real Estate House View
Investor “flight to quality” expected to drive values up. With investors nervous about other asset classes and looking to avoid risk, a continued “flight to quality” is expected in real estate with prime assets continuing to attract the bulk of the capital. In our Spring 2011 House Views we remarked that rental growth was expected to drive returns with limited inward yield movements. We now believe that investors will continue targeting prime real estate amid market turmoil, likely compressing yields further in the short term. However, there is a risk that yields could move out in the medium term as the pressure is lifted.
Significant risks attached to secondary real estate. Secondary real estate may continue to be out of favor with risk-averse investors in the short term, which could increase the divergence between prime and secondary real estate as secondary real estate values stagnate and in some cases fall. However, for investors with long-term perspectives the best quality secondary assets may offer attractive value-for-money. With solid tenants in place these assets could deliver high income returns and recover in value in the medium term as risk aversion dissipates.
Value-add financing is expected to be difficult in the short term. The relatively limited financing for value-add investment makes this strategy difficult in the short term in Western economies. However, real estate with “curable deficiencies” is attractively priced and for equity investors with +12% return targets, this may be a viable strategy. The most attractive opportunities would be those which will result in the delivery of prime real estate to the market.
Attractive strategic opportunities exist for new players to offer financing. Real estate fund managers are finding attractive returns available from delivering new origination, from investing in distressed debt where refinancing is difficult and offering mezzanine debt.
The Emerging WorldThe emerging markets of Asia and Europe are expected to offer higher return levels than the developed world driven by stronger economic growth. However, a higher level of risk will be associated with these markets.
Business growth and demographics remain positive. International occupiers are continuing to focus their attention on emerging markets and demanding office, retail and logistics space. With GDP growth focused on key centers across these regions, the migration of rural populations to urban locations is continuing at pace. This is increasing the demand for residential in these areas.
Target markets with growing domestic demand. In Asia and Europe the countries likely to weather an economic slowdown better are those with stronger domestic demand growth prospects. In Asia this includes China and some of the Southeast Asian economies such as Thailand and, in Europe, Poland and the Czech Republic. Development will continue to be a key real estate strategy in emerging markets as institutional investment and international occupier quality space remains limited. We expect to see yields continue to compress and for rental growth to deliver above developed world levels. We caution that properties could become obsolete quicker than in the developed markets because of future supply. Local market knowledge is vital to asset selection based on understanding infrastructure and catchment/trade area growth.

19 Global Market Outlook, Autumn 2011
Real estate cycles are expected to be shorter. In the developed world real estate cycles tend to be driven by economic cycles while in the emerging world they are driven by development build times and capital availability. On average, developed world real estate cycles tend to be five to seven years while emerging market cycles are shorter, estimated at three to five years. We caution that this should be considered by investors when developing exit strategies and underwriting assumptions.
Liquidity drivers are important to understand. There are a number of emerging markets that have limited domestic pension and insurance industries. Those that do have domestic funds are sometimes restricted from investing in real estate, for example Poland and, until recently, China. We believe that over the next five to 10 years these restrictions will be relaxed and those growing domestic pension and insurance industries will target domestic real estate. This will increase the liquidity of the market, reduce yield levels and stabilize the markets. As with developed markets, a key stabilizing factor of real estate markets is the strength of the domestic long-term institutional market.
Sector OpportunitiesGlobally, we believe key office markets to offer the best short-term opportunities. In the developed world, office markets are expected to deliver the best revenue growth of the sectors over the period 2011–2013 through a combination of subdued development pipelines and increasing occupier demand for limited available prime space. The best risk-adjusted returns offering income security are expected from prime quality buildings in key supply constrained locations driven by short term yield movements.
In the emerging world, continued strong economic growth is expected to drive returns as international and domestic occupiers continue their expansion plans and require new prime grade A office space. Reducing supply pipeline is also likely to support rents.
Retailers are experiencing short-term pressures and long-term structural shifts in the developed world. We suggest a cautious approach to developed world retail until consumer demand improves, possibly towards the end of 2012. In the developed world key retail locations (including, for instance, Oxford Street in London, Fifth Avenue in New York and Champs-Élysées in Paris) are expected to deliver better income security than non-core locations. We expect grocery-anchored retail units leased to well capitalized retailers to perform relatively well compared to other retail sectors. In the emerging markets, retail growth is expected to be more robust with retail sales supported by a growing middle class with rising disposable incomes. We caution that there are long-term structural risks from the rise of internet retailing, with key retail locations (main high streets, key shopping centers and dominant retail parks) less vulnerable.
Solid income returns. In the short term, industrial/logistics are not expected to deliver exciting total returns but can offer stable income returns. Longer term we believe the rise of internet retailing is expected to benefit distributors and feed positively through to logistic rents.
Residential expected to deliver attractive returns. In the U.S., the multifamily sector is expected to offer attractive opportunities in supply constrained markets as occupancy rates reach historical highs. Despite our confidence on the long-term prospects, we are generally cautious in the residential sectors in Asian markets in the near term as governments continue to curb lending and speculation. Yet, markets like certain second and third tier Chinese cities where prices are reasonable and anti-bubble measures are not strict, as well as Japan where rents are stabilizing and positive carry is decent, should present opportunity.


Important Information
This document is for Professional Clients only in Dubai, Continental Europe, Ireland and the UK, for Institutional Investors only in the United States, Australia and Singapore, and for Professional Investors only in Hong Kong and in Japan as defined under the Financial Instruments and Exchange Law of Japan. In Canada, the document is intended only for accredited investors as defined under National Instrument 45-106. It is not intended for and should not be distributed to, or relied upon by, the public or retail investors.
The views expressed herein are those of Invesco Real Estate professionals based on current market conditions and are not necessarily those of other Invesco professionals. The views expressed herein do not refer to any specific Invesco product. Opinions and forecasts are subject to change without notice. The value of investments and any income will fluctuate (this may partly be the result of exchange rate fluctuations) and investors may not get back the full amount invested. Past performance is not a guide to future returns. Property and land can be difficult to sell. The value of the property is generally a matter of an independent valuer’s opinion.
We make forward-looking statements in this presentation. The forward-looking statements are based on our beliefs, assumptions and expectations of our future performance, taking into account all information currently available to us. You should not place undue reliance on these forward-looking statements. These beliefs, assumptions and expectations can change as a result of many possible events or factors, not all of which are known to us. Forward- looking statements are subject to risks and uncertainties, many of which are difficult to predict and are generally beyond our control. These forward-looking statements include information about possible or assumed future results of our business, financial condition, liquidity, results of operations, plans and objectives. When we use the words “believe,” “expect,” “anticipate,” “estimate,” “plan,” “continue,” “intend,” “should,” “may”, “would” or similar expressions, we intend to identify forward-looking statements. Statements regarding the following subjects, among others, may be forward-looking. Any forward-looking statement speaks only as of the date on which it is made. New risks and uncertainties arise over time, and it is not possible for us to predict those events or how they may affect us. Except as required by law, we are not obligated to, and do not intend to, update or revise any forward-looking statements, whether as a result of new information, future events or otherwise. The opinions expressed herein are based on current market conditions and are subject to change without notice.
This document contains general information only and does not form part of any prospectus. It is not an invitation to subscribe for shares in a fund nor is it to be construed as an offer to buy or sell any financial instruments. As with all investments, there are associated inherent risks.
The information contained in this document may not have been prepared or tailored for any audience. It does not take into account individual objectives, taxation position or individual financial needs. It does not constitute a recommendation of the suitability of any investment strategy for a particular investor.
This document is issued in: – Australia by Invesco Australia Limited (ABN 48 001 693 232), Level 26, 333 Collins Street, Melbourne, Victoria, 3000, Australia which holds
an Australian Financial Services License number 239916. – Austria by Invesco Asset Management Österreich GmbH, Rotenturmstraße 16-18, A-1010 Wien. – Belgium by Invesco Asset Management SA Belgian Branch (France), Avenue Louise 326, boîte 31, B-1050 Bruxelles. – Canada by Invesco Trimark Ltd., 5140 Yonge Street, Suite 900, Toronto, Ontario, M2N 6X7, Canada. – the Czech Republic by Invesco Real Estate s.r.o., Praha City Center, Klimentska 46, 110 02 Prague 1, Czech Republic. – Dubai by Invesco Asset Management Limited, PO Box 506599, Building 5, Level 6, The Gate Precinct, Dubai, United Arab Emirates.
Regulated by the Dubai Financial Services Authority. – France, the Netherlands and Sweden by Invesco Asset Management S.A., 18, rue de Londres, F-75009 Paris, France. – Germany by both Invesco Asset Management Deutschland GmbH, An der Welle 5, 60322 Frankfurt am Main, which is authorised and regulated by
the Bundesanstalt für Finanzdienstleistungsaufsicht in Germany and also by Invesco Real Estate GmbH, Maffeistrasse 3, 80333 Munich, Germany. – Hong Kong by Invesco Hong Kong Limited, 41/F, Citibank Tower, 3 Garden Road, Central, Hong Kong. – Italy by Invesco Asset Management SA Sede Secondaria, Via Cordusio 2, 20123 Milano, Italy. – Ireland by Invesco Global Asset Management Limited, , George’s Quay House, 43 Townsend Street, Dublin 2, Ireland, regulated by the
Central Bank of Ireland. – Japan by both Invesco Asset Management (Japan) Limited, 25th Floor, Shiroyama Trust Tower 3-1, Toranomon 4-chome Minato-ku,
Tokyo 105-6025, Japan which holds a Japan Kanto Local Finance Bureau Investment advisers license number 306 and also by Invesco Global Real Estate Asia Pacific, Inc., 13th Floor, Ark Mori Building 1-12-32, Akasaka, Minato-ku, Tokyo 107-6013, Japan which holds a Japan Kanto Local Finance Bureau Investment advisers license number 583.
– Singapore by Invesco Asset Management Singapore Limited, Tung Centre #10-03, 20 Collyer Quay, Singapore 049319. – Spain by Invesco Asset Management Sucursal en España, Calle Recoletos 15 — Piso1, 28001 Madrid, Spain. – Switzerland by Invesco Asset Management (Schweiz) AG, Stockerstrasse 14, CH-8002 Zürich, Switzerland. – the UK by Invesco Real Estate, a division of Invesco Asset Management Limited, 30 Finsbury Square, London, UK, EC2A 1AG, authorised
and regulated by the Financial Services Authority. – the United States of America by Invesco Advisers, Inc., Two Peachtree Pointe, 1555 Peachtree Street N.E., Atlanta, Georgia 30309, USA
and by Invesco Private Capital, Inc. and Invesco Senior Secured Management, Inc., 1166 Avenue of the America, New York, NY 10036.

22 Invesco Real Estate House View
Contact us
II-REHVG-COM-2 09/11
Invesco Real EstateThree Galleria Tower13155 Noel Road, Ste 500Dallas, TX 75240, USA
Portman Square House43-45 Portman SquareLondon, W1H 6LY, UK
41/F, Citibank Tower3 Garden RoadCentral, Hong Kong
This document is not an invitation to subscribe for shares in a fund nor is it to be construed as an offer to buy or sell any financial instruments. As with all investments, there are associated inherent risks. The information contained in this document may not have been prepared or tailored for any audience. It does not take into account individual objectives, taxation position or financial needs. Nor does this constitute a recommendation of the suitability of any investment strategy for a particular investor. While great care has been taken to ensure that the information contained herein is accurate, no responsibility can be accepted for any errors, mistakes or omissions or for any action taken in reliance thereon. You may only reproduce, circulate and use this document (or any part of it) with the consent of Invesco.