inventory valuation chapter 6 perpetual vs. periodic inventory (remember?) perpetual – updates...
TRANSCRIPT

INVENTORY VALUATIONINVENTORY VALUATION
CHAPTERCHAPTER
66

Perpetual vs. Periodic Inventory Perpetual vs. Periodic Inventory (Remember?)(Remember?)
Perpetual vs. Periodic Inventory Perpetual vs. Periodic Inventory (Remember?)(Remember?)
Perpetual – Updates inventory and cost of goods sold
after every purchase and sales transaction Periodic
– Delays updating of inventory and cost of goods sold until end of the period
– Misstates inventory during the period
This chapter covers the periodic inventory method in mind-numbing detail.

SOURCE OF INVENTORY VALUE:SOURCE OF INVENTORY VALUE:HOW DO YOU ALLOCATE OF INVENTORIABLE COSTS?HOW DO YOU ALLOCATE OF INVENTORIABLE COSTS?
SOURCE OF INVENTORY VALUE:SOURCE OF INVENTORY VALUE:HOW DO YOU ALLOCATE OF INVENTORIABLE COSTS?HOW DO YOU ALLOCATE OF INVENTORIABLE COSTS?
Beginning Inventory
Goods Purchased
during period
Cost of Goods Available for Sale
GAFS
Ending Inventory
(Balance Sheet)
Cost of Goods Sold (Income
Statement)
Not Sold
Sold
This means inventory valuation has two main effects:
1.Balance Sheet: current assets2.Income Statement: Cost of Goods Sold
Why?:
Because the value of the ending inventory determines how GAFS will be split between Inventory and COGS.

There are three reasons why the valuation of inventory is important:
1. Inventory is often the largest asset on a business’s balance sheet
2. COGS is usually the most significant expense on the income statement.
3. Due to the nature of a business’s cost structure (i.e. a small change in ending inventory = a big change in final Net Income).
THE SIGNIFICANCE OF THE SIGNIFICANCE OF INVENTORYINVENTORY
THE SIGNIFICANCE OF THE SIGNIFICANCE OF INVENTORYINVENTORY
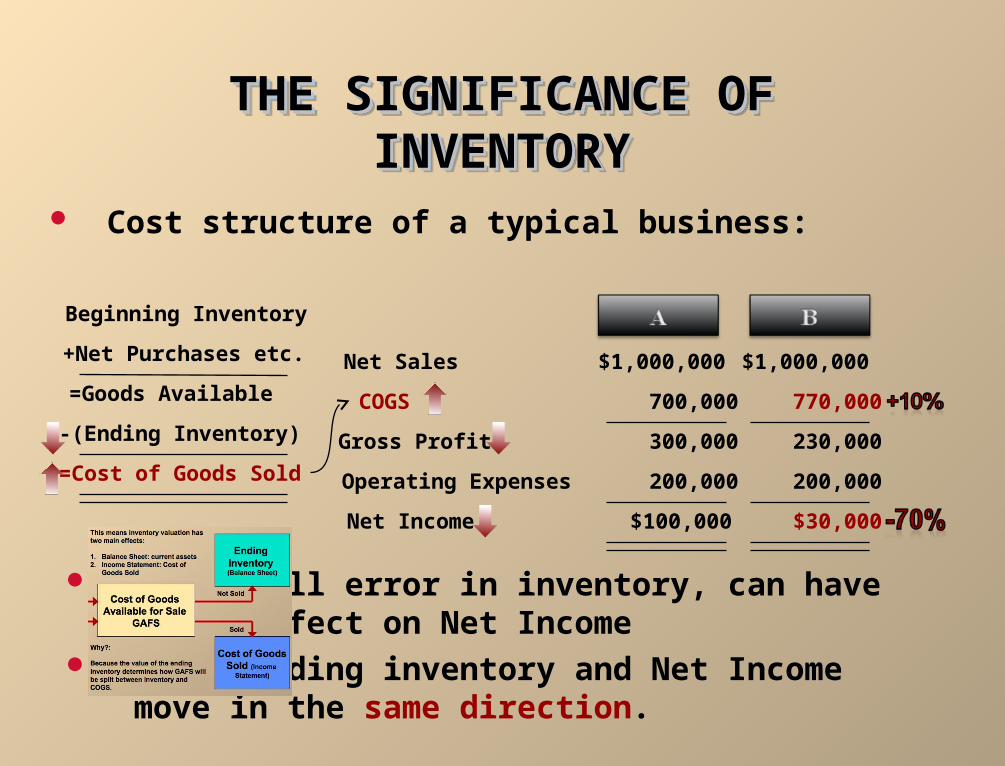
Cost structure of a typical business:
THE SIGNIFICANCE OF THE SIGNIFICANCE OF INVENTORYINVENTORY
THE SIGNIFICANCE OF THE SIGNIFICANCE OF INVENTORYINVENTORY
Net Sales
COGS
Gross Profit
Operating Expenses
Net Income
$1,000,000 $1,000,000
700,000 770,000
300,000 230,000
200,000 200,000
$100,000 $30,000
+Net Purchases etc.
Beginning Inventory
=Goods Available
-(Ending Inventory)
=Cost of Goods Sold
So a small error in inventory, can have a big effect on Net Income
NOTE: Ending inventory and Net Income move in the same direction.

Seller
Buyer
PublicCarrier
Co.
REVENUE RECOGNTION REVENUE RECOGNTION (TERMS OF SALE)(TERMS OF SALE)
REVENUE RECOGNTION REVENUE RECOGNTION (TERMS OF SALE)(TERMS OF SALE)
PublicCarrier
Co.
Buyer
Seller
Ownership passes to the buyer at the…
F.O.B. F.O.B.
Shipping Point Destination
Ownership does not pass to the buyer until the…
…and thus the buyer pays for the shipping!
…and thus the seller pays for the shipping!
As well, you must include
these goods in your inventory count if not yet
delivered.

In order to prepare financial statements, you must determine:
1. The number of units of inventory owned, and
2. Value them.
The determination of inventory quantities involves:1. Counting goods on hand, and
2. Determining the ownership of goods.
ENDING INVENTORY ENDING INVENTORY VALUATIONVALUATION
DETERMINING INVENTORY QUANTITIESDETERMINING INVENTORY QUANTITIES
ENDING INVENTORY ENDING INVENTORY VALUATIONVALUATION
DETERMINING INVENTORY QUANTITIESDETERMINING INVENTORY QUANTITIES

TAKING THE PHYSICAL INVENTORYTAKING THE PHYSICAL INVENTORYTAKING THE PHYSICAL INVENTORYTAKING THE PHYSICAL INVENTORY
A company should adhere to internal control principles in order to minimize errors and fraud in inventory counts:1. Segregation of duties Employees who do not have custodial responsibility for the inventory should do the counting.
2. Establishment of responsibility Each counter should establish authenticity of each inventory item.
3. Independent verification Another employee should make a second count. At the end of the count, a supervisor should ascertain that all inventory items are tagged and that no items have more than one tag.
4. Documentation procedures All inventory tags should be pre-numbered and accounted for.

INVENTORY VALUATIONINVENTORY VALUATIONMETHOD 1: ACTUAL PHYSICAL FLOW COSTINGMETHOD 1: ACTUAL PHYSICAL FLOW COSTING
INVENTORY VALUATIONINVENTORY VALUATIONMETHOD 1: ACTUAL PHYSICAL FLOW COSTINGMETHOD 1: ACTUAL PHYSICAL FLOW COSTING
The specific identification method tracks the actual physical flow of the goods.
Each item of inventory is marked, tagged, or coded with its specific unit cost.
It is most frequently used when the company sells a limited variety of high unit-cost items.

INVENTORY VALUATIONINVENTORY VALUATIONMETHOD 2:USE ASSUMED COST FLOW METHODSMETHOD 2:USE ASSUMED COST FLOW METHODS
INVENTORY VALUATIONINVENTORY VALUATIONMETHOD 2:USE ASSUMED COST FLOW METHODSMETHOD 2:USE ASSUMED COST FLOW METHODS
Other cost flow methods are allowed since specific identification is often impractical.
These methods assume flows of costs that may be unrelated to the actual physical may be unrelated to the actual physical flow of goodsflow of goods.
Cost flow assumptions:1. First-in, first-out (FIFO).2. Last-in, first-out (LIFO). 3. Average Cost.
Achtung !

FIFO (First In, First Out)FIFO (First In, First Out)FIFO (First In, First Out)FIFO (First In, First Out)
The FIFO method assumes that the earliest goods purchased are the first to be sold.– (This often reflects the actual physical flow of
merchandise).
Under FIFO, the first goods purchased in the period are assumed to be the first sold
The ending inventory consists of the most recently purchased.

LIFO (Last In, First Out)LIFO (Last In, First Out)
First goods purchased remain in ending inventory.– (Seldom coincides with the actual physical flow
of inventory).
Rarely used in Canada.

AVERAGE COSTAVERAGE COSTAVERAGE COSTAVERAGE COST
The average cost method assumes that the goods available for sale are homogeneous.
The allocation of the cost of goods available for sale is made on the basis of the weighted average unit cost incurred.

Ending Inventory
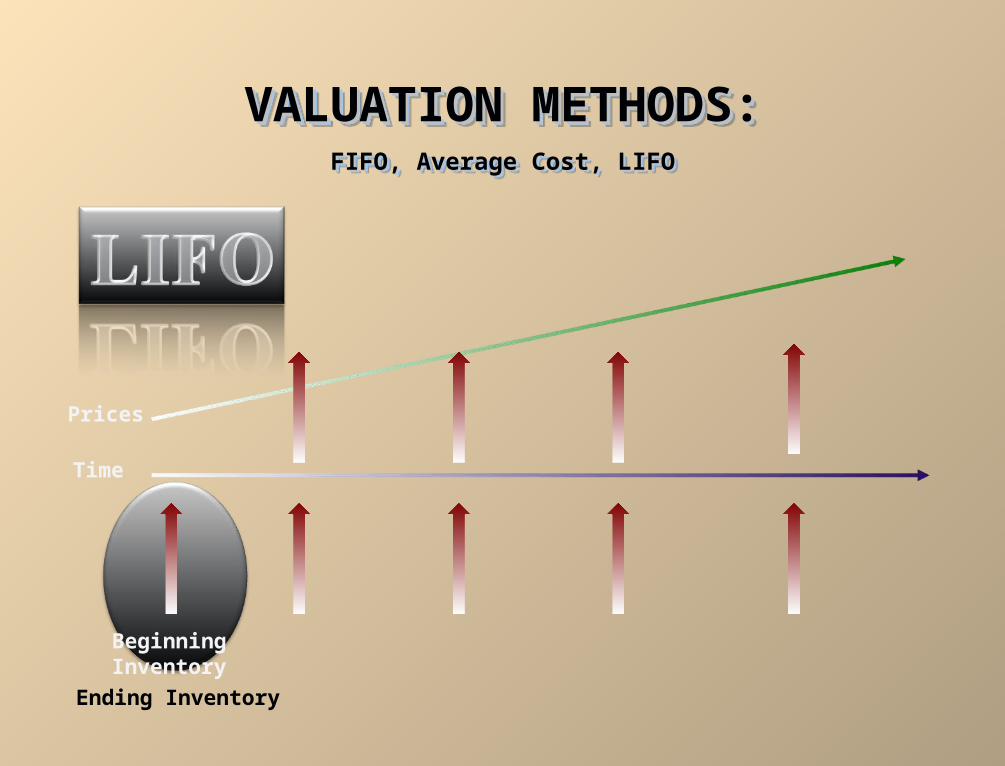
VALUATION METHODS:VALUATION METHODS:FIFO, Average Cost, LIFOFIFO, Average Cost, LIFO
VALUATION METHODS:VALUATION METHODS:FIFO, Average Cost, LIFOFIFO, Average Cost, LIFO
Time
Prices
BeginningInventory

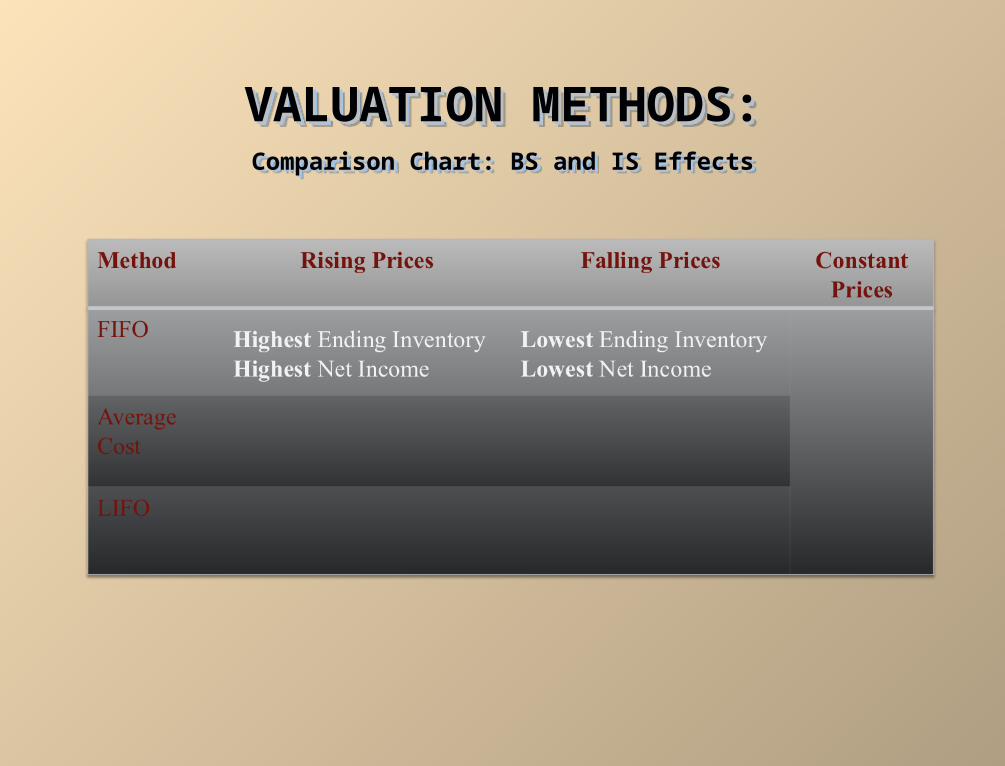
VALUATION METHODS:VALUATION METHODS:Comparison Chart: BS and IS EffectsComparison Chart: BS and IS Effects
VALUATION METHODS:VALUATION METHODS:Comparison Chart: BS and IS EffectsComparison Chart: BS and IS Effects

Ending Inventory
VALUATION METHODS:VALUATION METHODS:FIFO, Average Cost, LIFOFIFO, Average Cost, LIFO
VALUATION METHODS:VALUATION METHODS:FIFO, Average Cost, LIFOFIFO, Average Cost, LIFO
Time
Prices
BeginningInventory
VALUATION METHODS:VALUATION METHODS:Comparison Chart: BS and IS EffectsComparison Chart: BS and IS Effects
VALUATION METHODS:VALUATION METHODS:Comparison Chart: BS and IS EffectsComparison Chart: BS and IS Effects
Ending Inventory
VALUATION METHODS:VALUATION METHODS:FIFO, Average Cost, LIFOFIFO, Average Cost, LIFO
VALUATION METHODS:VALUATION METHODS:FIFO, Average Cost, LIFOFIFO, Average Cost, LIFO
Time
Prices
BeginningInventory

VALUATION METHODS:VALUATION METHODS:Comparison Chart: BS and IS EffectsComparison Chart: BS and IS Effects
VALUATION METHODS:VALUATION METHODS:Comparison Chart: BS and IS EffectsComparison Chart: BS and IS Effects

VALUATION METHODS:VALUATION METHODS:Comparison Chart: BS and IS EffectsComparison Chart: BS and IS Effects
VALUATION METHODS:VALUATION METHODS:Comparison Chart: BS and IS EffectsComparison Chart: BS and IS Effects

VALUATION METHODS:VALUATION METHODS:Comparison Chart: BS and IS EffectsComparison Chart: BS and IS Effects
VALUATION METHODS:VALUATION METHODS:Comparison Chart: BS and IS EffectsComparison Chart: BS and IS Effects

In Summary:In Summary:INCOME STATEMENT EFFECTSINCOME STATEMENT EFFECTS
In Summary:In Summary:INCOME STATEMENT EFFECTSINCOME STATEMENT EFFECTS
In periods of rising prices, FIFO reports the highest net income, LIFO the lowest and average cost falls in the middle.
The reverse is true when prices are falling. When prices are constant, all cost flow
methods will yield the same results.

FIFO produces the best balance sheet valuation. This
is because the inventory costs are closer to their
current, or replacement, costs (since what’s left is the
most recently purchased).
In Summary:In Summary:
BALANCE SHEET EFFECTSBALANCE SHEET EFFECTS
In Summary:In Summary:
BALANCE SHEET EFFECTSBALANCE SHEET EFFECTS
Why?

INVENTORY VALUATION AND THE INVENTORY VALUATION AND THE CONSISTENTCY GAAPCONSISTENTCY GAAP
INVENTORY VALUATION AND THE INVENTORY VALUATION AND THE CONSISTENTCY GAAPCONSISTENTCY GAAP
A company needs to use its chosen cost flow method consistently from one accounting period to another.
Such consistent application enhances the comparability of financial statements over successive fiscal periods.
When a company adopts a different cost flow method, the change and its effects on net income should be disclosed in the financial statements.

Both beginning and ending inventories appear on the income statement for the periodic method.
The ending inventory of one period automatically becomes the beginning inventory of the next period.
An inventory error in this period, affects:– COGS in this period, and thus– Net income in this period, as well as– Ending inventory in this period, and – Beginning inventory next period
INVENTORY ERRORS - INVENTORY ERRORS - INCOME STATEMENT EFFECTSINCOME STATEMENT EFFECTS
INVENTORY ERRORS - INVENTORY ERRORS - INCOME STATEMENT EFFECTSINCOME STATEMENT EFFECTS
Example: Ending Inventory is overstated.

The effect of ending inventory errors on the balance sheet can be determined by using the basic accounting equation:
Assets = Liabilities + Owner’s Equity
ENDING INVENTORY ERROR – ENDING INVENTORY ERROR – BALANCE SHEET EFFECTSBALANCE SHEET EFFECTS
ENDING INVENTORY ERROR – ENDING INVENTORY ERROR – BALANCE SHEET EFFECTSBALANCE SHEET EFFECTS
Overstated Overstated None Overstated Understated Understated None Understated

When the value of inventory is lower than the cost, the inventory is written down to its market value.
This is known as the lower of cost and market method.
Market is defined as replacement cost or net realizable value.
VALUING INVENTORY AT THE VALUING INVENTORY AT THE LOWER OF COST AND MARKETLOWER OF COST AND MARKETVALUING INVENTORY AT THE VALUING INVENTORY AT THE
LOWER OF COST AND MARKETLOWER OF COST AND MARKET

ALTERNATIVE LOWER OF COST ALTERNATIVE LOWER OF COST AND MARKET RESULTSAND MARKET RESULTS
Total Method2,000
Item by Item Method9,000
Date Particulars Debit CreditDec. 31 Loss on write down of inventory to LCM 2,000
Inventory 2,000
(Total Method)
Do the following Problems:
P6-4A
P6-5A
P6-6A
P6-8A (c & d)