inventory valuation
DESCRIPTION
Solution to Inventory Valuation problems.TRANSCRIPT
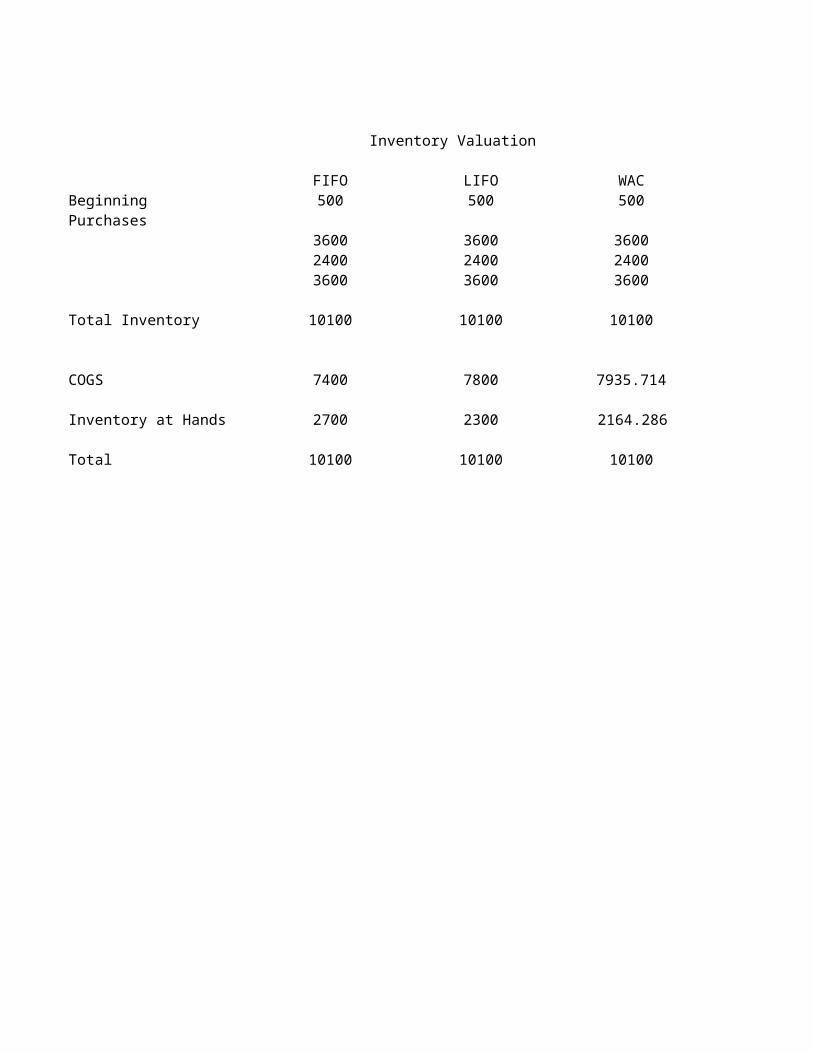
Inventory Valuation
FIFO LIFO WACBeginning 500 500 500Purchases
3600 3600 36002400 2400 24003600 3600 3600
Total Inventory 10100 10100 10100
COGS 7400 7800 7935.714
Inventory at Hands 2700 2300 2164.286
Total 10100 10100 10100
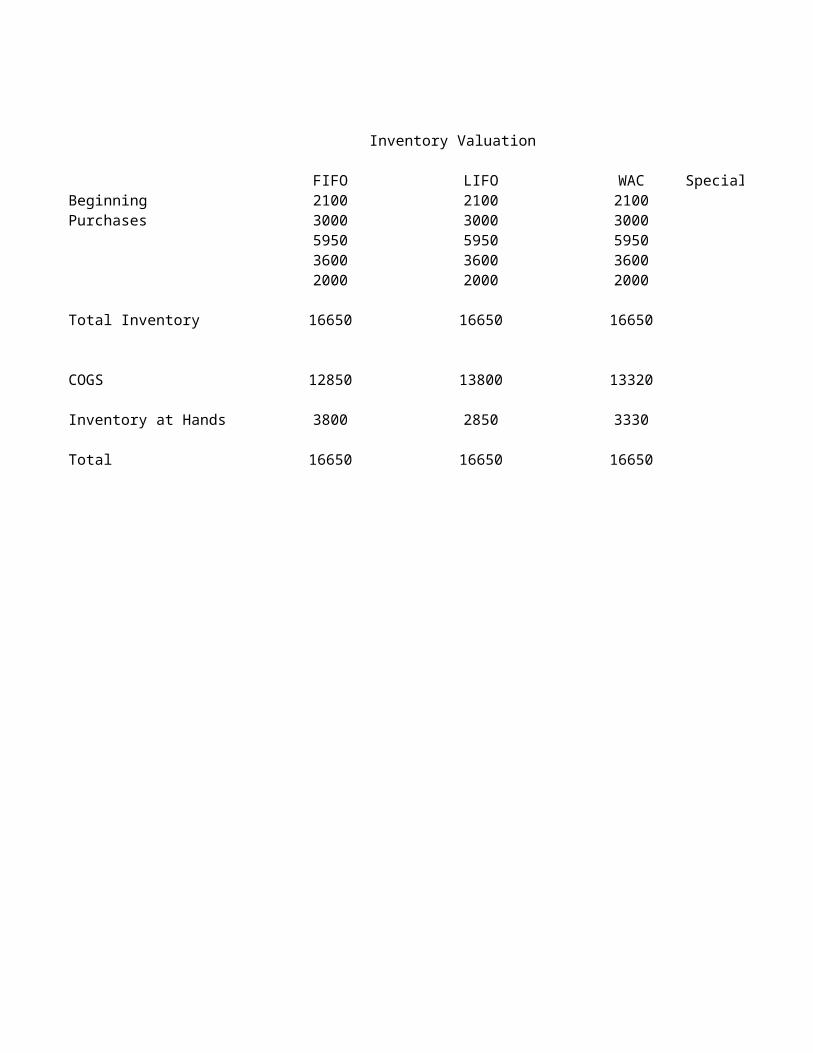
Inventory Valuation
FIFO LIFO WAC Special IdentificationBeginning 2100 2100 2100 2100Purchases 3000 3000 3000 3000
5950 5950 5950 59503600 3600 3600 36002000 2000 2000 2000
Total Inventory 16650 16650 16650 16650
COGS 12850 13800 13320 13310
Inventory at Hands 3800 2850 3330 3340
Total 16650 16650 16650 16650

Special Identification

Inventory Valuation
FIFO LIFOBeginning 80 80Purchases 200 200
350 350180 180
Total Inventory 810 810
COGS 560 605
Inventory at Hands 250 205
Total 810 810

Inventory Valuation
FIFO LIFO
Purchases 200 200350 350180 180
Total Inventory 730 730
COGS 480 525
Inventory at Hands 250 205
Total 730 730
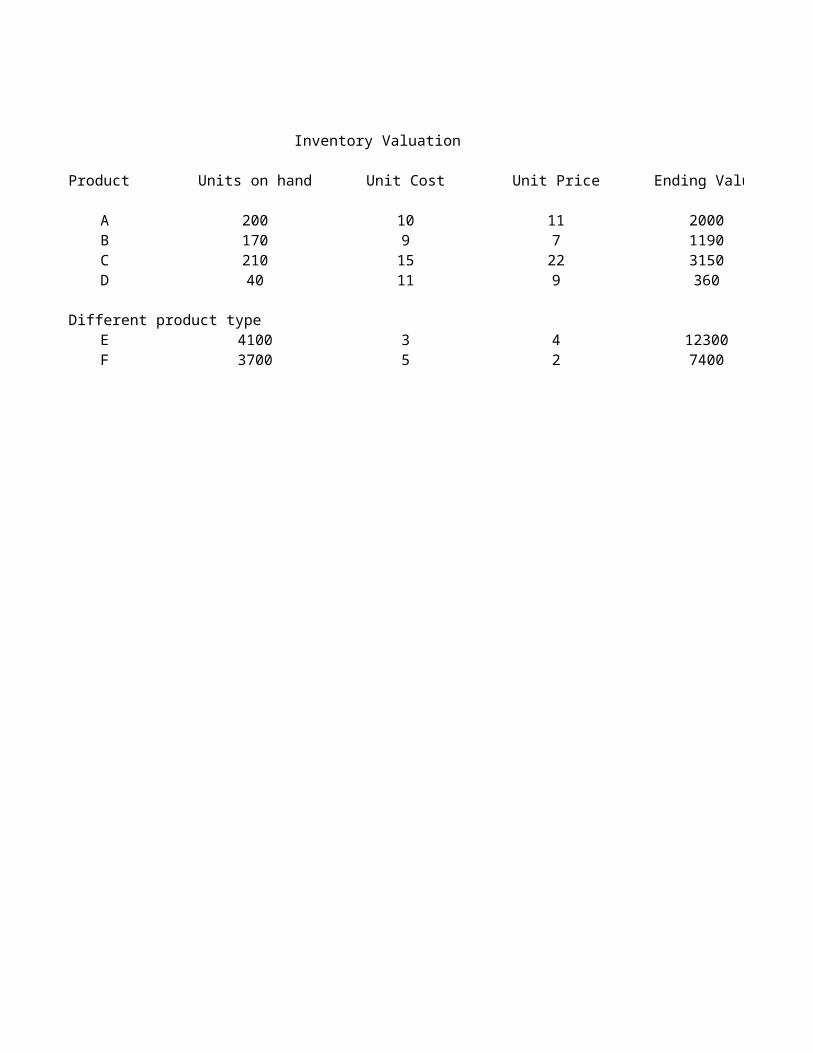
Inventory Valuation
Product Units on hand Unit Cost Unit Price Ending Value
A 200 10 11 2000B 170 9 7 1190C 210 15 22 3150D 40 11 9 360
Different product typeE 4100 3 4 12300F 3700 5 2 7400

Fairdeal Income statement
2007 2008
Net Sales 22860 Net Sales 24500
Inventory InventoryBeginning 4790 Beginning 4810Purchases 18300 Purchases 19580
23090 24390
Ending Inventory 4650 Ending Inventory 5320
COGS 18440 COGS 19070Gross Profit 4420 Gross Profit 5430Expenses 2310 Expenses 2310Net profit 2110 Net profit 3120
There is a difference of Rs.70 due to the mistakes committed in the inventory

5230

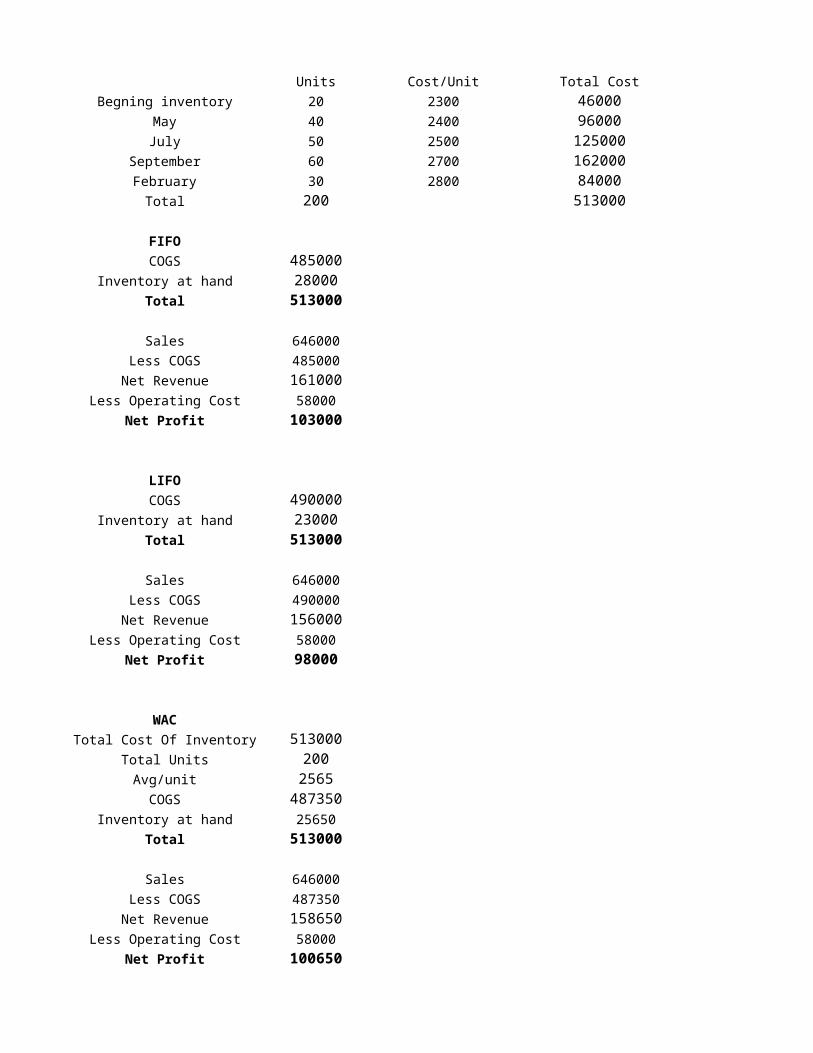
Units Cost/Unit Total Cost
Begning inventory 20 2300 46000May 40 2400 96000July 50 2500 125000
September 60 2700 162000February 30 2800 84000
Total 200 513000
FIFO
COGS 485000Inventory at hand 28000
Total 513000
Sales 646000
Less COGS 485000
Net Revenue 161000Less Operating Cost 58000
Net Profit 103000
LIFO
COGS 490000Inventory at hand 23000
Total 513000
Sales 646000
Less COGS 490000
Net Revenue 156000Less Operating Cost 58000
Net Profit 98000
WAC
Total Cost Of Inventory 513000Total Units 200
Avg/unit 2565COGS 487350
Inventory at hand 25650
Total 513000
Sales 646000
Less COGS 487350
Net Revenue 158650Less Operating Cost 58000
Net Profit 100650
FIFO
Receipts Shipments Balance
Dates Units Unit Cost Total Units Unit Cost Total Units Unit Cost
1-Feb 20 140
4-Feb 50 142 7100 70
7-Feb 30 4220 40
10-Feb 60 145 8700 100
14-Feb 20 2840 80
20-Feb 30 147 4410 110
26-Feb 40 5740 70
29-Feb 80 148 11840 150
LIFO
Receipts Shipments Balance
Dates Units Unit Cost Total Units Unit Cost Total Units Unit Cost
1-Feb 20 140
4-Feb 50 142 7100 70
7-Feb 30 4260 40
10-Feb 60 145 8700 100
14-Feb 20 2900 80
20-Feb 30 147 4410 110
26-Feb 40 5860 70
29-Feb 80 148 11840 150
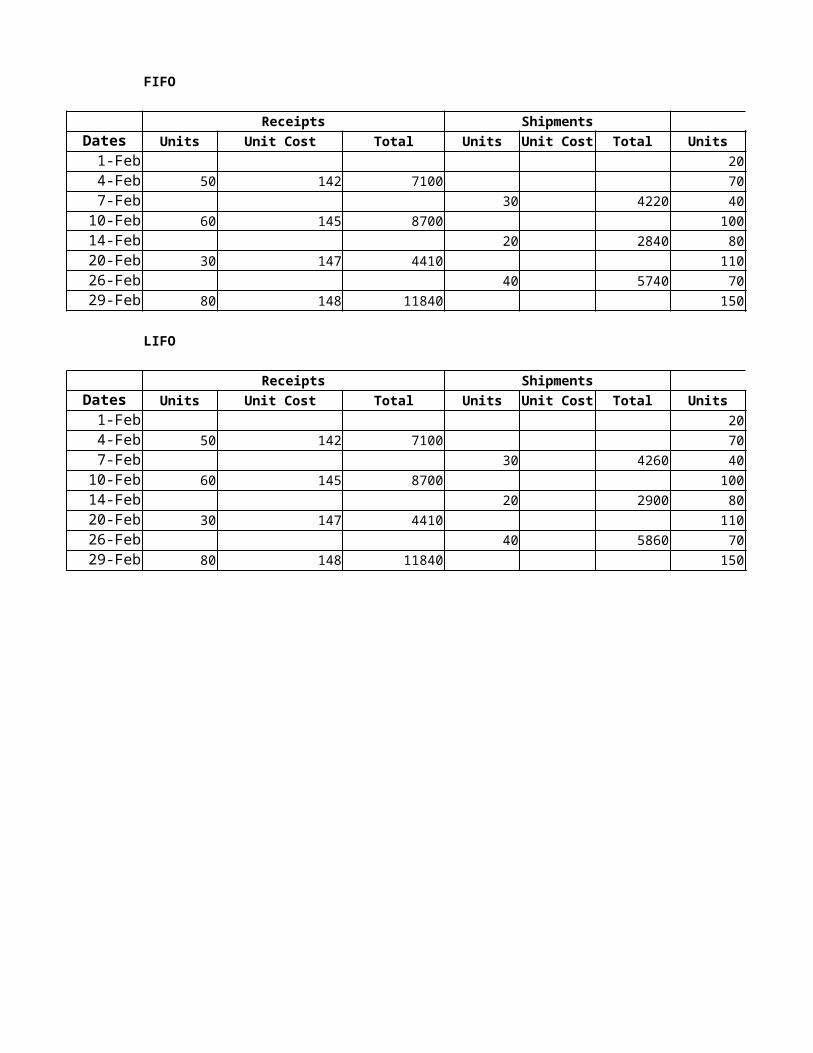
Balance
Total
2800
9900
5680
14380
11540
15950
10210
22050
Balance
Total
2800
9900
5640
14340
11440
15850
9990
21830

Sanu CompanyInventory Valuation
Units on hand Unit Cost Unit Price After Commission & Del.Product Group 1A 134 210 450 480 495A 156 140 530 670 583N 278 65 480 520 528P 345 83 510 360 561
Product Group 2R 098 13 650 800 800R 112 17 750 760 900T 034 26 680 740 816T 041 19 610 780 732

After Commission & Del. Ending Value
100800816203380029880
10400129201924013908

Units Cost/Unit Total Cost
Begning inventory 10000 18 180000Purchases 15000 19 285000
10000 21 21000020000 22 44000010000 23 230000
Total 65000 1345000
FIFO
COGS 1005000Inventory at hand 340000Total 1345000
Sales 1400000
Less COGS 1005000
Gross Revenue 395000Less Operating Cost 185000
Revenue 210000Income Taxes 84000
Net Profit 126000
LIFO
COGS 1070000Inventory at hand 275000Total 1345000
Sales 1400000
Less COGS 1070000
Gross Revenue 330000Less Operating Cost 185000
Revenue 145000Income Taxes 58000
Net Profit 87000
2. The company is benefitted by LIFO method when it comes to income tax reporting as we can see the NET Profit is down by $ 39000 and the Income tax is reduced by $ 26000, but there is a trade-off between the
Shareholder's reporting as we need to more liquidity for investor confidence.

Units Cost/Unit Total Cost
Begning inventory 10000 18 180000Purchases 15000 19 285000
10000 21 21000020000 22 44000010000 23 23000015000 25 375000
Total 80000 1720000
FIFO
COGS 1005000Inventory at hand 715000Total 1720000
Sales 1400000
Less COGS 1005000
Gross Revenue 395000Less Operating Cost 185000
Revenue 210000Income Taxes 84000
Net Profit 126000
LIFO
COGS 1150000Inventory at hand 570000Total 1720000
Sales 1400000
Less COGS 1150000
Gross Revenue 250000Less Operating Cost 185000
Revenue 65000Income Taxes 26000
Net Profit 39000
3. When the company is buying additional 15000 CDs by LIFO method its margins & profits are further reduced and the NET profit comes
down to $39000

Goodwill
2007 2008
Net Sales 547200 Net Sales 434000
Inventory InventoryBeginning 73200 Beginning 65900Purchases 481700 Purchases 398100
554900 446000
Ending Inventory 65900 Ending Inventory 51900
COGS 489000 COGS 412100Gross Profit 58200 Gross Profit 21900Expenses 28700 Expenses 31200Net profit 29500 Net profit -9300
There is a difference of Rs.20200 due to the mistakes committed in the inventory

20200

Mohan FurnitureUnits Cost/Unit Total Cost
Begning inventory 20 1000 20000March 20 1100 22000June 10 1200 12000August 30 1300 39000November 20 1400 28000Total 100 121000
FIFO
COGS 107000Inventory at hand 14000Total 121000
Sales 144000
Less COGS 107000
Net Revenue 37000Less Operating Cost 16000
Net Profit 21000
LIFO
COGS 111000Inventory at hand 10000Total 121000
Sales 144000
Less COGS 111000
Net Revenue 33000Less Operating Cost 16000
Net Profit 17000
WAC
Total Cost Of Inventory 121000Total Units 100Avg/unit 1210COGS 108900Inventory at hand 12100
Total 121000
Sales 144000
Less COGS 108900
Net Revenue 35100Less Operating Cost 16000
Net Profit 19100

Swimming Caps CompanyFIFO
Receipts Shipments Balance
Dates Units Unit Cost Total Units Unit Cost Total Units Unit Cost Total
1-Nov 40 70 2800
3-Nov 80 71 5680 120 8480
8-Nov 100 7060 20 1420
15-Nov 40 73 4380 60 5800
17-Nov 50 3610 10 2190
21-Nov 30 74 2220 40 4410
26-Nov 30 76 2280 70 6690
28-Nov 20 1470 50 5220
LIFO
Receipts Shipments Balance
Dates Units Unit Cost Total Units Unit Cost Total Units Unit Cost Total
1-Nov 40 70 2800
3-Nov 80 71 5680 120 8480
8-Nov 100 7080 20 1400
15-Nov 40 73 4380 60 5780
17-Nov 50 4320 10 1460
21-Nov 30 74 2220 40 3680
26-Nov 30 76 2280 70 5960
28-Nov 20 1520 50 4440

Mario CompanyInventory Valuation
Units on hand Unit Cost Unit Price After Commission & Del.Product Group 1A 087 130 210 280 231C 134 170 230 300 253F 169 100 250 260 275J 314 120 220 200 242
Total Inventory
Product Group 2P 518 10 890 920 1078S 098 20 850 970 1030U 126 35 720 840 874Y 376 10 780 800 946
Total Inventory

After Commission & Del. Ending Value
30030430102600024000
123040
920019400294008000
66000

Units Cost/Unit Total Cost
Begning inventory 1000 70 70000 Begning inventory
Purchases 5000 75 375000 Purchases
8000 76 6080009000 80 720000
Total 23000 1773000Total
FIFO
COGS 1533000 FIFO
Inventory at hand 240000 COGS
Total 1773000 Inventory at hand
Total
Sales 2400000
Less COGS 1533000 Sales
Gross Revenue 867000 Less COGS
Less Operating Cost 365000 Gross Revenue
Revenue 502000 Less Operating Cost
Income Taxes 150600 Revenue
Income Taxes
Net Profit 351400Net Profit
LIFO
COGS 1553000 LIFO
Inventory at hand 220000 COGS
Total 1773000 Inventory at hand
Total
Sales 2400000
Less COGS 1553000 Sales
Gross Revenue 847000 Less COGS
Less Operating Cost 365000 Gross Revenue
Revenue 482000 Less Operating Cost
Income Taxes 144600 Revenue
Income Taxes
Net Profit 337400Net Profit
2. The company is benefitted by LIFO method when it comes to income tax reporting as we can see the NET Profit is down
by $ 14000 and the Income tax is reduced by $ 6000, but there is a trade-off between the Shareholder's reporting as we need
to more liquidity for investor confidence.
3. When the company is buying additional 4000 CDs by LIFO method its margins & profits are further
reduced and the NET profit comes down to $41300

Units Cost/Unit Total Cost
1000 70 700005000 75 3750008000 76 6080009000 80 7200004000 85 340000
27000 2113000
1533000580000
2113000
2400000
1533000
867000365000
502000150600
351400
1592000521000
2113000
2400000
1592000
808000365000
443000132900
310100
3. When the company is buying additional 4000 CDs by LIFO method its margins & profits are further
reduced and the NET profit comes down to $41300

Assesment of Damage
Girdhar Clothing Company
Starting 17200Purchased 145200Goods available 162400
Sales 196500COGS 157200Expense 8100Profit Margin 149100
Loss Due to fire 5200

In event of rise of 2% in selling price
Girdhar Clothing Company
Starting 17200Purchased 145200Goods available 162400
Sales 200430COGS 157200Expense 8100Profit Margin 149100
Loss Due to fire 5200
In event of of rise of 2% in selling price the cost of goods damaged remains same

Ans 17 (i)
Ans 17 (ii)Noble Crus definitely uses LIFO
Ans 17 (iii)
The Wine Investment fund accounts for portflio consisting companies that use the LIFO method which shows profits even during the bearish market. This will help in pricing the funds costlier than general Index
The defense clearly states that they are not using genuine method of accounting and shall place the proper accounting in the coming year.