inventory optimization as an essential part of your siop process- our vision at solventure
TRANSCRIPT
Inventory Optimization as an Essential Part of your SiOP Process? Our vision at Solventure. by Prof.dr. Bram Desmet, Managing Director at Solventure

Inventory Optimization as an Essential Part of your SiOP At Solventure we take pride in being experts in designing and implementing Sales, Inventory and Operations
Planning. Companies that have a good SiOP process can’t imagine how to live without it. It is the key instrument for the CEO to navigate the business along the budget towards its strategic targets. For a summary of our vision on SiOP, we refer to our position paper “Sales, Inventory and Operations Planning (SiOP). Our vision at Solventure.” It can be found at www.slideshare.net/solventure.
In this vision paper, we discuss how inventory,
next to cost and service, has become a more important element of the SiOP equation. We will also provide answers on how we believe inventories can be put at a more effective use or basically how inventories can be reduced,
while at the same time improving service and
cost.
We also refer to a separate vision paper1 on how we
believe multi-echelon inventory optimization, as a more advanced form, is still an unexplored opportunity, for even many of the leading companies. In the Gartner terminology, multi-echelon is a ‘system of differentiation’, an app which can be plugged in on a
‘system of record’. In this vision paper, we describe the
functionality a system of record should have.
1 – “Multi-Echelon Inventory Optimization. Our vision at Solventure.” at
www.slideshare.net/solventure
Companies are under pressure to reduce
inventory
In our experience, the pressure on working
capital has increased since the financial crisis.
Working capital is composed of Accounts
Payable, Accounts Receivable and Inventory.
The Payables and Receivables are relatively
easy to manage. You try to extend payment
terms to suppliers, shorten those of customers,
and improve discipline to collect due invoices.
Inventory is much more difficult. At the center
of our SiOP framework you will find the Supply
Chain Triangle. Reducing inventory is a balance
between service, cost and inventory. I’ve heard
CEO’s telling their board “I can easily halve the
inventory … but we’ll be out of business in 2
years”. A blind cut in inventories will have a
negative impact on service towards the
customer, and service is a driver for top-line.
The resulting service issues will also increase
operational costs because of firefighting. We will break
the optimal sequence in production and we will expedite
orders trying to fight the service issues. We describe
the delicate balancing act and how companies struggle
with it in more detail in our vision paper “Balancing
Service Cost and Cash in the Supply Chain Triangle”,
which can also be found on
www.slideshare.net/solventure.
The trick of ‘escaping’ the pressure in the triangle is to
find ways to improve on all 3 dimensions at the same
time: reduce inventory, while at the same time
improving service and cost. Improved forecasting and
improved supply planning are typical examples. In this
vision paper we will show how inventory optimization is
a third one in its own right.
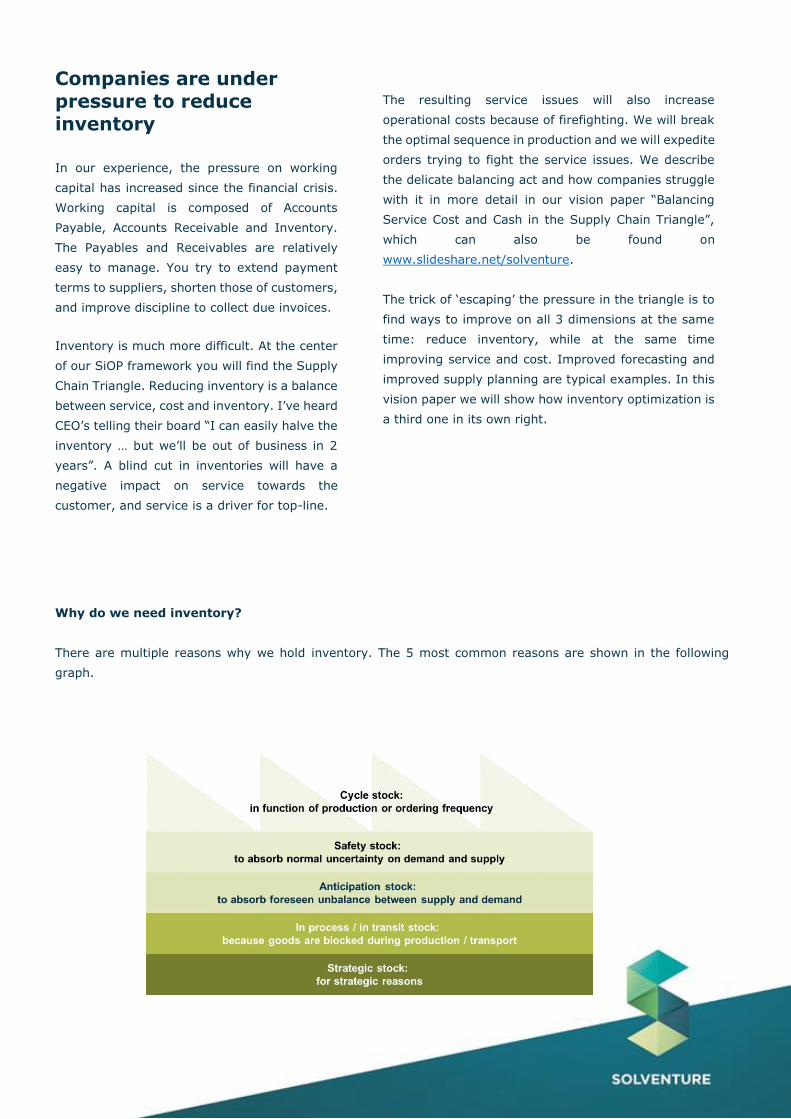
Why do we need inventory?
There are multiple reasons why we hold inventory. The 5 most common reasons are shown in the following
graph.

Cycle stock results from the need to produce or
order in batches. The lean philosophy works
towards a 1-piece flow. As long as we’re not there
and are confronted with significant changeover or
ordering cost, the EOQ principle teaches us it’s
more economical to produce in batches. If we
produce once a month, the average cycle stock will
be 2 weeks. If we produce once a week, the
average cycle stock will be half a week. The EOQ
shows us that optimal batch sizes go up when we
are confronted with higher change-over/order costs
or when the product cost goes down. They are
primary drivers of the amount of cycle stock.
Safety stock is a buffer against uncertainty. It will
typically look at the forecast error, the average lead
time and the variance on that lead time. More
advanced variants will look at factors like yield or
quality loss. A second element in the safety stock is
the service level. The service levels are typically
converted into a k- or z-factor that defines how
many times we will cover for the uncertainty. They
are 2 separate things. We can have a product with
low uncertainty but require a very high service
level. We can have products with a high uncertainty
but accept a low service level, for instance if there
are multiple substitutes available.
Anticipation stock is typically the result from your
supply planning process. I may build up stock to
anticipate a seasonal peak, a tender or a shutdown.
This type of planning decisions leads to so-called
anticipation stock.
As long as we have lead times we will have
inventory sitting on the production floor or sitting
on trucks, trains or boats. We call this the work-in-
process or transit stock.
Improving flow in production can reduce the work-in-
process. Optimizing transport routes can reduce the
stock in transit.
Strategic stock is carried to manage potential risks,
e.g. an expected price increase or a shortage in a key
raw material. As opposed to a plant shutdown these
events are not sure. That makes the difference
between anticipation and strategic stock. You can
consider strategic stock more as a hedging and part of
risk management in the supply chain.
There are many other reasons companies carry
inventory. An example in retail is ‘presentation stock’.
We may need 5 pieces at minimum to fill the shelves
and make the product sell. This behaves like a
Minimum Order Quantity at the supply side. All these
are extra drivers for inventory. As a company it is
important that you list your key inventory drivers.
Adapt the classification to something that works for
you.
I see many companies where inventories increase with
20-30% over a 2-3 month period without knowing the
reason. The only way to explain is to look for and
monitor the underlying drivers. If you decide to keep
extra stock for strategic reasons, then document it
accordingly in you inventory plan! If you decide to keep
producing during a period of lower demand, document
the according stock increase in your inventory plan.
Show what you expect as inventory evolution and show
which drivers take it up or down!

A Practical Framework for Inventory Optimization
Multiple aspects come into play when we want to optimize our inventory. In this vision paper we make
abstraction of some of the more strategic questions like:
the design of our global manufacturing-distribution footprint, for which we assume a network
design exercise has been done and we have found the right trade-off between being close to the
customer on the one hand and controlling shipping, warehousing and inventory costs on the other
hand
defining and controlling the size of the product portfolio, for which we assume we have defined
our strategic positioning2, and for which we assume we have a ‘product management review’ in
place3
The next figure summarizes our vision on how to optimize your inventory. You start by defining inventory
policies, which are an input to defining the right inventory parameters. These are input to an inventory
planning process, which interacts with your supply planning process. All of these are forward looking. We
end by comparing the actual inventory versus the planned inventory, which provides the necessary
triggers to keep the two aligned and as close as possible. In the next sections we will elaborate on each
of these steps.
2 – Cfr. Our vision paper “Strategic benchmarking in the supply chain triangle” for a discussion on the 3
strategy options defined by Treacy & Wearsema and what their impact on the product portfolio is.
3 – Cfr. Our vision paper “Including Product Management into your SiOP Cycle” for a discussion on how to
keep control of the defined level of complexity

Setting your Inventory Policy
Make-To-Stock/Make-To-Order, or
Stock/Non-Stock
If you can avoid inventory, by working make-to-
order instead of make-to-stock, go ahead and do
so. The problem is that make-to-order increases
the customer lead time, and sales may argument
that a longer lead time, will reduce the customer
interest and as such sales. So how do we define
stock/non-stock or make-to-stock/make-to-order?
A common approach is to look at an ABC or
ABC/XYZ classification. We try to avoid stock for
slow movers, as they require more inventory and
their inventory is at a higher risk of being written
off. XYZ may look at cost of the product, for sure
we try to avoid inventory for the expensive slow
movers.
Though pragmatic, the approach does not account
for the competitive landscape. If I’m the only
supplier I can probably switch to non-stock without
impacting sales volumes. If I’m in a highly
competitive landscape no stock may mean no sales.
The approach also disregards margin. If the cost of
the product is 100 and I can sell it at 400, then
writing of 3 pieces is equal to losing 1 sale because
of not having inventory. Higher margins allow for
more inventory.
From these experiences we have developed a model
which compares a Make-To-Stock situation and a
Make-To-Order situation on the following two
characteristics:
what is the lost margin in % if we switch from
Make-To-Stock to Make-To-Order:
o this depends on the competitive
situation, cfr. Above
o and on the lead time for Make-To-
Stock versus Make-To-Order
what is the gain in inventory cost if we switch
from Make-To-Stock to Make-To-Order
As products mature and come near the end of the life
cycle we see that volumes decrease, because of price
competition margins decrease even faster, while we
need to keep more inventory (in days) to come to the
same service level. This will push end-of-life items
towards a non-stock situation, taking into account the
competitive situation (the % of lost margin when
switching to MTO) and the margin of the product.
The next 2 graphs compare a ‘typical’ stock/non-stock
policy with the ‘margin-driven’ stock/non-stock policy.
The graphs show the turnover in value (lines) and the
number of SKUs (bar charts) for different ratios of the
sales price versus the logistics price. If that ratio is less
than 1, we have negative margin products, if the ratio
is 2, we sell at double the cost price.
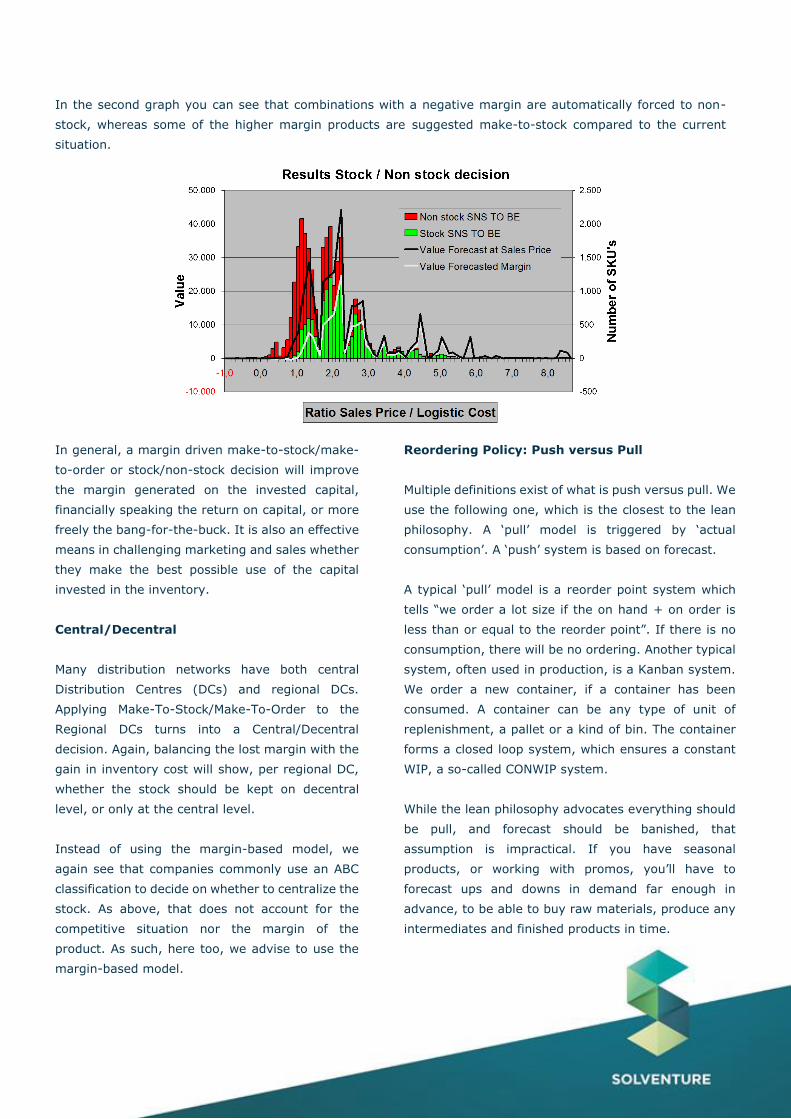
In the second graph you can see that combinations with a negative margin are automatically forced to non-
stock, whereas some of the higher margin products are suggested make-to-stock compared to the current
situation.
In general, a margin driven make-to-stock/make-
to-order or stock/non-stock decision will improve
the margin generated on the invested capital,
financially speaking the return on capital, or more
freely the bang-for-the-buck. It is also an effective
means in challenging marketing and sales whether
they make the best possible use of the capital
invested in the inventory.
Central/Decentral
Many distribution networks have both central
Distribution Centres (DCs) and regional DCs.
Applying Make-To-Stock/Make-To-Order to the
Regional DCs turns into a Central/Decentral
decision. Again, balancing the lost margin with the
gain in inventory cost will show, per regional DC,
whether the stock should be kept on decentral
level, or only at the central level.
Instead of using the margin-based model, we
again see that companies commonly use an ABC
classification to decide on whether to centralize the
stock. As above, that does not account for the
competitive situation nor the margin of the
product. As such, here too, we advise to use the
margin-based model.
Reordering Policy: Push versus Pull
Multiple definitions exist of what is push versus pull. We
use the following one, which is the closest to the lean
philosophy. A ‘pull’ model is triggered by ‘actual
consumption’. A ‘push’ system is based on forecast.
A typical ‘pull’ model is a reorder point system which
tells “we order a lot size if the on hand + on order is
less than or equal to the reorder point”. If there is no
consumption, there will be no ordering. Another typical
system, often used in production, is a Kanban system.
We order a new container, if a container has been
consumed. A container can be any type of unit of
replenishment, a pallet or a kind of bin. The container
forms a closed loop system, which ensures a constant
WIP, a so-called CONWIP system.
While the lean philosophy advocates everything should
be pull, and forecast should be banished, that
assumption is impractical. If you have seasonal
products, or working with promos, you’ll have to
forecast ups and downs in demand far enough in
advance, to be able to buy raw materials, produce any
intermediates and finished products in time.

What we have used in practice is the following rule.
Measure the ‘demand stability’ using the ‘coefficient
of variation’ (standard deviation divided by the
average demand). If the coefficient of variation is
less than 25%, then you should question the added
value of forecasting. Changes in the forecast may
add, instead of reduce the variability. For stable
demand products, a pull system may be more
effective than a push system. Combining push and
pull is a challenge for most major ERP systems. If
you decide to do so, look for a tool that can
accommodate both.
Target Service Levels ABC/XYZ
We see that many companies still use the same
service level for all products and customers. Our
approach to SiOP starts with a customer/product
segmentation. This can give crucial input on how to
differentiate service levels. We refer to our vision
paper on segmentation4 for how to approach this.
If you have not yet done a full customer/product
segmentation, an ABC/XYZ classification may be a
good alternative and starting point. The idea is that
you want to have lower service levels for slow
moving products. Customers know your market as
good as you do. They know which are the fast and
the slow movers. They will accept a lower service
level on slow moving products, where they will not
accept stock-outs for fast moving products. From
your side, it’s easier to score service with a cheaper
product compared to a more expensive product. If
you have a stock out, you don’t want it to be on the
nuts and the bolts, you want it to be on that
expensive engine! While ABC/XYZ is not accounting
for differences in customers, for differences in
strategic fit, it is a good starting point. Remember to
differentiate service levels, it will again help in
increasing the margin generated on the invested
capital.
Calculating your Inventory
Parameters
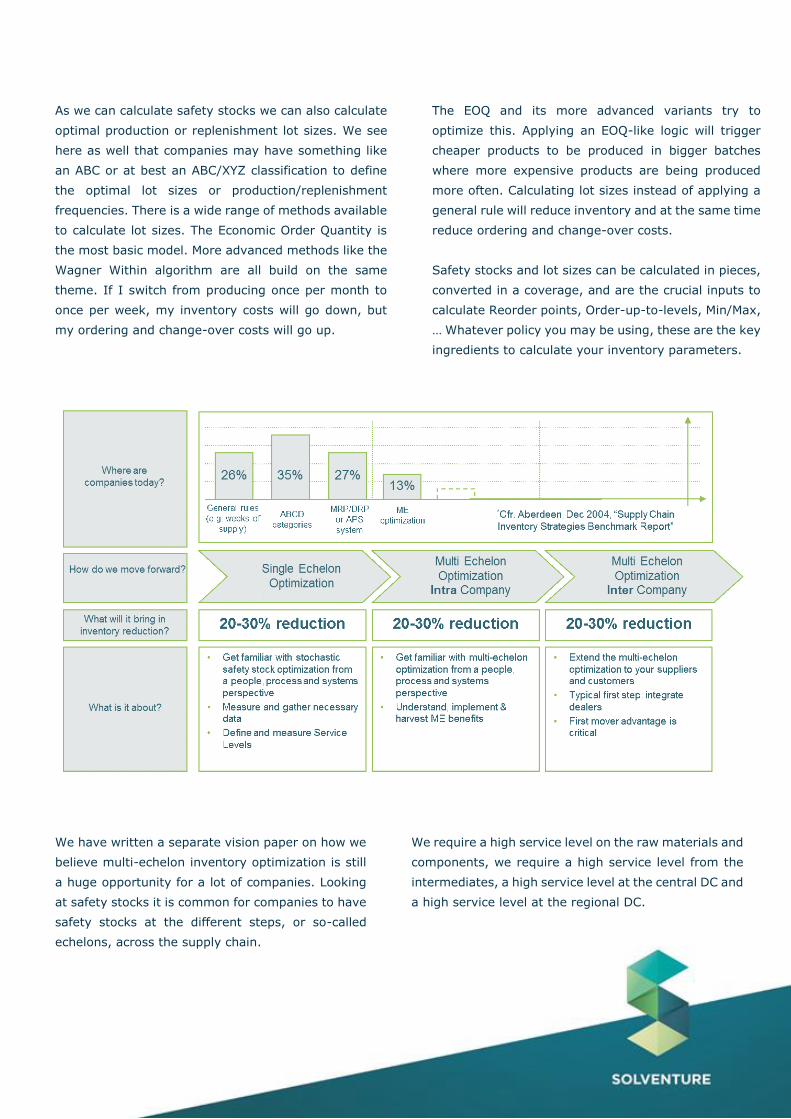
The following graph shows that many companies still
use very simplistic policies to define their inventory
parameters. When it comes to safety stocks, we just
put 2 weeks or 1 month of safety stock for all items.
1 step further is to apply an ABC/XYZ classification
and for instance to put some more safety stock on
the cheaper items, versus less on the more
expensive items, and to put some more on the
slower mover items, as they require higher coverage
to give a comparable service level.
A first real optimization step is to calculate your
safety stocks using a stochastic model. The simplest
and most known formula is SS = k.√L.σd. Safety
stock should account for the uncertainty over the
lead time. More advanced versions account for
forecast error, average lead time, lead time
reliability, quantity reliability … The k-factor is linked
to the service level and defines ‘how good we want
to protect ourselves against the uncertainty’. It’s a
separate decision. We can have a product with low
uncertainty but it requires a very high service level.
We can also have a product with high uncertainty
but allow a low service level because there are
substitutes, e.g. a 2l instead of a 1l packaging.
Applying this type of safety stock formula typically
reduces the safety stock while increasing the service
level. If we carry 1 month for all items, it means for
some items we are carrying too much, for others
we’re not carrying enough. When applying a safety
stock calculation, we will typically put less safety
stock for the fast movers and put more for the slow
movers. The redistribution of the safety stock will
positively affect the service level. If we reduce from
1 month to 2 weeks for a fast mover, it will have a
big impact. 2 weeks of demand on a fast mover is
huge. From that perspective we will not only
redistribute the safety stock but it will also be
reduced. We typically see a 20-30% reduction.
4 – http://www.slideshare.net/Solventure/segmenting-customers-and-products-in-b2b-environments
As we can calculate safety stocks we can also calculate
optimal production or replenishment lot sizes. We see
here as well that companies may have something like
an ABC or at best an ABC/XYZ classification to define
the optimal lot sizes or production/replenishment
frequencies. There is a wide range of methods available
to calculate lot sizes. The Economic Order Quantity is
the most basic model. More advanced methods like the
Wagner Within algorithm are all build on the same
theme. If I switch from producing once per month to
once per week, my inventory costs will go down, but
my ordering and change-over costs will go up.
The EOQ and its more advanced variants try to
optimize this. Applying an EOQ-like logic will trigger
cheaper products to be produced in bigger batches
where more expensive products are being produced
more often. Calculating lot sizes instead of applying a
general rule will reduce inventory and at the same time
reduce ordering and change-over costs.
Safety stocks and lot sizes can be calculated in pieces,
converted in a coverage, and are the crucial inputs to
calculate Reorder points, Order-up-to-levels, Min/Max,
… Whatever policy you may be using, these are the key
ingredients to calculate your inventory parameters.
We have written a separate vision paper on how we
believe multi-echelon inventory optimization is still
a huge opportunity for a lot of companies. Looking
at safety stocks it is common for companies to have
safety stocks at the different steps, or so-called
echelons, across the supply chain.
We require a high service level on the raw materials and
components, we require a high service level from the
intermediates, a high service level at the central DC and
a high service level at the regional DC.

In regrouping the supply chain uncertainties on the
customer facing echelon, we can significantly reduce
the safety stock in the supply chain. When looking at
lot sizes, the synchronization of lot sizes across the
supply chain can at the same time reduce inventory
and ordering/change-over costs.
The results of multi-echelon are often counter-
intuitive but rewarding. Review our vision paper5 on
multi-echelon for a more detailed discussion on how
multi-echelon works and what it can mean for your
company.
After the single or multi-echelon calculation, you
want the planner to be able to apply overrides.
Maybe there is a contractual agreement with the
customer to keep at minimum 20 days of safety
stock. There could also be good reasons to deviate
from the proposed lot sizes.
Where the calculations are clear about the ideal size,
you should always allow the planner to define
overrides to account for specific constraints.
Planning your Inventory
Next step in the inventory journey is to make the
safety stocks and lot sizes time-dependent.
Expressing the safety stock and lot sizes into weeks
and mapping it to the forecast will give a time-
dependent view on safety stocks and lot sizes.
For instance, for seasonal items, the safety stocks
will go up towards the high season and will be lower
in the low season. This also creates questions like
how to avoid a bull-whip? If my forecast goes from
100 to 200, my production goes from 100 to 200. If
my safety stock covers 1 month, my safety stock
should go from 100 to 200 as well … so my total
production goes from 100 to 300?
Smoothing the safety stock by taking an average of 2-
3 periods is common in avoiding a bull-whip.
The safety stock plus half a lot size is in fact the minimal
inventory you can carry. In practice there are multiple
reasons why, at least temporarily you will carry more
inventory. Some reasons will really be the result of your
supply planning process:
‘anticipation’ stock: if we do upfront production
to anticipate a shutdown, or a peak exceeding
the capacity (e.g. a seasonal peak, a promo or
a project or tender)
‘levelling’ stock: we may decide to keep running
at full capacity when demand is low, assuming
we will sell of the resulting inventory later in the
year, management may decide so to keep the
efficiency up and the cost down, we are
supporting the EBIT by creating more inventory
on the balance sheet
Some reasons are an input to the supply planning
process:
‘strategic stock’: I may decide to build up extra
inventory because I expect a shortage in the
market, this is ‘uncertain’ but I’m willing to take
the bet, this is an input to the supply planning
process
‘tender/project stock’: I may decide to start
building inventory for a tender or a project,
even if I’m not certain I will get the deal, again
this is an input to the supply planning process
So step 1 is making the safety and cycle stocks time-
dependent, then we add extra stock requirements such
as ‘strategic stock’ or ‘tender/project stock’. The supply
planning process will add other stocks like ‘anticipation
stock’ or ‘levelling stock’.
5 – http://www.slideshare.net/Solventure/including-multiechelon-inventory-optimization-in-
your-siop-cycle-our-vision-at-solventure

At the end of the ‘inventory planning’ it is key that we can:
Show the projected inventory over the next 3-18 months
Show the delta in inventory and the resulting cash consumption
Explain why the inventory is going up and down by showing the different inventory layers: safety
stocks, cycle stocks, anticipation stocks, levelling stocks, strategic stocks, tender/project stocks …
Many companies lack visibility on how inventories are expected to evolve and what are the underlying
drivers. As companies have become more cash aware this is not sustainable. We strongly recommend
installing an inventory planning process!
Monitoring and Controlling your Actual Inventory
There are multiple reasons why the actual inventory will deviate from the plan. You have sold less than
expected, production produced more than agreed, quality turns out better than on average, returns were
higher than expected, and the only way to keep up is to install a good monitoring and control process.
“Which inventory KPI’s do I need” is an often heard and read question. There are no real secrets here.
Companies follow their inventory in days of supply or turns, in value, in total or per region/product group.
Most companies report on Slow Moving and Obsolete (SLOB) as slow movers turn into write-offs and
finance is obliged to carry strict rules on how this is dealt with.
In general, we have to recommend the reporting of the ‘inventory balance’. Looking at a region/product
group, my total days in inventory will tell me if I’m right on target, however, some products may be out
of stock, some in safety stock, some in overstock and some in balance. Reporting on the ‘inventory
balance’ is a complimentary metric to the ‘inventory days’. It is like measuring the ‘bias’ and the ‘accuracy’
of the forecast. The Mean Percentage Error measures the over or under forecast. On the product group
level, the MPE may be zero but the MAPE may be 50% meaning we’re on average 50% off! We need to
do the same for the inventory!
Another opportunity is to identify rebalancing opportunities within the network. It may be ‘understocked’
in 1 location and ‘overstocked’ in another. Balancing the cost of transhipping with the risk of a recall or
write-off can improve the cost/inventory balance in the network!

In conclusion,
In general, we can say that in many companies
we have seen the pressure on inventory
increase. In contrast, a lot of those companies
are still missing a proper inventory
management process.
It all starts with setting the right inventory
policies. What is our MTS/MTO or Stock/Non-
Stock policy? How do we balance the generated
margin with the cost of the inventory? For the
MTS items, many companies are stuck in
simplistic inventory policies. Some have moved
on to calculating safety stock and lot sizes but
in general there remains a huge opportunity in
optimizing your inventory. Inventory
optimization helps in improving service, while
reducing cost and inventories.