inventory of arctic...inventory of arctic observing networks russia version march 2010 arctic...
TRANSCRIPT

Inventory of Arctic Observing Networks
Russia
Version March 2010
Arctic Observing Networks - Russia Table of Contents
1. Overview of Approach (I.M. Ashik, AARI) 2. Review of State of Arctic Network of Hydrometeorological Observations (V.A. Romantsov, AARI) 3. Aerological Observation Network (A.P. Makshtas, AARI) 4. Observation of Solar Radiation in the Arctic (A.V Tsvetkov) 5. Oceanological Observations (I.M. Ashik, AARI) 6. Sea Level Observations (I.M. Ashik, AARI) 7. Sea Ice (A.V. Yulin, V.M. Smolyanitsky, AARI) 8. Hydrological Network of Observations of Water Bodies and Estuaries in the Russian Arctic (V.V. Ivanov, AARI) 9. Databases on Russian hydrometeorological observation and information Networks in the Arctic (A.A. Kuznetsov, RIHMI-WDC) 9.1.1 Terrestrial Meteorological Observations 9.1.2 Aerological Observations 9.1.3 Marine Meteorological Observations 9.2. Data on Regime and Resources of Surface Land Waters (Rivers and Channels) 9.3.1 Coastal Observations 9.3.2 Oceanographic Observations 10. Permafrost Observations Network (O.A. Anisimov, SHI) 11. Glacier Observation Network (Ananicheva, RAS IO) 12. Arctic Environmental Pollution Observation Network (S.S. Krylov, North-West Branch, SPA Typhoon) 13. Biodiversity Monitoring in the Arctic (M.V. Gavrilo, AARI) 14. Integrated Arctic Socially-oriented Observation System (IASOS) Network (T.K. Vlasova, RAS IO) 15. Human Health (V.P. Chaschin, North-West Scientific Center of Hygiene and Public Health) 16. Climatic Observation Network (A.P. Makshtas, AARI)

1. Overview of Approach
Networks, points and programs of observation in the Russian Arctic can be classified by their
thematic, territorial or departmental belongings. Thematically observation networks can be
divided into:
1. Hydrometeorological – observing the Arctic atmosphere and hydrosphere
2. Cryospheric – observing glaciers and permafrost
3. Environmental pollution control
4. Geophysical – observing Earth’s magnetosphere, ionosphere and ozonosphere
5. Biologic – observing the Arctic flora and fauna
6. Socio-economic – observing people and medico-biologic and socio-economic
aspects associated with their activity
Territorially observation networks can be divided into:
• Terrestrial and marine;
• High-latitude and arctic (adjacent to Arctic seas);
• Regional.
Departmentally, the organizations that actually conduct monitoring in the Russian Arctic are
primarily as follows: Roshydromet, Russian Academy of Science and administrative-territorial
units
2. Overview of the State of the Arctic Hydrometeorological Observation Networks
1. In the context of the tasks SAON SG steering group, the topology of the Arctic
hydrometeorological observation network can be presented in the following concise form:
1. Agrometeorological;
2. Actinometric;
3. Aerological (radiosounding);
4. Water balance;
5. Hydrological on rivers;
6. Hydrometeorological on lakes;
7. Glaciological;
8. Meteorological;
9. Marine hydrometeorological (in the coastal zone, river estuaries, open areas
including marine vessel and expeditionary);
10. Avalanche;
11. Ozone measuring;
12. Heat balance;
13. Atmospheric electricity;
14. Water, soil and snow surface evaporation;
15. Chemical composition of water and air.
Observation network data are operationally transferred to Roshydromet’s data
telecommunication network except for those indicated in items 4, 7,12-15.
The main networks in terms of the number of observation points and volume of information
obtained are meteorological, marine hydrometeorological, river hydrological, aerological and
actinometric ones.
Meteorological observations are considered as the main type of observations.
To establish a common database and control timely and complete collection and distribution of
information, a catalog of meteorological bulletins is being created to be the plan of
hydrometeorological information transfer from the sources to Roshydromet’s data
telecommunication network to distribute among information recipients
The catalog of meteorological observations is maintained by State Institution
“Hydrometeorological Center” and State Institution “Main Radio-Meterological Center”.
Electronic version of the catalogs of meteorological bulletins is maintained by State Institution
“Main Radio-Meterological Center” and located on the Internet site http://grmc.mecom.ru.
The catalog of meteorological bulletins contains the following information:
Name of Roshydromet’s subordinate Federal State Institution and observation
point to input data into the automated data system;
shortened title of the hydrometeorological bulletin in proper format;
observation data coded form;
hours of observation;
data transfer check time;
number of observation points taking part in one bulletin;
lists of five-digit indices for observation points.
Changes are entered into the catalogs of meteorological bulletins quarterly.
WMO’s WWW is considered as the main foreign information consumer. The lists of WMO
correspondent stations are given in WMO publications # 9, vol. C, part 1 (Catalog of
Meteorological Observations), vol. A (Observation Stations).
2. SAON is expected to stimulate the process of improving configuration and completeness of
the circumpolar region monitoring system as a potential tool for international consolidation of
the opportunities available in the functioning of observation networks in order to improve
national standards quality and ensure more complete compliance of the Arctic research strategies
proposed to socioeconomic needs and interests of Arctic countries
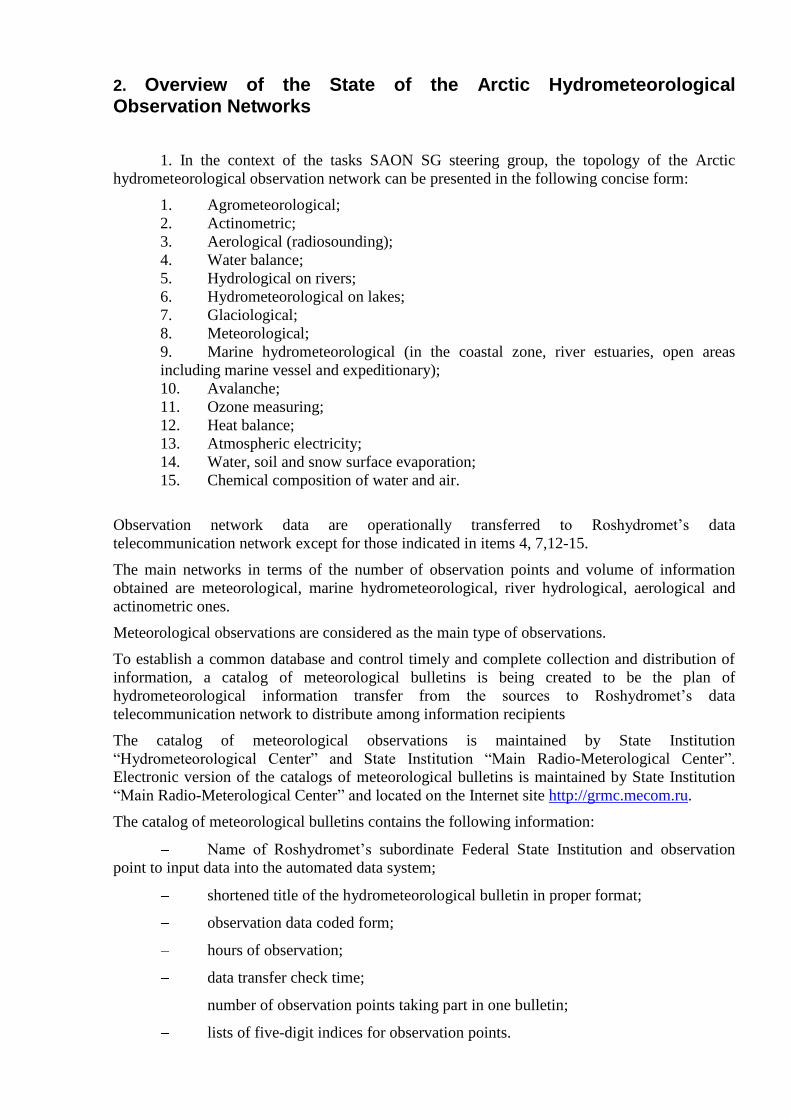
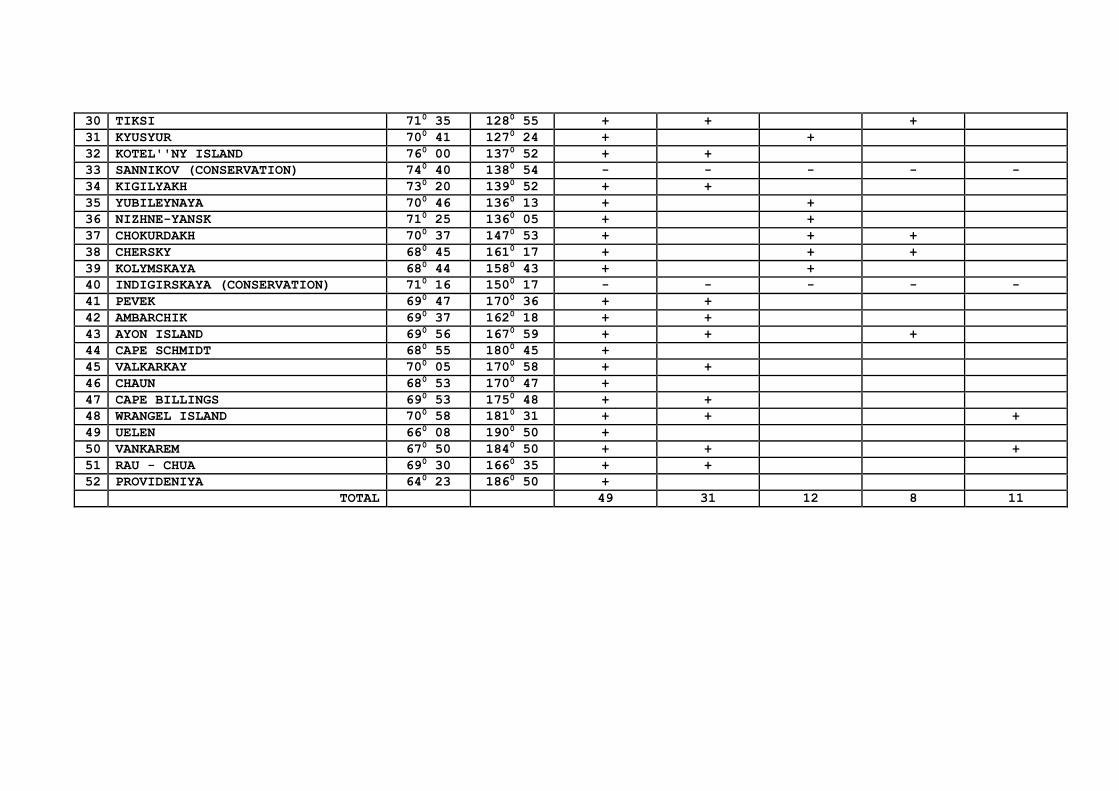
3. The catalog of points and main observations is given in Table 1 (see Fig. 1).
The maximum development of the Russian hydrometeorological observations in the Arctic was
reached in early 1980s, when information was received from 110 stations. In subsequent years,
the number of stations decreased more than twice (Fig. 2). The current level of observations is
determined by the functioning of a network consisting of 49 points two of which are automatic
weather stations. Three points are temporarily removed from operation. In short term, 8
automatic stations are expected to be opened; while in medium and long term, the number of
manned observation points will increase up to 52-54, and the number of automatic ones – up to
20-25.
For the manned network, the meteorological program includes a set of eight-hour observations
of: atmosphere pressure, wind parameters, air and soil temperature, relative humidity, weather
phenomena, cloud height, visual range, precipitation, while for automatic weather stations – a set
of reduced 4-hour observations.
The marine hydrometeorological program includes coastal observation of temperature, water
salinity (density), sea-level variations, heave, ice distribution (and thickness) as well as
meteorological parameters under the change of observation conditions from hourly to ten-day
observations.
The river hydrological program is quite similar to the marine one. It does not include
observations of water density, however, they can be included for the stations having a special
status, measurement of water discharge, alluvia and chemical composition of water. The
programs will include hourly and ten-day observations.
The aerological program will include 1-2 –hour measurements of: atmosphere pressure and wind
parameters on selected isobaric surfaces.
Actinometric observations include measurement of 5 components of atmosphere radiation
balance in case of the full program and measurement of total radiation under a reduced program.

150°
165°
180°
60° 75° 90° 105° 120° 135°
45°
30°
15°
0°
15° 30° 45° 60° 75° 90° 105° 120° 135° 150° 165°
75° 80° 85° 85° 80° 75° 70° 65°
West
East
West
Ea
st
Амдерма
Белый Нос
Быков м.
Голомянный
Диксон
им.Е.К.Фѐдорова
Кюсюр
м.Шмидта
Певек
Соп.Карга
ТиксиТюмети
Усть-Кара
Усть-Чаун
МарресаляСеяха
м.Ванкарем
Уэлен
б.Провидения
о.Врангеля
м.Биллингса
Валькаркай
о.Айон
Рау-Чуа
б.Амбарчик
Черский
Колымская
Индигирская
Чокурдах
Кигилях
Санникова
Котельный
Юбилейная
Столб
Дунай
Усть-Оленѐк
Анабар
Баренцбург
Им. Э.Т.Кренкеля
Визе
ГМО им. Е.К.Фѐдорова
М.Кармакулы
им.М.В.Попова
Новый Порт
Антипаюта
Тамбей
Вилькицкого
Хатанга
Стерлегова
Известий ЦИК
о. Андреяо. Русский
Fig.1. Polar stations in the Russian Arctic.
0
8
16
24
32
40
48
56
64
72
80
88
96
104
112
1900 1910 1920 1930 1940 1950 1960 1970 1980 1990 2000 2010
Fig. 2. Change in number of polar stations in 1900-2009.

Table 1
Catalog of hydrometeorological observation points and network
NO OBSERVATION POINT
Coordinates networks
Latitude
(N)
Longitud
e (E)
Meteorologi
cal
Marine
hydro
meteorologi
cal
River hydro
logical Aerological
Actinpmetri
c
1 MALYE KARMAKULY 720 22 520 42 + + + +
2 UST'-KARA 690 15 640 31 + +
3 MARE-SALE 690 43 660 48 + +
4 M.V. POPOV 730 20 700 03 + +
5 AMDERMA 690 45 610 42 + + +
6 BELY NOS 690 36 600 13 + + +
7 E.K. FEDOROV (CAPE BOLVANSKY NOS) 700 27 590 05 + +
8 NOVY PORT 670 41 720 53 + +
9 ANTIPAYUTA 690 05 760 51 + +
10 SE-YAKHA 700 09 720 34 + + +
11 TAMBEY (CONSERVATION) 710 30 710 50 - - - - -
12 E.T. KRENKEL 800 37 580 03 + + + +
13 DIKSON ISLAND 730 30 800 25 + + + +
14 CAPE STERLIGOV 750 25 880 54 + +
15 RUSSKY ISLAND (AUTOMATED) 770 08 950 36 +
16 E.K. FEDOROV (CAPE CHELYUSKIN) 770 43 1040 18 + +
17 VIZE ISLAND 790 30 760 59 + + +
18 GOLOMYANY ISLAND 790 33 900 37 + + +
19 IZVESTIA CIK ISLAND 750 57 820 57 + +
20 VILKITSKY ISLAND 730 31 750 46 + +
21 SOPOCHNAYA KARGA 710 52 820 42 + +
22 KHATANGA 710 59 1020 28 + + + +
23 CAPE ANDREY (AUTOMATED) 760 45 1100 26 +
24 ANABAR 730 13 1130 30 + +
25 UST-OLENEK 720 59 1190 52 + + +
26 DUNAY 730 56 1240 30 + +
27 KHABAROV (MAST) 720 24 1260 21 + +
28 BYKOV CAPE 720 00 1290 07 + +
29 TYUMETI 710 55 1230 34 + +
30 TIKSI 710 35 1280 55 + + +
31 KYUSYUR 700 41 1270 24 + +
32 KOTEL''NY ISLAND 760 00 1370 52 + +
33 SANNIKOV (CONSERVATION) 740 40 1380 54 - - - - -
34 KIGILYAKH 730 20 1390 52 + +
35 YUBILEYNAYA 700 46 1360 13 + +
36 NIZHNE-YANSK 710 25 1360 05 + +
37 CHOKURDAKH 700 37 1470 53 + + +
38 CHERSKY 680 45 1610 17 + + +
39 KOLYMSKAYA 680 44 1580 43 + +
40 INDIGIRSKAYA (CONSERVATION) 710 16 1500 17 - - - - -
41 PEVEK 690 47 1700 36 + +
42 AMBARCHIK 690 37 1620 18 + +
43 AYON ISLAND 690 56 1670 59 + + +
44 CAPE SCHMIDT 680 55 1800 45 +
45 VALKARKAY 700 05 1700 58 + +
46 CHAUN 680 53 1700 47 +
47 CAPE BILLINGS 690 53 1750 48 + +
48 WRANGEL ISLAND 700 58 1810 31 + + +
49 UELEN 660 08 1900 50 +
50 VANKAREM 670 50 1840 50 + + +
51 RAU - CHUA 690 30 1660 35 + +
52 PROVIDENIYA 640 23 1860 50 +
TOTAL 49 31 12 8 11
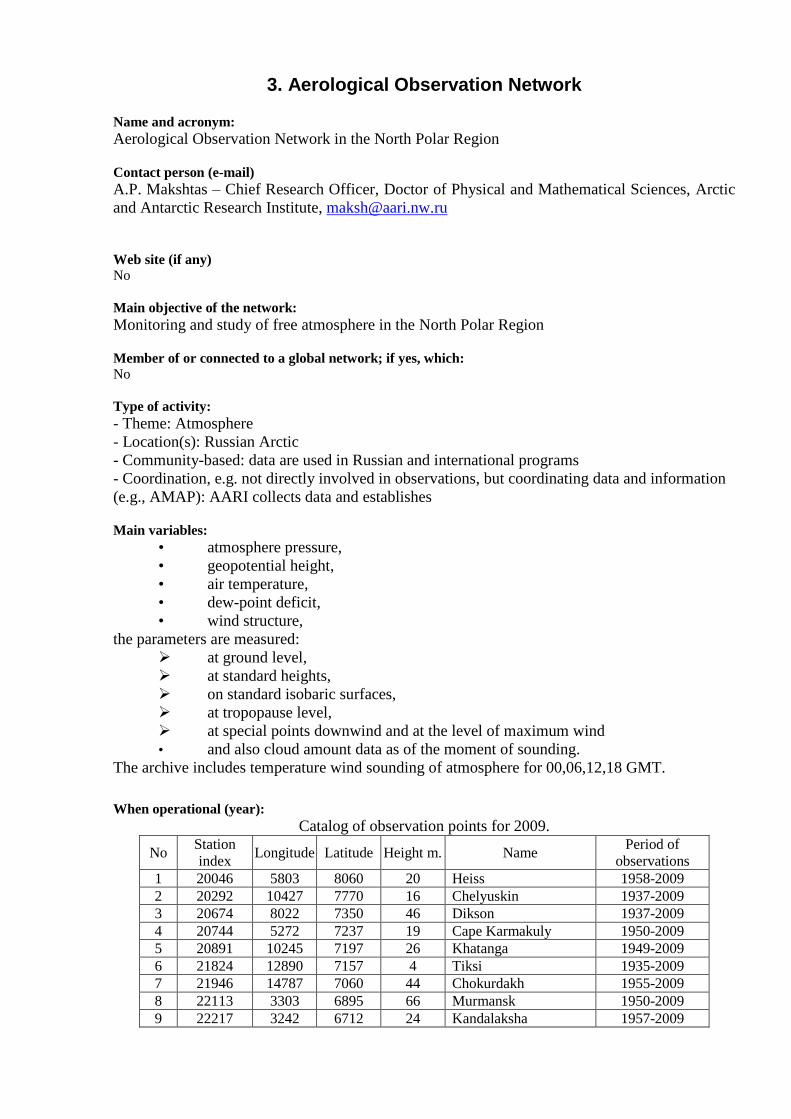
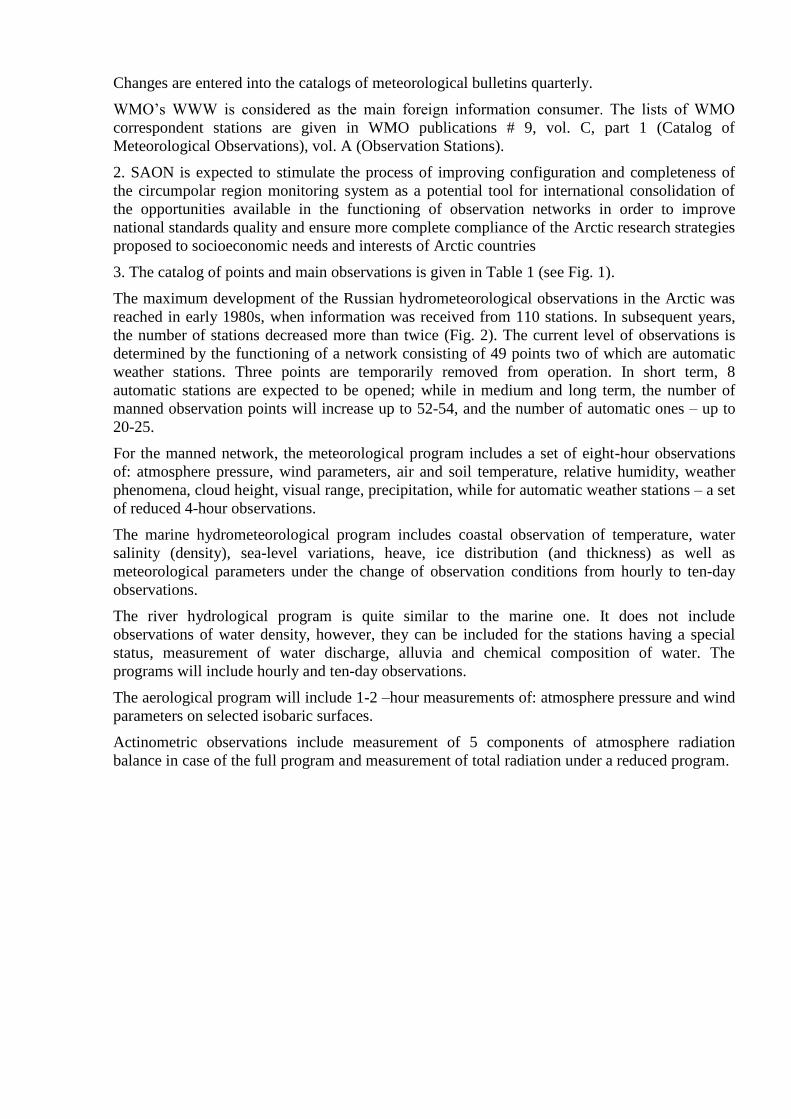
3. Aerological Observation Network
Name and acronym:
Aerological Observation Network in the North Polar Region
Contact person (e-mail)
A.P. Makshtas – Chief Research Officer, Doctor of Physical and Mathematical Sciences, Arctic
and Antarctic Research Institute, [email protected]
Web site (if any)
No
Main objective of the network:
Monitoring and study of free atmosphere in the North Polar Region
Member of or connected to a global network; if yes, which:
No
Type of activity:
- Theme: Atmosphere
- Location(s): Russian Arctic
- Community-based: data are used in Russian and international programs
- Coordination, e.g. not directly involved in observations, but coordinating data and information
(e.g., AMAP): AARI collects data and establishes
Main variables:
• atmosphere pressure,
• geopotential height,
• air temperature,
• dew-point deficit,
• wind structure,
the parameters are measured:
at ground level,
at standard heights,
on standard isobaric surfaces,
at tropopause level,
at special points downwind and at the level of maximum wind
• and also cloud amount data as of the moment of sounding.
The archive includes temperature wind sounding of atmosphere for 00,06,12,18 GMT.
When operational (year):
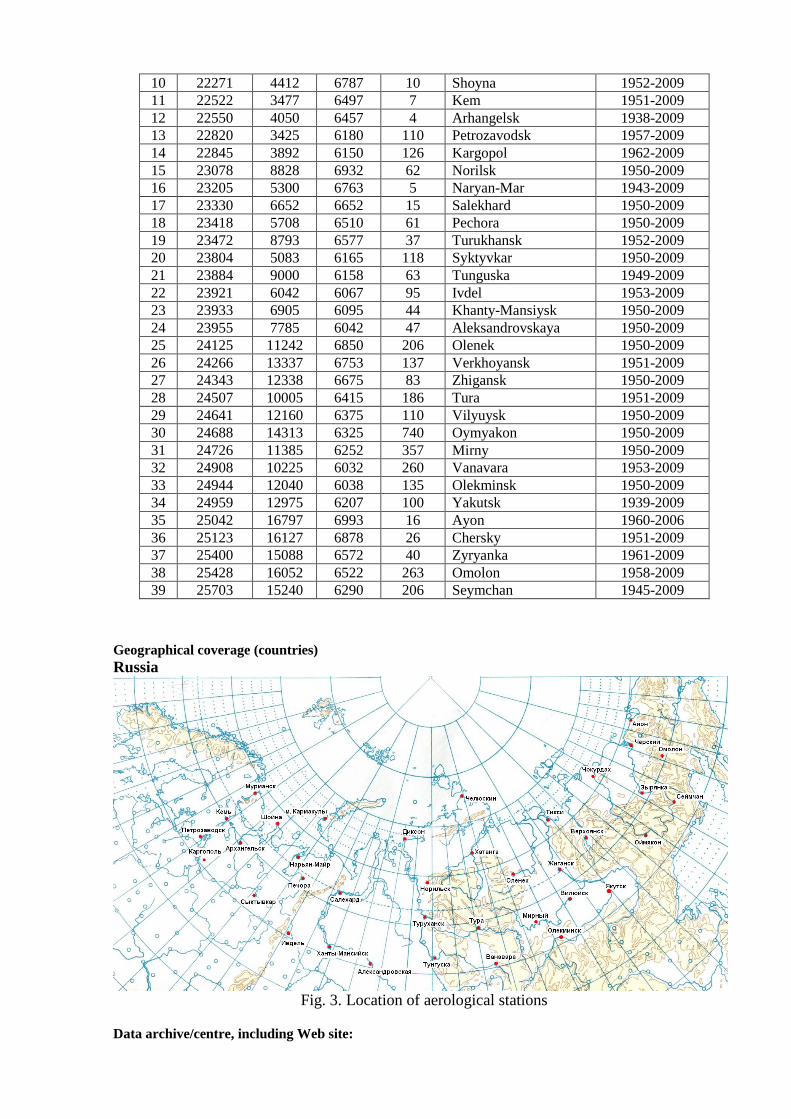
Catalog of observation points for 2009.
No Station
index Longitude Latitude Height m. Name
Period of
observations
1 20046 5803 8060 20 Heiss 1958-2009
2 20292 10427 7770 16 Chelyuskin 1937-2009
3 20674 8022 7350 46 Dikson 1937-2009
4 20744 5272 7237 19 Cape Karmakuly 1950-2009
5 20891 10245 7197 26 Khatanga 1949-2009
6 21824 12890 7157 4 Tiksi 1935-2009
7 21946 14787 7060 44 Chokurdakh 1955-2009
8 22113 3303 6895 66 Murmansk 1950-2009
9 22217 3242 6712 24 Kandalaksha 1957-2009
10 22271 4412 6787 10 Shoyna 1952-2009
11 22522 3477 6497 7 Kem 1951-2009
12 22550 4050 6457 4 Arhangelsk 1938-2009
13 22820 3425 6180 110 Petrozavodsk 1957-2009
14 22845 3892 6150 126 Kargopol 1962-2009
15 23078 8828 6932 62 Norilsk 1950-2009
16 23205 5300 6763 5 Naryan-Mar 1943-2009
17 23330 6652 6652 15 Salekhard 1950-2009
18 23418 5708 6510 61 Pechora 1950-2009
19 23472 8793 6577 37 Turukhansk 1952-2009
20 23804 5083 6165 118 Syktyvkar 1950-2009
21 23884 9000 6158 63 Tunguska 1949-2009
22 23921 6042 6067 95 Ivdel 1953-2009
23 23933 6905 6095 44 Khanty-Mansiysk 1950-2009
24 23955 7785 6042 47 Aleksandrovskaya 1950-2009
25 24125 11242 6850 206 Olenek 1950-2009
26 24266 13337 6753 137 Verkhoyansk 1951-2009
27 24343 12338 6675 83 Zhigansk 1950-2009
28 24507 10005 6415 186 Tura 1951-2009
29 24641 12160 6375 110 Vilyuysk 1950-2009
30 24688 14313 6325 740 Oymyakon 1950-2009
31 24726 11385 6252 357 Mirny 1950-2009
32 24908 10225 6032 260 Vanavara 1953-2009
33 24944 12040 6038 135 Olekminsk 1950-2009
34 24959 12975 6207 100 Yakutsk 1939-2009
35 25042 16797 6993 16 Ayon 1960-2006
36 25123 16127 6878 26 Chersky 1951-2009
37 25400 15088 6572 40 Zyryanka 1961-2009
38 25428 16052 6522 263 Omolon 1958-2009
39 25703 15240 6290 206 Seymchan 1945-2009
Geographical coverage (countries)
Russia
Fig. 3. Location of aerological stations
Data archive/centre, including Web site:

Arctic and Antarctic Research Institute (AARI) Roshydromet, Russia, aari.nw.ru Data availability:
Metadata
4. Observation of Solar Radiation in the Arctic
Name and acronym: Monitoring component of solar radiation in the Arctic
Contact person (e-mail) World Radiation Data Centre
Voeikov Main Geophysical Observatory
7, Karbyshev Street,
194021, St.Petersburg
Russian Federation
Phone.: +7 812 297-43-90
Head, WRDC - Anatoly Viktorovich Tsvetkov
Research Officer Elena Anatolievna Samukova
Web site http://wrdc.mgo.rssi.ru
Main objective of the network:
The World Radiation Data Center (WRDC) was established by the order of WMO in the
Voeikov Main Geophysical Observatory (Saint Petersburg) in 1964 to centrally collect and
provide solar radiation data from the world actinometric network stations.
Member of or connected to a global network; if yes, which:
The WRDC regularly cooperates the following Finland, Sweden, Canada and
USA NHMS’ providing radiation data including those from Arctic stations beginning with
1964.
FINLAND
Finnish Meteorological Institute
Observation Services
P.O.Box 503, FIN-00101 Helsinki
SWEDEN
Swedish Meteorological & Hydrological Institute
SE = 601 76 Norrköping
CANADA
National Archives & Data Management Branch
Atmospheric Monitoring & Water Survey Directorate
Meteorological Service of Canada, Environment Canada
4905 Dufferin Street
Toronto M3H 5T4
UNITED STATES OF AMERICA

Scientific Services Division, Climate Analysis Branch
National Climatic Data Center
151 Patton Ave.
Asheville, NC 28801-5001
14 Arctic stations belong to the WMO Global Atmosphere Watch. The WRDC regularly
provides information on the entry of radiation data of Global Atmosphere Watch to the
GAWSIS information system (GAW Station Information System) supported by the
organizations of the Federal Office of Meteorology and Climatology MeteoSwiss and Swiss
Federal Laboratories for Materials Testing and Research (EMPA, Dübendorf, Switzerland,
http://gaw/empa/ch/gawsis). Also this system presents information from other international
centers: WDCGG (Gases), WOUDC (Ozone/UV), WDCPC (Precip.chem.), WDCA
(Aerosols/AOD), WRC-RSAT (Remot.sens.).
The WRDC partners with the World Radiation Monitoring Center (Alfred Wegener Institute,
Bremenhaven, Germany) where the Baseline Surface Radiation Network archive is located
(http://www.bsrn.awi.de). The BSRN archive contains data from several Arctic stations
including those not presented in the WRDC (Ny-Ålesund, Spitsbergen and Greenland Summit).
Type of activity:
Collection of actinometric data from National Meteorological Administrations
and other organizations
Processing and control of operational information
Scientific and methodological interaction with NHMS’
Publication and distribution of bulletins “Solar Radiation and Radiation Balance.
World Network”, including data access through the WRDC server
http://wrdc.mgo.rssi.ru
Service of users of information on solar radiation
Analysis of historical data
Creation of metadata base
Main variables:
The WRDC has actinometric data from 25 Arctic stations of Russia, Norway, Finland, Sweden,
Greenland, Canada and USA for 4 radiation parameters:
Total short-wave radiation
Direct short-wave radiation
Scattered short-wave radiation
Radiation balance
Radiation data obtained are accompanied by metadata including as follows:
Description of meteorological station
Information on station transfer
Information on replacement of actinometric instruments, their height and position
Horizon closeness chart
Information on changes in measurement procedure (e.g. transition to hourly
observation) and information processing algorithm
Information on environmental changes near the station.
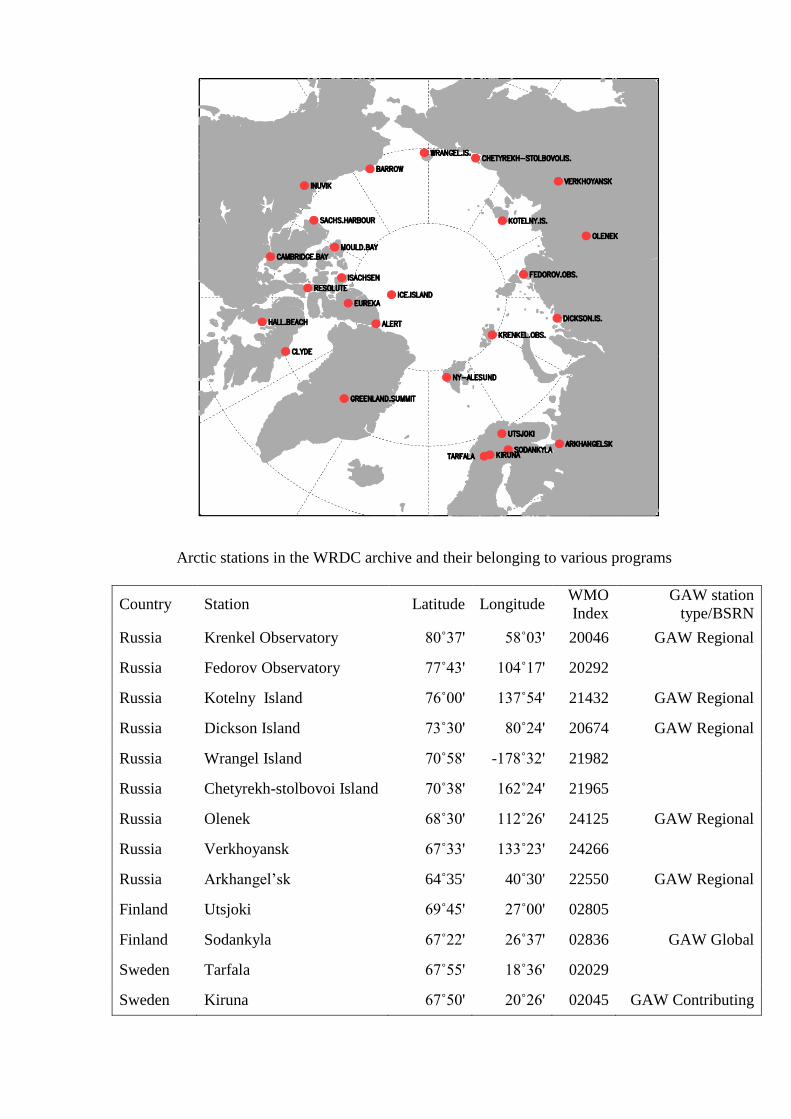
Arctic stations in the WRDC archive and their belonging to various programs
Country Station Latitude Longitude WMO
Index
GAW station
type/BSRN
Russia Krenkel Observatory 80˚37' 58˚03' 20046 GAW Regional
Russia Fedorov Observatory 77˚43' 104˚17' 20292
Russia Kotelny Island 76˚00' 137˚54' 21432 GAW Regional
Russia Dickson Island 73˚30' 80˚24' 20674 GAW Regional
Russia Wrangel Island 70˚58' -178˚32' 21982
Russia Chetyrekh-stolbovoi Island 70˚38' 162˚24' 21965
Russia Olenek 68˚30' 112˚26' 24125 GAW Regional
Russia Verkhoyansk 67˚33' 133˚23' 24266
Russia Arkhangel’sk 64˚35' 40˚30' 22550 GAW Regional
Finland Utsjoki 69˚45' 27˚00' 02805
Finland Sodankyla 67˚22' 26˚37' 02836 GAW Global
Sweden Tarfala 67˚55' 18˚36' 02029
Sweden Kiruna 67˚50' 20˚26' 02045 GAW Contributing

Norway Ny-Ålesund, Spitzbergen 78˚56' 11˚57' 01004 GAW Global/
BSRN
Greenland Greenland Summit 72˚34' 38˚29' GAW Regional/
BSRN
Canada Ice Island 85˚17' -94˚03'
Canada Alert 82˚30' -62˚20' 71082 GAW Global/
BSRN
Canada Eureka 79˚59' -85˚56' 71917 GAW Regional
Canada Isachsen 78˚47' -103˚32' 71074
Canada Mould Bay 76˚14' -119˚20' 71072 GAW Regional
Canada Resolute 74˚43' -94˚59' 71924 GAW Regional
Canada Sachs Harbour 72˚00' -125˚16' 71051
Canada Clyde 70˚29' -68˚31' 71090
Canada Cambridge Bay 69˚06' -105˚07' 71925
Canada Hall Beach 68˚47' -81˚15' 71081
Canada Inuvik 68˚19' -133˚32' 71957
United
States Barrow 71˚18' -156˚47' 70026
GAW Global/
BSRN
Main gaps: Actually the acquisition of data from some Arctic stations, including Russian ones, is paused due
to reconstruction of national actinometric networks. The network included in the international
data exchange is sparse.
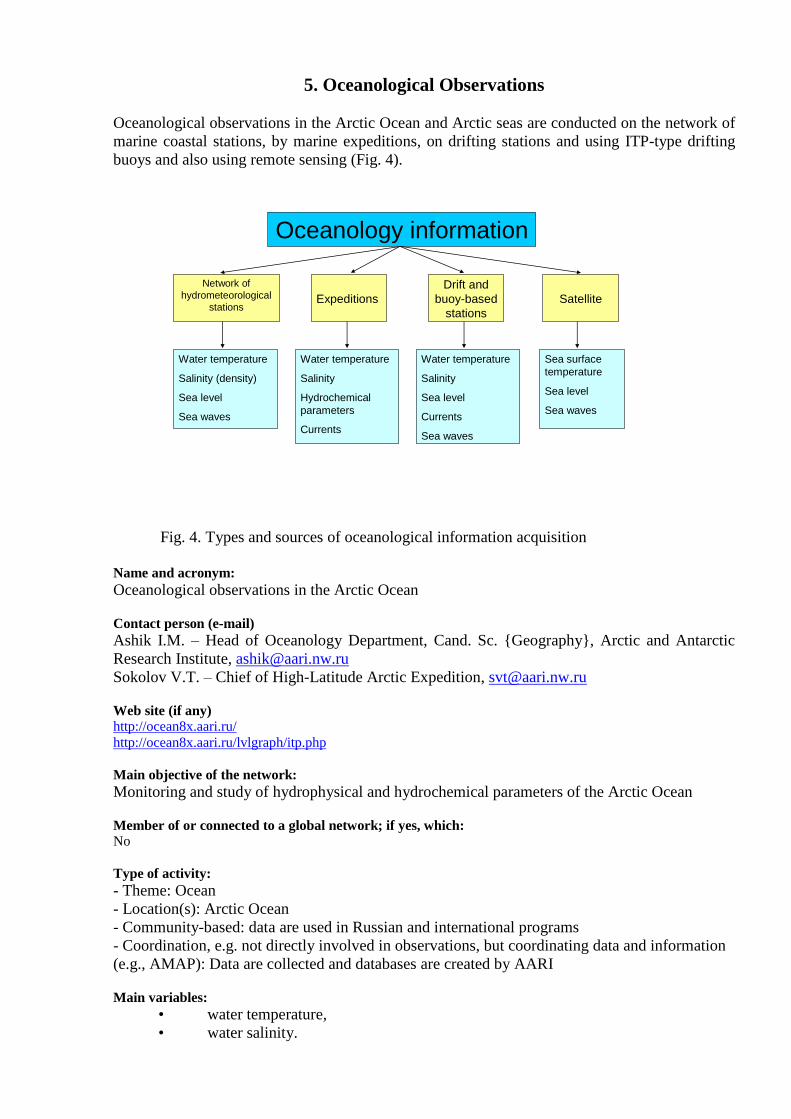
5. Oceanological Observations
Oceanological observations in the Arctic Ocean and Arctic seas are conducted on the network of
marine coastal stations, by marine expeditions, on drifting stations and using ITP-type drifting
buoys and also using remote sensing (Fig. 4).
Oceanology information
Network of
hydrometeorological
stationsExpeditions
Drift and
buoy-based
stations
Satellite
Water temperature
Salinity (density)
Sea level
Sea waves
Water temperature
Salinity
Hydrochemical
parameters
Currents
Water temperature
Salinity
Sea level
Currents
Sea waves
Sea surface
temperature
Sea level
Sea waves
Fig. 4. Types and sources of oceanological information acquisition
Name and acronym:
Oceanological observations in the Arctic Ocean
Contact person (e-mail)
Ashik I.M. – Head of Oceanology Department, Cand. Sc. {Geography}, Arctic and Antarctic
Research Institute, [email protected]
Sokolov V.T. – Chief of High-Latitude Arctic Expedition, [email protected]
Web site (if any) http://ocean8x.aari.ru/
http://ocean8x.aari.ru/lvlgraph/itp.php
Main objective of the network:
Monitoring and study of hydrophysical and hydrochemical parameters of the Arctic Ocean
Member of or connected to a global network; if yes, which: No
Type of activity:
- Theme: Ocean
- Location(s): Arctic Ocean
- Community-based: data are used in Russian and international programs
- Coordination, e.g. not directly involved in observations, but coordinating data and information
(e.g., AMAP): Data are collected and databases are created by AARI
Main variables:
• water temperature,
• water salinity.
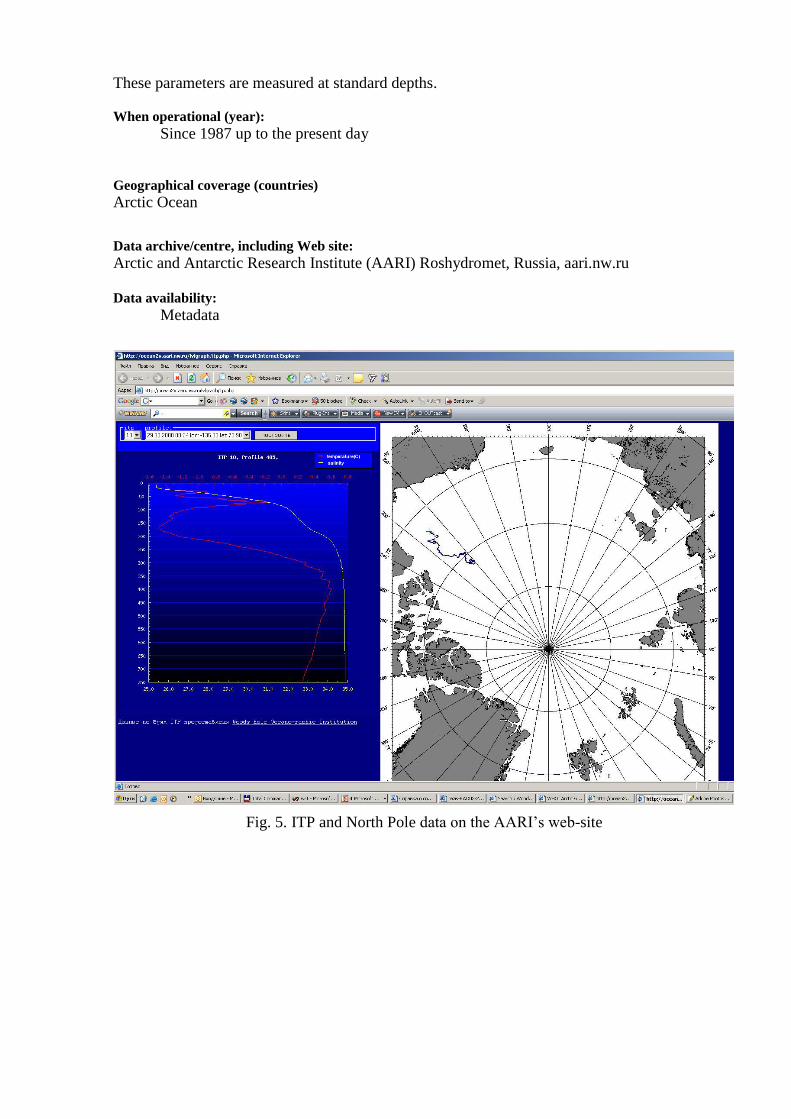
These parameters are measured at standard depths.
When operational (year):
Since 1987 up to the present day
Geographical coverage (countries)
Arctic Ocean
Data archive/centre, including Web site:
Arctic and Antarctic Research Institute (AARI) Roshydromet, Russia, aari.nw.ru Data availability:
Metadata
Fig. 5. ITP and North Pole data on the AARI’s web-site
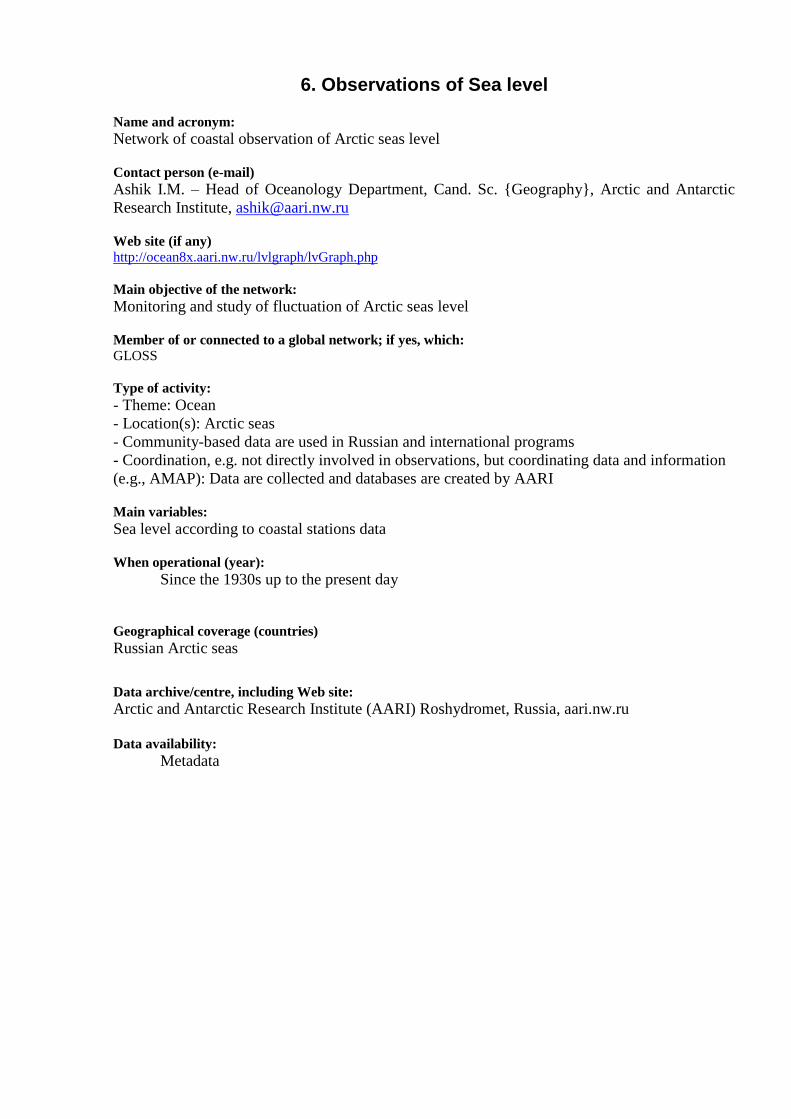
6. Observations of Sea level
Name and acronym:
Network of coastal observation of Arctic seas level
Contact person (e-mail)
Ashik I.M. – Head of Oceanology Department, Cand. Sc. {Geography}, Arctic and Antarctic
Research Institute, [email protected]
Web site (if any)
http://ocean8x.aari.nw.ru/lvlgraph/lvGraph.php
Main objective of the network:
Monitoring and study of fluctuation of Arctic seas level
Member of or connected to a global network; if yes, which:
GLOSS
Type of activity:
- Theme: Ocean
- Location(s): Arctic seas
- Community-based data are used in Russian and international programs
- Coordination, e.g. not directly involved in observations, but coordinating data and information
(e.g., AMAP): Data are collected and databases are created by AARI
Main variables:
Sea level according to coastal stations data
When operational (year):
Since the 1930s up to the present day
Geographical coverage (countries)
Russian Arctic seas
Data archive/centre, including Web site:
Arctic and Antarctic Research Institute (AARI) Roshydromet, Russia, aari.nw.ru Data availability:
Metadata
)
1301201101009080 140 150 160 170 180
70
60
50
170
160
150
75
80
85
ГМО им. Э.Т.Кренкеля
Русская Гавань
Мыс Желания
о. Визе
Малые Кармакулы
им. Е.К.Федорова
пр. Югорский Шарм. Белый Нос
Амдерма
Усть-Кара
Моржовая им. М.В.Попова
Сеяха
Тадибияха
Антипаюта
м. Лескина
Сопочная Карга
о. Диксон
о. Голомянныйо. Уединения
о-ва Известий ЦИК
о. Исаченко
м. Стерлегова
о. Правды
о. Русскийо. Гейберга
о-ва Краснофлотские
м. Песчаный
ГМО им. Е.К.Федорова
о. Малый Таймыр
о. Андрея
б. Марии Прончищевой
Мыс Косистый Анабар
м. Терпяй-Тумса
о. Преображения
Усть-Оленек
о. Дунай
Сагыллах-Ары
о. Малышева
Быков Мыс
Тикси
Найба
о. Муостах
м. Буор-Хая
Юэдей
о. Котельный
пр. Санникова
Земля Бунге
м. Кигилях
м. Святой Нос
м. Шалаурова
о. Немкова
о. Четырехстолбовой
б. Амбарчик
Рау-Чуа
о. АйонПевек
м. Валькаркай
м. Биллингса
о. Врангеля
Мыс Шмидта
м. Ванкарем
о. Колючин
м. Нэттен
о. Ратманова
Провидения
о. Жохова
Новый-Порт
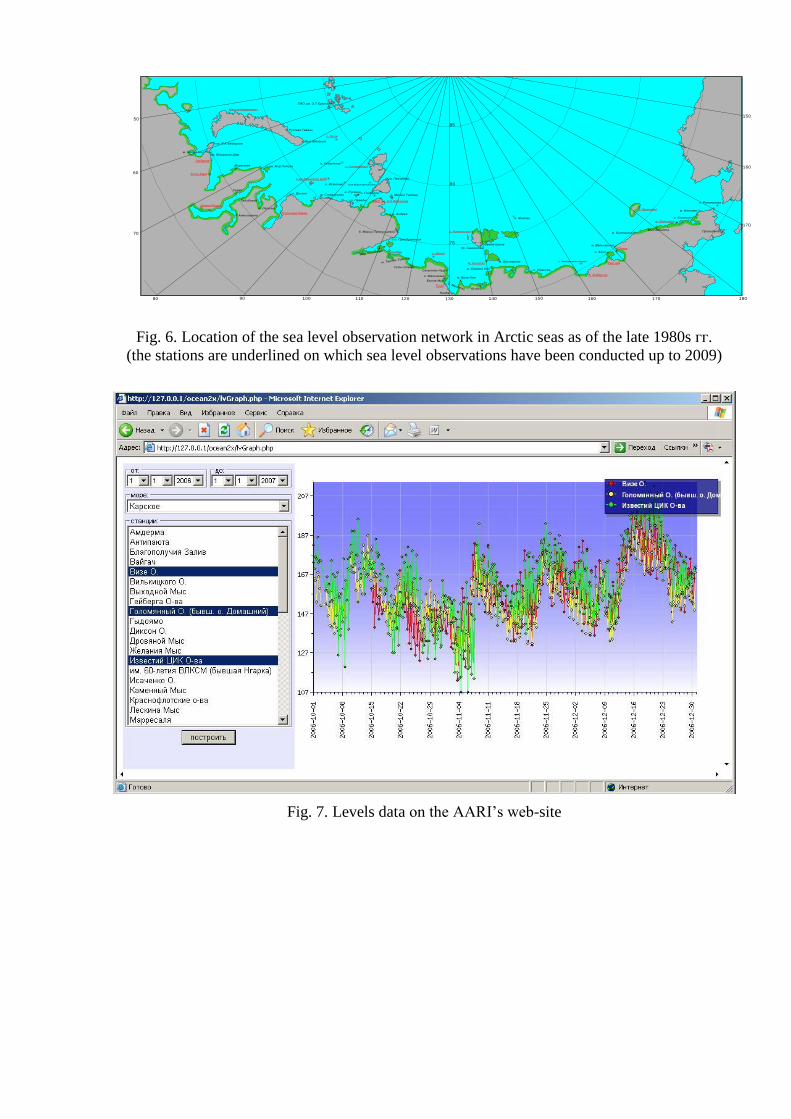
Fig. 6. Location of the sea level observation network in Arctic seas as of the late 1980s гг.
(the stations are underlined on which sea level observations have been conducted up to 2009)
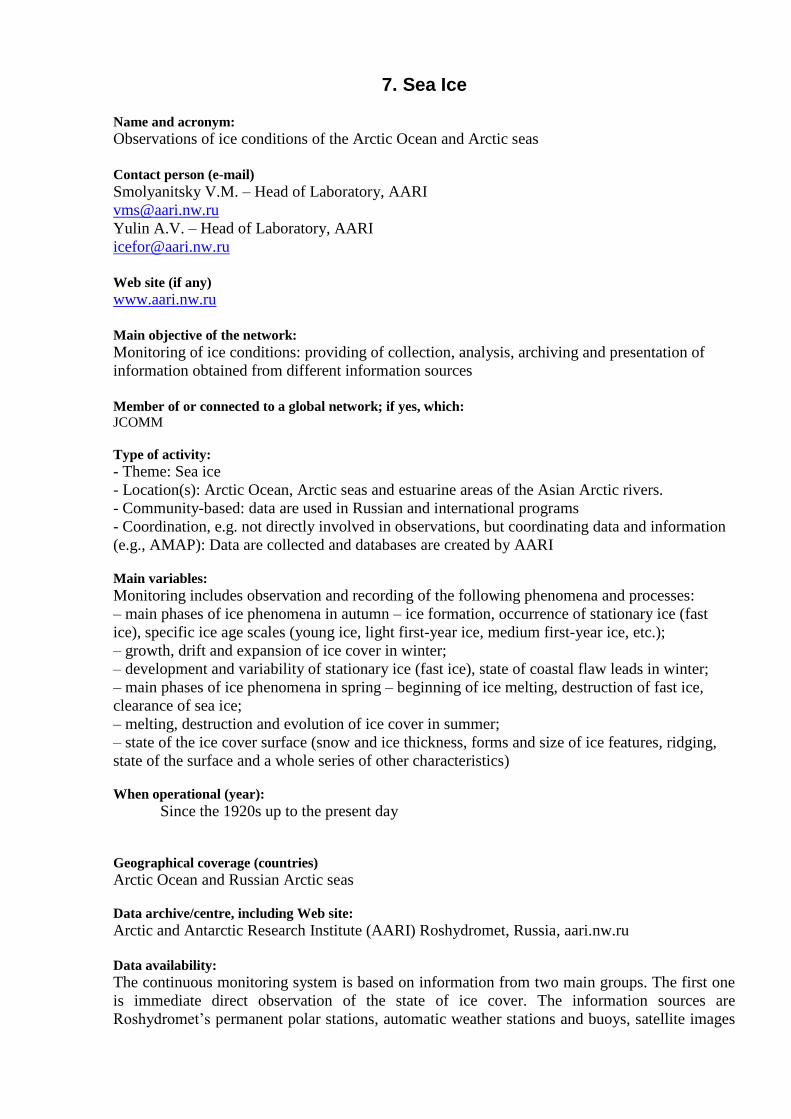
Fig. 7. Levels data on the AARI’s web-site
7. Sea Ice Name and acronym:
Observations of ice conditions of the Arctic Ocean and Arctic seas
Contact person (e-mail)
Smolyanitsky V.M. – Head of Laboratory, AARI
Yulin A.V. – Head of Laboratory, AARI
Web site (if any)
www.aari.nw.ru
Main objective of the network:
Monitoring of ice conditions: providing of collection, analysis, archiving and presentation of
information obtained from different information sources
Member of or connected to a global network; if yes, which:
JCOMM
Type of activity:
- Theme: Sea ice
- Location(s): Arctic Ocean, Arctic seas and estuarine areas of the Asian Arctic rivers.
- Community-based: data are used in Russian and international programs
- Coordination, e.g. not directly involved in observations, but coordinating data and information
(e.g., AMAP): Data are collected and databases are created by AARI
Main variables:
Monitoring includes observation and recording of the following phenomena and processes:
– main phases of ice phenomena in autumn – ice formation, occurrence of stationary ice (fast
ice), specific ice age scales (young ice, light first-year ice, medium first-year ice, etc.);
– growth, drift and expansion of ice cover in winter;
– development and variability of stationary ice (fast ice), state of coastal flaw leads in winter;
– main phases of ice phenomena in spring – beginning of ice melting, destruction of fast ice,
clearance of sea ice;
– melting, destruction and evolution of ice cover in summer;
– state of the ice cover surface (snow and ice thickness, forms and size of ice features, ridging,
state of the surface and a whole series of other characteristics)
When operational (year):
Since the 1920s up to the present day
Geographical coverage (countries)
Arctic Ocean and Russian Arctic seas
Data archive/centre, including Web site:
Arctic and Antarctic Research Institute (AARI) Roshydromet, Russia, aari.nw.ru Data availability:
The continuous monitoring system is based on information from two main groups. The first one
is immediate direct observation of the state of ice cover. The information sources are
Roshydromet’s permanent polar stations, automatic weather stations and buoys, satellite images
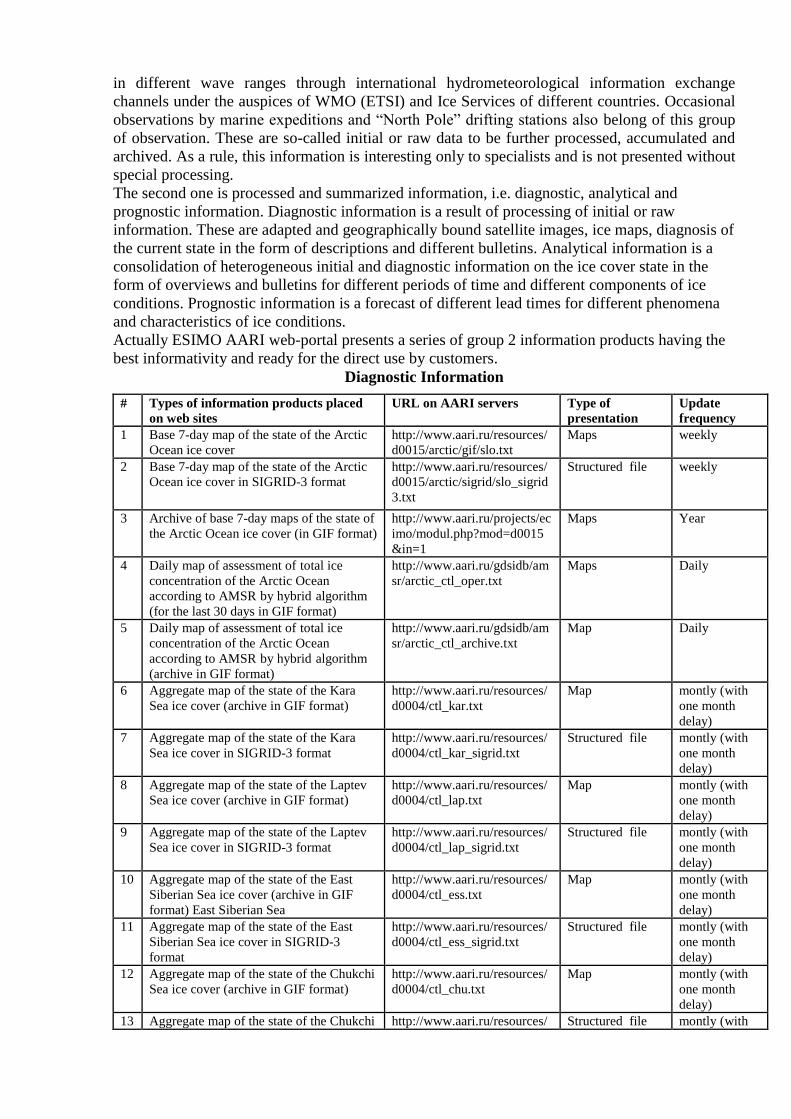
in different wave ranges through international hydrometeorological information exchange
channels under the auspices of WMO (ETSI) and Ice Services of different countries. Occasional
observations by marine expeditions and “North Pole” drifting stations also belong of this group
of observation. These are so-called initial or raw data to be further processed, accumulated and
archived. As a rule, this information is interesting only to specialists and is not presented without
special processing.
The second one is processed and summarized information, i.e. diagnostic, analytical and
prognostic information. Diagnostic information is a result of processing of initial or raw
information. These are adapted and geographically bound satellite images, ice maps, diagnosis of
the current state in the form of descriptions and different bulletins. Analytical information is a
consolidation of heterogeneous initial and diagnostic information on the ice cover state in the
form of overviews and bulletins for different periods of time and different components of ice
conditions. Prognostic information is a forecast of different lead times for different phenomena
and characteristics of ice conditions.
Actually ESIMO AARI web-portal presents a series of group 2 information products having the
best informativity and ready for the direct use by customers.
Diagnostic Information
# Types of information products placed
on web sites
URL on AARI servers Type of
presentation
Update
frequency
1 Base 7-day map of the state of the Arctic
Ocean ice cover
http://www.aari.ru/resources/
d0015/arctic/gif/slo.txt
Maps weekly
2 Base 7-day map of the state of the Arctic
Ocean ice cover in SIGRID-3 format
http://www.aari.ru/resources/
d0015/arctic/sigrid/slo_sigrid
3.txt
Structured file weekly
3 Archive of base 7-day maps of the state of
the Arctic Ocean ice cover (in GIF format)
http://www.aari.ru/projects/ec
imo/modul.php?mod=d0015
&in=1
Maps Year
4 Daily map of assessment of total ice
concentration of the Arctic Ocean
according to AMSR by hybrid algorithm
(for the last 30 days in GIF format)
http://www.aari.ru/gdsidb/am
sr/arctic_ctl_oper.txt
Maps Daily
5 Daily map of assessment of total ice
concentration of the Arctic Ocean
according to AMSR by hybrid algorithm
(archive in GIF format)
http://www.aari.ru/gdsidb/am
sr/arctic_ctl_archive.txt
Map Daily
6 Aggregate map of the state of the Kara
Sea ice cover (archive in GIF format)
http://www.aari.ru/resources/
d0004/ctl_kar.txt
Map montly (with
one month
delay)
7 Aggregate map of the state of the Kara
Sea ice cover in SIGRID-3 format
http://www.aari.ru/resources/
d0004/ctl_kar_sigrid.txt
Structured file montly (with
one month
delay)
8 Aggregate map of the state of the Laptev
Sea ice cover (archive in GIF format)
http://www.aari.ru/resources/
d0004/ctl_lap.txt
Map montly (with
one month
delay)
9 Aggregate map of the state of the Laptev
Sea ice cover in SIGRID-3 format
http://www.aari.ru/resources/
d0004/ctl_lap_sigrid.txt
Structured file montly (with
one month
delay)
10 Aggregate map of the state of the East
Siberian Sea ice cover (archive in GIF
format) East Siberian Sea
http://www.aari.ru/resources/
d0004/ctl_ess.txt
Map montly (with
one month
delay)
11 Aggregate map of the state of the East
Siberian Sea ice cover in SIGRID-3
format
http://www.aari.ru/resources/
d0004/ctl_ess_sigrid.txt
Structured file montly (with
one month
delay)
12 Aggregate map of the state of the Chukchi
Sea ice cover (archive in GIF format)
http://www.aari.ru/resources/
d0004/ctl_chu.txt
Map montly (with
one month
delay)
13 Aggregate map of the state of the Chukchi http://www.aari.ru/resources/ Structured file montly (with
Sea ice cover in SIGRID-3 format d0004/ctl_chu_sigrid.txt one month
delay)
14 Aggregate map of the state of the
Greenland Sea ice cover (archive in GIF
format)
http://www.aari.ru/resources/
d0004/ctl_gre.txt
Map montly (with
one month
delay)
15 Aggregate map of the state of the
Greenland Sea ice cover in SIGRID-3
format
http://www.aari.ru/resources/
d0004/ctl_gre_sigrid.txt
Structured file montly (with
one month
delay)
16 Map of analysis of fields of ice
concentration and mean daily ice drift in
the Arctic Ocean and Arctic seas (for the
last 30 days)
http://www.aari.ru/f0013/r010
401_oper_slo.txt
Map Daily
17 Map of analysis of fields of ice
concentration and mean daily ice drift in
the Arctic Ocean and Arctic seas (archive
for the last year)
http://www.aari.ru/f0013/r010
401_arch_slo.txt
Map Montly
18 Map of analysis of fields of ice and mean
daily ice drift in the Western Arctic
(for the last 30 days)
http://www.aari.ru/f0013/r010
401_oper_west.txt
Map Daily
19 Map of analysis of fields of ice and mean
daily ice drift in the Eastern Arctic
(for the last 30 days)
http://www.aari.ru/f0013/r010
401_oper_east.txt
Map Daily
20 Operational information from IABP and
ARGO Arctic drifting buoys
http://www.aari.ru/clgmi/gts/
buoy/buoy.daily.csv.n.txt
Structured file Daily
every 3 hours
21 Operational data on drift parameters of
North Po;e-37 drifting station
http://www.aari.ru/resources/
d0014/np37/data/drift/np37.v
ector.csv
Structured file Daily
every 3 hours
22 Operational map of North Po;e-37 station
drift
http://www.aari.ru/resources/
d0014/np37/data/drift/drift_bi
g.png
Map Daily
every 3 hours
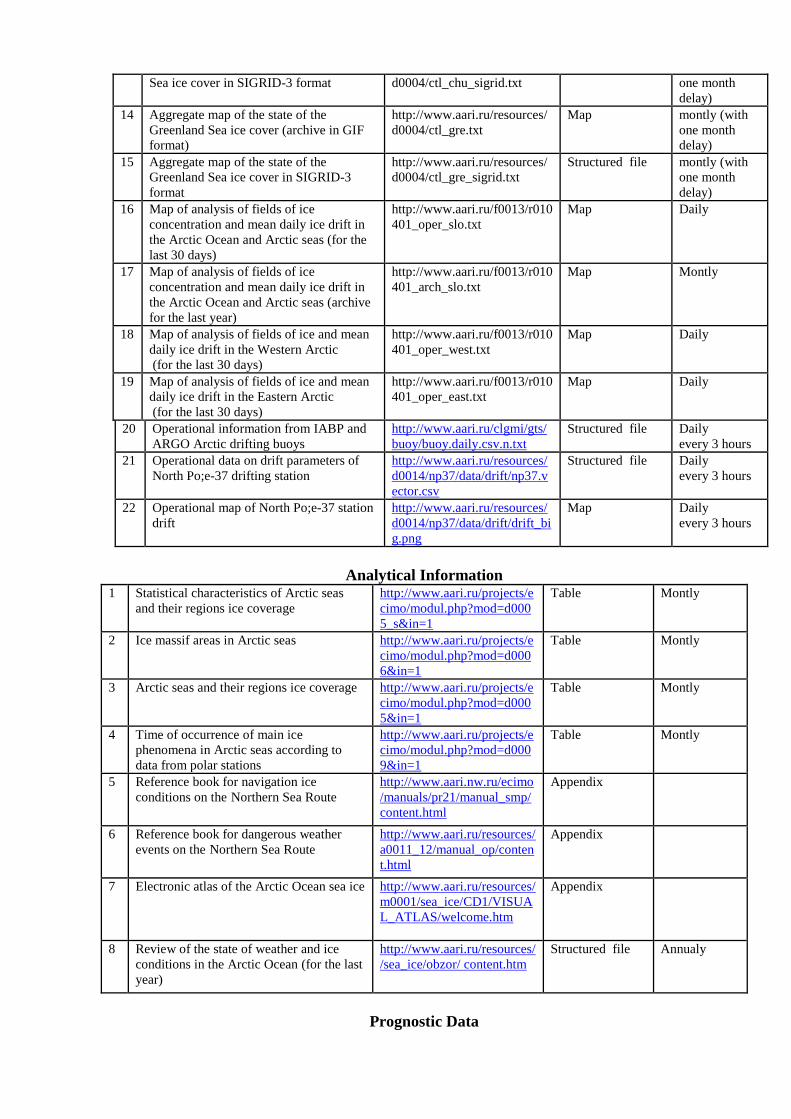
Analytical Information 1 Statistical characteristics of Arctic seas
and their regions ice coverage
http://www.aari.ru/projects/e
cimo/modul.php?mod=d000
5_s&in=1
Table Montly
2 Ice massif areas in Arctic seas http://www.aari.ru/projects/e
cimo/modul.php?mod=d000
6&in=1
Table Montly
3 Arctic seas and their regions ice coverage http://www.aari.ru/projects/e
cimo/modul.php?mod=d000
5&in=1
Table Montly
4 Time of occurrence of main ice
phenomena in Arctic seas according to
data from polar stations
http://www.aari.ru/projects/e
cimo/modul.php?mod=d000
9&in=1
Table Montly
5 Reference book for navigation ice
conditions on the Northern Sea Route
http://www.aari.nw.ru/ecimo
/manuals/pr21/manual_smp/
content.html
Appendix
6 Reference book for dangerous weather
events on the Northern Sea Route
http://www.aari.ru/resources/
a0011_12/manual_op/conten
t.html
Appendix
7 Electronic atlas of the Arctic Ocean sea ice http://www.aari.ru/resources/
m0001/sea_ice/CD1/VISUA
L_ATLAS/welcome.htm
Appendix
8 Review of the state of weather and ice
conditions in the Arctic Ocean (for the last
year)
http://www.aari.ru/resources/
/sea_ice/obzor/ content.htm
Structured file Annualy
Prognostic Data

1 Short-range forecast map of the Barents
and Kara Seas ice cover evolution with 7-
day time lead (a set of maps for the
current week)
http://www.aari.ru/resources/f
0011/ice_map_oper.txt
Structured file Weekly
2 Prognostic map of ice concentration in
the Arctic Ocean with 0-6-day time lead
http://www.aari.ru/resources/f
0013/P0255_00.txt
Map Daily
3 Prognostic map of mean daily ice drift in
the Arctic Ocean with 0-6-day time lead
http://www.aari.ru/resources/f
0013/P1030.txt
Map Daily
4 Prognostic map of instantaneous ice drift
in the Arctic Ocean with 0-6-day time
lead
http://www.aari.ru/resources/f
0013/P1028.txt
Map Daily
5 Long-term forecast of the dates of stable
ice formation in the south-west and north
–east Kara Sea
http://www.aari.ru/odata/_f00
18.php
Object file Annualy
6 Ice forecasts for 5 Arctic seas with 1-5-
month time lead
http://www.aari.ru/odata/_f00
22.php
Object file 4 times a year
7 Ice forecasts for estuarine areas of
Siberian rivers for spring and autumn
http://www.aari.ru/odata/_f00
17.php
Object file 4 times a year
8 Medium-term forecast of the dates of ice
break-up in estuarine areas of Siberian
rivers
http://www.aari.ru/resources/f
0017/icego.txt
Structured file As needed
9 Medium-term forecast of the dates of ice
clearing in estuarine areas of Siberian
rivers
http://www.aari.ru/resources/f
0017/clear.txt
Structured file As needed
10 Medium-term forecast of the dates of
south ice edge location in estuarine areas
of Siberian rivers
http://www.aari.ru/resources/f
0017/kromka.txt
Structured file As needed
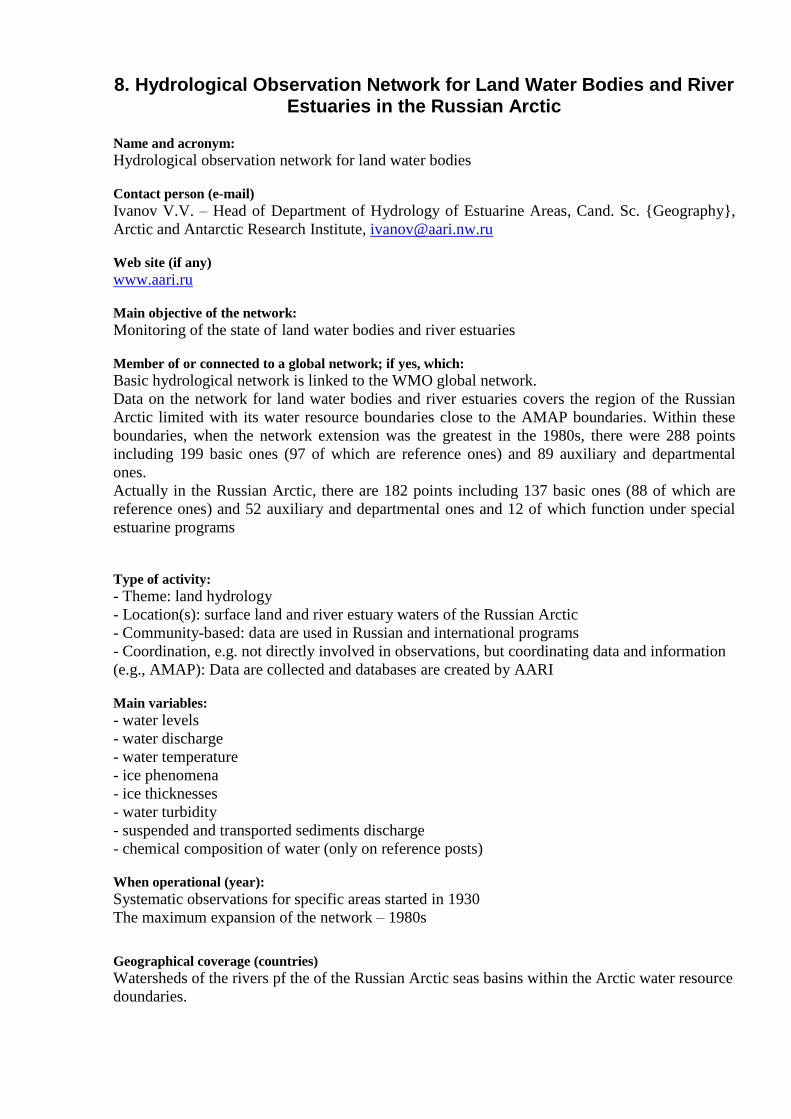
8. Hydrological Observation Network for Land Water Bodies and River Estuaries in the Russian Arctic
Name and acronym:
Hydrological observation network for land water bodies
Contact person (e-mail)
Ivanov V.V. – Head of Department of Hydrology of Estuarine Areas, Cand. Sc. {Geography},
Arctic and Antarctic Research Institute, [email protected]
Web site (if any)
www.aari.ru
Main objective of the network:
Monitoring of the state of land water bodies and river estuaries
Member of or connected to a global network; if yes, which:
Basic hydrological network is linked to the WMO global network.
Data on the network for land water bodies and river estuaries covers the region of the Russian
Arctic limited with its water resource boundaries close to the AMAP boundaries. Within these
boundaries, when the network extension was the greatest in the 1980s, there were 288 points
including 199 basic ones (97 of which are reference ones) and 89 auxiliary and departmental
ones.
Actually in the Russian Arctic, there are 182 points including 137 basic ones (88 of which are
reference ones) and 52 auxiliary and departmental ones and 12 of which function under special
estuarine programs
Type of activity:
- Theme: land hydrology
- Location(s): surface land and river estuary waters of the Russian Arctic
- Community-based: data are used in Russian and international programs
- Coordination, e.g. not directly involved in observations, but coordinating data and information
(e.g., AMAP): Data are collected and databases are created by AARI
Main variables:
- water levels
- water discharge
- water temperature
- ice phenomena
- ice thicknesses
- water turbidity
- suspended and transported sediments discharge
- chemical composition of water (only on reference posts)
When operational (year):
Systematic observations for specific areas started in 1930
The maximum expansion of the network – 1980s
Geographical coverage (countries)
Watersheds of the rivers pf the of the Russian Arctic seas basins within the Arctic water resource
doundaries.

Data archive/centre, including Web site:
Arctic and Antarctic Research Institute (AARI) Roshydromet, Russia, aari.nw.ru Data availability:
Metadata
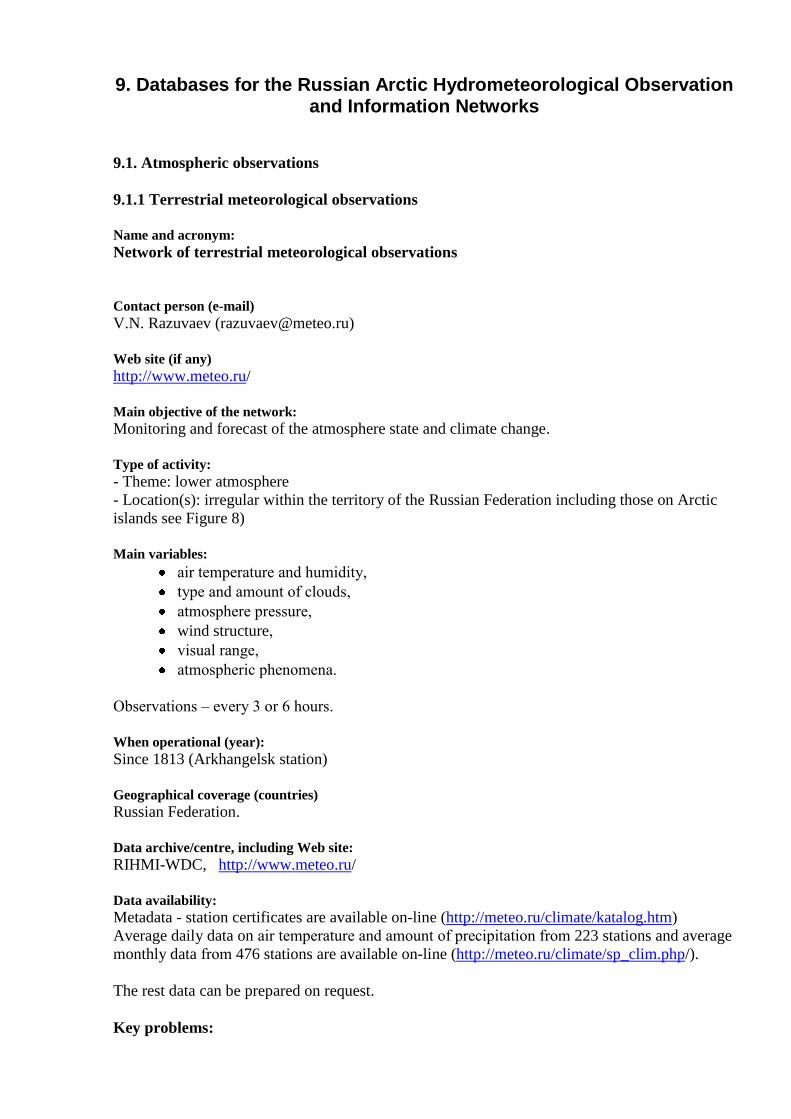
9. Databases for the Russian Arctic Hydrometeorological Observation and Information Networks
9.1. Atmospheric observations
9.1.1 Terrestrial meteorological observations
Name and acronym:
Network of terrestrial meteorological observations
Contact person (e-mail)
V.N. Razuvaev ([email protected])
Web site (if any)
http://www.meteo.ru/
Main objective of the network:
Monitoring and forecast of the atmosphere state and climate change.
Type of activity:
- Theme: lower atmosphere
- Location(s): irregular within the territory of the Russian Federation including those on Arctic
islands see Figure 8)
Main variables:
air temperature and humidity,
type and amount of clouds,
atmosphere pressure,
wind structure,
visual range,
atmospheric phenomena.
Observations – every 3 or 6 hours.
When operational (year):
Since 1813 (Arkhangelsk station)
Geographical coverage (countries)
Russian Federation.
Data archive/centre, including Web site:
RIHMI-WDC, http://www.meteo.ru/
Data availability:
Metadata - station certificates are available on-line (http://meteo.ru/climate/katalog.htm)
Average daily data on air temperature and amount of precipitation from 223 stations and average
monthly data from 476 stations are available on-line (http://meteo.ru/climate/sp_clim.php/).
The rest data can be prepared on request.
Key problems:

Initial historical data from specific stations have not been digitized
It is needed to control and recover gaps in historical data from specific stations.
Figure 8 – Location of terrestrial meteorological stations

9.1.2 Aerological observations
Name and acronym:
Aerological observation network
Contact person (e-mail)
A.M.Sterin ([email protected]), A.V.Khokhlova ([email protected])
Web site (if any)
http://www.meteo.ru/
Main objective of the network:
Monitoring and forecast of the atmosphere state and climate change.
Type of activity:
- Theme: troposphere and lower stratosphere
- Location(s): irregular within the territory of the Russian Federation
Main variables:
air temperature,
air humidity,
atmosphere pressure,
geopotential height,
wind structure,
characteristics of clouds.
Observations – every 12 or 24 hours.
When operational (year):
Since 1936
Geographical coverage (countries)
Russian Federation.
Data archive/centre, including Web site:
RIHMI-WDC, http://www.meteo.ru/
Data availability:
Aerological data from 12 stations are available on-line
(http://meteo.ru/climate/sp_clim.php/).
The rest data can be prepared on request.
Key problems:
Initial historical data before 1961 from specific stations have not been digitized. A part of
metadata have not been digitized

9.1.3 Marine meteorological observations
Name and acronym:
Network of voluntary marine meteorological observations
Contact person (e-mail)
S.M. Somova ([email protected])
Web site (if any)
http://www.meteo.ru/
Main objective of the network:
Incidental hydrometeorological observations along vessel routes. Monitoring and forecast of the
surface layer atmosphere state, hydrometeorological support of safety of navigation and marine
activities.
Type of activity:
- Theme: surface layer atmosphere and sea surface
- Location(s): along vessel routes in the Arctic Ocean and Arctic seas (Figure 9). Over 200
vessels participate in the program, over 130 of which sail in the Arctic Ocean and Arctic seas.
Main variables:
air temperature,
air humidity,
type and amount of clouds,
atmosphere pressure,
wind structure,
visual range
hydrometeorological phenomena,
characteristics of ice accretion,
wave height and direction,
water temperature near the surface.
Observations – every 4 or 6 hours
When operational (year):
Since 1946
Geographical coverage (countries)
Russian Federation, Norway.
Data archive/centre, including Web site:
RIHMI-WDC, http://www.meteo.ru/
Data availability:
Data for the period from 1988 to 2008 are available on-line (http://meteo.ru/data_navigat/)
The rest data can be prepared on request.
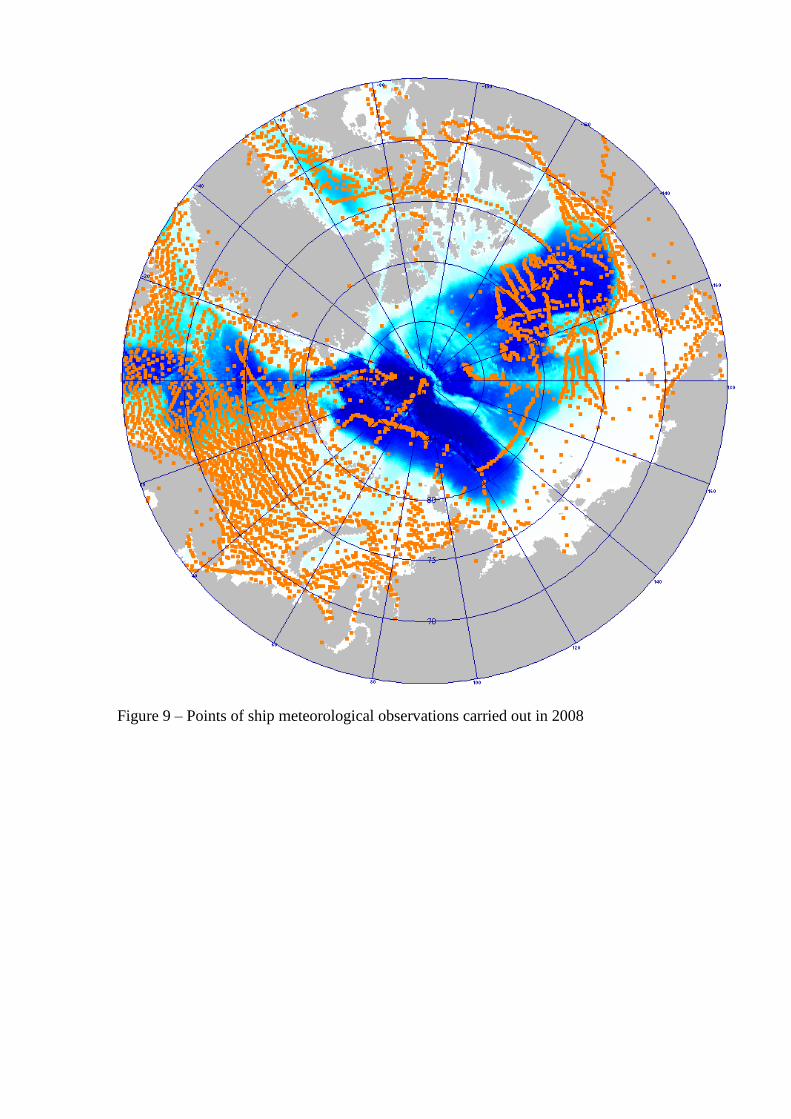
Figure 9 – Points of ship meteorological observations carried out in 2008
9.2. Data on land surface conditions and resources (rivers and channels)
Name and acronym:
Network of hydrological stations located on rivers and channels
Contact person (e-mail)
I.L. Gotovchenkova ([email protected])
Web site (if any)
http://www.meteo.ru/
Main objective of the network:
Monitoring and forecast of the state of water streams and hydrological hazards, assessment of
water resources.
Type of activity:
- Theme: rivers, channels and other water streams
- Location(s): irregular within the territory of the Russian Federation (Figure 10)
Main variables:
water discharge,
water level,
water body state,
water temperature,
ice thickness,
suspended sediments discharge,
water turbidity,
granulometric composition,
sediments density.
When operational (year):
Since 1880
Geographical coverage (countries)
Russian Federation
Data archive/centre, including Web site:
RIHMI-WDC, http://www.meteo.ru/
Data availability:
Data can be prepared on request. Consolidated hydrological characteristics – from the moment of
opening of a specific hydrological station, observation data – since 1984.
Key problems:
Initial data before 1984 have not been digitized.
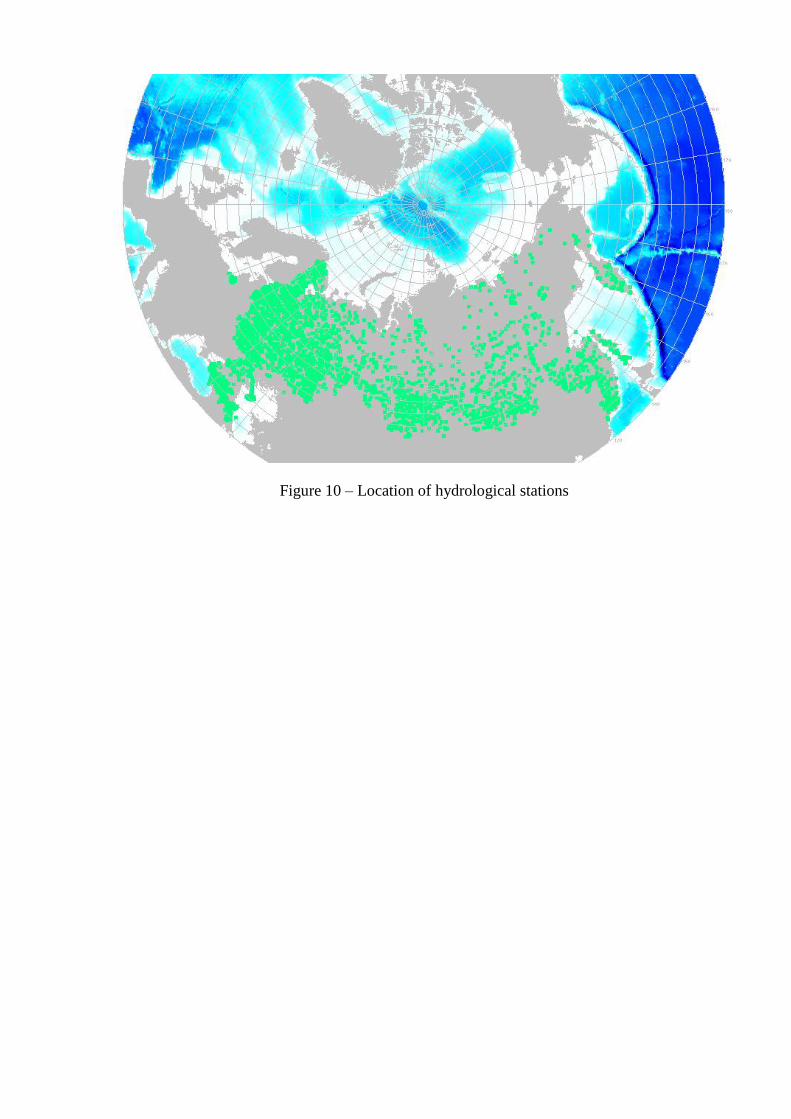
Figure 10 – Location of hydrological stations
9.3. Marine observations
9.3.1 Coastal observations
Name and acronym:
Marine coastal observations
Contact person (e-mail)
A.A. Vorontsov ([email protected])
Web site (if any)
http://data.oceaninfo.ru/
Main objective of the network:
Monitoring and forecast of the sea and atmosphere state in the coastal area, support of safety of
navigation and marine activities.
Type of activity:
- Theme: lower atmosphere and sea surface
- Location(s): 178 stations and points on sea coast, islands and estuaries of the Russian
Federation. More than a half of them are located in the Arctic and North regions.
Main variables:
Atmosphere:
air temperature,
air humidity,
type and amount of clouds,
atmosphere pressure,
wind structure,
visual range,
atmosphere phenomena.
Sea:
wave height and direction,
characteristics of surf,
sea level,
tidal characteristics,
surface water temperature and salinity,
characteristics of ice cover.
Observations – every 6 or 12 hours (salinity observations – daily, characteristics of ice cover –
daily or less).
When operational (year):
Since 1804 (Kronshtadt)
Geographical coverage (countries)
Coastline of the Russian Federation
Data archive/centre, including Web site:
RIHMI-WDC, http://www.meteo.ru/

Data availability:
Metadata – station certificates are available on-line (http://data.oceaninfo.ru/meta/)
Data can be prepared on request (observation data since 1977, daily average data from specific
stations since 1957)
Key problems:
Initial data before 1977 have not been digitized.
9.3.2 Oceanographic observations
Name and acronym:
Oceanographic observations
Contact person (e-mail)
N.N. Mikhaylov ([email protected])
Web site (if any)
http://data.oceaninfo.ru/
Main objective of the network:
Monitoring and forecast of the sea and ocean state, support of safety of navigation and marine
activities.
Type of activity:
- Theme: atmosphere surface layer, sea surface and deep layers
- Location(s): Arctic seas and Arctic Ocean. Observations are conducted from vessels, drift ice
(North Pole station) and autonomous buoys (Figure 11).
Main variables:
Atmosphere:
air temperature,
air humidity,
type and amount of clouds,
atmosphere pressure,
wind structure,
visual range,
atmosphere phenomena.
Sea surface:
wave height and direction,
characteristics of ice cover
Observations – every 6 or 12 hours
Deep-sea observations:
water temperature,
sea water salinity,
hydrochemical parameters (oxygen content, alcalinity, concentration of biogenic
elements).
current direction and speed.
When operational (year):
Since 1866
Geographical coverage (countries)
Arctic seas of the Russian Federation and Arctic Ocean.
Data archive/centre, including Web site:
RIHMI-WDC, http://www.meteo.ru/
Data availability:
Metadata – catalog of expeditions, information on vessels and organizations is available on-line -
http://data.oceaninfo.ru/meta/
Data are available on-line - http://data.oceaninfo.ru/srbd_data/index.jsp

Metadata and data for the 2007/08 IPY period are available on-line - http://www.mpg-info.ru/
Key problems:
Additional control is needed for historical data, especially with regard to hydrochemical
parameters.
Figure 11 – Points of deep-sea oceanographic observations, research vessels and North Pole-35
in 2008.
10. Network of Permafrost Observations
State of permafrost observational networks in Russia
Introduction
Lack of consistent spatially representative and sufficiently long time series characterizing
the state of permafrost and its dynamics under changing climatic conditions necessitates
improvement and further development of observational networks. The purpose of this section is
to provide an insight into the permafrost networks available in the Russian part of the Artic.
Data characterizing the state and dynamics of Russian permafrost in the past several
decades come from three independent sources. The first source of data is soil temperature
observations up to 3.2 m. depth conducted at selected meteorological stations. These
conventional measurements are not specifically targeted at studying permafrost parameters. Two
other networks, authorized under the Global Climate Observing System (GCOS) and its
associated organizations, have been developed for monitoring permafrost temperature and
seasonal thaw depth. Temperature observations in the boreholes are conducted under the
framework of the Thermal State of Permafrost (TSP) project. Another source is the data from the
Circumpolar Active Layer Monitoring (CALM) project. Here we give brief description of these
networks and results obtained so far for Russian permafrost regions.
Soil temperature observations at weather stations.
Soil temperatures are measured at selected Russian weather stations by extraction
thermometers enclosed in ebonite pipes and installed at depths 0.2 m, 0.4 m, 0.6 m, 0.8 m, 1.2 m,
1.6 m, 2.0 m, 2.4 m, and 3.2 m under natural surface cover. Survey of available data is given by
(Frauenfeld, O.W., Zhang, T., Barry, R.G., Gilichinsky, D., 2004. Interdecadal changes in
seasonal freeze and thaw depths in Russia. Journal of Geophysical Research, 109 (D05101,
doi:1029/2003JD004245), more detailed description may be found in Russian language
publications, i.e. (Byhovetc, C.C., Sorokovokov, V.A., Martuganov, R.A., Mamukin, V.G.,
Gilichinskiy, D.A., 2007. History of soil temperature observations at meteorological network.
Earth Cryosphere, 11 (1): 7-20; Chudinova, S.M., Byhovetc, C.C., Sorokovokov, V.A., Barry,
R., Zhang, T., Gilichinskiy, D.A., 2003. Changes in soil temperature in Russian during the last
warming period. Earth Cryosphere, 7 (3): 23-30; Sherstukov, A.B., 2007. Soil temperature at
depth up to 320 cm in Russia under the changing climate, Annals of the Russian institute for
hydrometeorological information, Observationinsk, pp. 72-88; Sherstukov, A.B., 2008.
Contemporary changes in the thermal state of permafrost in Russia and impacts for
infrastructure. Ph.D thesis Thesis, Institute of Global Climate and Ecology, Moscow, 135 pp;
Sherstukov, A.B., 2008. Correlation between the soil temperature, air temperature, and snow
depth in Russia. Earth Cryosphere, 12 (1): 79-87. The earlier study by Frauenfeld et al. (2004)
was based on a station network comprised of 242 stations, including those outside the permafrost
regions. The subsequent studies include data from larger network of 461 stations, however, still
only a small portion is located in permafrost region.
Map in figure 12 shows the annual-mean soil temperatures at 3.2 m depth averaged over
the 1976-2006 period (Sherstukov, 2008). Trends of the mean annual soil temperature at 0.8 m,
1.6 m, and 3.2 m depth for 1976-2006 are shown on the maps in figures 13-15 (Sherstukov,
2008).
Changes in the soil temperatures at depth up to 3.2 m are largely coherent with the air
temperature changes, however show depth is also an important factor. In the European part of
Russia air temperature changes account for 20%-50% of total variability of the soil temperature
at 1.6 m depth, while the contribution of the snow depth in total variability is less than 10%. In
the rest of the territory snow depth plays more important role. Map in figure 16 illustrate these
effects. Vertical bars indicate the contribution of each of the two factors to variability of soil
temperatures at 1.6 m depth in 1976-2006 (Sherstukov, 2008).
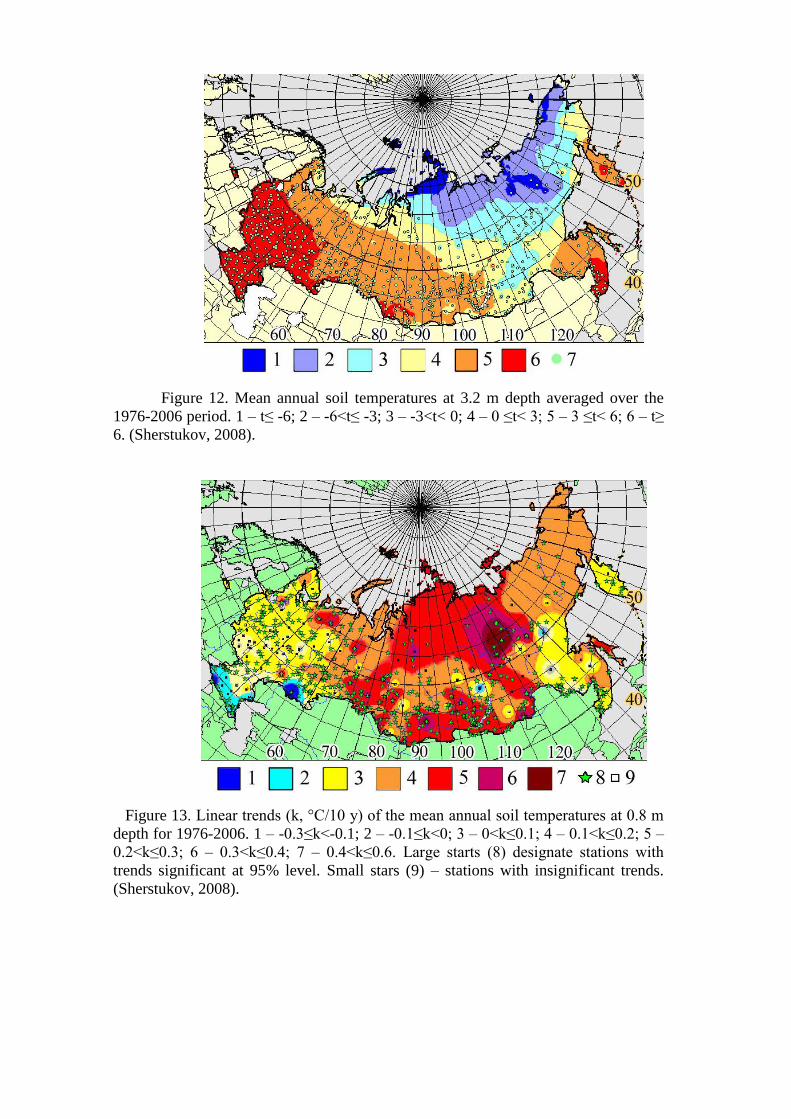
Figure 12. Mean annual soil temperatures at 3.2 m depth averaged over the
1976-2006 period. 1 – t≤ -6; 2 – -6<t≤ -3; 3 – -3<t< 0; 4 – 0 ≤t< 3; 5 – 3 ≤t< 6; 6 – t≥
6. (Sherstukov, 2008).
Figure 13. Linear trends (k, °C/10 y) of the mean annual soil temperatures at 0.8 m
depth for 1976-2006. 1 – -0.3≤k<-0.1; 2 – -0.1≤k<0; 3 – 0<k≤0.1; 4 – 0.1<k≤0.2; 5 –
0.2<k≤0.3; 6 – 0.3<k≤0.4; 7 – 0.4<k≤0.6. Large starts (8) designate stations with
trends significant at 95% level. Small stars (9) – stations with insignificant trends.
(Sherstukov, 2008).
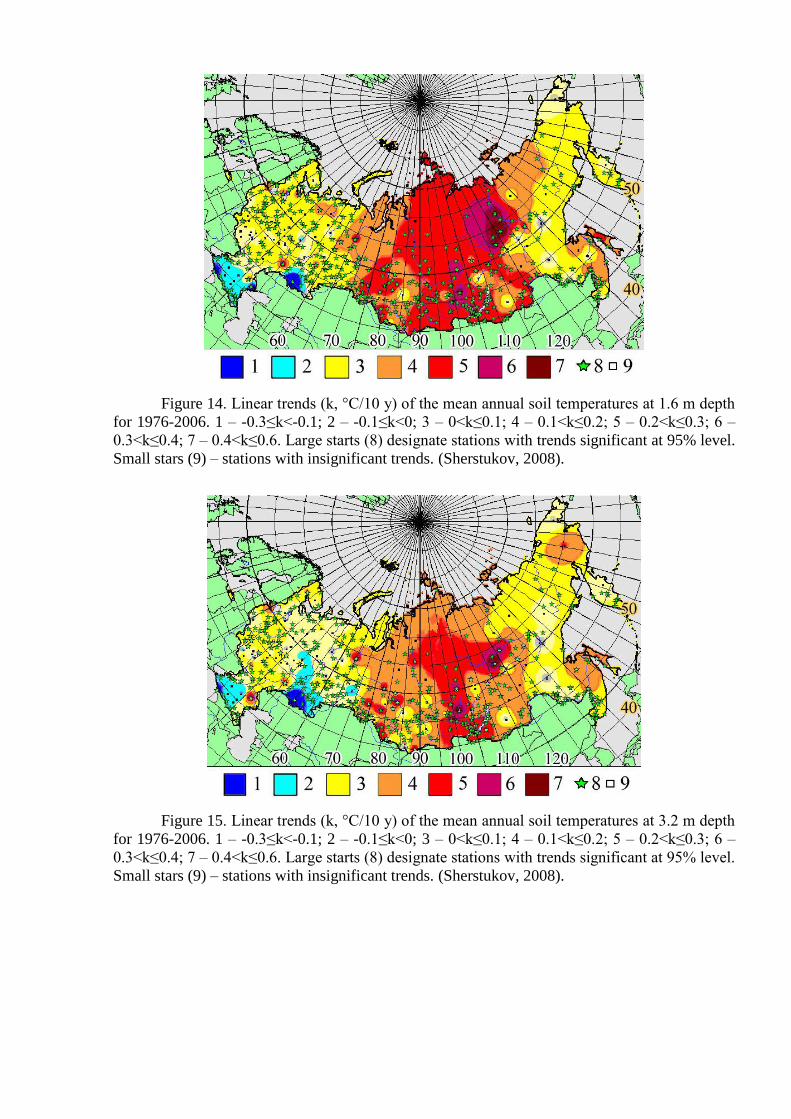
Figure 14. Linear trends (k, °C/10 y) of the mean annual soil temperatures at 1.6 m depth
for 1976-2006. 1 – -0.3≤k<-0.1; 2 – -0.1≤k<0; 3 – 0<k≤0.1; 4 – 0.1<k≤0.2; 5 – 0.2<k≤0.3; 6 –
0.3<k≤0.4; 7 – 0.4<k≤0.6. Large starts (8) designate stations with trends significant at 95% level.
Small stars (9) – stations with insignificant trends. (Sherstukov, 2008).
Figure 15. Linear trends (k, °C/10 y) of the mean annual soil temperatures at 3.2 m depth
for 1976-2006. 1 – -0.3≤k<-0.1; 2 – -0.1≤k<0; 3 – 0<k≤0.1; 4 – 0.1<k≤0.2; 5 – 0.2<k≤0.3; 6 –
0.3<k≤0.4; 7 – 0.4<k≤0.6. Large starts (8) designate stations with trends significant at 95% level.
Small stars (9) – stations with insignificant trends. (Sherstukov, 2008).
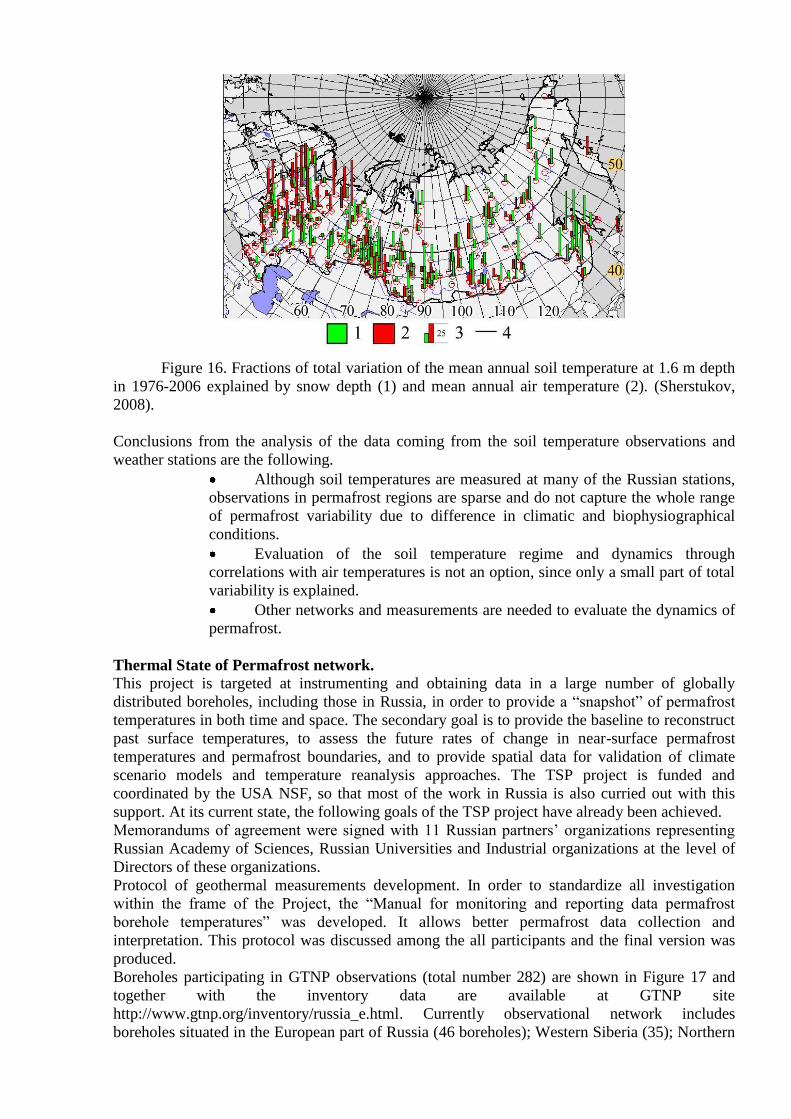
Figure 16. Fractions of total variation of the mean annual soil temperature at 1.6 m depth
in 1976-2006 explained by snow depth (1) and mean annual air temperature (2). (Sherstukov,
2008).
Conclusions from the analysis of the data coming from the soil temperature observations and
weather stations are the following.
Although soil temperatures are measured at many of the Russian stations,
observations in permafrost regions are sparse and do not capture the whole range
of permafrost variability due to difference in climatic and biophysiographical
conditions.
Evaluation of the soil temperature regime and dynamics through
correlations with air temperatures is not an option, since only a small part of total
variability is explained.
Other networks and measurements are needed to evaluate the dynamics of
permafrost.
Thermal State of Permafrost network.
This project is targeted at instrumenting and obtaining data in a large number of globally
distributed boreholes, including those in Russia, in order to provide a “snapshot” of permafrost
temperatures in both time and space. The secondary goal is to provide the baseline to reconstruct
past surface temperatures, to assess the future rates of change in near-surface permafrost
temperatures and permafrost boundaries, and to provide spatial data for validation of climate
scenario models and temperature reanalysis approaches. The TSP project is funded and
coordinated by the USA NSF, so that most of the work in Russia is also curried out with this
support. At its current state, the following goals of the TSP project have already been achieved.
Memorandums of agreement were signed with 11 Russian partners’ organizations representing
Russian Academy of Sciences, Russian Universities and Industrial organizations at the level of
Directors of these organizations.
Protocol of geothermal measurements development. In order to standardize all investigation
within the frame of the Project, the “Manual for monitoring and reporting data permafrost
borehole temperatures” was developed. It allows better permafrost data collection and
interpretation. This protocol was discussed among the all participants and the final version was
produced.
Boreholes participating in GTNP observations (total number 282) are shown in Figure 17 and
together with the inventory data are available at GTNP site
http://www.gtnp.org/inventory/russia_e.html. Currently observational network includes
boreholes situated in the European part of Russia (46 boreholes); Western Siberia (35); Northern
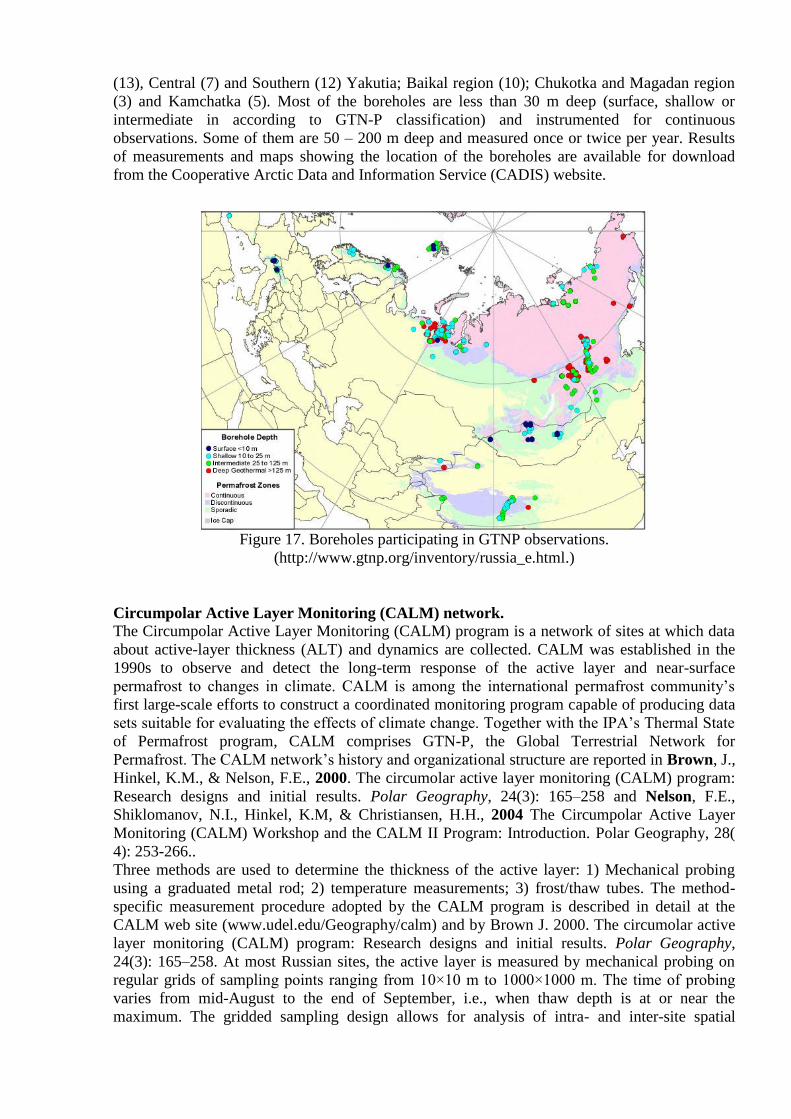
(13), Central (7) and Southern (12) Yakutia; Baikal region (10); Chukotka and Magadan region
(3) and Kamchatka (5). Most of the boreholes are less than 30 m deep (surface, shallow or
intermediate in according to GTN-P classification) and instrumented for continuous
observations. Some of them are 50 – 200 m deep and measured once or twice per year. Results
of measurements and maps showing the location of the boreholes are available for download
from the Cooperative Arctic Data and Information Service (CADIS) website.
Figure 17. Boreholes participating in GTNP observations.
(http://www.gtnp.org/inventory/russia_e.html.)
Circumpolar Active Layer Monitoring (CALM) network.
The Circumpolar Active Layer Monitoring (CALM) program is a network of sites at which data
about active-layer thickness (ALT) and dynamics are collected. CALM was established in the
1990s to observe and detect the long-term response of the active layer and near-surface
permafrost to changes in climate. CALM is among the international permafrost community’s
first large-scale efforts to construct a coordinated monitoring program capable of producing data
sets suitable for evaluating the effects of climate change. Together with the IPA’s Thermal State
of Permafrost program, CALM comprises GTN-P, the Global Terrestrial Network for
Permafrost. The CALM network’s history and organizational structure are reported in Brown, J.,
Hinkel, K.M., & Nelson, F.E., 2000. The circumolar active layer monitoring (CALM) program:
Research designs and initial results. Polar Geography, 24(3): 165–258 and Nelson, F.E.,
Shiklomanov, N.I., Hinkel, K.M, & Christiansen, H.H., 2004 The Circumpolar Active Layer
Monitoring (CALM) Workshop and the CALM II Program: Introduction. Polar Geography, 28(
4): 253-266..
Three methods are used to determine the thickness of the active layer: 1) Mechanical probing
using a graduated metal rod; 2) temperature measurements; 3) frost/thaw tubes. The method-
specific measurement procedure adopted by the CALM program is described in detail at the
CALM web site (www.udel.edu/Geography/calm) and by Brown J. 2000. The circumolar active
layer monitoring (CALM) program: Research designs and initial results. Polar Geography,
24(3): 165–258. At most Russian sites, the active layer is measured by mechanical probing on
regular grids of sampling points ranging from 10×10 m to 1000×1000 m. The time of probing
varies from mid-August to the end of September, i.e., when thaw depth is at or near the
maximum. The gridded sampling design allows for analysis of intra- and inter-site spatial
variability and yields information useful for examining interrelations between physical and
biological parameters. Grids are established at undisturbed locations, characteristic of dominant
environmental conditions. Their size varies depending on site geometry, and the level of natural
variability of surface and subsurface conditions. In general, 10×10 m to 100×100m size grids are
established within relatively homogeneous landscape units. Several sites contain a number of
grids representing various landscape units within the area. The 100×100 m to 1000× 1000 m
grids usually encompass several characteristic landscapes within the area. CALM adopts a
systematic sampling scheme for thaw depth measurements on most grids. The systematic
sampling design involves annual replicate measurement at regularly spaced grid nodes. With a
few exceptions, each 10, 100, and 1000 m -side grid contains 121 nodes distributed evenly at 1,
10, and 100 m spacing respectively.
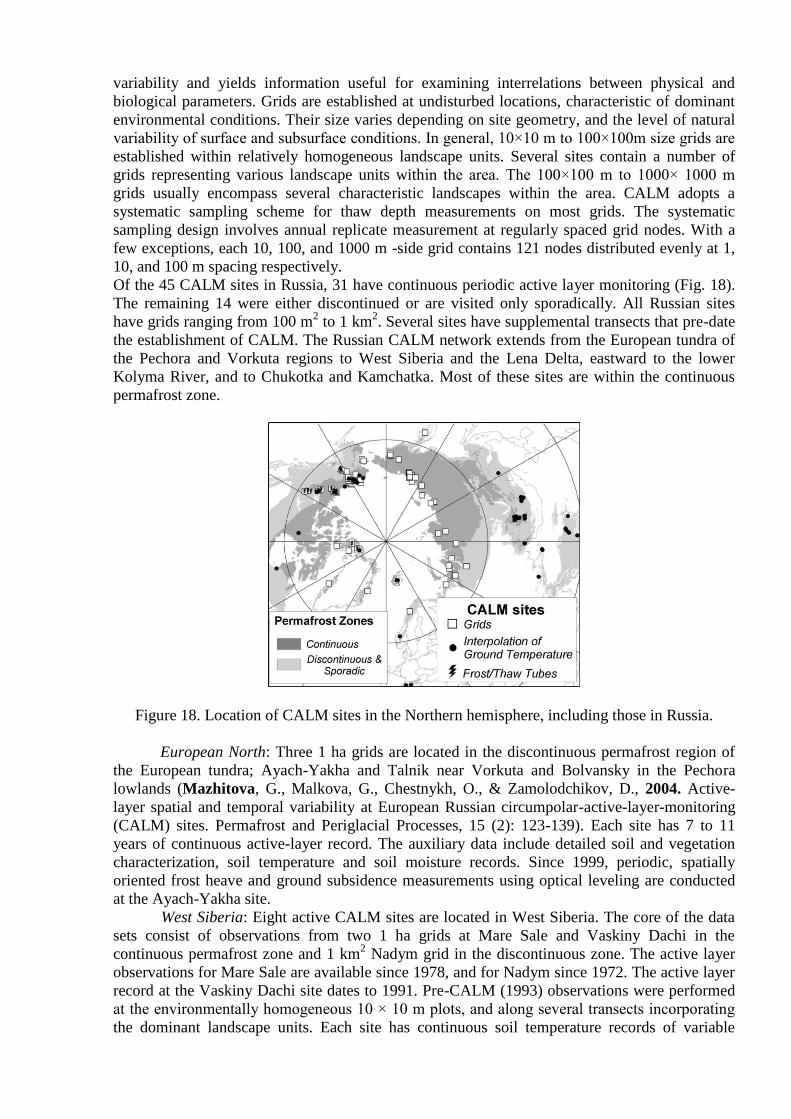
Of the 45 CALM sites in Russia, 31 have continuous periodic active layer monitoring (Fig. 18).
The remaining 14 were either discontinued or are visited only sporadically. All Russian sites
have grids ranging from 100 m2 to 1 km
2. Several sites have supplemental transects that pre-date
the establishment of CALM. The Russian CALM network extends from the European tundra of
the Pechora and Vorkuta regions to West Siberia and the Lena Delta, eastward to the lower
Kolyma River, and to Chukotka and Kamchatka. Most of these sites are within the continuous
permafrost zone.
Figure 18. Location of CALM sites in the Northern hemisphere, including those in Russia.
European North: Three 1 ha grids are located in the discontinuous permafrost region of
the European tundra; Ayach-Yakha and Talnik near Vorkuta and Bolvansky in the Pechora
lowlands (Mazhitova, G., Malkova, G., Chestnykh, O., & Zamolodchikov, D., 2004. Active-
layer spatial and temporal variability at European Russian circumpolar-active-layer-monitoring
(CALM) sites. Permafrost and Periglacial Processes, 15 (2): 123-139). Each site has 7 to 11
years of continuous active-layer record. The auxiliary data include detailed soil and vegetation
characterization, soil temperature and soil moisture records. Since 1999, periodic, spatially
oriented frost heave and ground subsidence measurements using optical leveling are conducted
at the Ayach-Yakha site.
West Siberia: Eight active CALM sites are located in West Siberia. The core of the data
sets consist of observations from two 1 ha grids at Mare Sale and Vaskiny Dachi in the
continuous permafrost zone and 1 km2 Nadym grid in the discontinuous zone. The active layer
observations for Mare Sale are available since 1978, and for Nadym since 1972. The active layer
record at the Vaskiny Dachi site dates to 1991. Pre-CALM (1993) observations were performed
at the environmentally homogeneous 10 × 10 m plots, and along several transects incorporating
the dominant landscape units. Each site has continuous soil temperature records of variable
length and detailed spatial landscape, soil, and vegetation characterizations. An additional 1 ha
site was established in the continuous permafrost zone in 2005. During the summer of 2007 four
grids were established in the discontinuous permafrost zone in landscapes inadequately
represented by the Nadym grid.
Central Siberia: In association with the GEWEX Asian Monsoon Experiment (GAME)
program in the Siberian Arctic, a 1 km2 CALM grid was established in 1997 near Tiksi, on the
Lena River. The site-specific data base is available in the GAME Siberia website
(http://www.hyarc.nagoya-u.ac.jp/game/siberia/index.html). Thaw depth measurements are also
available for two 1 ha grids representing different landscapes of the Lena delta since 2004.
Lower Kolyma River: Beginning in 1996, a series of 15 1 ha grids spanning a distance of
approximately 300 km was established to represent characteristic climatic and environmental
conditions in the Kolyma-Indigirka lowlands on the northeast Eurasian tundra (Fyodorov-
Davydov, D.G., Sorokovikov, V.A., Ostroumov, V.E., Kholodov, A.L., Mitroshin,
N.S., Mergelov, I.A., Davydov, S.P., Zimov, S.A., & Davydova, A.I., 2004. Spatial and
Temporal Observations of Seasonal Thaw in the Northern Kolyma Lowland. Polar Geography,
28 (4): 308-325). At present, 11 sites are reporting data. Annual active-layer and soil temperature
observations are carried out at the five most accessible sites situated in close proximity to the
North-East Scientific Station in Cherskyi in the transitional zone between taiga and tundra.
Logistical problems led to some interruptions in observations at the remaining six sites. All sites
have detailed descriptions of surface and subsurface conditions.
Chukotka and Kamchatka Peninsulas: Beginning in 1996, a Mt. Dionisy site was
established on the Chukotka Peninsula. A new site was initiated at Lavrentia along the Chukchi
Sea coast in 2000 (Zamolodchikov, D.G., Kotov, A.N., Karelin, D.V. & Razzhivin, V.Y., 2004.
Active-Layer Monitoring in Northeast Russia: Spatial, Seasonal, and Interannual Variability.
Polar Geography 28 (4): 286-307). Both sites consist of 1 ha grids. Annual soil moisture
observations and detailed soil characterizations are available for Lavrentia site. Active layer
records are also available for two 1 ha grids on Kamchatka since 2003.
CALM is the oldest and most comprehensive permafrost-oriented international global-
change monitoring program, and has achieved considerable success in this role. Although the
CALM network continues to grow in terms of the number of participating sites and the quantity
and quality of observations, two outstanding data issues remain to be resolved.
1) Continuation of periodic measurements: This problem relates to difficulties
associated with unattended operation of scientific equipment at remote
locations and periodic accessibility of sites. For example, approximately one-
fourth of Russian sites were discontinued during the last five years due to
substantial increases in logistical costs. A large number of sites have suffered
from equipment malfunction and vandalism.
2) The methodology of simple sharing of basic data, adopted by CALM in the
late 1990s, does not entirely satisfy the growing needs of the increasingly
international and interdisciplinary scientific community and general public.
Newly developed web-based database and mapping applications provide more
advanced and user-friendly vehicles for presenting and sharing geographically
referenced information.
11. Network of Glacier Observations
Name and acronym: Permanent research base in the field of glaciology in Barentsburg (Spitsbergen).
Contact person (e-mail) Lev Savatyugin, AARI, [email protected]
Nikolay Osokin, RAS IO,
Ivan Lavrentiev, RAS IO
Web site http://www.glac.igras.ru
http://www.aari.ru/main.php
Main objective of the network: 1. Snow cover (Spitsbergen)
- Study of multi-year changes in snowiness near Nordenskiöld Land
- Study of impact of spring-summer snow melting on superimposed (infiltration) ice formation
on glacier surface
- Study of mechanical and thermophysical properties of snow cover in different Spitsbergen
landscapes
- Study of impact of snowiness and summer melting conditions on the STL conditions under
modern climate change (by the example of multi-year measurements near Barentsburg)
- Study of structure and dynamics of large and multi-year snowfields as indicators of current
climate change in this region.
Contact person: Nikolay Osokin ([email protected]), Ivan Lavrentiev <[email protected]>
2. Spitsbergen glacier surge mechanism:
- Studies on Grenfjord non-surging glacier Fridtjovbreen surging glacier. Methods:
radiolocation, radiophysics, DGPS, mass balance.
Contact person: Yury Macharet <[email protected]>
3. Monitoring of Spitsbergen polythermal glaciers to assess long-period climate change.
Objects of long-term monitoring of changes in geometry and hydrothermal structure of
polythermal glaciers: Tavle, Aldegonga
Contact person: Yury Macharet <[email protected]>
4. Ice deposits on Spitsbergen
- Obtaining of new data on glacier thickness and volume
- Definition of correlation relationships
- Contribution of glaciers to world ocean level
Contact person: Andrey Glazovsky <[email protected]>
5. Glacier mass balance on Nordenskiöld Land (Spitsbergen):
- Aldegonga, Eastern Grenfjord, Tavle
- Development of new methods of mass balance measurement: core and non-core drilling,
DGPS, temperature survey.
Contact person: Andrey Glazovsky <[email protected]>
6. Remote sensing (RSD), (Novaya Zemlya, FJL)

Development of GIS-base for glaciers on the Russian Arctic archipelagos for remote monitoring
of their current state and changes. Assessment of iceberg discharge and ice caps. Observation of
glacier dynamics.
Contact person: Andrey Glazovsky <[email protected]>, Yury Macharet
7. Remote sensing and validation (if possible) in situ (Russian Subarctic mountains – Polar
Urals, Byrranga, Putorana, Suntar-Khayata mountains, Chersky Range, Koryak Upland,
Chukotka)
Executors: M. Ivanov, G.A. Nosenko, M.D. Ananicheva, G.A. Kapustin et al (RAS IO),
[email protected], [email protected], [email protected], V.A. Sarana, MSU, Research
Laboratory “North’s Ecology”, <[email protected]>
Member of or connected to a global network; if yes, which:
Established partnerships: www.glims.org;
Cooperation is planned with Scientific Center of Operational Earth Monitoring to use remote
sensing data.
Type of activity:
Data are given for Barentsburg station
- atmosphere (RAS PGI, Murmansk)
- coastal ecosystem, including freshwater (yes/no)
- marine ecosystem:
Biological center on Spitsbergen. MMBI, Murmansk (http://www.mmbi.info)
Integrated study on Spitsbergen has been carried out since 1994 in the biological center within
the framework of MMBI’s International Environmental Laboratory.
The main areas of scientific activities on Spitsbergen are as follows: acquisition of comparative
data on biodiversity of flora and fauna and marine ecosystems on the north part of the Gulf
Stream western branch; development of the model of the impact of melting (fresh) waters on the
marine ecosystem in glacier bays of different types on western Spitsbergen; monitoring of Arctic
ecosystems evolution and other natural phenomena.
- ocean AARI, Saint Petersburg (http://www.aari.ru/main.php?lg=1)
- cryosphere: periodic observations of snow cover and glaciers and seasonally melting layer of
permafrost formation on Spitsbergen. Remote observations of Novaya Zemlya and FJL glaciers.
- human factor anf socio-economic indicators
(http://igras.ru/index.php?r=17&id=12)
- space physics - (http://www.kolasc.net.ru/pgi_r/)
Main variables:
- mass balance (Aldegonga glacier, planned for Spitsbergen’s Tavle, Eastern Grenfjord glaciers)
- ice thickness (Novaya Zemlya, FJL)
- area and length of outlet glaciers (Novaya Zemlya, FJL)
- area, length and height of the equilibrium line, mass balance elements – (Russian Subarctic
mountains, RSD, periodic field work)
When operational (year): Modern observations: start:
Spitsbergen – 2002/2003
Novaya Zemlya, FJL – remote sensing started in 2001
Putorana – started since the mid-1990s
Khibins – periodically observed by MSU and RAS Kola Scientific Center since the 1970s
Byrranga – since 2001

Suntar-Khayata mountains, started in 2001, last field work – in 2008.
Polar Urals – started in the late 1990s, assessment of the current state of glaciers according to
RSD and in situ
Chukotka (Meynypilgynsky Range) – periodic expeditions since the 1990s.
Geographical coverage (countries)
Spitsbergen, in the vicinity of Barentsburg and Pyramid
Novaya Zemlya
Franz Josef Land
Russian Subarctic mountains
Data archive/centre, including Web site:
Not yet, the “Ice and Snow” magazine, Nauka Publisher, web-site is being developed, which will
include the main glaciology publications. Magazine “Materials of Glaciological Studies”
published until recently has a web-site - http://mgi.igras.ru/
Data availability:
No access currently exists.
12. Network of the Arctic Environmental Pollution Observations
Name and acronym: Local network of pollution control in Barentsburg (Spitsbergen)
(North-West Branch, SPA Typhoon)
Contact person (e-mail) Boris N. Demin ([email protected])
Web site www.typhoon.observationinsk.ru
Main objective of the network: Local monitoring, Barentsburg: regular sampling, twice a year
Member of or connected to a global network; if yes, which:
Type of activity:
- Theme: environmental pollution
- Location(s): Spitsbergen
- Community-based: data are used in Russian and international programs
- Coordination, e.g. not directly involved in observations, but coordinating data and information
(e.g., AMAP): Data are collected and databases are created by North-West Branch, SPA
Typhoon
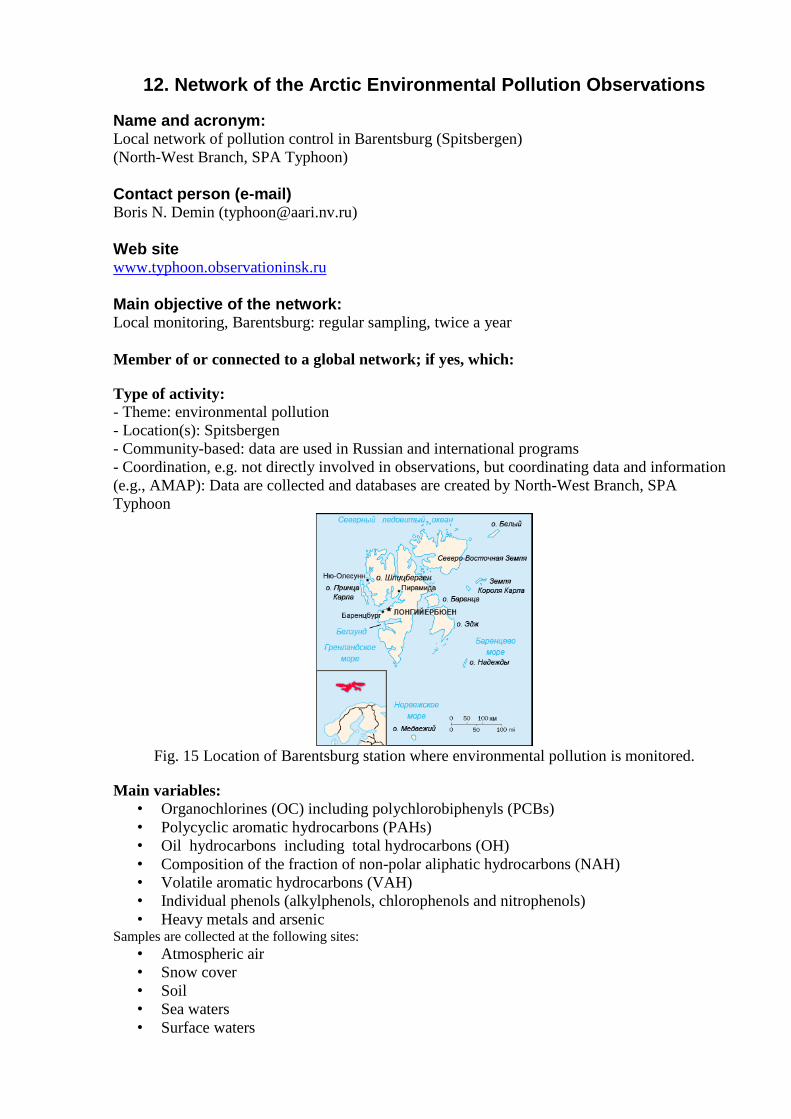
Fig. 15 Location of Barentsburg station where environmental pollution is monitored.
Main variables:
• Organochlorines (OC) including polychlorobiphenyls (PCBs)
• Polycyclic aromatic hydrocarbons (PAHs)
• Oil hydrocarbons including total hydrocarbons (OH)
• Composition of the fraction of non-polar aliphatic hydrocarbons (NAH)
• Volatile aromatic hydrocarbons (VAH)
• Individual phenols (alkylphenols, chlorophenols and nitrophenols)
• Heavy metals and arsenic Samples are collected at the following sites:
• Atmospheric air
• Snow cover
• Soil
• Sea waters
• Surface waters

• Bottom sediments
• Land flora
When operational (year):
Geographical coverage (countries)
Spitsbergen
Data archive/centre, including Web site:
North-West Branch, SPA Typhoon, Roshydromet, Russia,
http://www.typhoon.observationinsk.ru/
Data availability:
13. Monitoring of Biodiversity in the Arctic
(Birds and partially marine biodiversity)
Seabirds
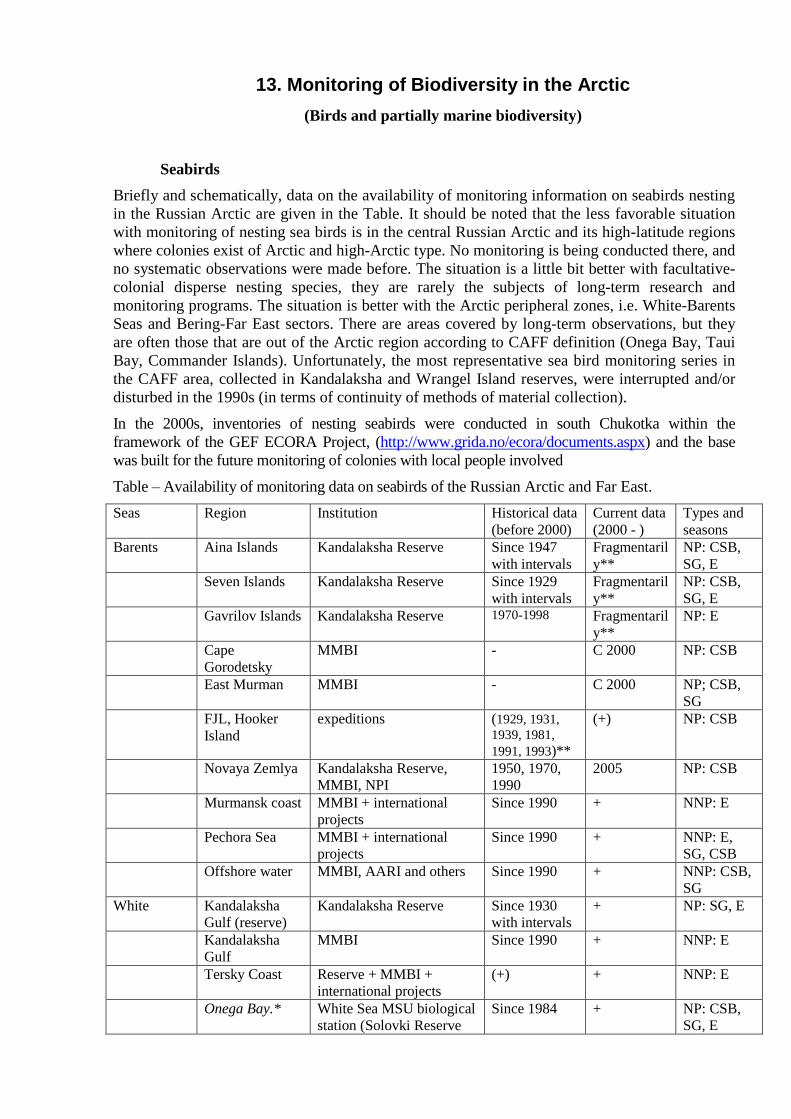
Briefly and schematically, data on the availability of monitoring information on seabirds nesting
in the Russian Arctic are given in the Table. It should be noted that the less favorable situation
with monitoring of nesting sea birds is in the central Russian Arctic and its high-latitude regions
where colonies exist of Arctic and high-Arctic type. No monitoring is being conducted there, and
no systematic observations were made before. The situation is a little bit better with facultative-
colonial disperse nesting species, they are rarely the subjects of long-term research and
monitoring programs. The situation is better with the Arctic peripheral zones, i.e. White-Barents
Seas and Bering-Far East sectors. There are areas covered by long-term observations, but they
are often those that are out of the Arctic region according to CAFF definition (Onega Bay, Taui
Bay, Commander Islands). Unfortunately, the most representative sea bird monitoring series in
the CAFF area, collected in Kandalaksha and Wrangel Island reserves, were interrupted and/or
disturbed in the 1990s (in terms of continuity of methods of material collection).
In the 2000s, inventories of nesting seabirds were conducted in south Chukotka within the
framework of the GEF ECORA Project, (http://www.grida.no/ecora/documents.aspx) and the base
was built for the future monitoring of colonies with local people involved
Table – Availability of monitoring data on seabirds of the Russian Arctic and Far East.
Seas Region Institution Historical data
(before 2000)
Current data
(2000 - )
Types and
seasons
Barents Aina Islands Kandalaksha Reserve Since 1947
with intervals
Fragmentaril
y**
NP: CSB,
SG, E
Seven Islands Kandalaksha Reserve Since 1929
with intervals
Fragmentaril
y**
NP: CSB,
SG, E
Gavrilov Islands Kandalaksha Reserve 1970-1998 Fragmentaril
y**
NP: E
Cape
Gorodetsky
MMBI - C 2000 NP: CSB
East Murman MMBI - C 2000 NP; CSB,
SG
FJL, Hooker
Island
expeditions (1929, 1931,
1939, 1981,
1991, 1993)**
(+) NP: CSB
Novaya Zemlya Kandalaksha Reserve,
MMBI, NPI
1950, 1970,
1990
2005 NP: CSB
Murmansk coast MMBI + international
projects
Since 1990 + NNP: E
Pechora Sea MMBI + international
projects
Since 1990 + NNP: E,
SG, CSB
Offshore water MMBI, AARI and others Since 1990 + NNP: CSB,
SG
White Kandalaksha
Gulf (reserve)
Kandalaksha Reserve Since 1930
with intervals
+ NP: SG, E
Kandalaksha
Gulf
MMBI Since 1990 + NNP: E
Tersky Coast Reserve + MMBI +
international projects
(+) + NNP: E
Onega Bay.* White Sea MSU biological
station (Solovki Reserve
Since 1984 + NP: CSB,
SG, E
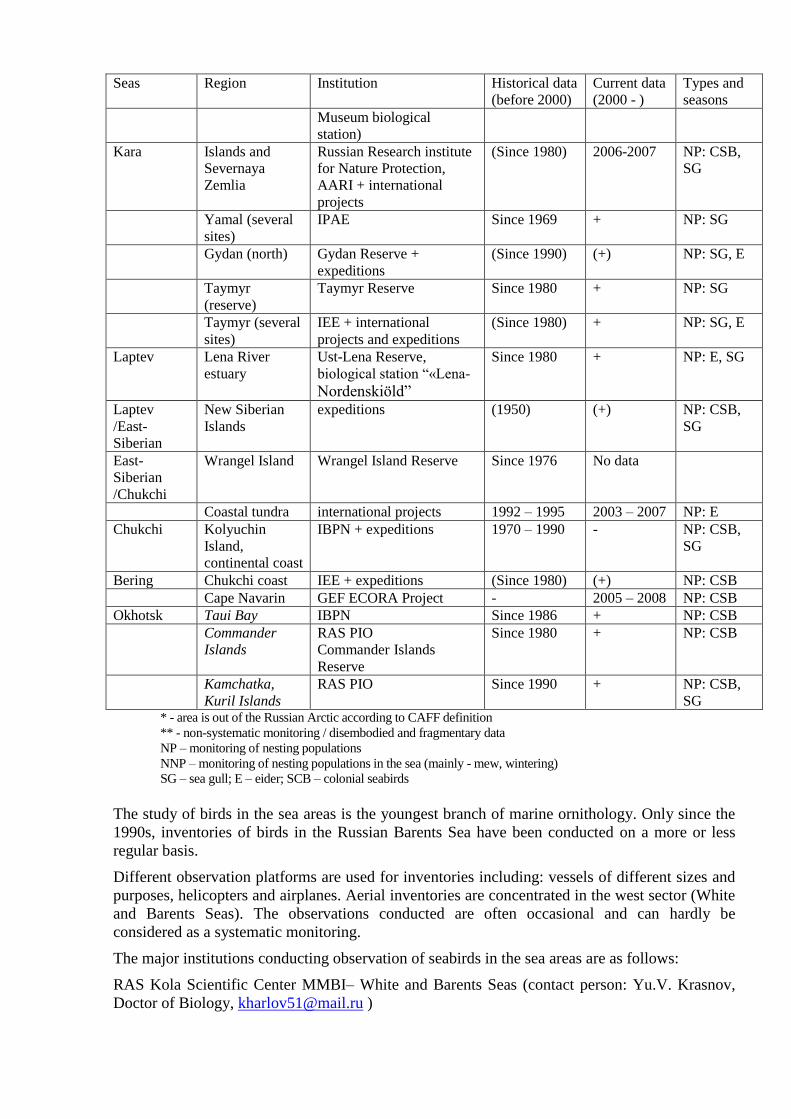
Seas Region Institution Historical data
(before 2000)
Current data
(2000 - )
Types and
seasons
Museum biological
station)
Kara Islands and
Severnaya
Zemlia
Russian Research institute
for Nature Protection,
AARI + international
projects
(Since 1980) 2006-2007 NP: CSB,
SG
Yamal (several
sites)
IPAE Since 1969 + NP: SG
Gydan (north) Gydan Reserve +
expeditions
(Since 1990) (+) NP: SG, E
Taymyr
(reserve)
Taymyr Reserve Since 1980 + NP: SG
Taymyr (several
sites)
IEE + international
projects and expeditions
(Since 1980) + NP: SG, E
Laptev Lena River
estuary
Ust-Lena Reserve,
biological station “«Lena- Nordenskiöld”
Since 1980 + NP: E, SG
Laptev
/East-
Siberian
New Siberian
Islands
expeditions (1950) (+) NP: CSB,
SG
East-
Siberian
/Chukchi
Wrangel Island Wrangel Island Reserve Since 1976 No data
Coastal tundra international projects 1992 – 1995 2003 – 2007 NP: E
Chukchi Kolyuchin
Island,
continental coast
IBPN + expeditions 1970 – 1990 - NP: CSB,
SG
Bering Chukchi coast IEE + expeditions (Since 1980) (+) NP: CSB
Cape Navarin GEF ECORA Project - 2005 – 2008 NP: CSB
Okhotsk Taui Bay IBPN Since 1986 + NP: CSB
Commander
Islands
RAS PIO
Commander Islands
Reserve
Since 1980 + NP: CSB
Kamchatka,
Kuril Islands
RAS PIO Since 1990 + NP: CSB,
SG * - area is out of the Russian Arctic according to CAFF definition
** - non-systematic monitoring / disembodied and fragmentary data
NP – monitoring of nesting populations
NNP – monitoring of nesting populations in the sea (mainly - mew, wintering)
SG – sea gull; E – eider; SCB – colonial seabirds
The study of birds in the sea areas is the youngest branch of marine ornithology. Only since the
1990s, inventories of birds in the Russian Barents Sea have been conducted on a more or less
regular basis.
Different observation platforms are used for inventories including: vessels of different sizes and
purposes, helicopters and airplanes. Aerial inventories are concentrated in the west sector (White
and Barents Seas). The observations conducted are often occasional and can hardly be
considered as a systematic monitoring.
The major institutions conducting observation of seabirds in the sea areas are as follows:
RAS Kola Scientific Center MMBI– White and Barents Seas (contact person: Yu.V. Krasnov,
Doctor of Biology, [email protected] )
Roshydromet’s AARI – White and Barents Seas, Siberian shelf seas (contact person: M.V.
Gavrilo, [email protected] ).
RAS IO Pacific Branch (Yu.Artyukhin, [email protected]) and RAS Far Eastern
Branch IBPN – Bering and Okhotsk Seas
Waders and Other Tundra Birds
In Arctic terrestrial communities, waders dominate among both in terms of number of species
and population density. The stable study of ecology and population dynamics of waders in the
Russian Arctic started in the 1970s. In the subsequent 20 years, the study has been conducted in
different parts of the Russian Arctic, from Bolshezemelskaya tundra to Chukotka as well as on
some islands. The work by the scientists from RAS Ural Branch IPEA (USSR RAS Ural
Branch’s Institute of Plant and Animal Ecology) fitted the best the requirements of monitoring
(study of waders at permanent sites on Yamal). Since 2000, monitoring of birds (not only
waders) has been conducted at permanent inventory sites in the Ob river lower reach in forest
tundra zone (M.G. Golovatin) and on the southern Yamal since 2002 (V.A. Sokolov).
In the 1990s to present, monitoring of the number of waders is conducted in Arctic reserves
(Kandalsksha, Nenets, Gydan, Bolshoi Taymyr, Arctic, Ust-Lena, Wrangel Island) within the
framework of respective sections of “Nature Records”. However, this work was usually
performed using route inventories, which resulted in a number of waders only.
In the early 1990s, intensive ornithological studies were carried out on Taymyr (two continuous
wader monitoring points were established). Monitoring on the north-west Taymyr has been
conducted up to now at permanent sites on V. Barents station (territory of Bolshoi Arctic
Reserve). On the south-east and central Taymyr, the studies are supported by Taymyrsky State
Biosphere Reserve. Since 2004, Dutch researchers (Alterra Institute, Netherlands) survey the
sites of wader monitoring in the Pyasina estuary.
Since 2000, the RAS Institute of Plant and Animal Ecology expeditions work on the Chukotka
Peninsula. Intensive studies in the vicinity of Meynypilgino started in 2003 mainly focused on
nesting biology of spoon-billed sandpipers can be also considered as wader monitoring.
Since 1988, the Working Group on Waders started collecting data on successful breeding of
waders in the Arctic. Annual reviews of these data were published in 1989-1999 Information
Materials of the Working Group on Waders available in electronic format on the Group web-site
(http://www.waders.ru ). Their English translation was also published in the Wader Study Group
Bulletin and then in a separate volume of "Proceedings of Wader Study Conference, Odessa”
(International Wader Studies, vol. 10). Later on, the project was expanded not only
geographically – all Arctic ground nesting birds became subjects of research – received the name
"The Arctic Birds Breeding Conditions Survey” (ABBCS). Since 1999, the annual bulletin
“Arctic Birds” is published in Russian and English and is distributed among interested
researchers. The Bulletin contains not only information from specific research sites and overview
of the situation in regions but also an annual analysis of a share of young waders on Australian
wintering grounds. The most information obtained from respondents is published on the Project
web-site http://www.arcticbirds.ru. Besides the descriptions of breeding conditions, the site
contains periodically updated general maps of successful breeding, populations of rodents and air
temperature in the Arctic since 1988. Data on populations and nesting status of specific species
can be obtained on on-line request to the database. Electronic versions of “Arctic Birds” and
project questionnaires can also be downloaded from the web-site.
Project Coordinators
M.Yu. Soloviev (Department of Zoology of Vertebrates, MSU Biological Faculty,
P.S. Tomkovich (MSU Zoo Museum, [email protected] ).
International Cooperation
ARCTIC COUNCIL / CAFF
In the Russian Federation, the procedures were determined for the fulfillment of obligations
under CAFF programs:
The RF Ministry of Natural Resources is the body responsible for the fulfillment of obligations
under CAFF programs.
V.A.Orlov (Russian MNR) is the representative of Russia to CAFF Bureau
E-mail: [email protected]
Yu.A.Buyvolov (Rosprirodnadzor) is the coordinator for collection and fusion of information in
the reserves within the territory of the Russian Arctic.
E-mail: [email protected]
Within the framework of Arctic countries cooperation under the Arctic Council’s Conservation
of Arctic Flora and Fauna Program (CAFF), the CBird group CAFF was established to
coordinate research and support conservation of Arctic seabirds. Two Russian representatives are
members of the Group coordinating information from the west and east sectors of the Russian
Arctic. Currently, they are AARI (west sector, M.V.Gavrilo, [email protected] ) and RAS IO
Pacific Branch representatives (east sector, Yu.Artyukhin, [email protected] ).
Recent initiative within the framework of Arctic Council is the Circumpolar Biodiversity
Monitoring Program (CBMP) - the Integrated Arctic Biodiversity Monitoring Network.
www.caff.is/CBMP
A key objective of the CBMP is to create an effective mechanism and transparent platform to
facilitate the access to information on the state and trends of biodiversity in the Arctic, preferably
on the base of raw data and in digital format. An overarching challenge for the CBMP is to be able
to detect Arctic biodiversity trends in reasonable time frames, identify the underlying causes of
these trends and report on trends the most efficient way. Contributors and data range widely across the Arctic biodiversity community and outside. Partner
programs within the Arctic Council and others are invited to participate and to contribute. The
CBMP is nested in a global initiative lead by the CBD to halt the loss of biodiversity by 2010, and is
also closely linked with other Arctic Council Declarations.
The program can be accomplished by several ways: through special international expert
networks (e.g. group on anseriformes, group on seabirds, etc), through international information
centers (e.g. WCMC), and finally through the contributions of national information networks or
monitoring centers.
The Russian Federation contribution supported to some extent by stable government funding is
collection and fusion of information in Arctic reserves. Observations at scientific stations (RAS,
Roshydromet, the Ministry of Education, etc) can be considered as relatively stable.
Irregular and non-coordinated monitoring observations are carried out by extracting companies
having long-term licenses and license agreements in the Arctic.
Expert groups have been established, e.g. the Marine Expert Monitoring Group, in which
I.A.Melnikov is an expert from Russia (RAS IO, [email protected])
BILATERAL AND INTERNATIONAL COOPERATION
Research and monitoring in regions is coordinated within the framework of bilateral
international cooperation.
Russian-Norwegian cooperation in the field of the study of sea and aquatic birds is one of the
most active and fruitful directions within the framework of bilateral cooperation in
environmental protection in the Barents Sea Region. The Russian-Norwegian Expert Group on
seabirds was established in 1989 as a part of the Joint Russian-Norwegian Commission on
Environmental Cooperation. The representative of the main Russian institutions involved in

ornithological studies in the Barents and White Seas are permanent participants of Russian-
Norwegian cooperation in the study of seabirds:
Roshydromet’s Arctic and Antarctic Research Institute (AARI), Saint Petersburg.
RAS Institute of Geography (RAS IO), Moscow;
Moscow State University, White Sea Biological Station Solovki Branch (MSU),
Moscow;
RAS Kola Scientific Center’s Murmansk Marine Biological Institute (RAS
MMBI), Murmansk;
Kandalaksha Reserve (KReserve), Kandalaksha;
Ministry of Natural Resources Russian Research institute for Nature Protection,
Moscow.
Russian-American cooperation under the Project “Conservation of seabird populations and their
management” is based on the Cooperation Agreement in the field of Environmental Protection
and Natural Resources between the RF and the US Governments (signed in 1994 to replace the
1972 Agreement that had expired). The main Russian partners are RAS Far Eastern Branch
IBPN, RAS IEE, RAS PIO.
GEF PROJECT (GLOBAL ENVIRONMENTAL FACILITY)
In the 2000, inventories of nesting aquatic birds were carried out at three model sites in the Russian
Arctic: Kolguev Island, Kolyma lower reaches, Bering Region in south Chukotka, within the
framework of GEF ECORA Project (GEF ECORA, http://www.grida.no/ecora/modelareas.aspx )
and the base was built for the future monitoring of bird populations with local people involved.
ECORA Project General Manager is Eugene Kuznetsov [email protected] .

14. Integrated Arctic Socially-Oriented Observation System (IASOS) Network
Russian Academy of Sciences
Institute of Geography
Integrated Arctic Socially-Oriented Observation System
Contact person
Vlasova Tatiana Kouzminichna [email protected]
Web site: http://igras.ru/index
http://iasos.igras.ru (under construction)
Main objectives of the network
The aim of the IASOS network is to monitor changes on the way to better (or worse) Quality of
Life (QL) and sustainability, increase knowledge of trends in socio-economic, political and
living conditions of residents (indigenous and non-indigenous) of the Russian North under the
impacts of happening changes in climate, biodiversity, character of human impacts, socio-
economic and political changes and human responses (including strategic planning for climate
change adaptation, etc.)
The major objectives of the IASOS network are:
- Identify main QL issues, factors effecting these issues;
- Observe and analyze human-defined targets and solutions of arising QL issues taking into
account local people’s perceptions and strategies developed at different scales (from local to
national and circumpolar) in order to achieve better QL and sustainability;
- Detect key indicators (most important from the QL improvement point of view) to be
monitored and tested during long-term observations in case study regions (observation sites);
- Carry out local observations of socio-economic and environmental trends impacting QL and
human capital on the base of specially developed methodology, approaches and tools of
socially-oriented observations;
- Involve arctic residents (indigenous and non-indigenous), their local and traditional knowledge
in QL observations;
- Raise peoples’ awareness of happening changes in living conditions, policy and environment,
help people to set targets in order to achieve better QL and sustainability. This is to be done with
the help of participatory observations, information-educational workshops and other tools;
- Consolidate national and international collaborations in the Russian North on socially-oriented
observations and research;
- Translate better experience of the Arctic states in achieving higher quality of life and
sustainability into local, national policies and adaptation strategies.
Member/ connected to global network
The IASOS network is a partner of the International Polar Year cluster project PPS Arctic #
151 (Present day processes, Past changes, and Spatiotemporal variability of biotic, abiotic and

socio-environmental conditions and resource components along and across the Arctic
delimitation zone) under the leadership and coordination of Norway (coordinator Annika
Hofgaard, NINA and co-coordinator Gareth Rees, Scott Polar Research Institute, UK). Within
this multidisciplinary project - The Northern Socially-oriented Observation Network in the
taiga-tundra interface zone, has started to be constructed and supported both by Research
Council of Norway Norwegian Cooperation program on Research and Higher Education with
Russia and the Presidium RAS Program N 16, part 2 ( coordinator V.M. Kotlyakov, Institute of
Geography). The IASOS network is connected to the Northern Socially-oriented Observation
Network.
The IASOS network is also taking part in various global initiatives and networks, both in
permanent basis as well as in ad hoc collaborations :
- IPY ICSU/WMO JC Sub-committee on observations (social direction of observations);
- Arctic Council Sustainable Development Working Group (the IASOS Network has been
recognized as a parallel component of the Arctic Human Development Report follow-up);
- Coordinator of IASOS was a working group liaison to the Arctic Social Indicators project and
now is a member of the ASI- II working group under the leadership of Iceland. As it is known,
ASI has been recognized as a building block of SAON;
The IASOS network cooperation is widening and we are looking forward to closer collaboration
with other networks, projects, government and non-government organizations both in Russia,
other Arctic states and at the international level (Russian Geographical Society, Russian
Association of the Indigenous Peoples of the North, Russian Academy of Civil Service under
the president of the Russian Federation, Roshydromet, International Geographical Union
Commission on Cold Regions Environment (CRE), WWF, UNEP/Grid-Arendal, CBMP,
ECORA, ECONOR, ArcticStat, CAVIAR, ArcticNet projects and others ).
Type of Network
- Thematical observations
- Community-based observations
Thematic Area
Quality of life, sustainability, human capital development and socio-economic issues and
indicators.
Main variables
Main variables are structuralized according to main types of quality of life, sustainability, human
capital development and socio-economic issue revealed in the Russian North as to March 2010.
Common issues and indicators for further observations identified for all our sites ( although there
are some local distinctions in specific sites of observations) are:
1. Material well-being (wages, disposable incomes, etc.) and level of income differentiation
among the poorest and the richest groups of the society;
2. Unemployment level is becoming more and more important issue and indicator, especially
youth unemployment;
3. Life expectancy (especially men), child mortality and sickness;

4. Quality of health-care system;
5. State of the natural environment impacting quality of life and sustainability (climate change
variability, seasonal uncertainties in river ice melting, pollution and quality of drinking water,
etc.);
6. Quality of administration control from the local government;
7. Peoples’ participation in decision making, capacity to control their fate;
8. Quality of education;
9. Quality of socio-cultural service; the share of education, health and social services in
GRP;
10. Migration especially youth migration and the overall population aging.
When operational
Since 2008
Geographical coverage
Regions of the Russian North;
Sites situated in different bioms (from tundra to southern taiga zone) in sparsely populated rural
areas and industrial regions of Murmansk, Arkhangelsk Oblast and Komi Republic.
Data archive
IASOS network metadata is registered in the International Polar Year Data and Information
Service http://ipydis.org/data/submission.html
Data availability
Data on various subjects can be found in publications and presentations at international meetings
as well as on the website now under construction.
All data is in the process of development and renewal. It is available through collaboration with
partner networks, projects, organizations.
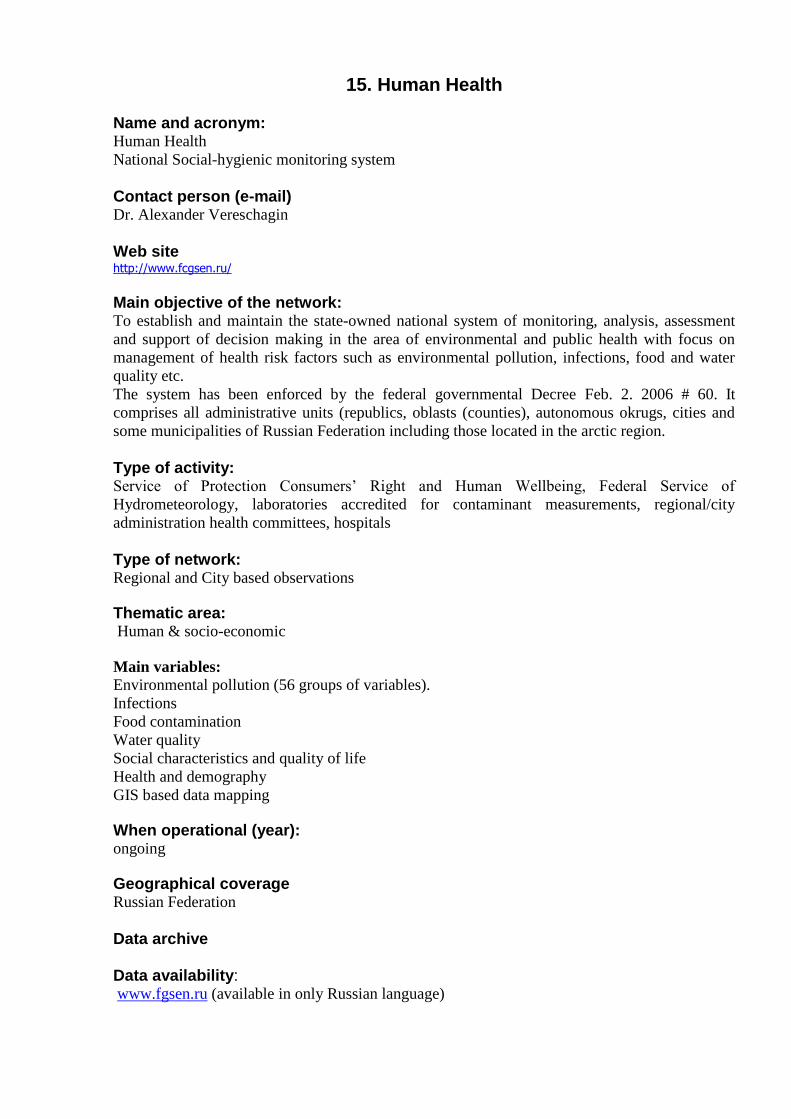
15. Human Health Name and acronym: Human Health
National Social-hygienic monitoring system
Contact person (e-mail) Dr. Alexander Vereschagin
Web site http://www.fcgsen.ru/
Main objective of the network: To establish and maintain the state-owned national system of monitoring, analysis, assessment
and support of decision making in the area of environmental and public health with focus on
management of health risk factors such as environmental pollution, infections, food and water
quality etc.
The system has been enforced by the federal governmental Decree Feb. 2. 2006 # 60. It
comprises all administrative units (republics, oblasts (counties), autonomous okrugs, cities and
some municipalities of Russian Federation including those located in the arctic region.
Type of activity: Service of Protection Consumers’ Right and Human Wellbeing, Federal Service of
Hydrometeorology, laboratories accredited for contaminant measurements, regional/city
administration health committees, hospitals
Type of network: Regional and City based observations
Thematic area: Human & socio-economic
Main variables:
Environmental pollution (56 groups of variables).
Infections
Food contamination
Water quality
Social characteristics and quality of life
Health and demography
GIS based data mapping
When operational (year): ongoing
Geographical coverage Russian Federation
Data archive Data availability: www.fgsen.ru (available in only Russian language)
Main gaps: The health and demographic data link exclusively to administrative provinces of Russia which
are not always applicable to geographical and climatic regions such as arctic.
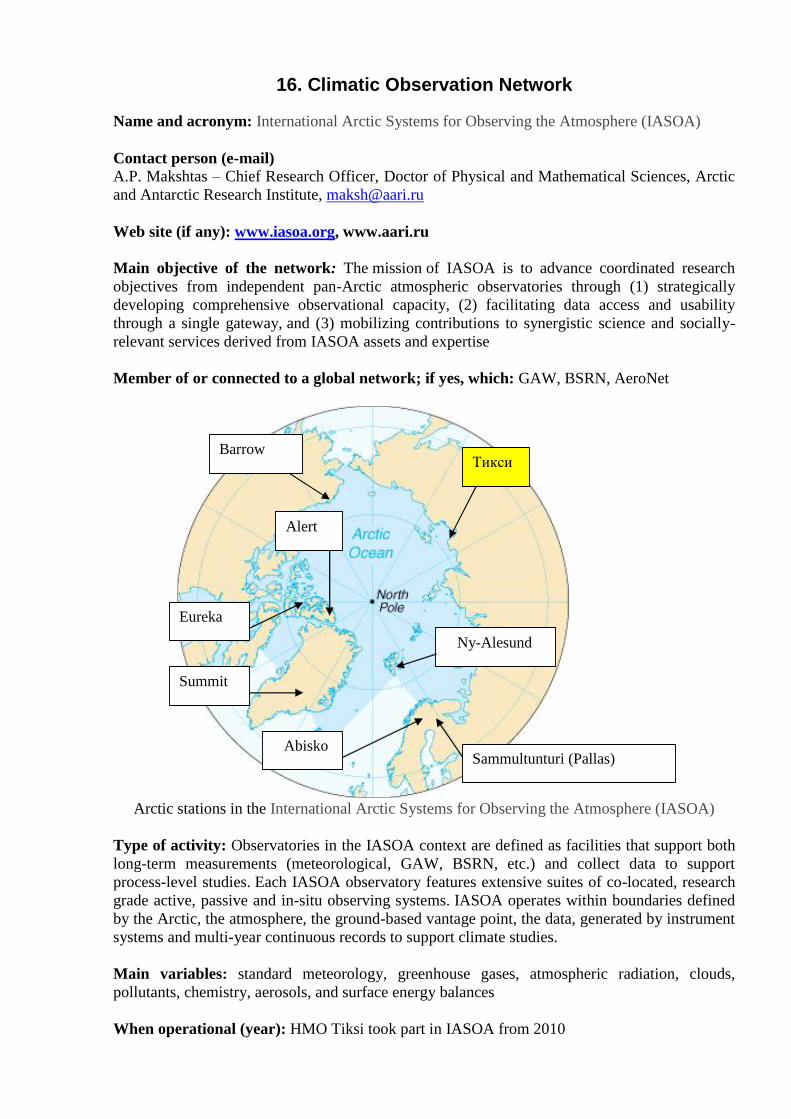
16. Climatic Observation Network
Name and acronym: International Arctic Systems for Observing the Atmosphere (IASOA)
Contact person (e-mail)
A.P. Makshtas – Chief Research Officer, Doctor of Physical and Mathematical Sciences, Arctic
and Antarctic Research Institute, [email protected]
Web site (if any): www.iasoa.org, www.aari.ru
Main objective of the network: The mission of IASOA is to advance coordinated research
objectives from independent pan-Arctic atmospheric observatories through (1) strategically
developing comprehensive observational capacity, (2) facilitating data access and usability
through a single gateway, and (3) mobilizing contributions to synergistic science and socially-
relevant services derived from IASOA assets and expertise
Member of or connected to a global network; if yes, which: GAW, BSRN, AeroNet
Barrow
Alert
Eureka
Summit
Ny-Alesund
Abisko
Тикси
Sammultunturi (Pallas)
Arctic stations in the International Arctic Systems for Observing the Atmosphere (IASOA)
Type of activity: Observatories in the IASOA context are defined as facilities that support both
long-term measurements (meteorological, GAW, BSRN, etc.) and collect data to support
process-level studies. Each IASOA observatory features extensive suites of co-located, research
grade active, passive and in-situ observing systems. IASOA operates within boundaries defined
by the Arctic, the atmosphere, the ground-based vantage point, the data, generated by instrument
systems and multi-year continuous records to support climate studies.
Main variables: standard meteorology, greenhouse gases, atmospheric radiation, clouds,
pollutants, chemistry, aerosols, and surface energy balances
When operational (year): HMO Tiksi took part in IASOA from 2010
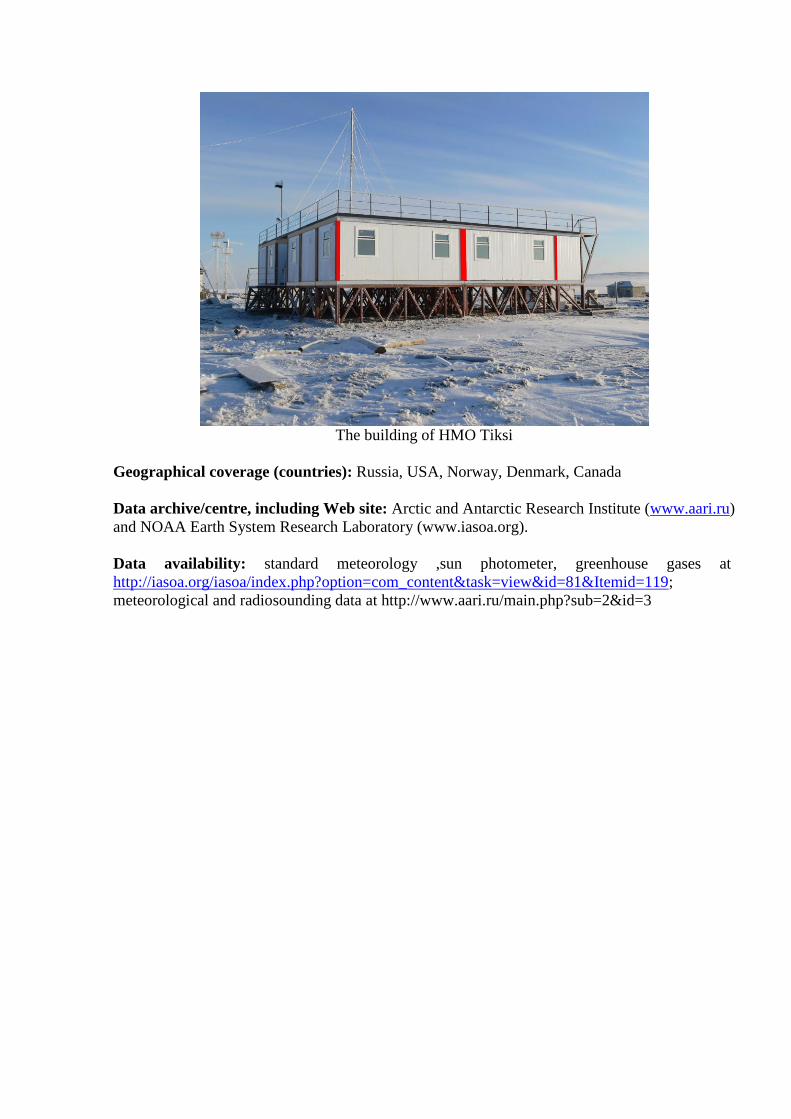
The building of HMO Tiksi
Geographical coverage (countries): Russia, USA, Norway, Denmark, Canada
Data archive/centre, including Web site: Arctic and Antarctic Research Institute (www.aari.ru)
and NOAA Earth System Research Laboratory (www.iasoa.org).
Data availability: standard meteorology ,sun photometer, greenhouse gases at
http://iasoa.org/iasoa/index.php?option=com_content&task=view&id=81&Itemid=119;
meteorological and radiosounding data at http://www.aari.ru/main.php?sub=2&id=3