inventory of ammonia emission from - uk-air, air quality ... · submission report october 2010 1...
TRANSCRIPT
Submission Report October 2010
1
Inventory of Ammonia Emissions from UK
Agriculture
2009
DEFRA Contract AC0112
Inventory Submission Report
October 2010
T H Misselbrook, D R Chadwick, S L Gilhespy
North Wyke Research,
North Wyke, Okehampton, Devon EX20 2SB
B J Chambers1, K A Smith
2 and J Williams
3
1 ADAS Gleadthorpe, Meden Vale, Mansfield, Nottingham NG20 9PF
2 ADAS Wolverhampton, Woodthorne, Wergs Road, Wolverhampton WV6 8TQ
3ADAS Boxworth, Battlegate Road, Boxworth, Cambridge CB3 8NN
U Dragosits
CEH Edinburgh, Bush Estate, Penicuik, Midlothian EH26 0QB

Submission Report October 2010
2
Inventory of Ammonia Emissions from UK Agriculture – 2009
Summary
The National Ammonia Reduction Strategy Evaluation System (NARSES) model (spreadsheet
version) was used to estimate ammonia (NH3) emissions from UK agriculture for the year
2009. Year-specific livestock numbers and fertiliser N use were added for 2009 and revised
for previous years. The estimate for 2009 was 231.8 kt NH3, representing a 2.3 kt increase
from the previously submitted estimate for 2008. Backward and forward projections using the
2009 model structure gave estimates of 317, 245 and 244 kt NH3 for the years 1990, 2010 and
2020, respectively. This inventory reports emission from livestock agriculture and from
nitrogen fertilisers applied to agricultural land. There are a number of other minor sources
reported as ‘agriculture’ in the total UK emission inventory, including horses not kept on
agricultural holdings, emissions from composting and domestic fertiliser use.
Table 1. Estimate of ammonia emission from UK agriculture for 2009
Source kt NH3 % of total
Livestock category
Cattle 132.5 57
Dairy 70.9 31
Beef 61.6 27
Sheep† 10.1 4
Pigs 18.8 8
Poultry 29.5 13
Horses 4.8 2
Management category
Grazing/outdoors 29.7 13
Housing 21.7 9
Hard standings 62.7 27
Manure storage 29.8 13
Manure application 51.8 22
Fertiliser application 36.0 16
TOTAL 231.8 †Including goats and deer
Submission Report October 2010
3
Estimate of ammonia emission from UK agriculture for 2009
The estimate of ammonia emission from UK agriculture for 2009 was made using the
spreadsheet version of the National Ammonia Reduction Strategy Evaluation System
(NARSES) model (file: NH3inv2009_NARSES_draft1_011010.xls). NARSES models the
flow of total ammoniacal N (TAN) through the livestock production and manure management
system, with NH3 losses given at each stage as a proportion of the TAN present within that
stage (Webb and Misselbrook, 2004). NARSES was first used to provide the 2004 inventory
estimate for UK agriculture, replacing the previously used UK Agricultural Emissions
Inventory model (UKAEI). NARSES brings improvements over the UKAEI model in that
emission sources are linked, such that changes in an upstream source will be reflected
downstream, it has an internal accounting check that not more than 100% of TAN excreted
can be emitted, it can incorporate rising trends in N excretion by certain livestock classes (e.g.
dairy cattle) and it is much better suited to scenario testing. The NARSES model was
therefore used to provide the NH3 emissions estimate for UK agriculture for 2009 and
projections to 2020. Emissions from fertiliser use within agriculture are estimated using a
simple process-based model as described by Misselbrook et al. (2004), which has been
incorporated into the NARSES spreadsheet model.
To compile the 2009 inventory of ammonia emissions from UK agriculture, survey and census
data were reviewed to derive livestock numbers, fertiliser use and other management practice
data relevant to 2009. Currently used emission factors were reviewed in the light of new
experimental data and amended if considered appropriate.
Key areas of revision in the 2009 inventory were:
Inclusion of 2009 fertiliser use data
Inclusion of 2009 livestock numbers
Revision of livestock housing data
Correction of minor errors in the manure management input data
Derivations of emission factors and other data used in NARSES are detailed in Appendix 1.
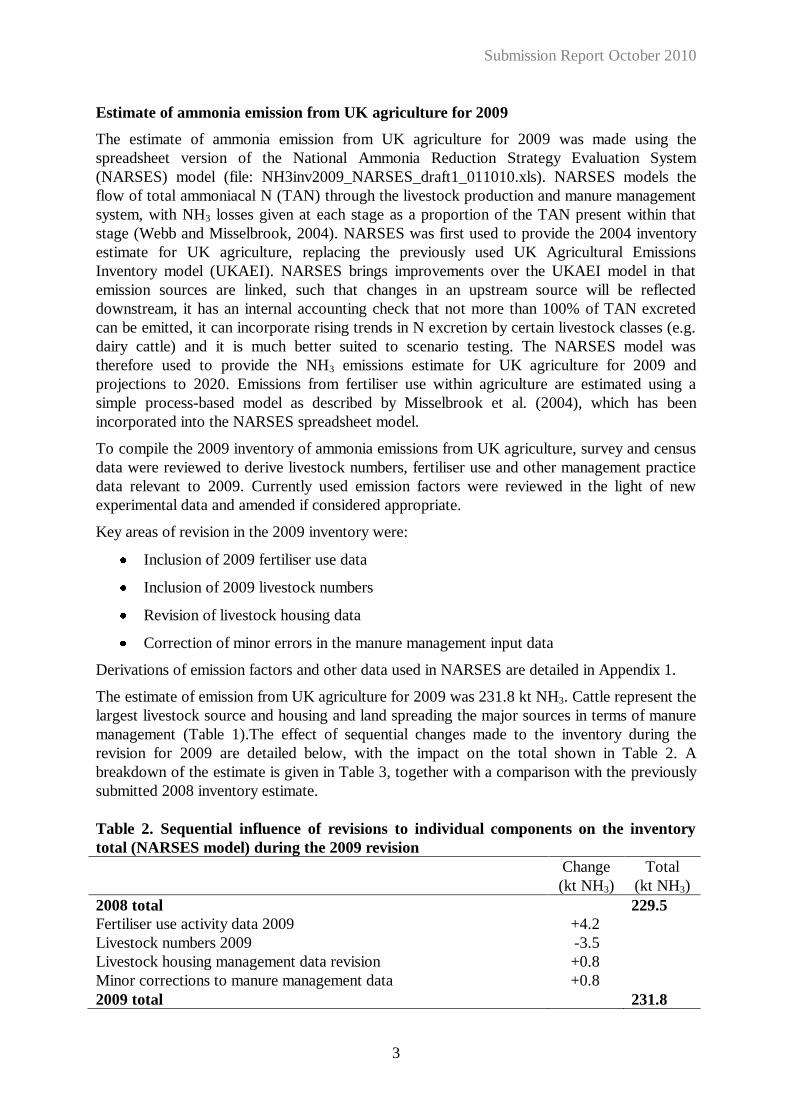
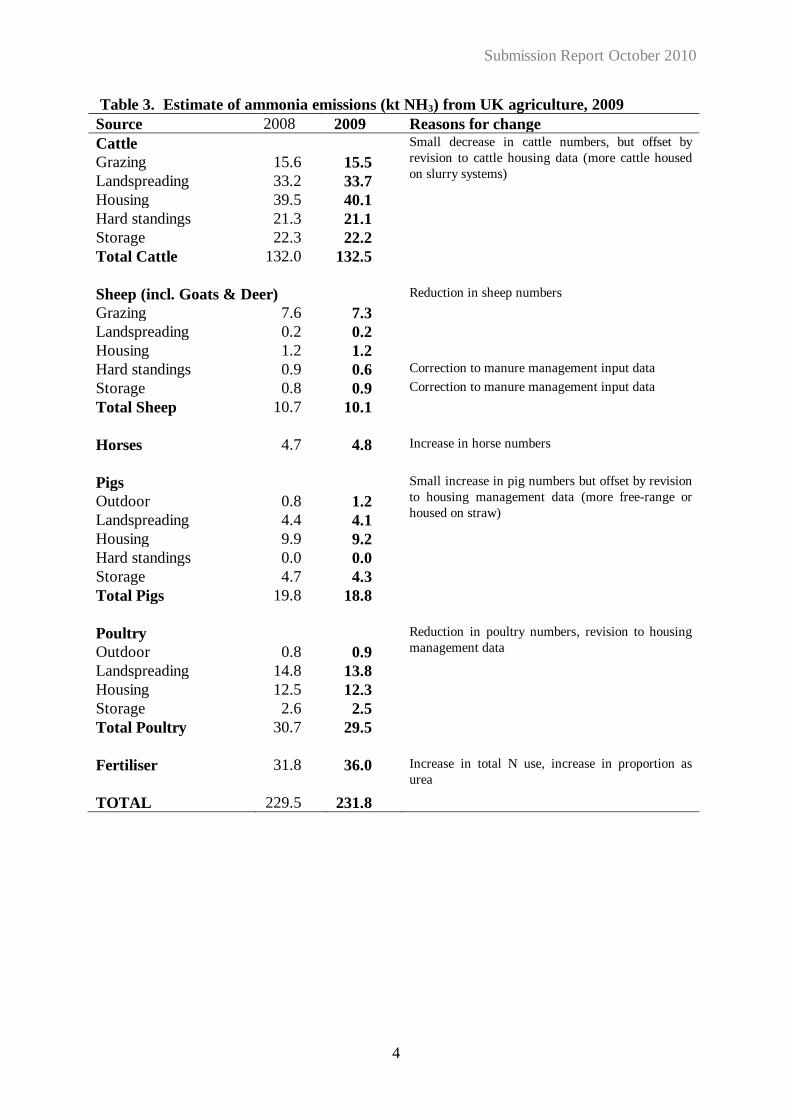
The estimate of emission from UK agriculture for 2009 was 231.8 kt NH3. Cattle represent the
largest livestock source and housing and land spreading the major sources in terms of manure
management (Table 1).The effect of sequential changes made to the inventory during the
revision for 2009 are detailed below, with the impact on the total shown in Table 2. A
breakdown of the estimate is given in Table 3, together with a comparison with the previously
submitted 2008 inventory estimate.
Table 2. Sequential influence of revisions to individual components on the inventory
total (NARSES model) during the 2009 revision
Change
(kt NH3)
Total
(kt NH3)
2008 total 229.5
Fertiliser use activity data 2009 +4.2
Livestock numbers 2009 -3.5
Livestock housing management data revision +0.8
Minor corrections to manure management data +0.8
2009 total 231.8
Submission Report October 2010
4
Table 3. Estimate of ammonia emissions (kt NH3) from UK agriculture, 2009
Source 2008 2009 Reasons for change
Cattle Small decrease in cattle numbers, but offset by
revision to cattle housing data (more cattle housed
on slurry systems) Grazing 15.6 15.5
Landspreading 33.2 33.7
Housing 39.5 40.1
Hard standings 21.3 21.1
Storage 22.3 22.2
Total Cattle 132.0 132.5
Sheep (incl. Goats & Deer) Reduction in sheep numbers
Grazing 7.6 7.3
Landspreading 0.2 0.2
Housing 1.2 1.2
Hard standings 0.9 0.6 Correction to manure management input data
Storage 0.8 0.9 Correction to manure management input data
Total Sheep 10.7 10.1
Horses 4.7 4.8 Increase in horse numbers
Pigs Small increase in pig numbers but offset by revision
to housing management data (more free-range or
housed on straw) Outdoor 0.8 1.2
Landspreading 4.4 4.1
Housing 9.9 9.2
Hard standings 0.0 0.0
Storage 4.7 4.3
Total Pigs 19.8 18.8
Poultry Reduction in poultry numbers, revision to housing
management data Outdoor 0.8 0.9
Landspreading 14.8 13.8 Housing 12.5 12.3
Storage 2.6 2.5
Total Poultry 30.7 29.5
Fertiliser 31.8 36.0 Increase in total N use, increase in proportion as
urea
TOTAL 229.5 231.8

Submission Report October 2010
5
Major changes between 2008 and 2009
1. 2009 fertiliser use data
Date derived from BSFP for crop year 2009 for England, Wales and Scotland and from
DARDNI statistics for Northern Ireland.
Total fertiliser N use increased by a small percentage (1.3%) between 2008 and 2009, the first
increase for 5 years. Urea use increased by 28%, which, having a disproportionate effect on
total fertiliser emissions, gave an overall increase in emissions of 4.2 kt NH3.
2. 2009 livestock numbers
Headline changes from 2008 are:
Cattle – a 0.8% decline in total cattle numbers (across both the dairy and beef herd)
Pigs – a 0.2% increase in pig numbers
Sheep – a 3.3% decline in sheep numbers
Poultry – a 4.2% decline in total poultry numbers, with a 3.2% increase in the laying
flock but a 6.5% decrease in broiler numbers
3. Pig and poultry housing
The Pig and Poultry Farm Practices Survey, 2009, (Defra) provided new data for the
proportion of pigs and poultry housed under different systems and gave a comparison with the
FPS 2006 data. These data were combined with earlier survey data from Sheppard (1998,
2002) and Smith et al. (2000c, 2001a) to produce trends in pig and poultry housing from 1990
– 2009 (See Tables in Appendix p28-29). The main changes over recent years are an increase
in sows and weaners reared outdoors, and increase in free-range poultry and an increase in the
use of in-house manure drying systems for poultry housing.
FPS2009 (Pig & Poultry) also give a breakdown of free-range laying hens on systems with
‘grass and trees’ or ‘grass only’, although we currently have no data on the relative difference
in emissions from these systems.
NB: Survey data were for England or England and Wales. In the absence of any Scotland or
Northern Ireland data, trends from these surveys have been used for the whole UK.
4. Cattle housing
The Farm Practices Survey 2010 (England) provides new data on proportion of dairy and beef
cattle housed under different systems. These were used together with data from Smith et al.
(2001b) to derive trends in cattle housing 2000 – 2009. The proportion of beef cattle on slurry
systems has remained fairly constant, but there is evidence of an increase in the proportion of
dairy cows and dairy followers housed on slurry systems (see Table in Appendix, p27).

Submission Report October 2010
6
Past and Projected Trends: 1990 - 2020
Retrospective calculations based on the 2009 inventory methodology were made for the years
1990 to 2009 and projections for the years 2010, 2015 and 2020 (Table 4). Projected changes
in livestock numbers, N fertiliser use and management practices are detailed below. There has
been a steady decline in emissions (27%) from UK agriculture over the period 1990 – 2009,
largely due to declining livestock numbers (Fig. 1) and fertiliser N use (Fig. 2). The decline is
projected to level off, with an estimated 23% reduction from 1990-2020. These projections
are subject to much uncertainty and further work is required to both generate more robust
projections in agricultural activity data and an estimate of uncertainties relating to the
assumptions made in deriving the projections.
Table 4. Estimates of ammonia emission from UK agriculture 1990 – 2020 using the
NARSES model
Source 1990 1995 2000 2005 2009 2010 2015 2020
Projections
Total 317.1 291.7 265.5 250.0 231.8 244.5 245.5 244.1
Cattle 154.7 150.8 144.2 138.9 132.5 135.5 133.5 132.8
Dairy cattle 81.7 77.6 73.7 71.0 70.9 76.9 76.1 76.7
Other cattle 72.9 73.2 70.5 67.9 61.6 58.6 57.4 56.1
Sheep 14.0 13.9 13.5 11.4 10.1 11.4 18.9 18.1
Pigs 42.3 40.1 31.3 22.3 18.8 19.5 18.9 18.1
Laying hens 13.7 11.9 10.0 9.5 8.2 9.4 9.9 9.5
Other poultry 26.1 24.5 29.1 25.3 21.3 25.7 25.7 25.8
Horses 2.6 3.4 3.7 4.4 4.8 5.1 5.8 6.5
Fertiliser 63.7 47.1 33.7 38.1 36.0 37.9 40.5 40.2
Submission Report October 2010
7
Figure 1. Trends in livestock numbers 1990 – 2020. Changes are relative to a reference value
of 100 in 1990. Dashed lines show projections from Defra project SSF0601.
50
100
150
200
250
300
1990 1995 2000 2005 2010 2015 2020
Cattle Sheep Pigs Poultry Horses
Figure 2. Changes in fertiliser N use 1990 – 2020. Dashed lines show projections from Defra
project SSF0601.
0%
10%
20%
30%
40%
50%
60%
0
200
400
600
800
1000
1200
1400
1600
1800
2000
1990 1995 2000 2005 2010 2015 2020
Ure
a a
nd
UA
N a
s %
to
tal
N u
se
To
tal f
ert
ilis
er
us
e (
kt
N)
Total
% as urea and UAN

Submission Report October 2010
8
Projections – methodology and assumptions
Livestock numbers
Livestock number projections were based on projections made in Defra project SFF0601
(Baseline projections for Agriculture), using June 2004 census data as the base year. These
projections tended not to give such large reductions in livestock numbers (cattle and sheep, in
particular) as were projected under the Business as Usual II project (UoC/SAC). In addition,
trends in N excretion were included: N excretion by dairy cattle was forecast to increase as
cattle numbers became fewer but milk quota was maintained. N excretion by certain pig and
poultry categories were forecast to decrease as dietary improvements were taken up by the
industry. Past and projected trends in livestock numbers use are shown in Figure 1. Generally,
with the exception of cattle, livestock numbers from 2005 to 2009 are below the projected
values, particularly for poultry.
Fertiliser use
Fertiliser use projections were also taken from Defra project SFF0601, using 2004 data as the
base year. Again, less substantial reductions in fertiliser use are projected than in the BAUII
project (indeed, an increase in total N use to tillage is projected), partly as increasing areas of
biofuel cropping were factored in and also as reductions in N applications to grassland were
thought not to be sustainable if past trends were simply continued. Proportions of each
fertiliser type applied were assumed to remain the same. Past and projected trends in fertiliser
N use are shown in Figure 2. Total fertiliser N use has declined by more than projected from
2004 to 2009.
Farm management practices
Trends in changes in farm management practices (e.g. type and duration of livestock housing,
manure storage and application methods) are difficult to quantify as there are relatively few
surveys from which to obtain relevant data and those surveys which have been conducted are
not always directly comparable. It is hoped that regular and consistent running of the Farm
Practices Survey will be able to provide estimates of such trends in the future. For the default
scenario, therefore, it has been assumed that no changes will take place in management
practice in the absence of legislation or incentive schemes. IPPC legislation will impact on the
practices of large pig and poultry farms from 2007 onwards; the assumptions regarding
changes in livestock housing and manure management due to IPPC legislation are detailed
below.
From 2007, all pig and poultry holdings above the livestock number thresholds have had to
apply for a permit and will be required to comply with the legislation. In terms of ammonia
emissions, the following assumptions have been made:
a) BAT housing is associated with a 30% reduction in ammonia emissions
b) Premises with existing housing will not be expected to modify immediately, but
need to have plans showing how they will move towards compliance. It is assumed
that 0% of holdings subject to IPPC complied in 2006 and that 100% will comply
by 2020, with a linear trend in moving to compliance.
Submission Report October 2010
9
c) Slurry stores will require a rigid cover and lagoons a floating cover. Move to
compliance will be as for housing above.
d) Applications of manure to own premises will have to comply with BAT,
applications to other premises do not have to comply. From 2001 Farm Practices
Survey, the proportions of manure exported are 25% of pig slurry, 29% of pig
FYM and 69% of poultry manure. It is assumed that these proportions apply
equally to IPPC and non-IPPC holdings.
e) Compliance will require incorporation within 24h of slurry, FYM or poultry
manure to land to be tilled (assumed to be applicable for 50% of slurry, 90% of
FYM and 70% of poultry manure applied to arable land), trailing hose application
of pig slurry to growing arable crops and trailing shoe or shallow injection of pig
slurry to grassland.
The proportion of the national pig herd and poultry flock that will be required to comply has
been revised according to data provided by the agricultural statistics units of each of the
devolved administrations and a weighted average for the UK (Table 5). These are based on
2006 census livestock numbers, but the proportions will be assumed to remain the same.
Table 5. Proportion (%) of poultry and pigs within each devolved administration and
the UK kept on holdings above the IPPC thresholds (750 sows, 2,000 fattening pigs,
40,000 broilers, layers, ducks or turkeys)
Category E W S NI UK
Poultry
Broilers 95 98 94 67 92
Layers 67 49 74 54 66
Ducks 36 0 0 0 35
Turkeys 49 35 49* 0 43
Pigs
Sows 29 0 23 27 28
Fatteners >20kg 40 0 53 49 42
*not disclosed for Scotland, so value for England used
From these assumptions and data, the proportion of the UK flock or herd for which IPPC
BAT should be applied in the inventory for housing and storage is given in Table 6 and the
proportion of manure applications subject to BAT given in Table 7.
Submission Report October 2010
10
Table 6. Proportion (%) of UK poultry flock and pig herd complying with IPPC BAT
for housing and storage
Category 2006 2007 2010 2015 2020
Poultry
Broilers 0 7 26 59 92
Layers 0 5 19 42 66
Ducks 0 3 10 23 35
Turkeys 0 3 12 28 43
Pigs
Sows 0 2 8 18 28
Fatteners >20kg 0 3 12 27 42
Table 7. Proportion (%) of UK poultry and pig manure applied to land required to
comply with IPPC BAT (from 2007 onwards)
Category* %
Of that applied to arable land, % incorporated within 24h
Poultry manure 18
Pig slurry 15
Pig FYM 26
Of that applied to arable land, % applied by trailing hose
Pig slurry 15
Of that applied to grassland, % applied by trailing shoe/injection
Pig slurry 30
*Using a weighted average of poultry numbers (83%) and pig numbers (40%) complying with IPPC
(2006 data)
Emission factors
Emission factors as used in the current model were kept constant for all model runs from 1990
– 2020.
Uncertainties
An analysis of the uncertainties in the emission inventory estimate was conducted by Webb
and Misselbrook (2004) using @RISK software (Palisade Europe, London), in which a
distribution was attached to each of the model inputs (activity or emission factor data), based
on the distribution of raw data or, where no or only single estimates exist, on expert
assumptions. A large number of model runs (2000) were then conducted in which input values
were selected at random from within the given distribution (Latin hypercube sampling) and an
uncertainty limit produced for each of the model outputs. The 95% confidence interval for the
total inventory estimate was estimated to be ±20% (i.e. ±46.2 kt NH3 for the 2008 estimate).
Submission Report October 2010
11
APPENDIX 1
DERIVATION OF EMISSION FACTORS FOR THE INVENTORY OF AMMONIA
EMISSIONS FOR UK AGRICULTURE
NB: Derivation of emission factors as used in the previous inventory model (UKAEI) and in
the currently-used NARSES model are given.
All emission factors (EF) are given in terms of NH3-N or, where expressed as a percentage,
these are as a % TAN (total ammoniacal nitrogen) within the current ‘emission pool’ (e.g.
losses at spreading are expressed as %TAN in the manure at spreading).
Cited sources are either scientific publications or Defra project Final Reports (given by Project
Code), which are available from the Defra web-site.
Submission Report October 2010
12
CATTLE
Grazing
UKAEI
A updated version of the relationship between N input (kg N/ha) and ammonia emission (g
N lu-1
d-1
) from cattle grazed swards (Jarvis & Bussink 1990) was used, including data from
Jarvis et al. 1989, Bussink 1992 and 1994, Ledgard 1996 and IGER (OC9117).
N input Jarvis et al.
‘89
Bussink
‘92
Bussink
‘94
Ledgard
‘96
IGER
OC9117
WA0652
150 2
150 20
200 7.5
200 7.7
210 20
210 14 11.64
250 12.73 12.73
280 32
280 32
400 32.73
420 38
420 36
420 22
550 42.27 33.64
550 36.54
Fitted relationship: y = -0.51+0.0742 x (r2 0.68)
NARSES
EF for NARSES was derived from source data, where sufficient data were available.
Emissions due to the fertiliser applied to the grazed pasture were discounted using a mean EF
for ammonium nitrate applications to grassland (1.4% of N applied). The remaining emission
was expressed as a percentage of the estimated TAN return to the pasture via cattle urine.
Ammonia emission from cattle grazing - fitted
relationship with upper and lower 95% confidence
intervals
0
10
20
30
40
50
60
0 100 200 300 400 500 600
N input (kg/ha.y)
NH
3-N
lo
ss (
g/lu
.d)
Submission Report October 2010
13
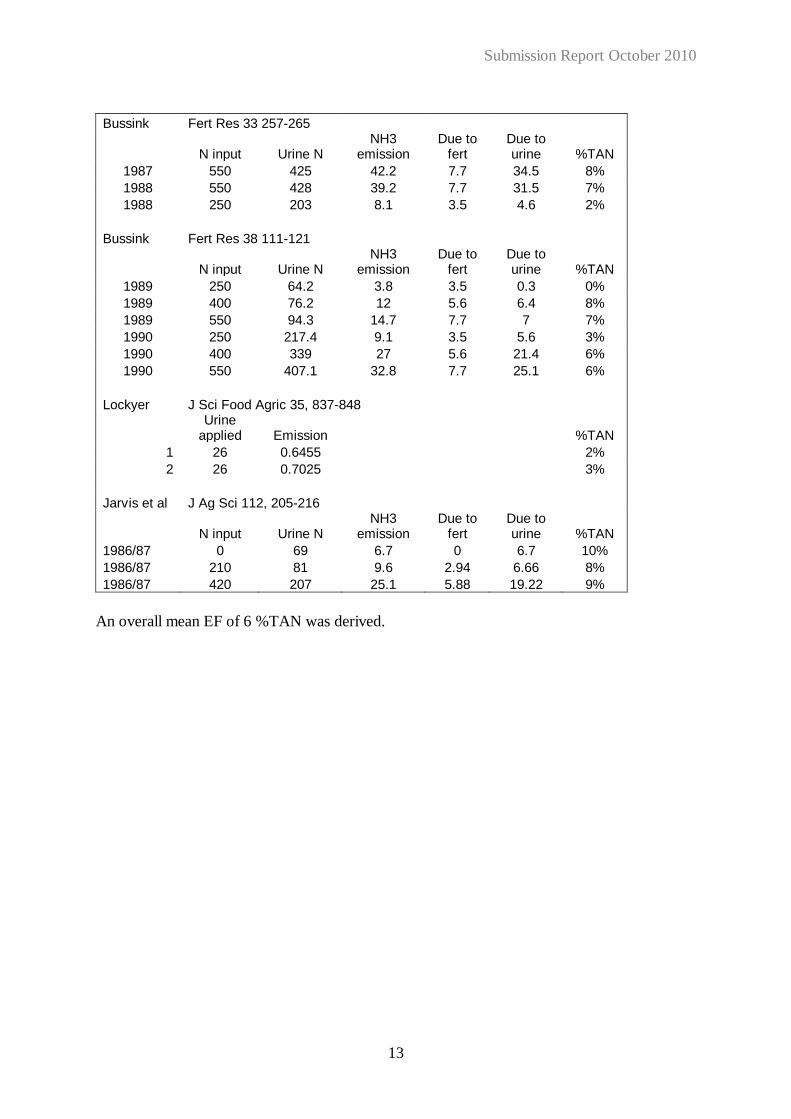
Bussink Fert Res 33 257-265
N input Urine N NH3
emission Due to
fert Due to urine %TAN
1987 550 425 42.2 7.7 34.5 8%
1988 550 428 39.2 7.7 31.5 7%
1988 250 203 8.1 3.5 4.6 2%
Bussink Fert Res 38 111-121
N input Urine N NH3
emission Due to
fert Due to urine %TAN
1989 250 64.2 3.8 3.5 0.3 0%
1989 400 76.2 12 5.6 6.4 8%
1989 550 94.3 14.7 7.7 7 7%
1990 250 217.4 9.1 3.5 5.6 3%
1990 400 339 27 5.6 21.4 6%
1990 550 407.1 32.8 7.7 25.1 6%
Lockyer J Sci Food Agric 35, 837-848
Urine
applied Emission %TAN
1 26 0.6455 2%
2 26 0.7025 3%
Jarvis et al J Ag Sci 112, 205-216
N input Urine N NH3
emission Due to
fert Due to urine %TAN
1986/87 0 69 6.7 0 6.7 10%
1986/87 210 81 9.6 2.94 6.66 8%
1986/87 420 207 25.1 5.88 19.22 9%
An overall mean EF of 6 %TAN was derived.
Submission Report October 2010
14
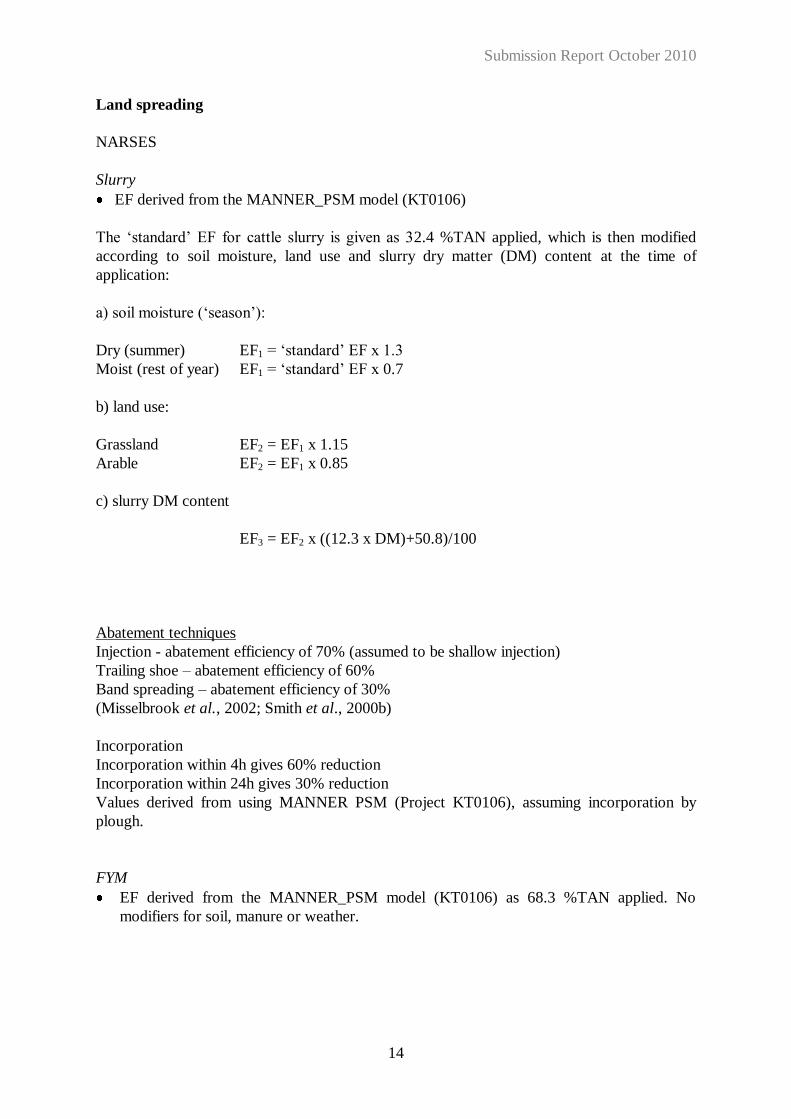
Land spreading
NARSES
Slurry
EF derived from the MANNER_PSM model (KT0106)
The ‘standard’ EF for cattle slurry is given as 32.4 %TAN applied, which is then modified
according to soil moisture, land use and slurry dry matter (DM) content at the time of
application:
a) soil moisture (‘season’):
Dry (summer) EF1 = ‘standard’ EF x 1.3
Moist (rest of year) EF1 = ‘standard’ EF x 0.7
b) land use:
Grassland EF2 = EF1 x 1.15
Arable EF2 = EF1 x 0.85
c) slurry DM content
EF3 = EF2 x ((12.3 x DM)+50.8)/100
Abatement techniques
Injection - abatement efficiency of 70% (assumed to be shallow injection)
Trailing shoe – abatement efficiency of 60%
Band spreading – abatement efficiency of 30%
(Misselbrook et al., 2002; Smith et al., 2000b)
Incorporation
Incorporation within 4h gives 60% reduction
Incorporation within 24h gives 30% reduction
Values derived from using MANNER PSM (Project KT0106), assuming incorporation by
plough.
FYM
EF derived from the MANNER_PSM model (KT0106) as 68.3 %TAN applied. No
modifiers for soil, manure or weather.
Submission Report October 2010
15
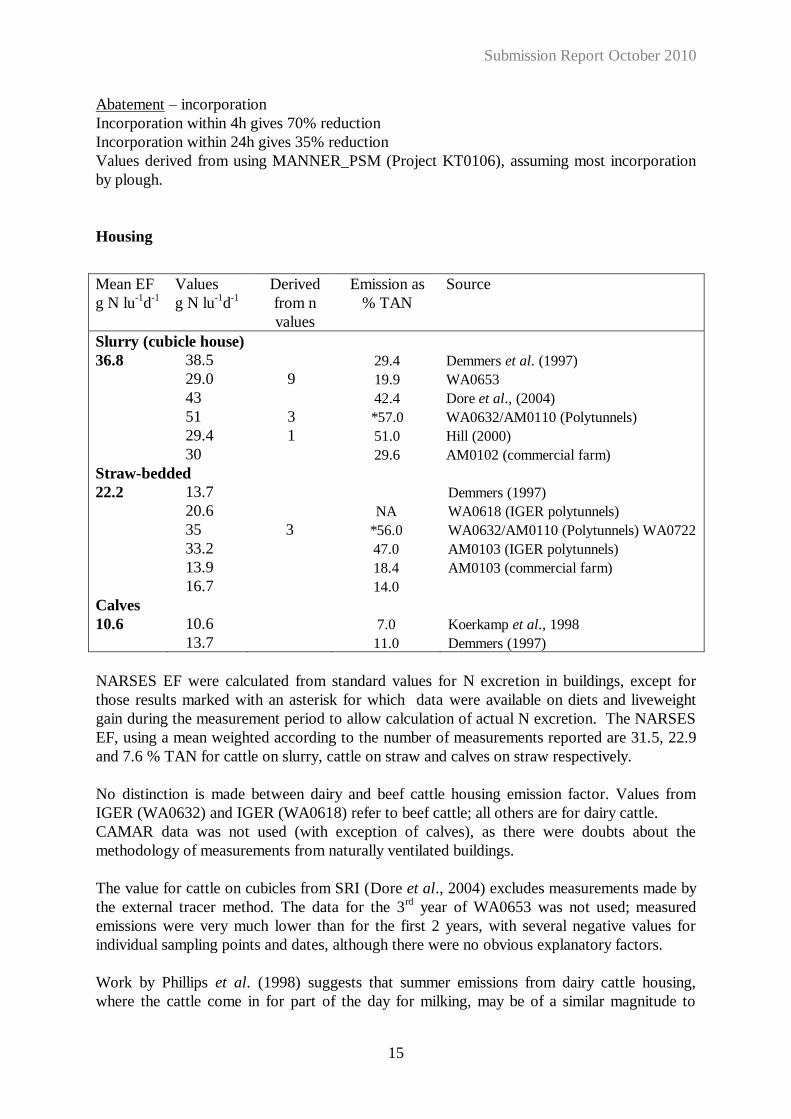
Abatement – incorporation
Incorporation within 4h gives 70% reduction
Incorporation within 24h gives 35% reduction
Values derived from using MANNER_PSM (Project KT0106), assuming most incorporation
by plough.
Housing
Mean EF
g N lu-1
d-1
Values
g N lu-1
d-1
Derived
from n
values
Emission as
% TAN
Source
Slurry (cubicle house)
36.8 38.5
29.0
43
51
29.4
30
9
3
1
29.4
19.9
42.4
*57.0
51.0
29.6
Demmers et al. (1997)
WA0653
Dore et al., (2004)
WA0632/AM0110 (Polytunnels)
Hill (2000)
AM0102 (commercial farm)
Straw-bedded
22.2 13.7
20.6
35
33.2
13.9
16.7
3
NA
*56.0
47.0
18.4
14.0
Demmers (1997)
WA0618 (IGER polytunnels)
WA0632/AM0110 (Polytunnels) WA0722
AM0103 (IGER polytunnels)
AM0103 (commercial farm)
Calves
10.6 10.6
13.7
7.0
11.0
Koerkamp et al., 1998
Demmers (1997)
NARSES EF were calculated from standard values for N excretion in buildings, except for
those results marked with an asterisk for which data were available on diets and liveweight
gain during the measurement period to allow calculation of actual N excretion. The NARSES
EF, using a mean weighted according to the number of measurements reported are 31.5, 22.9
and 7.6 % TAN for cattle on slurry, cattle on straw and calves on straw respectively.
No distinction is made between dairy and beef cattle housing emission factor. Values from
IGER (WA0632) and IGER (WA0618) refer to beef cattle; all others are for dairy cattle.
CAMAR data was not used (with exception of calves), as there were doubts about the
methodology of measurements from naturally ventilated buildings.
The value for cattle on cubicles from SRI (Dore et al., 2004) excludes measurements made by
the external tracer method. The data for the 3rd
year of WA0653 was not used; measured
emissions were very much lower than for the first 2 years, with several negative values for
individual sampling points and dates, although there were no obvious explanatory factors.
Work by Phillips et al. (1998) suggests that summer emissions from dairy cattle housing,
where the cattle come in for part of the day for milking, may be of a similar magnitude to

Submission Report October 2010
16
winter emissions. An EF for summer housing emissions is not explicitly included in the
inventory, but housing period is increased to account for the hours each day during the
summer when the cattle are in. The EF for housing is likely to be greater in summer, because
of higher temperatures. However, it is also likely that the floor area from which emission take
place will be much reduced, as access to housing may be restricted.
Hard standings
UKAEI
Data from AM0111, incorporating data from Misselbrook et al., (1998, 2001)
Source Means EF (g N animal-1
d-1
)
dairy cow collecting yard 10.7
dairy cow feeding/loafing yard 10.7
beef feeding/loafing yard 23.3
Emission factors were expressed per animal rather than per m2 surface area because annual
changes in livestock numbers are known with much greater certainty than changes in areas of
hard standing.
For NARSES, the following data/assumptions were used: Survey data, collected as part of
project WA0504, indicate that 65% of dairy cattle have access to collecting yards and 30%
have access to feeding yards while 45% of beef cattle have access to feeding yards. Survey
data from FPS2006 indicates that dairy cows with access to collecting yards spend an average
of 33% of the day on the yards, so the amount of excreta deposited is assumed to be pro-rata
to the time spent. Data from project NT2601 indicate that 21% of daily N excretion is
deposited on feeding yards by dairy cattle which have access to them. Expert opinion was that
approximately 40% of daily excreta from beef cattle on feeding yards is deposited to the yard
(FPS2006 indicates that the animals have access for the majority of the day, but they would
also have access to housing during this period). Project AM0111 indicated that collecting
yards, which are scraped at least once a day, are scraped with an efficiency of c. 60%. Based
on Misselbrook et al (2006) it is assumed that 75% of the TAN left after scraping is emitted as
NH3. For feeding yards, which are scraped only once or twice a week on average, the
scraping efficiency is assumed to be 30%.
Submission Report October 2010
17
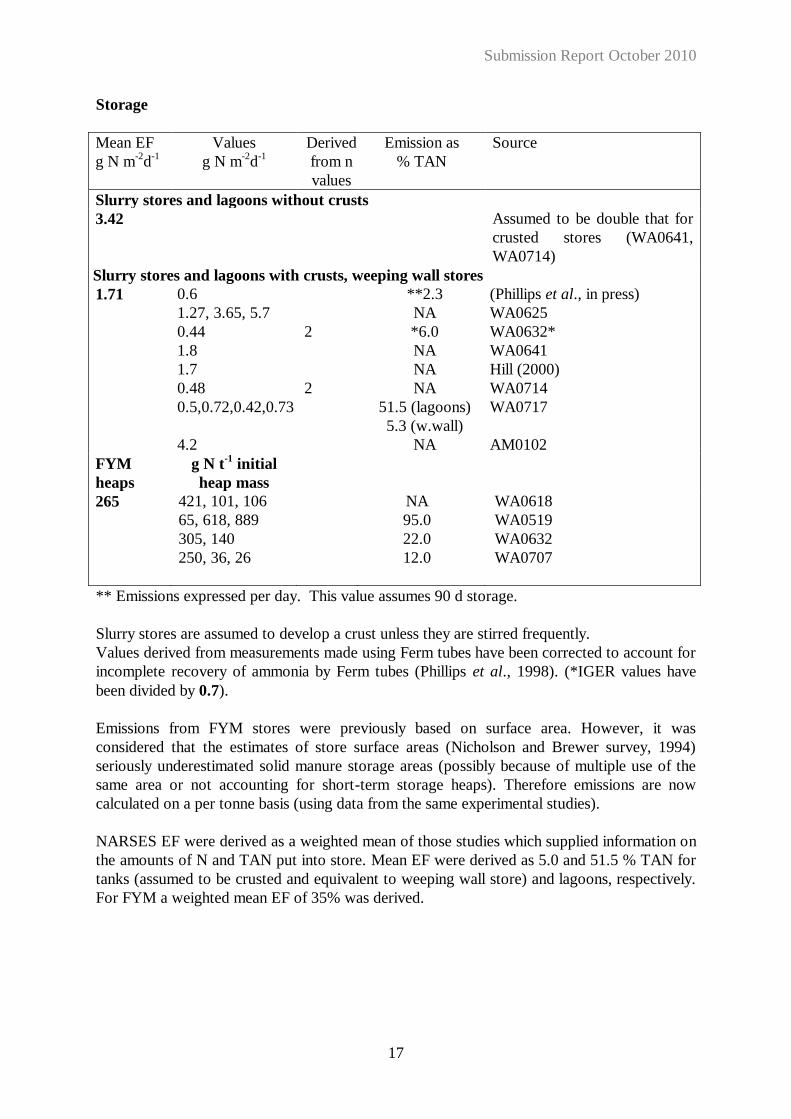
Storage
Mean EF
g N m-2
d-1
Values
g N m-2
d-1
Derived
from n
values
Emission as
% TAN
Source
Slurry stores and lagoons without crusts
3.42 Assumed to be double that for
crusted stores (WA0641,
WA0714)
Slurry stores and lagoons with crusts, weeping wall stores
1.71 0.6
1.27, 3.65, 5.7
0.44
1.8
1.7
0.48
0.5,0.72,0.42,0.73
4.2
2
2
**2.3
NA
*6.0
NA
NA
NA
51.5 (lagoons)
5.3 (w.wall)
NA
(Phillips et al., in press)
WA0625
WA0632*
WA0641
Hill (2000)
WA0714
WA0717
AM0102
FYM
heaps
g N t-1
initial
heap mass
265 421, 101, 106
65, 618, 889
305, 140
250, 36, 26
NA
95.0
22.0
12.0
WA0618
WA0519
WA0632
WA0707
** Emissions expressed per day. This value assumes 90 d storage.
Slurry stores are assumed to develop a crust unless they are stirred frequently.
Values derived from measurements made using Ferm tubes have been corrected to account for
incomplete recovery of ammonia by Ferm tubes (Phillips et al., 1998). (*IGER values have
been divided by 0.7).
Emissions from FYM stores were previously based on surface area. However, it was
considered that the estimates of store surface areas (Nicholson and Brewer survey, 1994)
seriously underestimated solid manure storage areas (possibly because of multiple use of the
same area or not accounting for short-term storage heaps). Therefore emissions are now
calculated on a per tonne basis (using data from the same experimental studies).
NARSES EF were derived as a weighted mean of those studies which supplied information on
the amounts of N and TAN put into store. Mean EF were derived as 5.0 and 51.5 % TAN for
tanks (assumed to be crusted and equivalent to weeping wall store) and lagoons, respectively.
For FYM a weighted mean EF of 35% was derived.
Submission Report October 2010
18
SHEEP
Grazing
UKAEI
Upland sheep based on values from Jarvis et al. (1991) 0N, and grass/clover plots. Mean
values for the 2 years were 0.92 and 0.19 g N animal-1
d-1
, giving a mean EF of 0.56 g N
animal-1
d-1
.
Lowland sheep based on values from Jarvis et al. (1991) - 420N, clover and grass clover
plots giving mean values over 2 yrs of 1.05 and 1.16 g N animal-1
d-1
- and on new IGER
unpublished data from North Wyke with values of 1.36, 3.95, 2.47, 0.89, 3.11 and 1.78 g N
animal-1
d-1
. Overall mean gives an EF of 2.0 g N animal-1
d-1
.
EF for grazing lambs taken to be half the value for sheep, as lamb excretal output is
approximately half that of sheep.
NARSES
Insufficient data regarding N returns to the pasture by grazing sheep were available from the
source publications listed above, so the EF used for cattle grazing (6 %TAN) was assumed for
sheep.
Land spreading
FYM - value for cattle used.
Housing
NARSES EF was derived directly by back-calculation of the UKAEI, giving an EF of 21.6%
TAN, since there are no reported measurements of NH3 emission from buildings housing
sheep.
Hard standings
UKAEI
A mean emission factor of 5.0 g N animal-1
d-1
derived from data from 2 sites (7.20 and 2.82 g
NH3-N animal-1
d-1
) from Misselbrook et al., 2001.
NARSES
Sheep collecting yards are scraped infrequently, if at all, so a scraping efficiency of 0% was
applied and an EF of 75% TAN deposited.
Storage
FYM - value for cattle used.
Submission Report October 2010
19
PIGS
Outdoors
Mean EF
g N lu-1
d-1
Values
g N lu-1
d-1
Emission as
%TAN
Source
Outdoor sows/piglets 46 25
66*
26.1
NA
Williams et al. (2000)
Welch (2003) *This value is probably an overestimate as emission rates were below the detection limit on a
number of occasions (and those data were not included).
Emission factor for boars assumed to be the same. For fatteners, EF is based on the ratio of
excretal outputs multiplied by the emission factor for outdoor sows.
NARSES EF was derived from the Williams et al (2000) study, assuming the standard N
excretion value for sows and a body weight of 200kg, giving a mean EF of 25 %TAN
(assumed to be the same across all animal sub-categories).
Land spreading
Slurry
EF derived from the MANNER_PSM model (KT0106)
The ‘standard’ EF for pig slurry is given as 25.5 %TAN applied, which is then modified
according to slurry dry matter (DM) content at the time of application:
a) slurry DM modifier:
EF1 = ‘standard’ EF x ((12.3 x DM)+50.8)/100
FYM
The same EF as for cattle FYM is used, 68.3 %TAN applied
Abatement techniques
Slurry injection – abatement efficiency of 90% (assumed to be deep injection to arable land)
Band spreading (trailing hose) – abatement efficiency of 30%
Incorporation
Incorporation within 6h gives 60% reduction
Incorporation within 24h gives 30% reduction
Values derived from using MANNER PSM (Project KT0106), assuming most incorporation
by plough
Submission Report October 2010
20
Housing
Mean EF
(gN.lu-1
d-1
)
Values
(gN.lu-1
d-1
)
Derived from
n values
Emission as
%TAN
Source
Dry sows on slats
17.0 17.0 2 13.0 Peirson (1995)
Dry sows on straw
25.8 9.4
14.6
26.2
53
2
4
10.0
14.7
26.2
59.6
Peirson (1995)
Koerkamp et al., 1998
OC9523
AM0102
Farrowing sows on slats
29.3 32.4
20.6
35
3 19.0
14.3
24.0
Peirson (1995)
Koerkamp et al., 1998
AM0102
Farrowing sows on straw
44.5 Estimated from ratio of EF for
dry sows
Boars on straw
25.8 As for dry sows
Fatteners >20kg on slats
71.9 70.1
51.4
105.8
72.5
79.2
103.5†, 48
*
80.0†, 70.0
†
71.0†, 39
*
2
4
20.0
18.5
38.2
20.0
40.0
39.2
38.7
28.5
Peirson (1995)
Koerkamp et al., 1998
Demmers (1997)
Peirson (1995)
WA0632
WA0720 (full-slat fv)
WA0720 (fs acnv)
WA0720 (part slat)
Fatteners >20kg on straw
51.6 54.2
28.3
122.2
24
47.0
34.1
2
4
14.0
10.2
61.0
10.4
27.2
10.8
Peirson (1995)
Koerkamp et al., 1998
WA0632
AM0102
AM0103 Terrington
AM0103 Commercial
Fatteners <20kg on slats
27.7 34.8
20.6
14.0
15.6
Peirson (1995)
Koerkamp et al., 1998
Fatteners <20kg on straw
19.9 Based on ratio for fatteners
>20kg †From measurements on commercial farms
*From experimental studies at ADAS Terrington
Derivation of NARSES EF: weighted means of 25, 13, 19, 33.2 and 14.8 %TAN for dry sows
on straw, dry sows, farrowing, finishing pigs and weaners on slurry, respectively. However,
because of the large variation and subsequent uncertainty in measurements of emissions from
Submission Report October 2010
21
finishing pigs on straw, the reverse engineered estimate of 22.4% TAN is used for finishing
pigs on straw.
Hard standings
UKAEI
An emission factor of 0.32 g NH3-N animal-1
d-1
for pig loading areas (Misselbrook et al.,
2001).
NARSES EF derived as 75% of TAN estimated to be deposited by finished pigs as they await
loading for dispatch to market (with scraping efficiency assumed to be 30%). 5% of daily
excretal output is assumed to be deposited to the loading areas.
Storage
Mean EF
g N m-2
d-1
Values
g N m-2
d-1
Derived from
n values
Emission
as %TAN
Source
Slurry stores and lagoons
3.16 1.34
2.47, 6.2
2.4
1.56
5.0
4 13.0
NA
NA
NA
NA
*WA0632
WA0625
Phillips et al. (1997)
WA0708
Phillips et al., in press
FYM heaps g N t-1
initial
heap mass
1224 539
1015
4
1
20.0
68.0
*WA0632
WA0716
UKAEI
Values derived from measurements made using Ferm tubes have been corrected to account for
incomplete recovery of ammonia by Ferm tubes (Phillips et al., 1998).
As for cattle slurry, a common EF is used for circular tanks and lagoons.
Emissions from FYM stores were previously based on surface area. However, it was
considered that the estimates of store surface areas (Nicholson and Brewer survey, 1994)
seriously underestimated solid manure storage areas (possibly because of multiple use of the
same area or not accounting for short-term storage heaps). Therefore emissions are now
calculated on a per tonne basis (using data from the same experimental studies).
NARSES
NARSES EF for slurry tanks was derived as 13 %TAN and for lagoons the same values as for
cattle slurry lagoons (52 %TAN) was used. The weighted mean of measurements made during
storage of FYM is 30% of TAN, similar to that for emissions during storage of cattle FYM.
Submission Report October 2010
22
POULTRY
Outdoors
NARSES – a lower EF of 35 %UAN has been applied, as it is likely that emissions from
freshly dropped excreta will be substantially lower than from applications of stored manure in
which hydrolysis of the uric acid will have occurred to a greater extent. 20% of poultry
droppings are estimated to be voided outside the house (Pers. comm. Elson, ADAS); this is
an increase on the previous estimate of 12%, and represents a real change in that newer
systems are designed such that birds do spend longer outside.
Land spreading
For poultry manure a standard EF of 52.3 %UAN applied is used, with no further modifiers
for soil, manure or weather (KT0106, MANNER_PSM)
For Duck manure, which is very similar to cattle/pig FYM, an EF of 68.3 %UAN applied is
used.
Abatement – incorporation
Incorporation within 4h gives 85% reduction
Incorporation within 24h gives 55% reduction
Values derived from using MANNER_PSM (Project KT0106), assuming incorporation by
plough.
Housing
Mean EF
gN lu-1
d-1
Values
gN lu-1
d-1
Derived
from n
values
Emission as
%TAN
Source
Layers – deep-pit (cages, perchery, free-range)
149 146
184
79
139
197
3
6
35.9
45.2
18.0
33.1
46.8
Groot Koerkamp et al., 1998 (perchery)
Groot Koerkamp et al., 1997 (deep-pit)
Peirson (1995) (deep-pit)
WA0368 (deep-pit)
WA0651 (belt-scraped, Bitteswell)
Layers – belt-cleaned (cages)
60 36
79
65
3
6
7
4.0
23.9
15.4
Peirson (1995)
WA0651 (weekly scraping)
WA0651 (belt scraped, Bitteswell)
Broilers/all other poultry
64 79
92
44
36
67
53
3
4
4
2
2
14.7
46.0
4.8
10.7
10.3
10.8
Demmers et al (1999)
Peirson (1995, turkeys)
Robertson et al. (2002)
WA0651 (winter)
WA0651 (summer)
WA0651 (drinker study)
NARSES EF was derived as 37.4 %UAN for buildings housing laying hens in deep-pit or
perchery systems and 16.5% belt cleaning (a reduction of 56%). For broilers the weighted
mean is 8.1 %UAN.

Submission Report October 2010
23
Layers in cages – systems where manure is scraped from a collection shelf through a floor slot
to a deep-pit are included in the cages deep-pit category. Measurements under WA0651
indicated that a much lower emission factor was obtained for a daily belt-cleaning system as
compared with weekly cleaning. However, such frequent cleaning would not be practised on
commercial farms and the value is therefore not included here.
A measurement from Groot Koerkamp et al. (1998) for broiler housing (164 g N lu-1
d-1
) has
been excluded from the inventory. This measurement was from an old housing system, no
longer representative of current broiler housing, and was also based on a single measurement
in time rather than an integrated measurement over the duration of the crop.
Storage
Storage losses can be divided into storage and ‘break-out’ (i.e. when loading to
trailer/spreader takes place).
Storage losses
Mean EF
Values Derived
from n
values
Emission
as
%TAN
Source
g N t-1
initial heap mass
Layer manure
1956 318
3172
3141
1193
2
4
4
1
2.2
15.1
29.4
13.4
WA0712
WA0651 (belt scraped)
WA0651 (deep pit)
WA0651 (belt scraped)
Litter
1435 478
1949
158
639
3949
1
4
4
2
2.2
19.9
2.0
7.2
NA
WA0712
WA0651 (winter)
WA0651 (summer)
WA0651 (drinkers)
WA0716
UKAEI
Emissions from FYM stores were previously based on surface area. However, it was
considered that the estimates of store surface areas (Nicholson and Brewer survey, 1994)
seriously underestimated solid manure storage areas (possibly because of multiple use of the
same area or not accounting for short-term storage heaps). Therefore emissions are now
calculated on a per tonne basis (using data from the same experimental studies).
NARSES
NARSES EF were derived from weighted means as 17.8 %UAN for layer manure and 8.7%
for poultry litter. Duck manure was assumed to have the same EF during storage as cattle
FYM (35%).

Submission Report October 2010
24
DEER
Grazing
Sheep grazing (lowland sheep) emission factor used as liveweights similar.
Land spreading
Emission factor for cattle FYM used.
Housing
Emission factor for sheep housing used.
Storage
Emission factor for cattle FYM used.
HORSES
Mean EF of 10.6 kg NH3-N per animal per year used, as for ‘other horses’ in non-agricultural
emissions inventory (Sutton et al., 2000).
NARSES EF derived using reverse-engineering as 35 %TAN, based on the UKAEI EF.
CONSERVED GRASSLAND & TILLAGE
NARSES
A model based on Misselbrook et al. (2004) but modified according to data from the NT26
project is used to estimate EF for different fertiliser types:
Ammonium nitrate (and ‘other N’ category) – a fixed emission factor of 1.8% N applied is
now used as there was no consistent evidence of temperature, rainfall, land-use or crop
height effects on emission. The only modifier applied is for direct placement of fertiliser
into soil on tillage, where a reduction efficiency of 80% is assumed.
Ammonium sulphate, diammonium phosphate – for this minor category of fertilisers, soil
pH has an influence on emissions. The rules for ammonium nitrate are applied for
applications to non-calcareous soils and the rules for urea are applied for applications to
calcareous soils.
Urea ammonium nitrate – a maximum EF of 23% is applied (from NT26 data-set) and the
rules for urea applications are applied.
Urea – EF is derived according to EFmax, application rate, rainfall and temperature. EFmax,
is 45% (from NT26 data-set). The modifiers for application rate, rainfall and temperature
were revised to be consistent with the NT26 model.
10% of fertiliser applied to tillage is assumed to be by soil placement
Mean application rate of urea for a given application timing is assumed to be 60 kg ha-1
N
(previously 120)
Submission Report October 2010
25
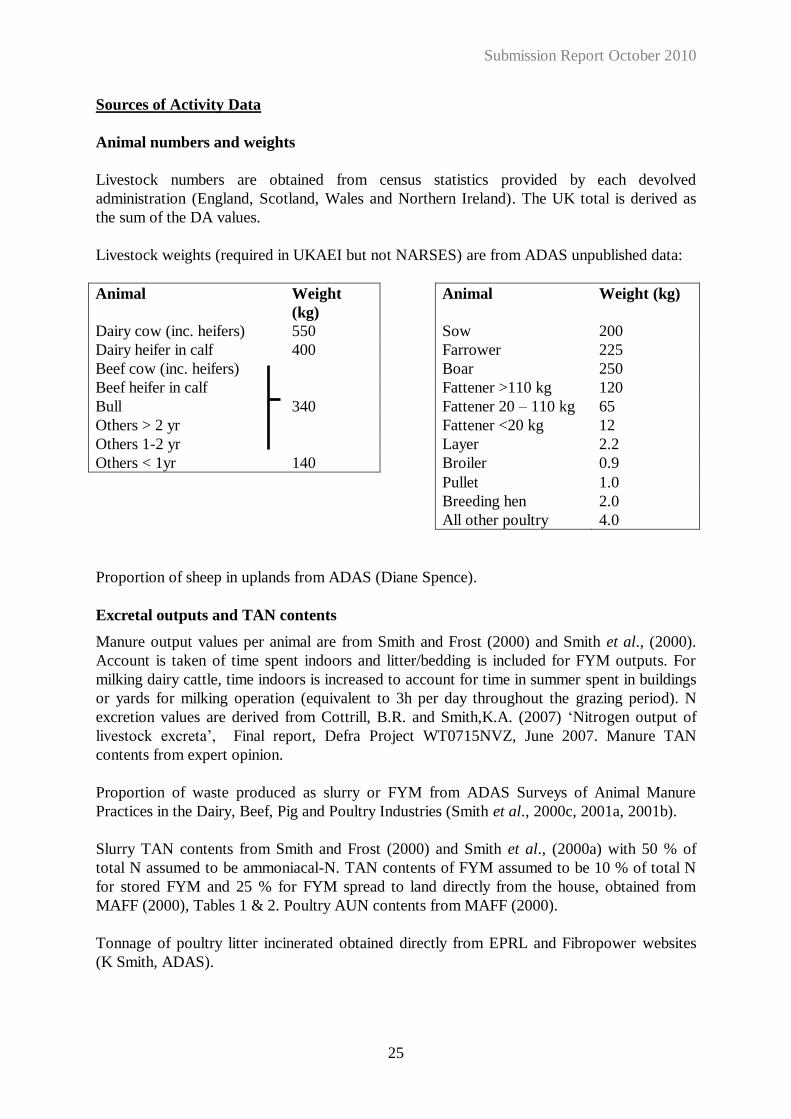
Sources of Activity Data
Animal numbers and weights
Livestock numbers are obtained from census statistics provided by each devolved
administration (England, Scotland, Wales and Northern Ireland). The UK total is derived as
the sum of the DA values.
Livestock weights (required in UKAEI but not NARSES) are from ADAS unpublished data:
Animal Weight
(kg)
Animal Weight (kg)
Dairy cow (inc. heifers) 550 Sow 200
Dairy heifer in calf 400 Farrower 225
Beef cow (inc. heifers) Boar 250
Beef heifer in calf Fattener >110 kg 120
Bull 340 Fattener 20 – 110 kg 65
Others > 2 yr Fattener <20 kg 12
Others 1-2 yr Layer 2.2
Others < 1yr 140 Broiler 0.9
Pullet 1.0
Breeding hen 2.0
All other poultry 4.0
Proportion of sheep in uplands from ADAS (Diane Spence).
Excretal outputs and TAN contents
Manure output values per animal are from Smith and Frost (2000) and Smith et al., (2000).
Account is taken of time spent indoors and litter/bedding is included for FYM outputs. For
milking dairy cattle, time indoors is increased to account for time in summer spent in buildings
or yards for milking operation (equivalent to 3h per day throughout the grazing period). N
excretion values are derived from Cottrill, B.R. and Smith,K.A. (2007) ‘Nitrogen output of
livestock excreta’, Final report, Defra Project WT0715NVZ, June 2007. Manure TAN
contents from expert opinion.
Proportion of waste produced as slurry or FYM from ADAS Surveys of Animal Manure
Practices in the Dairy, Beef, Pig and Poultry Industries (Smith et al., 2000c, 2001a, 2001b).
Slurry TAN contents from Smith and Frost (2000) and Smith et al., (2000a) with 50 % of
total N assumed to be ammoniacal-N. TAN contents of FYM assumed to be 10 % of total N
for stored FYM and 25 % for FYM spread to land directly from the house, obtained from
MAFF (2000), Tables 1 & 2. Poultry AUN contents from MAFF (2000).
Tonnage of poultry litter incinerated obtained directly from EPRL and Fibropower websites
(K Smith, ADAS).
Submission Report October 2010
26
Manure output and N excretion by livestock category (2008 values)
Livestock type Manure output
kg d-1
% manure
produced as …
N excretion
kg yr-1
%TAN at
excretion
Slurry FYM Slurry FYM
Cattle
Dairy cows & heifers 52.7 68.5 66 34 118.4 60
Dairy heifers in calf 31.9 41.5 66 34 67 60
Dairy replacements >2 yrs 31.9 41.5 18 82 56 60
Dairy replacements 1-2 yrs 25.8 33.5 18 82 56 60
Dairy bulls > 2 yrs 31.9 41.5 18 82 53 60
Dairy bulls 1-2 yrs 25.8 33.5 18 82 56 60
Dairy calves 14.5 18.9 0 100 38 60
Beef cows & heifers 31.9 41.5 18 82 79 60
Beef heifers in calf 25.8 33.5 18 82 56 60
Bulls >2 yrs 31.9 41.5 18 82 53 60
Bulls 1-2 yrs 25.8 33.5 18 82 56 60
Beef > 2 yrs 31.9 41.5 18 82 56 60
Beef 1-2 yrs 25.8 33.5 18 82 56 60
Beef calves 14.5 18.9 0 100 38 60
Sheep
Ewes - lowland 5.3 0 100 10.5 60
Ewes - upland 5.3 0 100 9.9 60
Lambs - lowland 2.6 0 100 0.6 60
Lambs - upland 2.6 0 100 0.7 60
Goats 20.6 60
Deer 13 60
Pigs
Maiden gilts 10.9 13.6 35 65 15.5 70
Sows 35 65 18.9 70
Boars 10.9 13.6 0 100 22.9 70
Fatteners >110 kg 33 67 16.1 70
Fatteners 80-110 kg 33 67 16.1 70
Fatteners 50-80 kg 33 67 13.9 70
Fatteners 20-50 kg 33 67 9.3 70
Weaners (<20 kg) 1.3 1.4 53 47 3.6 70
Poultry
Laying hens (cages) 0.11 0 100 0.70 70
Laying hens (free-range) 0.11 0 100 0.78 70
Broilers 0.05 0 100 0.44 70
Pullet 0.02 0 100 0.33 70
Breeding Hens 0.11 0 100 1.04 70
Turkeys (m) 0.09 0 100 2.16 70
Turkeys (f) 0.09 0 100 1.44 70
Ducks 0.09 0 100 1.67 70
Horses 0 100 50 60
Manure volume output data derived from Smith et al. (2000c, 2001a, 2001b) with
interpretation for animal place and annual outputs by K Smith (ADAS). Nitrogen excretion
data from project WT0715NVZ with interpretation by B Cotteril and K Smith (ADAS).
Land spreading
Proportion of pig or cattle manure applied to grassland and arable, proportion applied in
summer (May-July), proportion applied by injection or irrigated and proportion incorporated
Submission Report October 2010
27
within 1d or 1wk of application obtained from ADAS Surveys of Animal Manure Practices in
the Dairy, Beef, Pig and Poultry Industries (Smith et al., 2000c, 2001a, 2001b). Proportion of
cattle and pig FYM spread to land without storage also obtained from the same source.
Proportion of poultry manure applied to grassland and arable obtained from Farm Practices
Survey (Defra 2001).
Proportion of slurry in each dry matter category from ADAS unpublished (K Smith, B
Chambers).
Housing
Proportion of animals in each housing type - cattle from ADAS Surveys of Animal Manure
Practices in the Dairy and Beef Industries (1998), pigs from Sheppard (1998, 2002).
Proportion of pigs outdoors from Sheppard (1998, 2002). Poultry housing and % manure
dropped outdoors provided by A Elson (ADAS). Regular revisions are made using data from
the Farm Practices Surveys (England). Although surveys are often only for England or
England and Wales, data are extrapolated across the whole UK.
Cattle housing
Smith et al 2001 FPS2010
2000 2010
Dairy cows kept on slurry (%) 66% 83%
Dairy followers kept on slurry (%) 18% 35%
Beef cattle kept on slurry (%) 18% 17%
Beef cattle on slurry are kept at a constant 18%. Values for dairy cows and dairy followers on
slurry are interpolated between 2000 and 2010 and are assumed fixed before and after these
years.
Cattle housing periods obtained from ADAS Surveys of Animal Manure Practices in the Dairy
and Beef Industries (1998), with housing period of milking dairy cattle extended to account
for time in for milking during the summer months. For sheep, ewes indoors for 30 d, lambs not
indoors at all. Poultry and pigs assume 100 % occupancy as June census takes a snapshot of
animal numbers which will reflect the actual % occupancy.
Submission Report October 2010
28
Pig housing
Smith
et al.,
2000c
Sheppard
1998
Sheppard
2002
FPS2009 FPS2009
1993 1998 2002 2006 2009
Dry sows on full slats (%) 3% 3% 3% 1% 2%
Dry sows on part slats (%) 24% 22% 22% 2% 10%
Dry sows on straw (%) 52% 47% 47% 68% 47%
Dry sows outdoors (%) 20% 28% 28% 29% 41%
Farrowing sows on full slats (%) 13% 11% 10% 10% 12%
Farrowing sows on part slats (%) 48% 42% 39% 17% 22%
Farrowing sows on straw (%) 20% 18% 17% 46% 23%
Farrowing sows outdoors (%) 20% 30% 34% 27% 43%
Boars on full slats (%) 0% 0% 0% 0% 0%
Boars on part slats (%) 0% 0% 0% 0% 0%
Boars on straw (%) 80% 72% 72% 72% 72%
Boars outdoors (%) 20% 28% 28% 28% 28%
Fatteners (20-110kg) on full slats (%) 25% 15% 15% 18% 9%
Fatteners (20-110kg) on part slats (%) 25% 20% 20% 26% 25%
Fatteners (20-110kg) on straw (%) 50% 64% 64% 53% 64%
Fatteners (20-110kg) outside (%) 0% 1% 1% 3% 2%
Weaners (<20kg) on full slats (%) 35% 27% 24% 19% 9%
Weaners (<20kg) on part slats (%) 55% 23% 20% 25% 27%
Weaners (<20kg) on straw (%) 10% 50% 45% 40% 43%
Weaners (<20kg) outside (%) 0% 1% 11% 16% 21%
Data are interpolated between years to derive the trend. FPS2010 gives some information on
pig housing types, but does not break down into sub-categories of pig.

Submission Report October 2010
29
Poultry housing
Smith et
al., 2001a
FPS2009 FPS2010
2000 2009 2010
Layers free-range (%) 13% 44%
Layers in perchery (%) 5% 7%
Layers free-range/perchery on BAT 0% 1%
Layers in cages, deep-pit (%) 57% 25%
Layers in cages, belt-cleaned (%) 25% 24%
Broilers free-range (%) 1% 7%
Broilers indoors, standard housing (%) 99% 93%
Broilers indoors, reduced emission housing (%) 0% 20%
Pullets free-range (%) 10% 6%
Pullets indoors, standard housing (%) 90% 94%
Pullets indoors, reduced emission housing (%) 0% 26%
Breeding hens free-range (%) 10% 1%
Breeding hens indoors, standard housing (%) 90% 99%
Breeding hens indoors, reduced emission housing (%) 0% 0%
Turkeys free-range (%) 10% 18%
Turkeys indoors, standard housing (%) 90% 82%
Turkeys indoors, reduced emission housing (%) 0% 11%
Ducks free-range (%) 10%
Ducks indoors, standard housing (%) 90%
Ducks indoors, reduced emission housing (%) 0%
FPS2009 data for laying hens was considered to be insufficiently robust (free-range laying
hens were estimated at 5%, far below industry and expert opinion).
Storage
Proportions of manure stored in different store categories derived from Farm Practices
Surveys.
The proportion of cattle stores crusted estimated from ADAS Surveys of Animal Manure
Practices in the Dairy and Beef Industries (1998), with stores stirred never or only
occasionally assumed to be crusted.

Submission Report October 2010
30
Hard standings
UKAEI input data
Usage derived from survey conducted under WA0528 (Webb et al., 2001) and from NT2402†.
Hard standing Area per animal
(m2)
% animals using hard
standing
Usage
(Days per year)
Dairy cow collecting
yard
2.15 (1.74, 2.55†) 65 358 (365, 358
†)
Dairy cow
feeding/loafing yard
3.03 (1.70, 3.03†) 30 303 (365, 240
†)
Dairy cow self-feed
silage yard
4.75 14 180
Beef cattle
feeding/loafing yard
4.32 45 180
Beef cattle self-feed
silage
4.71 9 180
Sheep handling area –
lowland sheep
0.92 67 24
- upland sheep 0.92 67 6
Pig loading area 1.00 19 4
NB Area per animal not actually used in calculation, but included here for reference.
Fertiliser
Fertiliser usage in England, Wales and Scotland derived from British Survey of Fertiliser
Practice 2008 (http://www.defra.gov.uk/environ/pollute/bsfp/index.htm) and for Northern
Ireland from DARDNI stats (http://www.dardni.gov.uk/econs/.htm).

Submission Report October 2010
31
References
Baines, S., Svoboda, I. F. and Sym, G. (1997) Estimates of slurry, manure storage and housings in use in Scotland
and Northern Ireland. Report to MAFF (WA0620), SAC Ayr.
Bussink, D.W. (1994). Relationship between ammonia volatilization and nitrogen fertilizer application rate, intake and
excretion of herbage nitrogen by cattle on grazed swards. Fertilizer Research 38, 111-121
CAMAR: Groot Koerkamp, P. W. G., Metz, J. H. M., Uenk, G. H., Phillips, V. R., Holden, M. R., Sneath, R. W., Short, J. L.,
White, R. P., Hartung, J., Seedorf, J., Schröder, M., Linkert, K. H., Pedersen, S., Takai, H., Johnsen, J. O. and
Wathes, C. M., 1998. Concentrations and emissions of ammonia in livestock buildings in Northern Europe. Journal
of Agricultural Engineering Research 70, 79-95.
Chalmers, A. G., et al. (2001). Fertiliser use on farm crops for crop year 2000. British Survey of Fertiliser Practice,
Edinburgh: The Stationery Office.
Chambers, B.J., Smith, K.A. and van der Weerden, T.J. (1997). Ammonia emissions following the land spreading of solid
manures. In Gaseous Nitrogen Emissions from Grasslands. Eds S.C. Jarvis and B.F. Pain, CAB International,
Oxford, pp. 275-280.
Chambers, B. J., Lord, E. I., Nicholson, F. A. and Smith, K. A. (1999). Predicting nitrogen availability and losses following
application of organic manures to arable land: MANNER. Soil Use and Management 15, 137-143.
DANI (1998). Statistical Review of Northern Ireland Agriculture, 1997. Department of Agriculture for Northern Ireland,
Economics and Statistics Division, Belfast, Northern Ireland, UK.
Defra (2001) http://www.defra.gov.uk/esg/work_htm/publications/cs/fps/fpsfinalreport.PDF
Demmers, T.G.M., Phillips, V.R., Short, J.L., Burgess, L.R., Hoxer, R.P. and Wathes, C.M (1997). Validation of ventilation
rate measurement methods and the ammonia emission from a naturally-ventilated UK dairy and beef unit. In:
Ammonia and Odour Emissions from Animal Production Facilities. Eds J.A.M. Voermans and G.J. Monteney,
Proceedings of an international symposium held at Vinkeloord, Netherlands, 6-10 October 1997. Published by
NTVL, Rosmalen, NL pp. 219-230.
Demmers, T.G.M., Burgess, L.R., Short, J.L., Phillips, V.R., Clark, J.A. and Wathes, C.M. (1999). Ammonia emissions from
two mechanically ventilated UK livestock buildings. Atmospheric Environment 33, 217-227.
Dore, C. J., Jones, B. M. R., Scholtens, R., Burgess, L. R., Huis in’t Veld, J. W. H., Phillips, V. R. (2004). Robust methods for
measuring ammonia emission rates from livestock buildings and manure stores. Part 1 Comparative demonstrations
of three methods on the farm. Atmospheric Environment 38, 3017-3024.
Hill, R.A. (2000). Emission, dispersion and local deposition of ammonia volatilised from farm buildings and following the
application of cattle slurry to grassland. PhD Thesis, University of Plymouth.
Hodge, I. and Renwick, A. (2006). Business as usual projections of agricultural activities for the water framework directive:
Phase 2. Final Report. Rural Business Unit, Environmental Economy and Policy Research Group, Department of
Land Economy, 19 Silver Street, Cambridge CB3 9EP.
Jarvis, S.C; Hatch, D. J; Orr, R.J. and Reynolds, S.E. (1991). Micrometeorological studies of ammonia emissions from sheep
grazed swards. Journal of Agricultural Science Cambridge, 117, 101-109
Jarvis, S. C. and Bussink, D. W. (1990). Nitrogen losses from grazed swards by ammonia volatilization. Proceedings of the
13th General Meeting of the European Grassland Federation, June 25-29, 1990, Banska Bystrica, Czechoslovakia,
p.13-17.
Kirchmann, H., and Witter, E. (1989). Ammonia volatilization during aerobic and anaerobic manure decomposition. Plant
and Soil 115, 35-41.
Koerkamp, P., Metz, J. H. M., Uenk, G. H., Phillips, V. R., Holden, M. R., Sneath, R. W., Short, J. L., White, R. P., Hartung,
J., Seedorf, J., Schroder, M., Linkert, K. H., Pedersen, S., Takai, H., Johnsen, J. O. and Wathes, C. M. (1998).
Concentrations and emissions of ammonia in livestock buildings in Northern Europe. Journal of Agricultural
Engineering Research 70, 79-95.
Ledgard, S. F. (1996). Nitrogen inputs and losses from New Zealand dairy farmlets, as affected by nitrogen fertilizer
applications: year one. Plant and Soil 181, 65-69.

Submission Report October 2010
32
MAFF (2000). Fertilizer Recommendations for Agricultural and Horticultural Crops (RB209), 7th Edition. Her Majest’s
Stationery Office, London, UK.
Mercer, D. R. (1993) Estimates of the number and types of poultry housing in use in England and Wales. Report to
MAFF, ADAS Nottingham.
Misselbrook, T.H., Webb, J. and Gilhespy, S.L. (2006). Ammonia emissions from outdoor concrete yards used by
livestock – quantification and mitigation. Atmospheric Environment 40, 6752-6763.
Misselbrook, T.H., Sutton, M.A. and Scholefield, D. (2004). A simple process-based model for estimating ammonia
emissions from agricultural land after fertilizer applications. Soil Use and Management 20, 365-372.
Misselbrook, T. H., Smith, K. A., Johnson, R. A. and Pain, B. F. (2002). Slurry application techniques to reduce
ammonia emissions: Results of some UK field-scale experiments. Biosystems Engineering 81, 313-321.
Misselbrook, T. H., Webb, J., Chadwick, D. R., Ellis, S. and Pain, B. F. (2001). Gaseous emissions from outdoor concrete
yards used by livestock. Atmospheric Environment 35, 5331-5338.
Misselbrook, T. H., Pain, B. F. and Headon, D. M. (1998). Estimates of ammonia emission from dairy cow collecting yards.
Journal of Agricultural Engineering Research 71, 127-135.
Nicholson, F. A., Chambers, B. J. and Smith, K. A. (1996) Nutrient composition of poultry manures in England and
Wales. Bioresource Technology 58, 279-284.
Nicholson, R. J. and Brewer, A. J. (1994) Estimates of the numbers and types of slurry and manure stores in use in
England and Wales related to livestock species. Report to DEFRA (WA0611), ADAS Cambridge.
Pain, B. F., Rees, Y. J. and Lockyer, D. R. (1988). Odour and ammonia emission following the application of pig or cattle
slurry to land. In: Volatile emissions from livestock farming and sewage operations, eds V C Neilsen, J H
Voorburg and P L’Hermite. Elsevier Applied Science, London, pp. 2 - 11.
Pain, B. F., Phillips, V. R., Clarkson, C. R. and Klarenbeek, J. V. (1989). Loss of nitrogen through ammonia volatilisation
following the application of pig or cattle slurry to grassland. Journal of the Science of Food and Agriculture 47, 1-
12.
Peirson, S. (1995). Measurement of odour and ammonia emissions from livestock buildings, Phase 1 - Final Report to MAFF.
Project no. WAO601, ADAS Beverley.
Phillips, V.R., Sneath, R.W., Williams, A.G., Welch, S.K., Burgess, L.R., Demmers, T.G.M. and Short, J.L. (1997).
Measuring emission rates of ammonia, methane and nitrous oxide from full-sized slurry and manure stores. In:
Ammonia and Odour Emissions from Animal Production Facilities. Eds J.A.M. Voermans and G.J. Monteney,
Proceedings of an international symposium held at Vinkeloord, Netherlands, 6-10 October 1997. Published by
NTVL, Rosmalen, NL pp. 197-208.
Phillips, V. R., Bishop, S. J., Price, J. S. and You, S. (1998). Summer emissions of ammonia from a slurry-based, UK, dairy
cow house. Bioresource Technology 65, 213-219.
Robertson, A. P., Hoxey, R. P., Demmers, T. G. M., Welch, AS. K., Sneath, R. W., Stacey, K. F., Fothergill, A., Filmer, D.
and Fisher, C. (2002). Commercial-scale studies of the effect of broiler-protein intake on aerial pollutant emissions.
Biosystems Engineering 82, 217-225.
Sheppard, A. (1998) The Structure of Pig Production in England and Wales. Results of the National Survey of Pig
Production Systems. Special Studies in Agricultural Economics Report No. 40, University of Exeter.
Smith, K. A. and Chambers, B. J. (1995). Muck from waste to resource - utilization: the impacts and implications.
Agricultural Engineer, 50, 33-38.
Smith, K. A. and Frost, J. P. (2000). Nitrogen excretion by farm livestock with respect to land spreading requirements and
controlling nitrogen losses to ground and surface waters. Part 1: cattle and sheep. Bioresource Technology 71, 173-
181.
Smith, K. A., Charles, D. R. and Moorhouse, D. (2000a). Nitrogen excretion by farm livestock with respect to land spreading
requirements and controlling nitrogen losses to ground and surface waters. Part 2: pigs and poultry. Bioresource
Technology 71, 183-194.
Smith, K. A., Jackson, D. R., Misselbrook, T. H., Pain, B. F. and Johnson, R. A. (2000b). Reduction of ammonia emission by
slurry application techniques. Journal of Agricultural Engineering Research 77, 277-287.
Submission Report October 2010
33
Smith, K. A., Brewer, A. J., Dauven, A. and Wilson, D. W. (2000c). A survey of the production and use of animal manures in
England and Wales. I. Pig manure. Soil Use and Management 16, 124-132.
Smith, K. A., Brewer, A. J., Crabb, J. and Dauven, A. (2001a). A survey of the production and use of animal manures in
England and Wales. II. Poultry manure. Soil Use and Management 17, 48-56.
Smith, K. A., Brewer, A. J., Crabb, J. and Dauven, A. (2001b). A survey of the production and use of animal manures in
England and Wales. III. Cattle manures. Soil Use and Management 17, 77-87.
Sommer, S.G., Christensen, B.T., Nielsen, N.E., and Schjrrring, J.K. (1993). Ammonia volatilization during storage of cattle
and pig slurry: effect of surface cover. Journal of Agricultural Science, Cambridge, 121, 63-71.
Sutton, M. A., Dragosits, U., Tang, Y. S. and Fowler, D. (2000). Ammonia emissions from non-agricultural sources in the
UK. Atmospheric Environment 34, 855-869.
Thompson, R. B., Pain, B. F. and Lockyer, D. R. (1990a). Ammonia volatilization from cattle slurry following surface
application to grassland. I. Influence of mechanical separation, changes in chemical composition during
volatilization and the presence of the grass sward, Plant and Soil 125, 109-117.
Thompson, R. B., Pain, B. F. and Rees, Y. J. (1990b). Ammonia volatilization from cattle slurry following surface application
to grassland. II. Influence of application rate, windspeed and applying slurry in narrow bands. Plant and Soil 125,
119-128.
van der Weerden, T. J. and Jarvis, S. C. (1997). Ammonia emission factors for N fertilisers applied to two contrasting
grassland soils. Environmental Pollution 95, 205-211.
Wathes, C. M., Holden, M. R., Sneath, R. W., White, R. P. and Phillips, V. R. (1997). Concentrations and emission
rates of ammonia, nitrous oxide, methane, carbon dioxide, dust and endotoxin in UK broiler and layer
houses. British Poultry Science 38, 14-28.
Webb, J., (2001). Estimating the potential for ammonia emissions from livestock excreta and manures. Environmental
Pollution 111, 395-406.
Webb, J., and Misselbrook, T. H. (2004). A mass-flow model of ammonia emissions from UK livestock production.
Atmospheric Environment 38, 2163-2176.
Webb, J., Misselbrook, T., Pain, B. F., Crabb, J. and Ellis, S. (2001). An estimate of the contribution of outdoor
concrete yards used by livestock to the UK inventories of ammonia, nitrous oxide and methane. Atmospheric
Environment 35, 6447-6451.
Welch, D.C. (2003) A methodology for the measurement of distributed agricultural sources of ammonia outdoors. PhD
thesis, University of Nottingham.
Williams, J. R., Chambers, B. J., Hartley, A. R., Ellis, S. and Guise, H. J. (2000). Nitrogen losses from outdoor pig
farming systems. Soil Use and Management 16, 237-243.
DEFRA Projects
Final reports from the following projects are available from DEFRA
AM0101 National ammonia reduction strategy evaluation system (NARSES)
AM0102 Modelling and measurement of ammonia emissions from ammonia mitigation
pilot farms
AM0103 Evaluation of targeted or additional straw use as a means of reducing ammonia
emissions from buildings for housing pigs and cattle
AM0110 Additional housing measurements for solid vs. liquid manure management
systems
AM0111 Measurement and abatement of ammonia emissions from hard standings used
by livestock
AM0115 Investigation of how ammonia emissions from buildings housing cattle vary
with the time cattle spend inside them
KT0106 MANNER - Policy Support Model (MANNER-PSM)

Submission Report October 2010
34
LK0643 UK Poultry Industry IPPC Compliance (UPIC)
NT2001 Integration of animal manures in crop and livestock farming systems: nutrient
demonstration farms
NT2402 Impact of nutrition and management on N and P excretions by dairy cows
NT2605 The behaviour of some different fertiliser-N materials - Main experiments
OC9117 Ammonia emission and deposition from livestock production systems
WA0519 Enhancing the effective utilisation of animal manures on-farm through effective
compost technology
WA0618 Emissions from farm yard manure based systems for cattle
WA0625 The effects of covering slurry stores on emissions of ammonia, methane and
nitrous oxide
WA0632 Ammonia fluxes within solid and liquid manure management systems
WA0633 Predicting ammonia loss following the application of organic manures to land
WA0638 Low cost, aerobic stabilisation of poultry layer manure
WA0641 Low-cost covers to abate gaseous emissions from slurry stores
WA0651 Ammonia fluxes within broiler litter and layer manure management systems
WA0652 Field ammonia losses in sustainable livestock LINK Project LK0613
WA0653 Quantifying the contribution of ammonia loss from housed dairy cows to total
N losses from dairy systems (MIDaS2)
WA0707 Effect of storage conditions on FYM composition, gaseous emissions and
nutrient leaching during storage
WA0708 Covering a farm scale lagoon of pig slurry
WA0712 Management techniques to minimise ammonia emissions during storage and
land spreading of poultry manures
WA0714 Natural crusting of slurry storage as an abatement measure for ammonia
emission on dairy farms
WA0716 Management techniques to reduce ammonia emissions from solid manures
WA0717 Ammonia emissions and nutrient balance in weeping-wall stores and earth
banked lagoons for cattle slurry storage
WA0720 Demonstrating opportunities of reducing ammonia emissions from pig housing
WA0722 Ammonia emission from housed dairy cows in relation to housing system and
level of production
WT0715NVZ Nitrogen and phosphorus output standards for farm livestock