inventory management practices and performance of public
TRANSCRIPT

INVENTORY MANAGEMENT PRACTICES AND
PERFORMANCE OF PUBLIC HOSPITALS IN KENYA
MARGARET W. NJOROGE
A RESEARCH PROJECT SUBMITTED IN PARTIAL
FULFILLMENT OF THE REQUIREMENTS FOR THE AWARD
OF THE DEGREE OF MASTER OF BUSINESS
ADMINISTRATION, SCHOOL OF BUSINESS, UNIVERISTY OF
NAIROBI
OCTOBER 2015
ii
DECLARATION
This research project is my original work and has not been presented to any other
University for an award of degree.
Signature…………………………… Date………………………………..
Ms. Margaret Njoroge
REG No: D61/67841/2013
This research project has been submitted for examination with my approval as the
university supervisor.
Signature………………………… Date…………………………………
Mr. Michael Chirchir
Department of Management Science
School of Business
University of Nairobi

iii
ACKNOWLEDGEMENT
This research project could not have been possible without the valuable input of a
number of groups whom I wish to acknowledge. First and foremost, great thanks to
God for His grace and the gift of life during the period of the study.
Special appreciation goes to my supervisors Mr. Michael Chirchir and Onserio
Nyamwange I wish to sincerely acknowledge his professional advice and guidance
in the research project.
Thanks to the entire academic staff of the school of business for their contribution in
one way or another.
I am thankful to the staff of all Public hospitals in Nairobi and former central
province for the invaluable assistance during the period of data collection. To my
family and friends for their moral support and encouragement during the study, to
all of you, kindly accept my appreciation for your great support.
I appreciate the support of my colleagues who gave me useful information which
assisted in completing this work especially Directorate of Arid and Semi-Arid staff,
Jeff Wainaina and Cecilia Wanjiku. Indeed I am grateful to you and to many other
friends whose names I cannot mention individually, I entrust God to reward you
abundantly.

iv
DEDICATION
This project is dedicated to my family and especially my two lovely daughters, Rita
and Joan, for their moral support and encouragement when I was writing this research
project.
v
ABSTRACT
Public hospitals have a procurement department that is responsible for the provision
of goods services to the hospitals with the aim of providing quality health care
services in order to achieve customer satisfaction. The study sought to determine the
inventory management practices used by Public hospitals in Kenya, establish the
relationship between inventory management practices and performance of public
hospitals in Kenya and to determine the challenges of implementing inventory
management practices in public hospitals in Kenya. The study used a descriptive
survey establishing the relationship between the variables. The study population
comprised of the main public hospitals in Nairobi County and former Central
Province Counties. The study considered 40 hospitals where inventory management
was mostly carried out. The study used both primary data that was collected through a
semi-structured questionnaire to collect information for quantitative and qualitative
analysis. Out of the 40 questionnaires that were distributed 35 questionnaires were
filled and returned successfully. This represents a response rate of 88 percent which
was considered sufficient for making generalization of all the public hospitals in
Kenya. Data was analyzed using descriptive statics and regression analysis. The study
found that the most popular inventory management practices used by public hospitals
in Nairobi and former central province counties are follows: ERP systems, ABC
systems, e-procurement, simulation and EOQ. These practices were mainly used in
level 5, level 6 and stand-alone which offers specialized services and operates under
defined semi-autonomy which allows them to manage their own inventory. The study
further concludes that the main challenges that hindered implementation of inventory
management practices in public hospitals were: failure to invest in modern
technologies, insufficient, insufficient funding, poor infrastructure, lack of top
management commitment training and unreliable suppliers. The regression results
concluded that inventory management practices were positively related to
performance of public hospitals in Nairobi and former Central province. The major
limitation of this study is that it was limited to district hospitals in Nairobi and former
Central province Counties due to costs and time constraints. It would have been
important for future researchers to consider investigating inventory management
practices in public hospitals outside Nairobi County and former Central Province
Counties to find out whether these findings will hold. The study recommends that
government allocates more funds to public hospitals to be invested in modern
information technologies because this will lead to increased information sharing,
reduction of costs and improved quality of health services.
vi
TABLE OF CONTENTS DECLARATION.......................................................................................................... ii
ACKNOWLEDGEMENT ......................................................................................... iii
DEDICATION............................................................................................................. iv
ABSTRACT .................................................................................................................. v
LIST OF TABLES ...................................................................................................... ix
LIST OF FIGURES ..................................................................................................... x
ABBREVIATIONS AND ACRONYMS ................................................................... xi
CHAPTER ONE: INTRODUCTION ........................................................................ 1
1.1 Background of the Study ......................................................................................... 1
1.1.1 Inventory Management Practices .............................................................. 2
1.1.2 Supply Chain Performance ....................................................................... 3
1.1.3 Public Hospitals in Kenya ......................................................................... 5
1.2 Statement of the Problem ......................................................................................... 7
1.3 Objectives of the Study ............................................................................................ 9
1.4 Value of the Study .................................................................................................. 9
CHAPTER TWO: LITERATURE REVIEW ......................................................... 11
2.1 Introduction ............................................................................................................ 11
2.2 Theories of Inventory Management ....................................................................... 11
2.3 Inventory Management Practices ........................................................................... 13
2.4 Other Inventory management Practices ................................................................. 16
2.5 Performance Measurements ................................................................................... 19
2.6 Relationship between Inventory Management Practices and Performance ........... 19
2.7 Challenges of Implementing Inventory Management Practices ............................ 21
2.8 Summary of the Literature Review and Knowledge Gaps .................................... 23
2.9 Conceptual Framework .......................................................................................... 24
CHAPTER THREE: RESEARCH METHODOLOGY ........................................ 25
3.1 Introduction ............................................................................................................ 25
3.2 Research Design..................................................................................................... 25
3.3 Study Population .................................................................................................... 25
3.4 Data Collection ...................................................................................................... 25
3.5 Data Analysis ......................................................................................................... 26

vii
CHAPTER FOUR: DATA ANALYSIS, RESULTS AND INTERPRETATION 28
4.1 Introduction ............................................................................................................ 28
4.2 Response Rate ........................................................................................................ 28
4.3 General Information ............................................................................................... 28
4.3.1 Duration of Operation of the Organization ............................................. 29
4.3.2 Position of the Respondents .................................................................... 29
4.3.3 Length of Service .................................................................................... 30
4.3.4 Level of Education .................................................................................. 31
4.4 Inventory Management practices ........................................................................... 32
4.4.1 Economic Order Quantity ....................................................................... 32
4.4.2 Radio Frequency Identification System .................................................. 33
4.4.3 Vendor Managed Inventory System ....................................................... 34
4.4.4 Enterprise Resource Planning ................................................................. 35
4.4.5 Just in Time ............................................................................................. 35
4.4.6 ABC Analysis ......................................................................................... 36
4.4.7 E-procurement......................................................................................... 37
4.4.8 Simulation ............................................................................................... 37
4.4.9 Summary of Inventory Management Practices used by Public Hospitals
in Nairobi County and former Central Province Counties ............................... 38
4.5 Inventory Management Practices and Performance of Public Hospitals in Kenya39
4.5.1 Model Coefficients.................................................................................. 39
4.5.2 Coefficient of Determination R2 ............................................................. 41
4.5.3 F-Test for the Full Model ........................................................................ 42
4.5.4 Challenges of Inventory Management Practices ..................................... 43
4.6 Chapter Summary and Discussion ......................................................................... 44
CHAPTER FIVE: SUMMARY, CONCLUSION AND RECOMMENDATIONS ......... 46
5.1 Introduction ............................................................................................................ 46
5.2 Summary of Findings ............................................................................................. 46
5.3 Conclusion ............................................................................................................. 47
5.4 Recommendations from the Study ......................................................................... 48
5.5 Limitations of the Study......................................................................................... 49
5.6 Areas for Further Research .................................................................................... 50

viii
REFERENCES ........................................................................................................... 51
APPENDIX I: Research Questionnaire ...................................................................... 55
APPENDIX II: List of Public Hospitals in Nairobi County and Former Central
Province Counties in Kenya (Levels 4, 5, 6 & stand alone) ........................................ 60

ix
LIST OF TABLES
Table 2.1 Summary of the Literature Review and Knowledge Gaps .......................... 23
Table 3.1 Summary of Data Collection and Analysis.................................................. 27
Table 4.1 Economic Order Quantity ............................................................................ 33
Table 4.2 Radio Frequency Identification System ....................................................... 33
Table 4.3 Vendor Managed Inventory System ............................................................ 34
Table 4.4 Enterprise Resource Planning ...................................................................... 35
Table 4.5 Just in Time .................................................................................................. 35
Table 4.6 ABC Analysis .............................................................................................. 36
Table 4.7 E-procurement ............................................................................................. 37
Table 4.8 Simulation .................................................................................................... 37
Table 4.9 Summary of Inventory Management Practices used by Public Hospitals in
Nairobi County and former Central Province Counties ............................................... 38
Table 4.10 Model Coefficients .................................................................................... 40
Table 4.11 Model Summary ........................................................................................ 41
Table 4.12 Analysis of Variance .................................................................................. 42
Table 4.13 Challenges of Implementing Inventory Management Practices ................ 43

x
LIST OF FIGURES
Figure 2.1 Independent and Dependent Variables ....................................................... 24
Figure 4.1 Duration of Operation of the Organization ................................................ 29
Figure 4.2 Positions of the Respondents ...................................................................... 30
Figure 4.3 Length of Service ....................................................................................... 31
Figure 4.4 Level of Education ..................................................................................... 32

xi
ABBREVIATIONS AND ACRONYMS
EOQ Economic Order Quantity
ERP Enterprise Resource Planning
FIFO First In First Out
FSN First Slow Non-moving
HML High Medium Low
IFMIS Integrated Financial Management Information System
JIT Just-In-Time
RFIDS Radio Frequency Identification System
SCOR Supply Chain Operations Reference model
SDE Scarce Difficult Easy
SOPs Standard Operating Procedures
SWOT Strengths Weaknesses Opportunities Threats
VED Vital Essential Desirable
VMI Vendor Managed Inventory System

1
CHAPTER ONE: INTRODUCTION
1.1 Background of the Study
In the world today, every organization wants not only to mitigate the system wide
cost, but also to maintain minimum inventories along the supply chain while
maximizing the service level requirements of the customer (Sandeep, 2007). This
however cannot be achieved without modern technologies. The advancement of
technology and innovation has shortened the product life cycle and thus improved
inventory management systems of firms. This has led to reduced costs, increased
efficiency and thus boosted performance of firms. In some organizations it has led to
demand variability and thus strengthened the need to maintain proper inventory for
improved supply chain performance. Dryden and Brownell (2012) posit excess
inventory in the supply chain blocks the cash flow and this might negatively affect
organizational performance.
Managing customer and vendor relationships is a critical aspect of managing supply
chains. In many cases, the collaborative relationship concept has been considered the
essence of supply chain management. Bicheno (2011) indicates that a closer
examination of supply chain relationships, particularly those involving product flows,
reveals that the heart of these relationships is inventory movement and storage. Eckert
(2012) argues that much of the activity involved in managing relationships is based on
the purchase transfer, or management of inventory.
Brigham and Gapenski (2013) argue that inventory management is important because
firms will ensure assets and stock are well managed and accurate demand forecasting
is maintained to avoid unplanned procurement processes. This will assist the firm in
executing successful procurement processes that match demand and supply forces.

2
Agus and Noor (2010) points out that demand forecasting helps the organization to
minimize operational costs, increased efficiency and on time delivery of goods and
services. This enables the organization to plan for the future demand by meeting the
growing needs of customers. This highly contributes to improved customer
satisfaction due to quality of goods and services offered.
1.1.1 Inventory Management Practices
Wisner and Leong (2011) define inventory management is the process of efficiently
overseeing the constant flow of units into and out of an existing inventory. This
process usually involves controlling the transfer in of units in order to prevent the
inventory from becoming too high, or dwindling to levels that could put the operation
of the company into jeopardy. Agus and Noor (2010) proper inventory management
also seeks to control the costs associated with the inventory, both from the perspective
of the total value of goods included and the tax burden generated by the cumulative
value of the inventory.
Dryden et al. (2012) argue that inventory management involves keeping accurate
records of finished goods that are ready for shipment. This often means posting the
production of newly completed goods to the inventory totals as well as subtracting the
most recent shipments of finished goods to buyers. The relevance of inventory
management practices is that they make it possible to quickly convey information to
sales personnel as to what is available and ready for shipment at any given time.
Brigham et al. (2013) posit that the firm should design and develop an inventory
management system that balances the demand and supply. This is intended to reduce
inventory costs, reduce the cycle time and improved sharing of information.

3
Therefore, the firm can effectively manage its inventory and coordinate its supply
chain system leading to improved performance.
Inventory management practices are activities and functions used by organizations to
manage stocks of finished products, semi-finished products and raw materials. Proper
implementation of these activities enables the firm to minimize waste and costs and
increase revenue (Zer and Wei, 2006). Some of the inventory management practices
used discussed in this study includes; economic order quantity, radio frequency
identification systems, vendor management inventory, enterprise resource planning,
Just In Time, ABC Analysis and E-procurement.
1.1.2 Supply Chain Performance
Fawcett and Magnan (2008) define supply chain performance as the entire chain's
ability to meet end-end customer needs through product availability and
responsiveness with on-time delivery. Key performance indicators in public hospitals
in Kenya, Financial Management Act (2006) and Treasury Instructions (TI)904
requires the department of Health to present annual indicators of effectiveness and
efficiency to Parliament. The key effectiveness indicators report how well the
department achieves its outcomes while efficiency indicators show accountability for
funds spent on delivery of the services. According to the Millennium Development
Goals (MDGs) (2000) the health sector key performance goals are MDG
1(eradication of extreme poverty and hunger), MDG 4 (reduction of child mortality
rates), MDG 5 (improvement of maternal health) and MDG 6 (combat HIV, malaria
and other diseases) Fawcett et al. (2008) maintain that the mechanism to achieve key
performance indicator goals is referred as key performance indicators’
4
accomplishment. This connects planning and execution hence builds steps for
realization of performance goals into routine daily work.
According to Stewart (2005) to measure supply chain performance, there are a set of
variables that capture the impact of actual working of supply chains on revenues and
costs of the whole system. These variables are drivers of supply chain performance
and are always derived from supply chain management practices. Managers of an
organization have to achieve an improvement in their supply chains. This is achieved
through procurement planning, proper record keeping, implementation and
monitoring performance. According to the results of the selected key performance
indicators’ accomplishment, managers may create current reports on key performance
indicators to compare multiple plans of supply chain management. In this
performance management cycle, there are many challenges, both in performance
measurement and its improvement (Cai, Xiangdong and Zhihui, 2008).
There are two commonly used tools for measuring organizational performance
namely: the Balance Score Card and SCOR models. The balanced scorecard is a
strategic planning and management system that is used extensively in business to
align business activities to the vision and strategy of the organization, improve
internal and external communications, and monitor organization performance against
strategic goals. It was originated by Kaplan and Norton as a performance
measurement framework that added strategic non-financial performance measures to
traditional financial metrics to give managers and executives a more balanced view of
organizational performance. The balanced scorecard suggests that we view the
organization from four perspectives, and to develop metrics, collect data and analyze

5
it relative to each of these perspectives learning and growth, financial perspective,
customer perspectives and business perspectives (Kaplan and Norton, 2001).
The Supply Chain Operations Reference Model (SCOR) is one of the supply chain
frameworks, linking business processes, performance metrics, practices and people
skills into a unified structure. Organizations employ the SCOR framework to achieve
increased speed of system implementations, support organizational learning goals and
improve inventory management (Watson, 2010). The SCOR model will be adopted
for the purposes of this study because it is more relevant and effective in evaluating
inventory management and supply chain performance.
1.1.3 Public Hospitals in Kenya
Vision 2030, Kenya`s long term development blueprint posits health as one of the
social pillars that play a key role in maintaining health and skilled manpower. To
realise this goal, the health sector defined improved procurement and availability of
essential health products and technologies as a priority reform besides digitization of
records, equipping health facilities and infrastructure development.
The Kenya Health Policy (2014-2030) indicates that the government under the
Ministry of Health works closely with public hospitals to ensure that goods and
services are delivered on time in order to provide quality health care services to the
citizens. According to the Kenya Constitution (2010) the Mandate of the Ministry of
Health is to formulate policies, set standards, provide health services, create an
enabling environment and regulate the provision of health service delivery. The
County Government is responsible for County health services, pharmacies, and
ambulance services, promotion of primary health care, licensing and control of
undertakings that sell food to public, cemeteries, funeral parlors and waste disposal.

6
Kenya`s healthcare system is structured in a hierarchical as follows:
Community Health Services; Comprise community units (level 1) in the country that
provide primary health care services at the sub-county level by facilitating
individuals, households and communities to embrace appropriate healthy behaviors
and recognizing signs and symptoms of conditions requiring referral.
Primary Care Services; Comprise of all dispensaries (Level 2) and health centers
(Level 3) including those managed by non-state actors. They provide disease
prevention and health care promotion services, linkages to community units, basic
outpatient diagnostics, medical surgical and rehabilitative services, ambulatory
services, in patient services for emergency clients awaiting referral.
County Referral Health Services; Comprise all Level 4 primary and Level 5
secondary facilities in the Counties (Districts) that provide comprehensive in patient
diagnostic, medical, surgical, habilitative and rehabilitative care, specialized
outpatient services as well as facilitate and manage both vertical and horizontal
referrals.
National Referral Services; Comprise of all tertiary (Level 6) referral hospitals (stand-
alone) such as national laboratories, government owned entities, blood transfusion
services, research and training institutions of highly specialized services.
County and national referral public health centers (Level 4, 5 and 6) are targeted for
this study because they offer specialized services and operate under some defined
level of semi-self-autonomy that allows them to manage their own inventory and
supply chains. The Health Policy provides that these public health centers maintain
inventory management and supply chain systems subject to Public Procurement and
Disposal ACT 2005 and Regulations 2006 in order to provide quality, accessible,

7
timely and affordable health care. This is based on an innovative, effective and
efficient performance model, according to market prices and ability of creating extra
value for its partners, service suppliers and customers (Silver, 2007).
1.2 Statement of the Problem
To continue serving the demand of customers most firms have realized the need to
maintain proper inventory management. Proper management of inventory enables
firms to mitigate inventory costs, reduce lead time and on-time delivery of goods and
services. According to Wisner et al (2011) organizations that maintain proper
inventory of raw materials are more likely to complete their production on time.
Inventory management control is part of the inventory management: that helps to
maintain continuity of production operations by maintaining a smooth flow of raw
materials without shortages (Shapiro, 2009).
Public Procurement in the health sector is guided by the Public Procurement and
Disposal Act 2005 and Regulations 2006. Mungu (2013) states that in hospitals,
inventory management is set up to ensure an optimal stock level of medicine in
general and essential medicine to enable satisfactory service that touches on human
life unlike procurement in other sectors. Emergencies pose health threats that are of
sudden onset in nature, are beyond the capacity of an individual/community to
manage and are life threatening or will lead to irreversible damage to the health of
individuals/community if not addressed. Thus inventory management is the heart of
pharmaceutical system and poor management will lead to wastage of financial
resources, shortages of essential medicines, average of others resulting in expiration
and deadline in quality health care (USAID, 2012). Despite the threats, in most public
hospitals patients are always turned away due to lack of essential drugs and

8
infrastructural facilities. Unfortunately in developing countries, most organizations in
the health sector, supply chain is not accorded central role in overall strategy.
Public hospitals have a procurement department that is responsible for the provision
of goods services to the hospitals with the aim of providing quality health care
services in order to achieve customer satisfaction. They maintain inventory
management system which is aimed at ensuring that facilities and equipment are
supplied and delivered at the right time. The hospitals should consider implementing
inventory management practices for reduced costs and improved supply chain
performance. This has a positive impact on reduction of mortality rate to the patients
especially in responding to emergency cases.
To undertake this critical role, the Health Policy orientation on health products and
technologies, stressed the need for effective and reliable procurement systems that
will enhance public and private investment to advance patients access to essential
health products and technologies and ensure value for money across the system.
Studies have been done in relation to inventory management and supply chain
performance. Akintonye (2014) found that inventory management led to improved
performance of German Service firms. Mehra (2014) and Lapide (2010) also
concluded that use of technology in inventory management improved efficiency of
manufacturing firms and service firms.
Gakuru (2012) found that the major factor hindering the application of inventory
model is frustrations by the ordering system. Lack of computers to keep track of
inventory levels and lack of awareness on how best to implement the models were
also cited as constraining factors. Kitheka (2012) indicated that inventory
management automation affected the performance of the supermarkets. The findings

9
revealed that there was a positive linear relationship between inventory management
automation and the performance of the supermarkets.
The above studies have dwelt on inventory models and inventory management
automation. This study focused on inventory management practices and performance
of public hospitals. This was achieved through seeking answers to the following
research questions: what are the inventory management practices used by Public
hospitals in Kenya? What is the relationship between inventory management practices
and performance of Public hospitals in Kenya? What are the challenges of
implementing inventory management practices in public hospitals of Kenya?
1.3 Objectives of the Study
i. To establish the inventory management practices used by Public hospitals in
Kenya
ii. To determine the relationship between inventory management practices and
performance of public hospitals in Kenya.
iii. To determine the challenges of implementing inventory management practices in
public hospitals in Kenya.
1.4 Value of the Study
The study hopes to provide adequate information to Public hospitals on better ways of
managing their inventory to achieve efficiency in their supply system. Supply chain
professionals and finance managers will find this study useful since it will educate
them on ways of mitigating inventory costs and improving efficiency in the delivery
of goods and services.
10
The findings of this study will be useful to the Ministry of Health since it will shed
more light on the inventory management challenges faced by Public hospitals. This
will enable the Ministry of Health and the County Governments to join hands in
concerted efforts in allocating more resources and facilities to enhance supply chain
performance and thus contribute to the achievement of quality health care services.
The study will be important since it will add knowledge in inventory management
discipline of procurement and supply chain management. Academicians and scholars
will also find this study useful in broadening their knowledge and skills in inventory
management.

11
CHAPTER TWO: LITERATURE REVIEW
2.1 Introduction
This section covers the inventory management models, inventory management
practices, the relationship between inventory management practices and performance
of public hospitals, challenges of implementing inventory management practices, the
conceptual framework and the summary of the literature review.
2.2 Theories of Inventory Management
According to Croom and Jones (2010) deterministic inventory model is one of the
fundamental techniques used by firms to develop inventory reserve estimates.
Deterministic models of inventory control are used to determine the optimal inventory
of a single item when demand is mostly largely obscure. Under this model inventory,
inventory is built up at a constant rate to meet a determined or accepted demand. Dai
and Kauffman (2001) argue that a deterministic circumstance is one in which the
system parameters can be ascertained precisely. This is also known as a situation of
sureness since it is realized that whatever is ascertained, things are sure to occur the
same way.
Beamon et al (2006) argue that stochastic one-item models can be used for inventory
control. Croom and Jones (2010) indicate that such models are used when demand is
not known. Stochastic models are more realistic and thus more relevant. This is
because they regard the cost of shortfalls, the cost of arranging and the cost of
stacking away, and attempt to formulate an optimal inventory plan. According to
Aberdeen Group (2004) the classical economic order quantity (EOQ) model seeks
to find the balance between ordering cost and carrying cost with a view of
obtaining the most economic quantity to procure by the distributor. Kotleba (2006)

12
contend that the economic order-quantity model considers the tradeoff between
ordering cost and storage cost in choosing the quantity to use in replenishing
inventories items. A larger order quantity reduces ordering frequency, and, hence
ordering cost per month this helps in mitigating costs but requires holding a larger
average inventory, which increases storage (holding) cost per month.
The relevance of this theory is that a smaller order-quantity reduces average inventory
but requires more frequent ordering and higher ordering cost per month. This is most
applicable to small firms that deal with perishable goods and services seeking to
mitigate inventory management costs. Dai et al. (2001) explain that the cost of
minimizing order-quantity is called the Economic Order Quantity (EOQ). Beamon et
al (2006) posit that one of the advantages often explored to cushion the burden of net
inventory cost and to enjoy substantial savings is the benefit from procuring large
enough quantity that reduces the unit price of the item. This results to reduction of
aggregate costs which enhances supply chain performance.
According to Palevich (2012) Radio frequency identification systems is used to
minimize the level of inventory. This enables the distributor to maintain stock making
the retailer secure. This improves delivery of goods and services to the final consumer
while minimizing holding stock to the firm. A lean system provides the organization
with a well-defined system to manage inventory effectively and efficiently. Fawcett et
al. (2008) notes that firms that use lean inventory management systems benefit from
improved productivity that allow employees to spend more time on value adding
activities. Lysons (2006) posit that marginal analysis is a technique used to control
the optimal levels of perishable goods whose value declines with time. Marginal
analysis is used by firms to allocate their scarce resources to maximize on their

13
output. For instance organizations ensure that perishable goods are sold within their
expiry period to prevent loss (Eckert, 2012). The periodic demand for the items is
uncertain. Too much supplies results in wastage while too little leads to shortages.
2.3 Inventory Management Practices
According to Zhang (2005) inventory management process begins as soon as the
organization has started production and ordered raw materials, semi-finished products
or any other thing from a supplier. The inventory management practices that have
been discussed in this study include: Economic Order Inventory, Radio Frequency
Identification Systems, Vendor Management Inventory System, Enterprise Resource
Planning, Just In Time, ABC Analysis and E-procurement. Other selective inventory
control techniques have also been discussed.
Gonzalez and Gonzalez (2010) posit that the economic order quantity (EOQ) is the
order quantity that minimizes total holding and ordering costs for the year. It gives a
good indication of whether or not current order quantities are reasonable. According
to Porteus (2008) the assumptions of inventory management model is that the firm
knows with certainty how much items of particular inventories will be used or
demanded for a specific period of time. Shapiro (2009) argues that the use of
inventories or sales made by the firm remains constant or unchanged throughout the
period. The model also assumes that the moment inventories reach zero level, the
order of replenishment of inventory is placed without delay.
According to Blanchard (2010) radio frequency identification system (RFIDS) is de
of identification where an item’s identification is taken in which the reading and
recoding of the data is executed using modern technology. This form of technology is
useful in minimization of costs for companies since this process is efficient compared
14
to manual process. This enhances integration of supply chain systems through
improved sharing of information leading to supply chain performance.
A vendor managed inventory system (VMIS) helps in minimizing the company’s
holding of stock and forces the distributor to maintain goods which in turn secures the
level of service of the retailer. Zer and Wei (2006) argue that vendor inventory
management can be described as supplier managed inventory or as continuous
replenishment.
According to Beamon et al (2006) the system is an initiative of partnering that
encourages co-operation and the sharing of information between partners in a
business. Davila et al., (2009) explain that bar coding is a type identification
employed by the technology of capturing information. Bar codes are used in tracking
items such as stock in retail, records, people and machines. Some control systems
used for inventories apply this technology in order to make stock tracking automatic
this improves on efficiency and thus supply chain performance.
Lambert (2011) puts forth that enterprise resources planning (ERP) system is part of
the integrated supply chain management system of an organization that integrates all
the supply chain partners. Watson and Zhang (2005) argue that an enterprise
resources planning package is a database allowing a company to develop data to be
used in all the applications. Such data base together with equipment for developing
and extracting can ensure effective information movement in the organization. This
improves decision making process since the supply chain partners can share
information. This minimizes communication costs in the supply chain leading to
supply chain performance (Song and Zipkin, 2011).

15
Mehra and Inman (2000) define just-in-time (JIT) as an operating concept designed to
eliminate waste Krajewski and Ritzman, 1999). The goal for just in time is to produce
goods and service without waste. This is achieved by testing each step in a process to
determine if it adds value to the product or to the service. The implementation of a JIT
system yields minimum inventories by having each part delivered when it is needed,
where it is needed, and in the quantity needed to produce the product. A JIT system
enables companies to operate efficiently with the least amount of resources, and thus,
improves quality, reduces inventory levels, and provides maximum motivation to
solve problems as soon as they occur.
ABC Analysis is an inventory control technique in which inventory items are
classified into three groups according to their value. Group A: High value items.
These are 15-20% of the items that account for 75% of the total inventory value.
Items in this category should be monitored regularly. Group B: Medium value items.
These are 30-40% of the items that account for approximately 15%of total value
(Croom and Jones, 2010).
Dai and Kauffman (2001) argues that Group B items should be given less attention.
Group C: Low value items, the 40-50%of the items that account 10-15% of the
annual inventory value. These items should receive least attention. Thus, ABC system
facilitates inventory control, over-usage, selective control and enables companies to
concentrate on the most cost-effective areas. In addition it eliminates unnecessary
paperwork and reduces stock holding costs.
Lysons (2006) define e-procurement as use of internet to operate transaction aspects
of requisitioning, authorizing orders, receiving and payment processes for goods and
services .It is typically a focus of local business administrators(business-to- business)

16
network system by which organizations can be connected to suppliers for purposes of
procuring goods and services at the lowest cost. In Kenya, the government has
implemented e-procurement through the Integrated Financial Information System
(IFMIS) a module configured to comply with the Public Procurement and Disposal
Act (2005) and the Kenya Communication Amendment Act (2009).This system
essentially replaces the offline version called tendering and will enhance order
monitoring, processing time, transparency, inventory reduction hence lower operating
costs.
Simulation is the process of imitating a real phenomenon with a set of mathematical
formulas and advanced computer programs. Simulation models enable a priori
managing and analyzing variety of possible results and implication of selected
inventory policies. A well-designed inventory control simulation should include data
based on the recommendations of front-line employees who know where losses occur
that might otherwise go unnoticed. A simulation model is easier to explain to
management personnel since it is a description of behavior of some system or process
(Davila et al., 2009).
2.4 Other Inventory Management Practices
Beamon et al (2006) indicate that High-Medium-Low value approach is one of the
inventory management models that check on costs of items. H-M-L this stands for
high value, medium value and low value items on unit price of item. For instance a
firm might decide to classify items that have a value of more than 5000 high, 1000-
5000 medium and below 1000 low. SDE stand for Scarce Difficult Easy analysis.
Under this model unit value is the basis of this analysis and not the annual
consumption value. To keep vigil on availability, inventory should be kept in stock
17
keeping in mind difficulty of procurement and may follow forward buying (Kotleba,
2006).
Dai et al (2001) notes that the stores when subjected to analysis based on their
criticality can be classified into Vital, Essential and Desirable stores. This analysis is
termed as VED analysis. Vital items without which treatment comes to standstill that
is non- availability cannot be tolerated. Under the essential items the organization
looks at non availability which can be tolerated for 2-3 days, because similar or
alternative items are available. In desirable items, non availability can be tolerated for
a long period. Fast Slow and Non-moving (FSN) analysis is based on rate of
consumption. Under this control model items can be classified into: fast moving, slow
moving, non-moving, and obsolete. An understanding of the movement of items helps
to keep proper levels of inventories by deciding a rational policy or reordering. This
method is based on the fact that some stock items have a much higher annual usage
value than others (Dai and Kauffman, 2001).
First-In, First-Out (FIFO) is one of the methods commonly used to calculate the value
of inventory on hand at the end of an accounting period and the cost of goods sold
during the period. This method assumes that inventory purchased first is sold first and
newer inventory remains unsold. Thus cost of older inventory is assigned to cost of
goods sold and that of newer inventory is assigned to ending inventory. The actual
flow of inventory may not exactly match the first-in, first-out pattern (Watson and
Zhang, 2005).
Silver (2007) indicate that stock-taking or inventory checking is the physical
verification of the quantities and condition of items held in an inventory or
warehouse. This may be done to provide an audit of existing stock valuation. It is also

18
the source of stock discrepancy information. Stock-taking may be performed as an
intensive annual check or may be done continuously by means of a cycle count. The
above is also referred to Periodic Count. Periodic counting is usually undertaken for
regular, inexpensive items. The term periodic generally refers to annual stock count.
However, periodic may also refer to half yearly, quarterly, monthly, bi-monthly or
daily.
Refrigeration is an inventory management practice that involves all the activities that
ensure maintenance of the refrigerator equipment by an organization. This activities
include: updating of the equipment, storage information on items stored in the
refrigerator by scanning radio frequency tags attached to the items whenever a door of
the refrigerator is opened, transmitting the storage information to a mobile terminal,
updating the storage information stored in the mobile terminal with the storage
information transmitted from the refrigerator, and displaying, comparatively, the
items of the updated storage information and items for the specific list set by a user or
registering the items included in the specific list but not in the updated storage
information as purchase information (Mehra and Inman, 2014).
Eckert (2012) argues that the standard operating procedures (SOPs) for inventory
control consists of a step-by-step process that is easy follow and understand by the
employees. These steps are inventory receiving, storage and product rotation and
warehouse and inventory security. These steps also serve to hold employees
accountable for adhering to inventory control policy expectations. Creating and
following an SOP is essential to managing inventory and controlling inventory costs.
Even small organizations should not underestimate the power of an inventory-control
SOP.

19
2.5 Performance Measurements
Supply Chain Performance can be measured in the context of the following supply
chain activities and processes: Plan, source, make and assemble, deliver and customer
satisfaction. These activities are considered at various levels of management-strategic,
tactical and operational levels. When seeking to improve organizational performance
it is advisable to conduct regular assessments of the current performance of the
organization. Assessments might be planned, systematic and explicit - these are often
the best kind of assessments - or unplanned and implicit. Well done assessments
typically use tools, such as comprehensive questionnaires, SWOT analyses and
diagnostic models. The profitability of a company influences its value and the amount
of income it generates for its owners (Kaplan and Norton, 2001).
2.6 Relationship between Inventory Management Practices and
Performance
Proper management of inventory enables the organization to mitigate its inventory
costs for example holding costs, stock out costs, lead time among others. Also, the
organization is able to improve on its delivery time leading to quick delivery of goods
and services. According to Water (2013) integration is one of the inventory
management tools used to achieve efficiency. In an integrated system, the
organization and the supplier can be able to share information. This helps the supplier
to know when the organization is out of stock. This improves supply chain
performance since the supplier is able to deliver goods and services on time.
To successfully manage inventory, top management and the employees should be
actively involved in key decisions on supply of goods and services (Drurry, 2011).
The organization should provide facilities and resources to manage inventory

20
management (Eckert, 2012).This will help the organization to improve on efficiency
and thus improve on supply chain performance Lapide (2010) established that most
organizations that invest in modern technologies for example: vendor managed
inventory, just in time systems and integration were efficient in their operations. It
was further revealed that there existed a positive relationship between integration and
supply chain performance.
A study by Schonberger (2008) on 50 manufacturing firms in America: found that
supplier partnering contributes to supply chain performance. This is because supplier
partnering improves on efficiency and minimizes inventory costs. Also, it reduces the
cycle time by reducing the lead time. Gonzalez and Gonzalez (2010) did an analysis of
an economic order quantity and re-order point inventory control model for service firms.
It was found that most organizations that had well managed inventory systems exhibited
efficient supply chain systems. This was as a result of use of modern technologies and
competent employees who had adequate skills and knowledge in inventory management.
Inventory management models have helped organizations to become more
competitive in terms of how they manage their inventories. The availability of
technologies has made it possible for firms to conduct businesses on a daily basis with
fewer inventories (Akintonye, 2014). Increased competitiveness in transportation has
led to greater opportunities for shippers to purchase high-quality as well as
customized services, thus reducing the need to carry large inventories. Lapide (2010)
posit that Overall sensitivity to the incurring of excess and non- value added cost has
motivated many firms to identify ways to reduce and even eliminate unnecessary
levels of inventory leading to improved supply chain performance.

21
2.7 Challenges of Implementing Inventory Management Practices
Implementation of inventory management practices is coupled by a myriad of
challenges especially by organizations in developing countries; Schonberger (2008)
found that inadequate resources for implementing inventory management practices is
major a problem to most firms. Companies fail to invest in inventory in technology
and infrastructure lack effective inventory management systems. The firm should put
proper infrastructure to maintain maximum and minimum levels of inventory. This
enables the firm to save holding costs, stock out costs and lead time costs.
Song and Zipkin (2011) explains that lack of commitment by the top management of
the organization is a major contributor to poor inventory management systems. In
most cases the management fails to provide the required support to their subjects for
effective implementation of inventory management practices for example the top
management might fail to involve its supply chain partners in inventory management
decisions. This brings about poor coordination, increased communication costs which
negatively impact on the supply chain performance of the organization. Shapiro
(2009) argues that if the management fails to provide facilities and resources required
to effective manage inventory in the organization.
According to Drurry (2011) some organizations especially in the developing
economies the top management is reluctant to invest in modern technologies and
equipment to facilitate inventory management this inhibits effective management of
stocks. This prolongs the cycle time and delay delivery of goods and services to the
final consumer and thus may negatively impact on supply chain performance. This
causes lack of cooperation between the suppliers and the organization which
eventually leads to delayed delivery of goods and services or no delivery in extreme

22
cases. To succeed in inventory management the organization should ensure that it has
reliable suppliers to supply goods and services on time.
Storing excess inventory can cost a lot of money, and reducing the amount of
inventory you keep on hand can reduce your carrying costs as well as the number of
warehouses they maintain, or even allow them to eliminate those warehouses
altogether. According to Dai and Kauffman (2001) lack of trained and competent
professionals who understand the concept of inventory management is a major
challenge to most organizations that seek to effectively manage their inventory
systems.
23
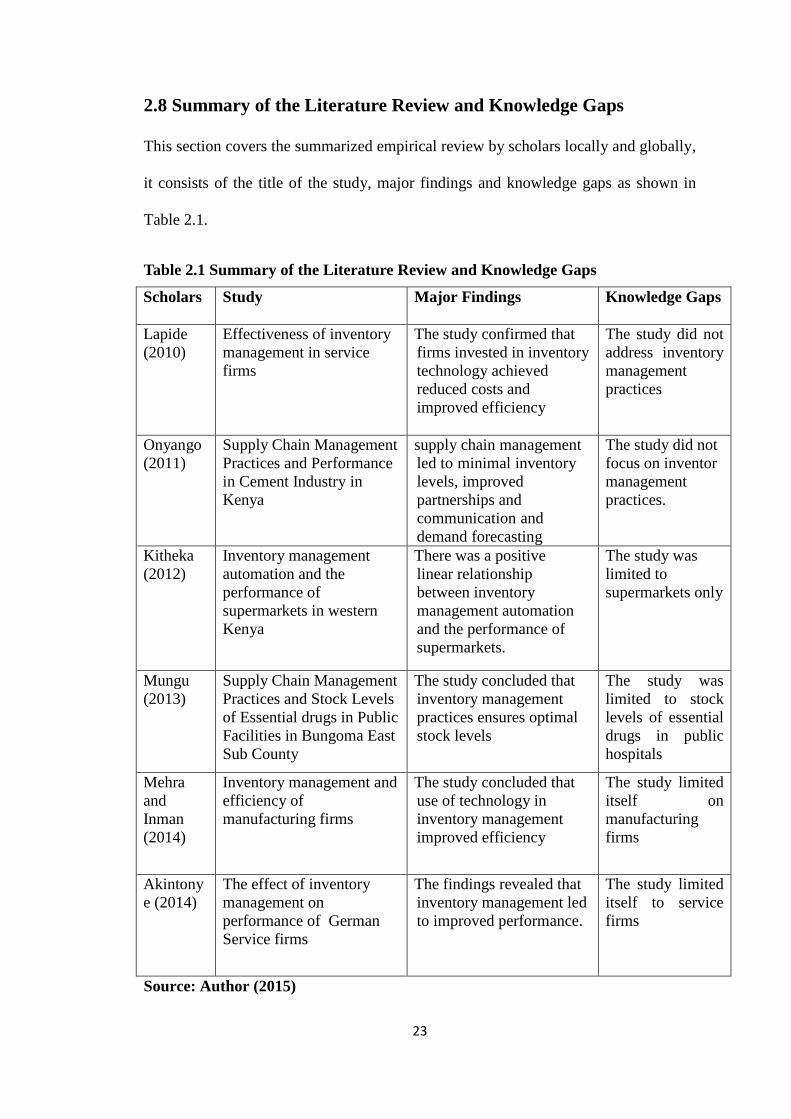
2.8 Summary of the Literature Review and Knowledge Gaps
This section covers the summarized empirical review by scholars locally and globally,
it consists of the title of the study, major findings and knowledge gaps as shown in
Table 2.1.
Table 2.1 Summary of the Literature Review and Knowledge Gaps
Scholars Study Major Findings Knowledge Gaps
Lapide
(2010)
Effectiveness of inventory
management in service
firms
The study confirmed that
firms invested in inventory
technology achieved
reduced costs and
improved efficiency
The study did not
address inventory
management
practices
Onyango
(2011)
Supply Chain Management
Practices and Performance
in Cement Industry in
Kenya
supply chain management
led to minimal inventory
levels, improved
partnerships and
communication and
demand forecasting
The study did not
focus on inventor
management
practices.
Kitheka
(2012)
Inventory management
automation and the
performance of
supermarkets in western
Kenya
There was a positive
linear relationship
between inventory
management automation
and the performance of
supermarkets.
The study was
limited to
supermarkets only
Mungu
(2013)
Supply Chain Management
Practices and Stock Levels
of Essential drugs in Public
Facilities in Bungoma East
Sub County
The study concluded that
inventory management
practices ensures optimal
stock levels
The study was
limited to stock
levels of essential
drugs in public
hospitals
Mehra
and
Inman
(2014)
Inventory management and
efficiency of
manufacturing firms
The study concluded that
use of technology in
inventory management
improved efficiency
The study limited
itself on
manufacturing
firms
Akintony
e (2014)
The effect of inventory
management on
performance of German
Service firms
The findings revealed that
inventory management led
to improved performance.
The study limited
itself to service
firms
Source: Author (2015)

24
2.9 Conceptual Framework
The conceptual framework adopted for this study shows that inventory management
practices influences performance of public hospitals. These practices include:
Economic order Quantity, Radio frequency identification system, vendor management
inventory, enterprise resource planning, Just in Time, ABC analysis and E-
procurement. The dependent variable is performance of public hospitals. Therefore,
the conceptual framework shows that performance at public hospitals depends on
inventory management practices used as presented in Figure 2.1
Figure 2.1 Independent and Dependent Variables
Independent Variables Dependent Variable
Source: Author (2015)
Radio Frequency
Identification System
Enterprise Resource
Planning
Just in Time
Vendor Managed Inventory
System
Performance of Public
Hospitals
Availability of Drugs and
Infrastructural facilities
Timely Delivery
Cost Reduction
Reduced Lead Time
Supplier reliability
Reduced Stock Out Costs
Reduction of Waste
Economic Order Quantity
ABC Analysis
E-Procurement

25
CHAPTER THREE: RESEARCH METHODOLOGY
3.1 Introduction
This section gives an outline of the research methodology that was used for the study.
It comprises the research design, study population, data collection instruments, and
data collection procedure and data analysis.
3.2 Research Design
The study used a descriptive survey. A descriptive survey is used in explaining the
relationship between variables in a study. It was applied in laying more emphasis in
determining the frequency with which the variables are implemented or the extent to
which the variables co-vary (Kothari, 2004). Descriptive survey was used in
establishing the relationship between inventory management practices and supply
chain performance.
3.3 Study Population
The population for this study comprised of the main public hospitals (See Appendix II
- E-Health Kenya Facilities, 2014). The study considered 40 hospitals where
inventory management was mostly carried out. The study used a census survey of
public hospitals (levels 4, 5 and 6) in Nairobi and former Central Province counties.
These hospitals formed a representative sample.
3.4 Data Collection
The study used primary data that was collected through a semi-structured
questionnaire to collect information for quantitative and qualitative analysis. The
structured questionnaires had four sections. The first section covered questions about
general information about the organization and the respondents. The second section
had questions on the first objective of this study which is to establish inventory

26
management practices used by public hospitals. The third part contained questions on
the second objective of the study which is to determine the relationship between
inventory management practices and performance of public hospitals. The fourth part
contained questions on the third objective of the study which is to determine the
challenges of implementing inventory management practices by public hospitals. The
respondents for the study were senior procurement officers or their equivalents. This
group of respondents was selected because they have relevant experience in inventory
management concept and how it impacts on performance of public hospitals. The
semi-structured questionnaires were administered through a “drop and pick” later
method at an agreed time with the researcher.
3.5 Data Analysis
Objective one which is to establish the inventory management practices used by
public hospitals in was analyzed using descriptive statistics. Objective two of the
study which is to determine the relationship between inventory management practices
and performance of public hospitals was analyzed using regression analysis and
objective three which is to determine the challenges faced by public hospitals in
implementing inventory management practices were analyzed using descriptive
statistics.
The regression model was used for determining the relationship between inventory
management practices and performance of public hospitals. The regression model
consisted of seven variables: The independent variables: inventory management
practices (Economic Order Quantity, Radio Frequency Identification System, Vendor
Management Inventory, Enterprise Resource Planning, Just In Time, ABC Analysis

27
and E-procurement) and the dependent variable (performance of public hospitals) as
provided in the model below:
Y=a + b1 X1 +b2 X2 + b3 X3 + b4 X4 + b5 X5 +b6 X6+ b7 X7 +e
Where:
Y = Supply Chain Performance
A = Y intercept when x is zero
b1, b2, b4 and b4 = Regression weights attached to the variables
X1…Xn = Coefficients
X1 = Economic Order Quantity
X2 = Radio Frequency Identification System
X3 = Vendor Management Inventory
X4 = Enterprise Resource Planning
X5 = Just In Time
X6 = ABC Analysis
X7 = E-procurement
€ = Error
The table below gives a summary of how data collected was analyzed as per the
objectives of the study.
Table 3.1 Summary of Data Collection and Analysis
Objectives Questionnaire Data Analysis
Objective 1 Section B Descriptive Statistics
Objective 2 Section C Regression Analysis
Objective 3 Section D Descriptive Statistics
28
CHAPTER FOUR: DATA ANALYSIS, RESULTS AND
INTERPRETATION
4.1 Introduction
This chapter consists of the analyzed data and the findings that were obtained from
the primary data which was collected using a semi-structured questionnaire. Data
analysis was done in line with the objectives of the study which were: to determine
the inventory management practices used by public hospitals in Kenya, to establish
the relationship between inventory management practices and performance of Public
hospitals in Kenya and the challenges of implementing inventory management
practices in Public hospitals in Kenya.
4.2 Response Rate
Out of the 40 questionnaires that were distributed 35 questionnaires were filled and
returned successfully. This represents a response rate of 88 percent which was
considered sufficient for making generalization of all the public hospitals in Kenya.
This response is consistent with the response rate that was obtained by Waithaka
(2012) who concluded that a response rate of 87 percent of a sample is sufficient in
making generalization for the whole population. According to Mugenda and Mugenda
(1999) this represents response rate of 50% is adequate for analysis and reporting; a
rate of 60% is good and a response rate of 70% and over is excellent. Based on the
assertion, the response rate was considered to be sufficient.
4.3 General Information
This section provides the demographic information of the respondents and the
organization. This information is important in evaluating whether the respondents are
qualified to give reliable information in line with the objectives of this study.
29
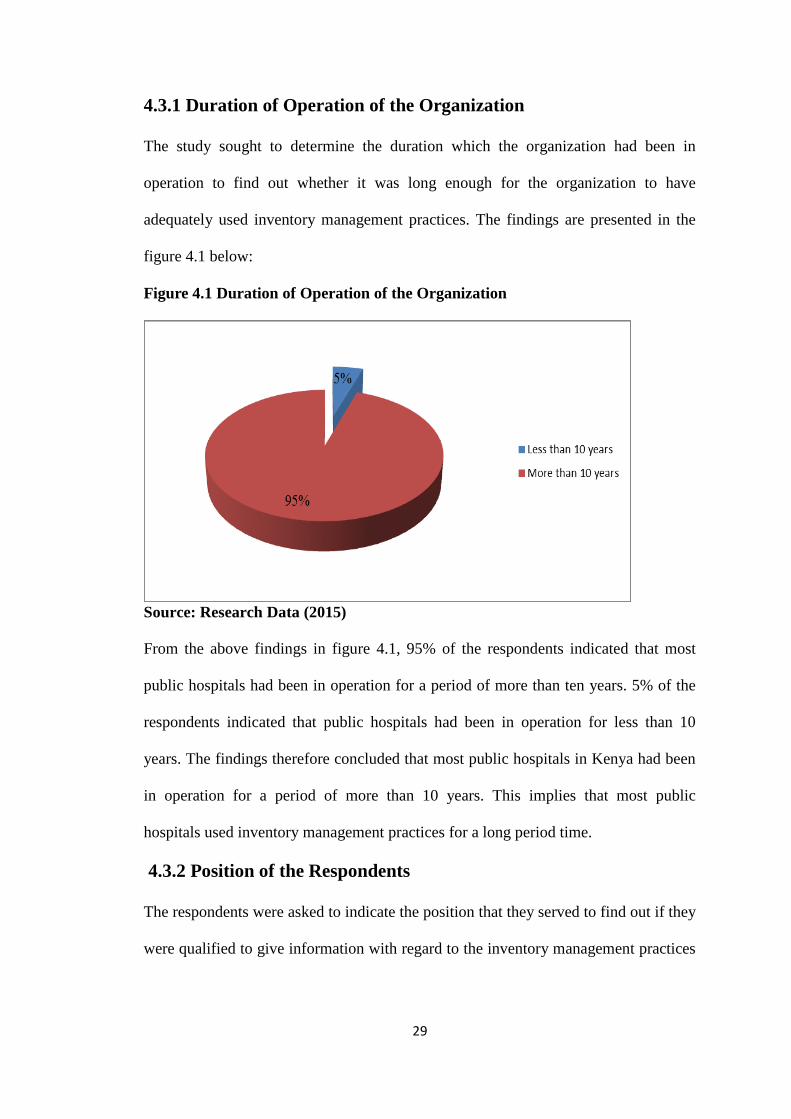
4.3.1 Duration of Operation of the Organization
The study sought to determine the duration which the organization had been in
operation to find out whether it was long enough for the organization to have
adequately used inventory management practices. The findings are presented in the
figure 4.1 below:
Figure 4.1 Duration of Operation of the Organization
Source: Research Data (2015)
From the above findings in figure 4.1, 95% of the respondents indicated that most
public hospitals had been in operation for a period of more than ten years. 5% of the
respondents indicated that public hospitals had been in operation for less than 10
years. The findings therefore concluded that most public hospitals in Kenya had been
in operation for a period of more than 10 years. This implies that most public
hospitals used inventory management practices for a long period time.
4.3.2 Position of the Respondents
The respondents were asked to indicate the position that they served to find out if they
were qualified to give information with regard to the inventory management practices

30
and performance of Public Hospitals. The findings are presented in the figure 4.2
below:
Figure 4.2 Positions of the Respondents
Source: Research Data (2015)
From the above findings in figure 4.2 above, 57% of the respondents indicated that
they served as supply chain management assistant, 20% of the respondents served as
senior supply chain management while 17% of the respondents served as Chief supply
chain management officer. Only 6% of the respondents indicated that they served as
health administrative officers and accountants. The findings therefore conclude that
most of the respondents working for public hospitals had a relevant experience.
4.3.3 Length of Service
The respondents were asked to indicate the period that they had served in the
organization. This was intended to determine whether the respondents had a relevant
working experience in the field of inventory management practices. The findings are
presented in the figure 4.3 below:

31
Figure 4.3 Length of Service
Source: Research Data (2015)
From the above findings in the figure 4.3 above, it was found that 72% of the
respondents worked for a period between 5-20 years, 17% of the respondents worked
for a period above 20 years while 11% of the respondents worked for a period of less
than 5 years. It was concluded that most of the respondents who responded had a
relevant experience in inventory management practices in public hospitals in Kenya.
4.3.4 Level of Education
The respondents were asked to indicate their level of education to determine whether
they understood inventory management practices and how these practices contributed
to performance of Public Hospitals. The findings are presented in the figure 4.4
below:

32
Figure 4.4 Level of Education
Source: Research Data (2015)
From the findings in figure 4.4, 40% of the respondents had diplomas, 30% of the
respondents were holders of first degree, 15% of the respondents attained masters
degrees while 10% of the respondents had certificates. This is an indication that most
of the respondents understood inventory management practices and performance in
public hospitals in Kenya.
4.4 Inventory Management practices
The study sought to determine the first objective of this study which was to determine
the inventory management practices implemented in public hospitals in Kenya. The
findings are presented in the table 4.4 below:
4.4.1 Economic Order Quantity
The respondents were asked to indicate the extent to which EOQ was used in public
hospitals in Kenya. The findings are presented in the table 4.1 below:
33
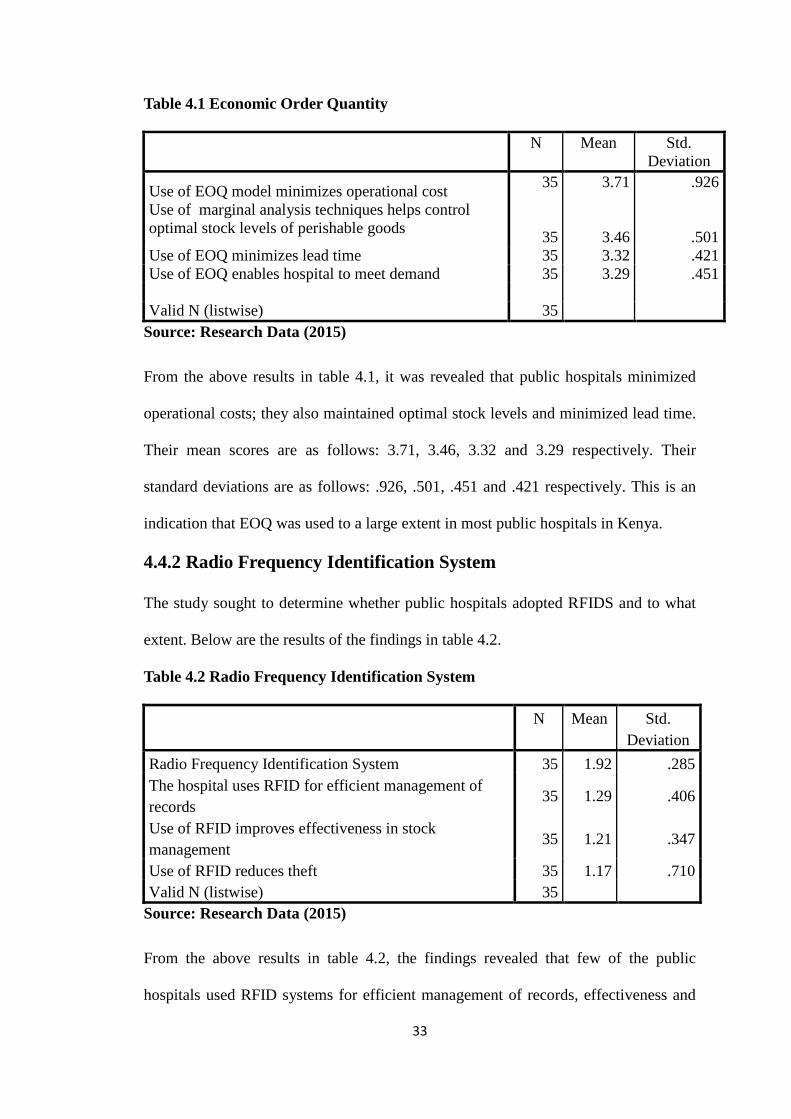
Table 4.1 Economic Order Quantity
N Mean Std.
Deviation
Use of EOQ model minimizes operational cost
Use of marginal analysis techniques helps control
optimal stock levels of perishable goods
35
35
3.71
3.46
.926
.501 Use of EOQ minimizes lead time 35 3.32 .421 Use of EOQ enables hospital to meet demand 35 3.29 .451
Valid N (listwise) 35
Source: Research Data (2015)
From the above results in table 4.1, it was revealed that public hospitals minimized
operational costs; they also maintained optimal stock levels and minimized lead time.
Their mean scores are as follows: 3.71, 3.46, 3.32 and 3.29 respectively. Their
standard deviations are as follows: .926, .501, .451 and .421 respectively. This is an
indication that EOQ was used to a large extent in most public hospitals in Kenya.
4.4.2 Radio Frequency Identification System
The study sought to determine whether public hospitals adopted RFIDS and to what
extent. Below are the results of the findings in table 4.2.
Table 4.2 Radio Frequency Identification System
N Mean Std.
Deviation
Radio Frequency Identification System 35 1.92 .285
The hospital uses RFID for efficient management of
records 35 1.29 .406
Use of RFID improves effectiveness in stock
management 35 1.21 .347
Use of RFID reduces theft 35 1.17 .710
Valid N (listwise) 35
Source: Research Data (2015)
From the above results in table 4.2, the findings revealed that few of the public
hospitals used RFID systems for efficient management of records, effectiveness and

34
to minimize theft. Their mean scores were as follows: 1.92, 1.29, 1.21 and 1.17
respectively. Their standard deviations were as follows: .285, .406, .347 and .710
respectively. This is an indication that most public hospitals implement RFID systems
to a very small extent in managing their inventory.
4.4.3 Vendor Managed Inventory System
The study sought to determine whether public hospitals adopted VMIS and to what
extent. Below are the results of the findings in table 4.3
Table 4.3 Vendor Managed Inventory System
N Mean Std.
Deviatio
n
The hospital uses VMIS for reduction of stock out costs 35 2.46 .532
The hospital uses VMIS for improved speed to tracking stock
items 35 2.43 .502
Use of VMIS reduces stock holding costs 35 2.42 .621
Use of VMIS has reduced the risk of defective and
obsolescence of items 35 2.42 .505
Use of VMIS has enhanced supplier relations partnership 35 2.29 .458
Valid N (listwise) 35
Source: Research Data (2015)
From the above findings in table 4.3, few public hospitals adopted VMIS for stock
reduction, improved speed of tracking stock items, reduction of holding stock and
reduction of defective and obsolescence items and enhanced supplier relations
partnership. Their mean values are as follows: 2.46, 2.43, 2.42, 2.42 and 2.29
respectively. Their standard deviations are as follows: .532, .502, .621, .505 and .458
respectively. This is an indication that most public hospitals used VMIS to a very
small extent in their inventory management.

35
4.4.4 Enterprise Resource Planning
The study sought to determine whether public hospitals adopted ERP and to what
extent. Below are the results of the findings in table 4.4
Table 4.4 Enterprise Resource Planning
N Mean Std.
Deviation
The hospital uses Enterprise Resource Planning system 35 4.10 .832
The hospital has an integrated information sharing system 35 3.63 .512 The hospital maintains a database for all its suppliers 35 3.52 .611
Valid N (listwise) 35
Source: Research Data (2015)
From the above results in table 4.4, the study found that most public hospitals used
ERP systems; they also practiced integration and maintained a database for their
suppliers. The mean scores are as follows: 4.10, 3.63 and 3.52 respectively. Their
standard deviations are as follows: .832, .512 and .611 respectively. This implies that
most public hospitals in Nairobi County and former Central Province Counties used
ERP systems to a large extent in their inventory management.
4.4.5 Just in Time
The study sought to determine whether public hospitals adopted just in time and to
what extent. Below are the results of the findings in table 4.5
Table 4.5 Just in Time
N Mean Std.
Deviation
The hospital uses JIT stock control system 35 2.38 .432
The hospital uses the JIT system to eliminate waste 35 2.19 .512
Valid N (listwise) 35
Source: Research Data (2015)
36
From the above results in table 4.5, the study found that most public hospitals in
Nairobi County and former Central Province Counties did not implement JIT stock
control systems. Further, it was found that few public hospitals used JIT systems to
eliminate their waste. The mean scores are as follows: 2.38 and 2.19 respectively.
Their standard deviations are as follows: .432 and .512 respectively. This is an
indication that most public hospitals in Nairobi County and former Central Province
Counties used JIT to a very small extent in inventory management.
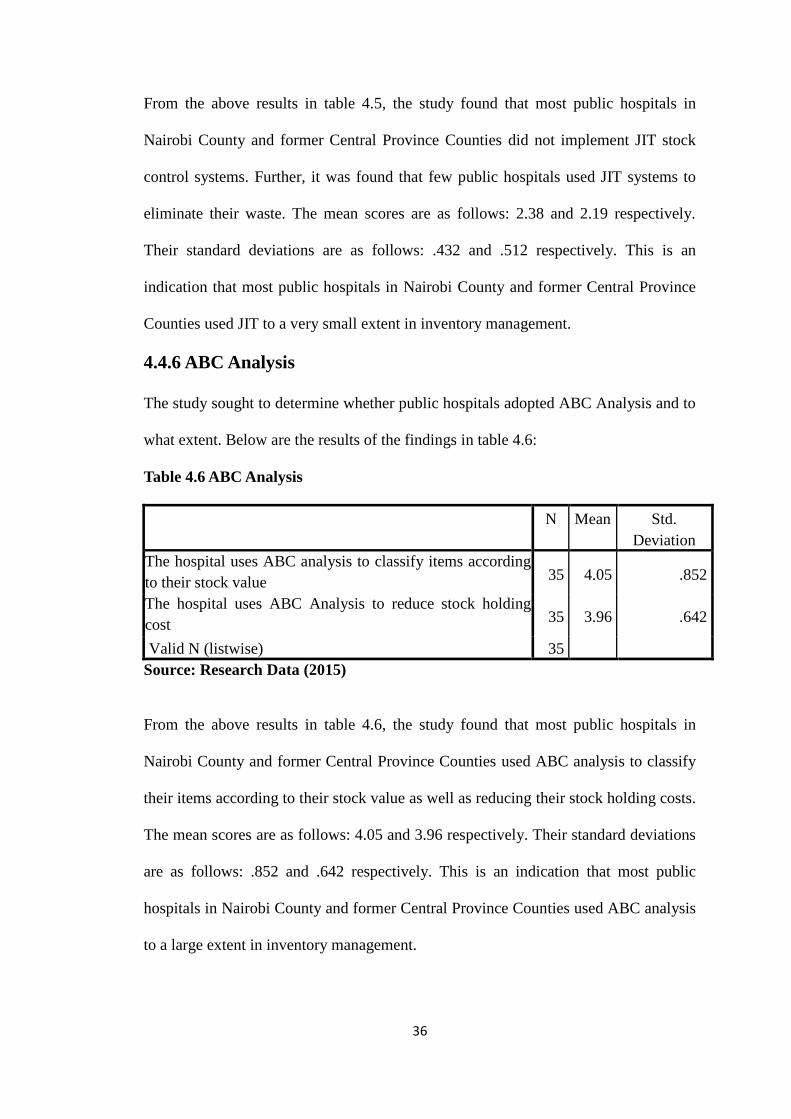
4.4.6 ABC Analysis
The study sought to determine whether public hospitals adopted ABC Analysis and to
what extent. Below are the results of the findings in table 4.6:
Table 4.6 ABC Analysis
N Mean Std.
Deviation
The hospital uses ABC analysis to classify items according
to their stock value 35 4.05 .852
The hospital uses ABC Analysis to reduce stock holding
cost 35 3.96 .642
Valid N (listwise) 35
Source: Research Data (2015)
From the above results in table 4.6, the study found that most public hospitals in
Nairobi County and former Central Province Counties used ABC analysis to classify
their items according to their stock value as well as reducing their stock holding costs.
The mean scores are as follows: 4.05 and 3.96 respectively. Their standard deviations
are as follows: .852 and .642 respectively. This is an indication that most public
hospitals in Nairobi County and former Central Province Counties used ABC analysis
to a large extent in inventory management.
37
4.4.7 E-procurement
The study sought to determine whether public hospitals adopted e-procurement and to
what extent. Below are the results of the findings in table 4.7:
Table 4.7 E-procurement
N Mean Std. Deviation
The hospital comply with e-procurement systems (IFMIS
module) 35 3.76 .595
There is improved connectivity with a wide range of suppliers 35 3.68 .698
Valid N (listwise) 35
Source: Research Data (2015)
From the above analysis in table 4.7, it was found that public hospitals complied with
e-procurement systems to a moderate extent. Further, public hospitals used e-
procurement for improved connectivity with their suppliers. Their mean scores are as
follows: 3.76 and 3.68 respectively. Their standard deviations are as follows: .595 and
.698 respectively. This is an indication that most public hospitals in Nairobi County
and former Central Province Counties used e-procurement to a moderate extent in
managing their inventory.
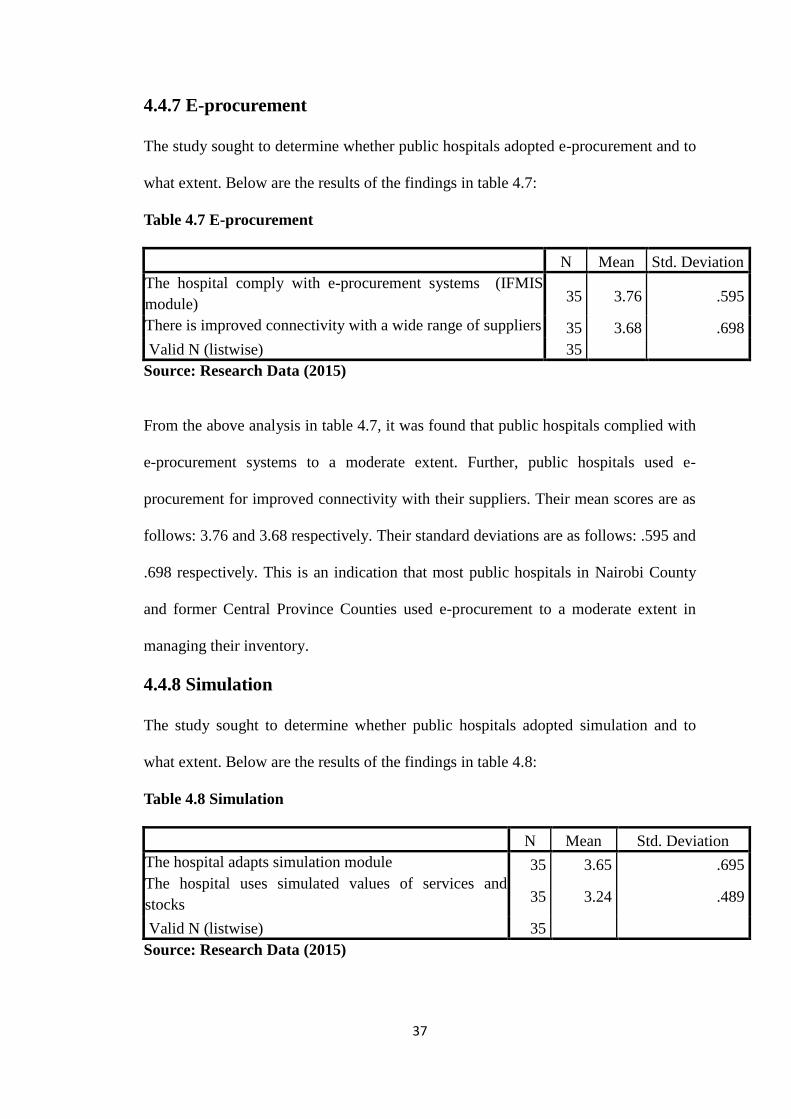
4.4.8 Simulation
The study sought to determine whether public hospitals adopted simulation and to
what extent. Below are the results of the findings in table 4.8:
Table 4.8 Simulation
N Mean Std. Deviation
The hospital adapts simulation module 35 3.65 .695
The hospital uses simulated values of services and
stocks 35 3.24 .489
Valid N (listwise) 35
Source: Research Data (2015)

38
From the above analysis in table 4.8, it was found that public hospitals used
simulation model to a moderate extent. A good number of public hospitals used
simulated values of services and stocks. Their mean scores are as follows: 3.65 and
3.24 respectively. Their standard deviations are as follows: .695 and .489 respectively.
This is an indication that most public hospitals in Nairobi County and former Central
Province Counties implemented simulation to a moderate extent in inventory
management.
4.4.8 Summary of Inventory Management Practices used by Public
Hospitals in Nairobi County and former Central Province
Counties
This section gives a summary of the various rankings of inventory management
practices based on their implementation by Public Hospitals in Nairobi County and
former Central Province Counties. Below are the results of the findings in table 4.9.
Table 4.9 Summary of Inventory Management Practices used by Public Hospitals
in Nairobi County and former Central Province Counties
Ranking Inventory management Practices Mean
1 ERP systems 3.75 2 ABC 3.72
3 E-procurement 3.69 4 Simulation 3.55
5 EOQ 3.48 6 VMIS 2.34
6 JIT systems 2.21
7 RFID 1.62
Source: Research Data (2015)
From the results in table 4.9, it was revealed that the most popular inventory
management practices used by public hospitals in Nairobi County and former Central
Province Counties are as follows: ERP systems, ABC systems, e-procurement and
simulation. These inventory practices were implemented to a moderate extent. There
average scores are as follows: 3.75, 3.72, 3.69 and 3.55 respectively. These findings

39
are consistent with Onyango (2011) who pointed out that ERP and e-procurement
systems were largely used in most cement manufacturing firms in Kenya.
Further, Akintonye (2014) indicated that e-procurement was highly implemented in
German services firms. VMIS, JIT systems and RFID systems were least
implemented in public hospitals in Nairobi County and former Central Province
Counties. The average scores are as follows: 2.34, 2.12 and 1.62. These findings are
in line with a study by Kitheka (2012) who indicated that RFID and JIT systems were
least implemented in public hospitals in Nairobi County.
4.5 Inventory Management Practices and Performance of Public
Hospitals in Kenya
To achieve the second objective of the study which was to establish the relationship
between inventory management practices and performance of public hospitals in
Kenya, a regression analysis was conducted. Below are the results presented in the
tables.
4.5.1 Model Coefficients
The table below summarizes the results of the regression equation. The values in
column B represent the extent to which the value of independent variables contributes
to the value of the dependent variable. The other column shows the level of
significance of the study variables. Below are the results in the table 4.10 below:

40
Table 4.10 Model Coefficients
Coefficientsa
Model Unstandardized
Coefficients
Standardized
Coefficients
t Sig.
B Std. Error Beta
1
(Constant) .701 .490 1.323 .134
EOQ (X1 .133 .277 -.161 -.429 .621
RFID (X2) -.562 .187 .762 4.471 .000
VMIS (X3) .152 .049 -.617 -3.154 .001
ERP (X4) .035 .089 .043 .310 .771
JIT(X5) -.105 .050 -.061 -.082 .825
ABC(X6) .101 .054 .206 1.792 .043
E-procurement(X7) -.420 .059 -.041 -.371 .714
Source: Research Data (2015)
a. Dependent Variable: Cost reduction
The regression model obtained for this study is as follows;
Y= .701+.133X1 -.562X2+.152X3 +.035X4 -.105X5 +.101X6 -.420X7
The model was subjected to statistical significant tests to establish the reliability or
adequacy of the model for estimation purposes.
The regression model obtained shows that there is a positive relationship between
EOQ, VMIS, ERP and ABC with supply chain performance of public hospitals in
Nairobi County. This implies that holding all other factors constant a unit increase in
one of the variables obtained in the regression model results into a corresponding
increase in supply chain performance of public hospitals in Nairobi County.
RFID, JIT and E-procurement show a negative relationship with supply chain
performance. This contradicts the hypothesis of this study which predicts a positive
relationship between inventory management practices and performance of public
hospitals in Nairobi County and former Central Province Counties

41
Significance Testing
The above analysis was conducted at 5% significance level. The criteria for
comparing whether the predictor variables were significant in the model was done by
comparing the corresponding probability value obtained; α=0.05. If the probability
value is less than α, then the predictor variable is significant. The regression results
observe that RFID, VMIS and ABC are statistically not significant since their
probability values obtained from the regression model above are below 0.05 (5%).,
P=0.000, p=0.001, P=.043 respectively. On the other hand, EOQ, ERP, JIT and E-
procurement are statistically insignificant since their p-values are more than 5%,
p=.621, p=.771, p=.825 and p=.714 respectively. These results are consistent with
high t values for significant variables and low t values for variables which are not
significant.
4.5.2 Coefficient of Determination R2
The model summary illustrates the variation in the value of the dependent variable
which is explained by the regression model. The results are provided in the table 4.11
below:
Table 4.11 Model Summary
Model R R
Square
Adjusted R
Square
Std. Error of the Estimate
1 .765a .585 .352 1.4212
Source: Research data, (2015)
From this table R2 = 0.585 i.e. 58.5 % variation in the performance of public hospitals
is explained by predictors in the model. However 41.5% variation in performance of
public hospitals is due to other factors not in the regression model. From this test
result, the model is satisfactory and can be used for estimation purposes.

42
4.5.3 F-Test for the Full Model
The study conducted analysis of variance (ANOVA) to determine the significance of
the relationship among the variables in the regression model. The results are provided
in table 4.12.
Table 4.12 Analysis of Variance
Model Sum of Squares df Mean Square F Sig.
1
Regression 3.544 7 .506 3.329 .000b
Residual 4.415 29 .152
Total 7.959 34
Source: Research data, (2015)
The numerator for whose degrees of freedom (df) =7, denominator df =29
and critical F value is 2.045. The above findings show computed F value is 3.329.
From these findings, the regression model is significant since the computed F-value
exceeds the critical value that is 3.329 > 2.045. This is collaborated by the P value =
0.000 which is less than 5%. This implies that all the independent variables
considered together provide a significant level of explanation of the relationship
between inventory management practices and performance of Public hospitals in
Nairobi County and former Central Province Counties. This implies that 95% chance
that the relationship among the variables is not due to chance. These findings are
consistent with a study by Kitheka (2012) whose regression results concluded that
there was a statistically significant relationship between inventory management
automation and performance of supermarkets in Kenya.

43
4.5.4 Challenges of Inventory Management Practices
As a final objective, the researcher sought to determine the challenges faced by public
hospitals in the implementation of inventory management practices. The results are
presented in the table 4.13 below:
Table 4.13 Challenges of Implementing Inventory Management Practices
N Mean Std. Deviation
Failure to invest in modern technologies. 35
35 4.42 .615
Insufficient funding by government 35 4.34 .781
Poor infrastructure 35 3.76 .668
Lack of proper training 35 3.50 .631
Incompetent staff 35 3.35 .542
Unreliable suppliers 35 3.41 .548
Lack of commitment by top management 35 3.31 .642
Lack of proper training 35 2.86 .744
Source: Research data, (2015)
From the above findings in table 4.13, the respondents indicated that the main
challenges facing public hospitals in the implementation of inventory management
practices were as follows: lack of adequate finances to invest in modern technologies,
insufficient funding by the government, poor infrastructure, lack of proper training
and incompetent staff. The mean scores are as follows: 4.4.2, 4.34, 3.76 and 3.50
respectively. Their standard deviations are as follows: .615, .781, .668 and .631
respectively. These findings are line with Schonberger (2008) who indicated
inadequate resources for implementing inventory management practices is major a
problem to most firms. Companies fail to invest in inventory in technology and
infrastructure lack effective inventory management systems.
Other challenges included unreliable suppliers, lack of commitment by the top
management and lack of proper training. Their mean scores are as follows: 3.41, 3.31

44
and 2.86 respectively. Their standard deviation scores are as follows: .548, .642 and
.744. These findings collaborate with a study by Song and Zipkin (2011) who
explains that lack of commitment by the top management of the organization is a
major contributor to poor inventory management systems.
4.6 Chapter Summary and Discussion
The most popular inventory management practices used by public hospitals in Nairobi
County are as follows: ERP systems, ABC systems, e-procurement and simulation.
These inventory practices were implemented to a moderate extent. These findings are
consistent with Onyango (2011) who pointed out that ERP and e-procurement systems
were largely used in most cement manufacturing firms in Kenya. Further, Akintonye
(2014) indicated that e-procurement was highly implemented in German services
firms. VMIS, JIT systems and RFID systems were least implemented in public
hospitals in Nairobi County and former Central Province Counties. These findings are
in line with a study by Kitheka (2012) who indicated that RFID and JIT systems were
least implemented in public hospitals in Nairobi County and former Central Province
Counties.
The regression results indicated that RFID, VMIS and ABC are statistically
significant since their probability values obtained from the regression model above
are below 0.05 (5%). On the contrary, EOQ, ERP, ABC, JIT and E-procurement are
statistically insignificant since their p-values are more than 5%. These findings are
consistent with Kitheka (2012) who indicated that RFID systems were statistically
significant in explaining the relationship between inventory management and
performance of supermarkets in Kenya. The regression model is statistically
significant since .000<5% this implies that all the independent variables considered
45
together provide a good level of explanation of the relationship between inventory
management practices and performance of Public hospitals in Nairobi County and
former Central Province Counties. These findings are consistent with a study by
Kitheka (2012) whose regression results concluded that there was a statistically
significant relationship between inventory management automation and performance
of supermarkets in Kenya.
The main challenges facing public hospitals in the implementation of inventory
management practices were as follows: lack of adequate finances to invest in modern
technologies, insufficient funding by the government, poor infrastructure, lack of
proper training and incompetent staff. These findings are line with Schonberger
(2008) who indicated inadequate resources for implementing inventory management
practices is major a problem to most firms. Companies fail to invest in inventory in
technology and infrastructure lack effective inventory management systems. Other
challenges included unreliable suppliers, lack of commitment by the top management
and lack of proper training. Their mean scores are as follows: 3.41, 3.31 and 2.86
respectively. Their standard deviation scores are as follows: .548, .642 and .744.
These findings collaborate with a study by Song and Zipkin (2011) who explains that
lack of commitment by the top management of the organization is a major contributor
to poor inventory management systems.

46
CHAPTER FIVE: SUMMARY, CONCLUSION AND
RECOMMENDATIONS
5.1 Introduction
This chapter covers a comprehensive review of the major findings that were drawn
from chapter four. These findings were intended to answer the following questions:
what are the inventory management practices used by public hospitals in Kenya, what
is the relationship between inventory management practices and performance of
Public hospitals in Kenya and what are the challenges of implementing inventory
management practices in Public hospitals in Kenya. The chapter is structured as
follows: Summary, conclusion, recommendations, limitations of the study and
suggestions for further research.
5.2 Summary
The most popular inventory management practices used by public hospitals in Nairobi
County and former Central Province Counties are as follows: ERP systems, ABC
systems, e-procurement and simulation. These inventory practices were implemented
to a moderate extent. There average scores are as follows: 3.75, 3.72, 3.69 and 3.55
respectively. VMIS, JIT systems and RFID systems were least implemented in public
hospitals in Nairobi County. The average scores are as follows: 2.34, 2.12 and 1.62.
The findings further revealed that 58.5 % variation in the performance of public
hospitals was explained by predictors in the model. The regression model was found
to be statistically significant since .000<.005 which implied that all the independent
adequately explained the relationship between inventory management practices and
performance of Public hospitals in Nairobi County. Further, it was observed that
RFID, VMIS and ABC were statistically significant since their probability values

47
obtained from the regression model were below 0.05 (5%). P=0.000, p=0.001, P=.043
respectively. On the other hand, EOQ, ERP, ABC, JIT and E-procurement were
statistically insignificant since their p-values are more than 5%, p=.621, p=.771,
p=.825, p=.053 and p=.714 respectively.
The main challenges facing public hospitals in the implementation of inventory
management practices were as follows: lack of adequate finances to invest in modern
technologies, insufficient funding by the government, poor infrastructure, lack of
proper training and incompetent staff. The mean scores were as follows: 4.4.2, 4.34,
3.76 and 3.50 respectively. Their standard deviations were as follows: .615, .781, .668
and .631 respectively. These findings are line with Schonberger (2008) who indicated
inadequate resources for implementing inventory management practices is major a
problem to most firms. Companies fail to invest in inventory in technology and
infrastructure lack effective inventory management systems.
5.3 Conclusion
The study concludes that the most popular inventory management practices used by
public hospitals in Nairobi and former central province counties are follows: ERP
systems, ABC systems, e-procurement, simulation and EOQ. These practices were
mainly used in level 5, level 6 and stand-alone which offers specialized services and
operates under defined semi-autonomy which allows them to manage their own
inventory. The study further concludes that RFID, VMIS and JIT were used to a very
small extent in sub-district hospitals like level 4 at the location and divisional level.
This is because of poor infrastructure to support modern technologies.
Further, the study concludes that the main challenges that hindered implementation of
inventory management practices in public hospitals were: failure to invest in modern

48
technologies, insufficient funding, poor infrastructure, lack of top management
commitment training and unreliable suppliers. Other challenges faced by the
procurement officers were lengthy bureaucratic processes in the procurement system,
interference of supply chain process from other professionals and finally poor relation
between the national and county governments. These challenges are as result of poor
implementation of government policies and failure to allocate adequate funds.
5.4 Recommendations from this Study
The study recommends that Government of Kenya allocates more funds to public
hospitals to invest in modern information technologies such as enterprise resource
planning systems that will provide an integrated organization wide health information
system in a bid to increase information sharing, reduce costs and ultimately improve
the delivery of quality of health care services. Through regular audits in all its public
hospitals, the Government of Kenya can ensure that all the health facilities increase
their capacity and access to health care services. On the other hand, the government
should also train procurement officers and suppliers on procurement services inorder
to eradicate corruption.
The Ministry of Health should ensure that all public hospitals are in good condition
through regular and structured maintenance and servicing. This will ensure that the
hospitals and their facilities are in a good working condition which will ultimately
improve the quality of health care services they offer. The Government of Kenya
should invest more on the infrastructure that is the road and the communication
network in remote locations to enhance access and prompt health care services which
will minimize referrals and deaths.
49
Finally, the study recommends that the Government of Kenya builds the capacity of
existing supply chain staff and or hire a team of competent supply chain management
staff who are to effectively manage hospital inventory systems. This will cut costs,
reduce wastage and ultimately improve the effectiveness of public hospitals in Kenya.
5.5 Limitations of the Study
The government is known to work under strict confidentiality to prevent unauthorized
access to information by third parties. It was challenging to convince the respondents
to give information even after presenting the letter of authorization to collect data
from the University of Nairobi. Most of the respondents agreed to fill the
questionnaires on condition that that information would not be disclosed to third
parties rather it would be used for academic purposes only.
The study was limited to district hospitals in Nairobi and former Central province
Counties due to costs and time constraints. It would have been important for future
researchers to consider investigating inventory management practices in public
hospitals outside Nairobi County to find out whether these findings will hold. The
researcher did not have any control over the filling process of the questionnaires.
Some of the respondents refused to fill the questionnaires while others did not
complete filling the questionnaires even after making follow-ups. This negatively
affected the accuracy and completeness of the findings that have been in this study.
The other challenge that was faced by the researcher was that some of the respondents
especially the head of supply chain delegated filling and completion of the
questionnaires to their juniors who do not have similar experience and qualifications
as compared to their managers. This might have affected the accuracy and findings
thereof obtained in this study. The facilities from which data was collected were far
50
apart so the researcher had to cover long distances, poor infrastructure
notwithstanding, which was not easy especially where numerous follow ups were
required. The researcher had to create additional time to work on the project, perfect
on her APA skills and data analysis. This was not easy given the strict deadline for the
defense and final project submission as per the schedule followed by the University of
Nairobi.
5.6 Suggestions for Further Research
A similar study should be conducted in the other 45 counties across the country other
than Nairobi and former Central Province Counties to know the extent of
implementation of inventory management practices and their influence in
performance of public hospitals. This will create a platform to make a comparison on
the findings upon which reliable conclusion can be made based on solid facts.
Moreover, it would be interesting to investigate the extent to which private hospitals
implement inventory management practices and what public hospitals can learn, if
anything, from them in relation to quality health care service delivery leveraged on
efficient and effective supply chains. This will provide insights into areas for
improvement for the health sector as a whole.
A comparative study should be conducted within the East African region in a middle
class country that is similar in size for purposes of benchmarking. This will allow
comparison, borrowing and adoption and implementing of some of the best inventory
management practices that are competitive and compatible with the health policies.
The researcher also suggests a comprehensive review of health facilities compliance
with Public Procurement and Oversight Authority regulations and health policy on
supply chain management in the sector. This will ensure compliance of public health
policies to ensure that the meet international standards.

51
REFERENCES
Aberdeen Group (2004). Supply chain inventory strategies benchmark report: how
inventory misconceptions and inertia are damaging companies' service levels
and financial results, Aberdeen Group
Agus, A. & Noor, Z. (2010). Supply chain management and performance: an
empirical study, University of Malaysia, Singapore
Akintonye, N. (2014). The effect of inventory management on performance of
German service firms, Journal of Operations Management, 2(1), 1-5
Barua, A. et al (2011). Opportunities and value assessment, Sloan Management
Review, 43 (1): 36-44
Beamon, B. & Kotleba, S. (2006). Inventory modeling for complex emergencies in
humanitarian relief operations, International Journal of Logistics: research
and applications, 9, 1 - 18
Bicheno, J. (2011). Vendor management inventories, National Institute for
Manufacturing Management, London
Blanchard, D. (2010). Supply chain management: best practices (2nd
edition), John
Wiley & Sons, New Jersey
Brigham, E. & Gapenski, L. (2013). Intermediate Financial Management, Pearson,
New York
Cai, J. et al (2008). Improving supply chain performance management, ABS working
Paper Series No.3
Cooper, R. & Kaplan, R. (2002). Measure costs right make the right decisions,
Harvard Business Review, 96‐103, London
Cooper, R. (1990). Implementing an activity‐based cost system, Journal of Cost
Management, Spring 33‐42
Croom, S. & Jones, A. (2010). E-procurement: Key Issues in inventory control
implementation and operation in the Public Sector
Dai, Q. & Kauffman, R. (2001). An exploratory assessment, a paper presented at the
thirty-fourth annual Hawaii international conference on systems sciences,
Hawaii.
Davila, A. et al (2009). The adoption and the use of inventory control technology
model, European Management Journal, 21 (1): 11-23

52
Drurry, C. (2011). Management and cost accounting. Prentice Hall, London
Dryden, P. & Brownell, J. (2012). Strengthening the purchase vendor management
inventory, Cornell University, Dublin
Eckert, S. (2012). Inventory management and its effects on customer satisfaction,
Journal of Public Policy, 1(3):15
Fawcett, S. et al (2008). Benefits, barriers and bridges to effective supply chain
management, Supply Chain Management: An International Journal, 13(1),
35-48
Gakuru, N. (2012). Application of inventory models in drug inventory management
the case for the Nairobi city council health services, Unpublished MBA
Project, University of Nairobi, Nairobi
Githendu, D. (2010). Inventory management by simulation analysis: a case study of
Davis & Shirtliff Company limited, Unpublished MBA Project, University of
Nairobi, Nairobi
Githui, D. (2012). Responsible purchasing and supply chain management in Kenya.
European Journal of Business and Management
Gonzalez, J. & Gonzalez, D. (2010). Analysis of an economic order quantity and re-
order point inventory control model for company XYZ. Unpublished Project,
California Polytechnic State University, San Luis Obispo
Government of Kenya (2010). The Kenya constitution of Kenya, Government press,
Nairobi
Jeans, M. & Morrow, M. (2001). The practicalities of using activity‐based costing,
Journal of Management Accounting, 42‐4
Jha, R. (2010). Customer focused collaborative demand planning in Hi-Tech Industry,
Massachusetts Institute of Technology, USA
Kitheka, S. (2012). Inventory management automation and the performance of
supermarkets in western Kenya, Unpublished MBA Project, University of
Nairobi, Nairobi
Koh, C. et al (2013). The impact of supply chain practices on performance on SMES,
Industrial Management & Data Systems: 107:1 (103-240)
Krajewski, L. & Ritzman, L. (1999). Operations management strategy and analysis,
Addison Wesley, Reading, MA
Lai, K. & Cheng T. (2010). Just-in-Time logistics, Gower Publishing Limited,
England

53
Lambert, D. (2011). Supply chain management: processes, partnerships,
performance (3rd
Ed.), the Hartley Press Inc., USA
Lapide, L. (2010). Inventory management in service firms: forecast errors, The
Journal of Business Forecasting, 1-2
Maghanga, F. (2011). Logistics outsourcing practices among tea processing firms in
Kericho County, Kenya, Unpublished MBA Project, department of
management science, University of Nairobi, Nairobi
Mehra, S. & Inman, R. (2000). JIT implementation within a service industry: A Case
Study, International Journal of Service Industry Management, 1(3):53‐61
Mehra, S. & Inman, R. (2014). Inventory management and efficiency of
manufacturing firms, Journal of Operations Management, 1(2), 1-4
Ministry of Health Kenya (2014). Kenya health policy 2014-2030, Ministry of
Health, Nairobi
Mungu, S. (2013). Supply chain management practices and stock levels of essential
drugs in public health facilities in Bungoma East Sub County, Unpublished
Research Project, University of Nairobi, Nairobi
Onyango, A. (2011). Supply Chain Management Practices and Performance in
Cement Industry in Kenya, Unpublished MBA Project, University of Nairobi
School of Business, Nairobi
Palevich, R. (2012). The lean sustainable supply chain: how to create a green
infrastructure with lean technologies, Pearson Education, Inc., London
Porteus, E. (2008). Stochastic inventory theory, Journal Operations Research and
Management Science 2, 605-652
Sandeep, K. (2007). Supply chain management: New Trends and Strategies, Infosys.
Schonberger, R. (2008). Supplier partnering contributes and supply chain
performance: a deeper look. Hoboken, New Jersey, USA: Published by John
Wiley & Sons Inc.
Shapiro, J. (2009). Modeling the supply chain (2nd ed.). Cengage, USA: Cengage
Learning
Silver, A. (2007). Inventory management: University of Calgary, Haskayne School of
Business, Calgary

54
Song, J. & Zipkin, P. (2011). Inventory control with information about supply
condition, Management Science 42, 1409-1419
Stewart, G. (2005). Supply chain performance benchmarking study reveals keys to
supply chain excellence, Logistics Information Management, 8 (2), 38-44
USAID (2012). Selecting and implementing vendor managed inventory systems for
public health supply chain: Deliver Project, USAID
Water, D. (2013). Global logistics and distribution planning: strategies for
management (4th edition), Kogan Page Limited, London
Watson N. & Zhang Y. (2005) Decentralized serial supply chains subject to order
delays and information distortion, Manufacturing and Service Operations
Management 7, 152-168
Watson, N. (2010). Strategic supply chain planning & the role of forecasting,
Research Associate, CTL, MIT
Wisner, T. & Leong, G. (2011). Principles of supply chain management: A Balanced
Approach (3rd Edition), USA
Zer, O. & Wei, W. (2006). Strategic commitment for optimal capacity decision under
asymmetric forecast information, Management Science, 52, 8, 1239-1258

55
APPENDICES
APPENDIX I: RESEARCH QUESTIONNAIRE
INTRODUCTION
This questionnaire has been designed for the sole purpose of collecting data on the
effect of inventory management practices and performance of public hospitals in
Kenya. The data collected will be treated with a very high degree of confidentiality
and it is meant for academic purpose only.
SECTION A: GENERAL INFORMATION
Name of Hospital ………………………………………………………………………
1. Duration that the hospital has been in operation
(i) Less than 10 years [ ]
(ii) More than 10 years [ ]
2. What is your position in this hospital?
a) Chief Supply Chain Management Officer [ ]
b) Senior Supply Chain Management Officer [ ]
c) Supply Chain Management Assistant [ ]
d) Other (specify)…………………….
3. How long have you been in this position?
a) Less than 5 years [ ]
b) 5 to 20 years [ ]
c) 20 years and above [ ]
4. What is your highest professional qualification in supply chain management?
a) Degree [ ]
b) Diploma [ ]
c) Certificate [ ]
d) Other (specify) …………………………

56
SECTION B: INVENTORY MANAGEMENT PRACTICES IN PUBLIC
HOSPITALS IN KENYA
Please indicate the extent to which you agree with the following statements on the
inventory management practices used by public hospitals. The scale below will be
applicable: 1=very small extent, 2= small extent, 3= moderate extent, 4= Large extent,
5= to a very large extent
No Statement 1 2 3 4 5
Economic Order Quantity
1 The hospital adopts a classical economic order quantity model.
2. The hospital observes periodical replenishment of stocks
3 The hospital maintain a minimum stock levels
Radio Frequency Identification System
1 The hospital uses Radio Frequency Identification System of
technology in reading and collecting data
2 The hospital uses manual system of information
Vendor Managed Inventory System
1 The hospital practices vender managed inventory systems.
2 The hospital collaborates with its suppliers in system upgrade
3 The hospital uses automatic stock tracking
Enterprise Resource Planning
1 The hospital uses Enterprise Resource Planning system
2 The hospital has an integrated information sharing system
3 The hospital maintains a database for all its suppliers
Just In Time
1. The hospital uses JIT stock control system
2. The hospital uses the JIT system to eliminate waste
ABC Analysis
1 The hospital uses ABC analysis to classify items according to their
stock value
2. The hospital uses ABC Analysis to reduce stock holding cost
E-Procurement
1 The hospital comply with e-procurement systems (IFMIS module)
2 There is improved connectivity with a wide range of suppliers
Simulation
1 The hospital uses simulation inventory models technique
2 The hospital uses simulation to generate reports that help in decision
making.
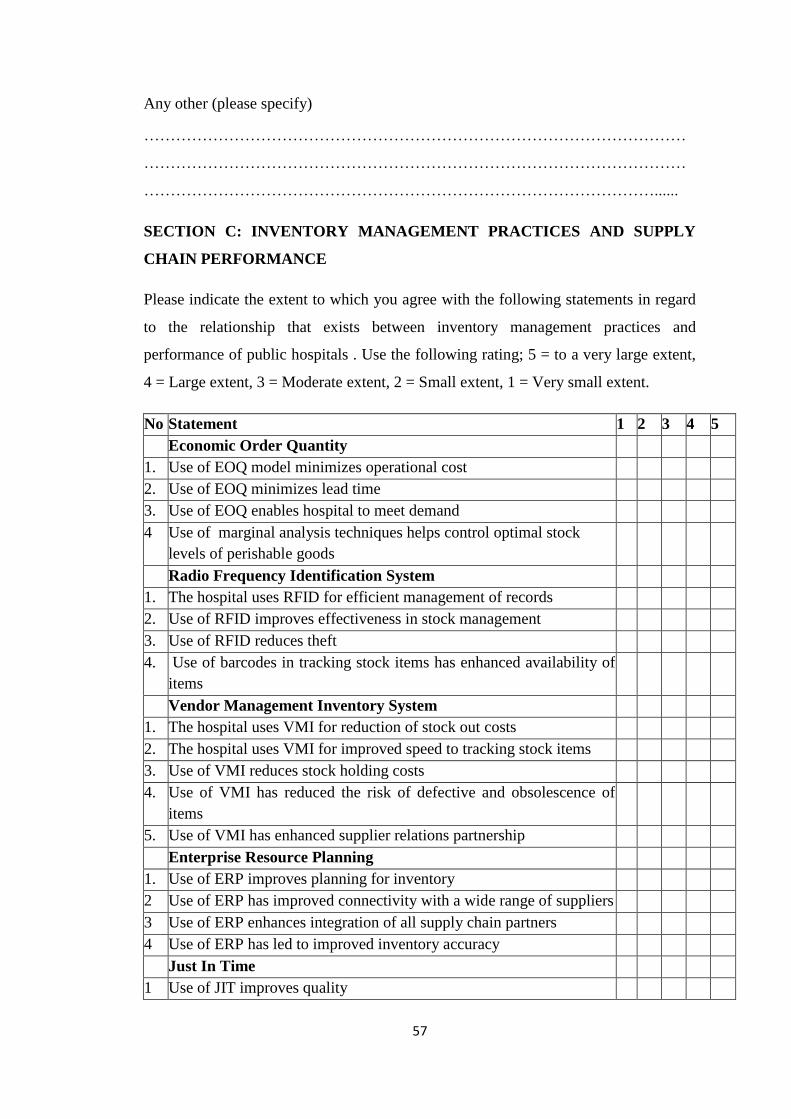
57
Any other (please specify)
…………………………………………………………………………………………
…………………………………………………………………………………………
……………………………………………………………………………………......
SECTION C: INVENTORY MANAGEMENT PRACTICES AND SUPPLY
CHAIN PERFORMANCE
Please indicate the extent to which you agree with the following statements in regard
to the relationship that exists between inventory management practices and
performance of public hospitals . Use the following rating; 5 = to a very large extent,
4 = Large extent, 3 = Moderate extent, 2 = Small extent, 1 = Very small extent.
No Statement 1 2 3 4 5
Economic Order Quantity
1. Use of EOQ model minimizes operational cost
2. Use of EOQ minimizes lead time
3. Use of EOQ enables hospital to meet demand
4 Use of marginal analysis techniques helps control optimal stock
levels of perishable goods
Radio Frequency Identification System
1. The hospital uses RFID for efficient management of records
2. Use of RFID improves effectiveness in stock management
3. Use of RFID reduces theft
4. Use of barcodes in tracking stock items has enhanced availability of
items
Vendor Management Inventory System
1. The hospital uses VMI for reduction of stock out costs
2. The hospital uses VMI for improved speed to tracking stock items
3. Use of VMI reduces stock holding costs
4. Use of VMI has reduced the risk of defective and obsolescence of
items
5. Use of VMI has enhanced supplier relations partnership
Enterprise Resource Planning
1. Use of ERP improves planning for inventory
2 Use of ERP has improved connectivity with a wide range of suppliers
3 Use of ERP enhances integration of all supply chain partners
4 Use of ERP has led to improved inventory accuracy
Just In Time
1 Use of JIT improves quality

58
No Statement 1 2 3 4 5
2 Use of JIT improves reliability of suppliers
3. The hospital uses the JIT system to improve customer service
4. Use of JIT improves timely delivery of goods and services
ABC Analysis
1. Use of ABC leads to efficient management of resources
2. Use of ABC enables the hospital to concentrate on the most cost-
effective areas
3. ABC reduces stock holding costs
E-Procurement
1. Use e-procurement increases improved connectivity with suppliers
2. Use of e-procurement minimizes operational costs
3. Use of e-procurement leads to real time processing of data
4. The hospital has formally improved transparency in all its tendering
processes
5 Use of e-procurement improves customer satisfaction
Simulation
1 The hospital adapts simulation module
2 The hospital uses simulated values of services and stocks
Others (please specify)
…………………………………………………………………………………………
…………………………………………………………………………………………
………………………………………………………………………………………

59
SECTION D: CHALLENGES OF INVENTORY MANAGEMEMENT
PRACTICES
Please indicate the challenges faced by your organization in implementation of
inventory management practices in public hospitals in selected counties. Please tick in
the appropriate box using the following rating; 5 = Strongly agree, 4 = Agree, 3 =
Neither agree not disagree, 2 = Disagree, 1 = Strongly disagree
5 4 3 2 1
1. Lack of commitment by top management
2. Failure to invest in modern technologies
3. Insufficient funding by government
4. Incompetent staff
5. Unreliable suppliers
6. Poor record keeping
7. Poor infrastructure
8. Lack of proper training
List any other areas for improvement in supply chain management
…………………………………………………………………………………………
…………………………………………………………………………………………
…………………………………………………………………………………………
THANK YOU

60
APPENDIX II: List of Public Hospitals in Nairobi County and Former Central Province Counties in Kenya
(Levels 4, 5, 6 & stand alone)
Nairobi Referral Hospitals
SN FACILITY NAME DISTRICT COUNTY DIVISION TYPE OF FACILITY OWNER
1. Kenyatta National Hospital Nairobi Nairobi Kibra National Referral Hospital Ministry of Health
2. National Spinal Injury Hospital Nairobi Nairobi Dagoretti North National Referral Hospital Ministry of Health
Nairobi District Hospitals
SN FACILITY NAME DISTRICT COUNTY DIVISION TYPE OF
FACILITY
OWNER
3. Mathari Hospital Nairobi Nairobi Mathare District Hospital Ministry of Health
4. Mama Lucy Kibaki Hospital – Embakasi Nairobi Nairobi Embakasi West District Hospital Ministry of Health
5. Mbagathi District Hospital Nairobi Nairobi Kibra District Hospital Ministry of Health
Nairobi Stand Alone Hospitals
SN FACILITY NAME DISTRICT COUNTY DIVISION TYPE OF FACILITY OWNER
6. TB central Reference Lab Nairobi Nairobi Kibra Laboratory (Stand-alone) Ministry of Health
7. National Blood Transfusion Services Nairobi Nairobi Kibra Laboratory (Stand-alone) Ministry of Health
8. National HIV Reference Lab Nairobi Nairobi Kibra Laboratory (Stand-alone) Ministry of Health
9. National Public Health Laboratories Nairobi Nairobi Kibra Laboratory (Stand-alone) Ministry of Health
10. Microbiology Reference Lab Nairobi Nairobi Kibra Laboratory (Stand-alone) Ministry of Health

61
Nairobi Medical Clinic
SN FACILITY NAME DISTRICT COUNTY DIVISION TYPE OF FACILITY OWNER
11. Kari health Clinic Nairobi Nairobi Westlands Medical Clinic Ministry of Health
12. Kamiti Maximum Clinic Nairobi Nairobi Roysambu Medical Clinic Ministry of Health
13. Westlands District Health Management Nairobi Nairobi Westlands Medical Clinic Ministry of Health
Central District Hospitals
SN FACILITY NAME DISTRICT COUNTY DIVISION TYPE OF FACILITY OWNER
14. Kiambu District Hospital Central Kiambu Kiambu District Hospital Ministry of Health
15. Thika District Hospital Central Kiambu Thika District Hospital Ministry of Health
16. Gatundu District Hospital Central Kiambu Gatundu District Hospital Ministry of Health
17. Tigoni District Hospital Central Kiambu Limuru District Hospital Ministry of Health
18. Kerugoya District Hospital Central Kirinyaga Kirinyaga Central District Hospital Ministry of Health
19. Maragua District Hospital Central Murang’a Murang’a South District Hospital Ministry of Health
20. Murang’a District Hospital Central Murang’a Kiharu District Hospital Ministry of Health
21. Nyeri Provincial General Hospital Central Nyeri Nyeri Municipality District Hospital Ministry of Health
22. Karatina District Hospital Central Nyeri Mathira East District Hospital Ministry of Health
23. Mukurweini District Hospital Central Nyeri Mukurweini District Hospital Ministry of Health
24. Engineer District Hospital Central Nyandarua Nyandarua South District Hospital Ministry of Health

62
Central Sub-District Hospitals
SN FACILITY NAME DISTRICT COUNTY DIVISION TYPE OF FACILITY OWNER
25. Kihara Sub-District Hospital Central Kiambu Kiambu Sub - District Hospital Ministry of Health
26. Igegania Sub-District Hospital Central Kiambu Gatundu North Sub - District Hospital Ministry of Health
27. Nyathuna Sub-District Hospital Central Kiambu Kikuyu Sub - District Hospital Ministry of Health
28. Ruiru Sub-District Hospital Central Kiambu Ruiru Sub - District Hospital Ministry of Health
29. Kimbimbi Sub-District Hospital Central Kirinyaga Kirinyaga South Sub - District Hospital Ministry of Health
30. Kianyaga Sub-District Hospital Central Kirinyaga Kirinyaga East Sub - District Hospital Ministry of Health
31. Sagana Sub-District Hospital Central Kirinyaga Kirinyaga West Sub - District Hospital Ministry of Health
32. Kirwara Sub-District Hospital Central Murang’a Gatanga Sub - District Hospital Ministry of Health
33. Kigumo Sub-District Hospital Central Murang’a Kigumo Sub - District Hospital Ministry of Health
34. Kandara Sub-District Hospital Central Murang’a Kandara Sub - District Hospital Ministry of Health
35. Kangema Sub-District Hospital Central Murang’a Kiharu Sub - District Hospital Ministry of Health
36. Muriranjas Sub-District Hospital Central Murang’a Kahuro Sub - District Hospital Ministry of Health
37. Ol Kalou Sub-District Hospital Central Nyandarua Nyandarua Central Sub - District Hospital Ministry of Health
38. Mt. Kenya Sub-District Hospital Central Nyeri Nyeri Sub - District Hospital Ministry of Health
39. Othaya Sub-District Hospital Central Nyeri Nyeri Sub - District Hospital Ministry of Health
Central Medical Clinic
SN FACILITY NAME DISTRICT COUNTY DIVISION TYPE OF
FACILITY
OWNER
40. Amazing Grace Medical Clinic Central Nyandarua Oljoro-orok Medical Clinic Ministry of Health
Source: Kenya Health Policy 2014-2015