inventory and monitoring of invasive species
TRANSCRIPT
231© The Author(s) 2021T. M. Poland et al. (eds.), Invasive Species in Forests and Rangelands of the United States,https://doi.org/10.1007/978-3-030-45367-1_10
Inventory and Monitoring of Invasive Species
Sonja Oswalt, Chris Oswalt, Alycia Crall, Robert Rabaglia, Michael K. Schwartz, and Becky K. Kerns
10.1 The Need for Inventory and Monitoring
Inventory and monitoring programs and high-quality distri-bution data are needed to manage invasive species and to develop quantitative ecological, economic, and social impact assessments. Strong inventory and monitoring programs pro-vide valuable insights that help direct efforts to prevent and contain invasive species. Understanding where to focus man-agement efforts, in addition to educational outreach, is key to developing economically efficient and ecologically relevant programs. As noted in Chap. 2, additional research is needed to address large-scale impacts and co-occurring impacts of multiple invaders. Inventory and monitoring efforts help to inform where this research can be most effectively applied by identifying areas where invasives are most abundant, most likely to spread, or most likely to be contained (Byers et al. 2002; Myers et al. 2000). Furthermore, as climate change continues to pose new and uncertain impacts on eco-systems, monitoring at the edge of invasive species’ ranges will become more important to management efforts (Hellmann et al. 2008).
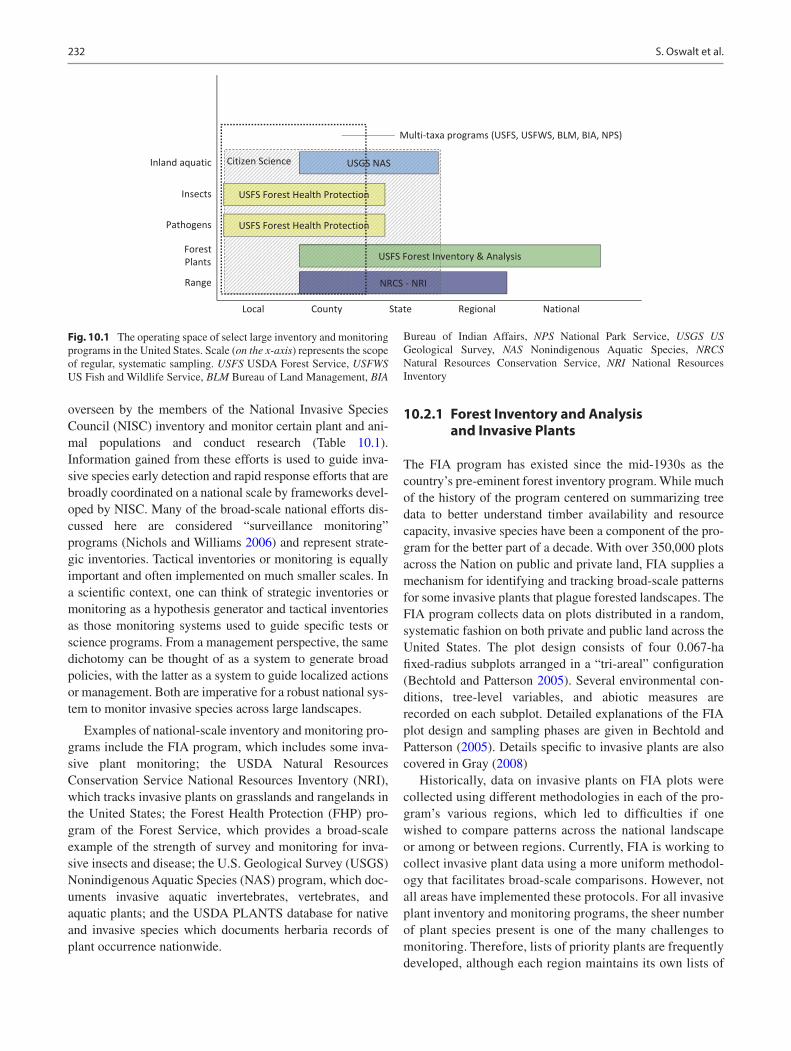
Inventory and monitoring of invasive species in the United States currently occur at a variety of scales (Fig. 10.1); for example, programs include national efforts like the Forest Inventory and Analysis (FIA) program of the USDA Forest
Service, which samples many invasive plants systematically across the entire country, State-level Natural Heritage Programs that provide detailed information on invasive organ-isms at small scales, and multi-scale citizen science efforts. Understanding where invasive species are encroaching on native ecosystems can facilitate more focused management plans and activities, identify research needs, and suggest tar-geted approaches to the prevention of establishment and spread. This chapter explores how invasive species are being monitored at multiple scales, across multiple taxa, and in a wide variety of ecological systems by reviewing some recog-nized invasive species programs in the United States. While we cannot adequately cover all the inventory and monitoring programs in the country, we provide several prominent exam-ples (Table 10.1) at each scale [note: many of the programs described cover multiple scales] to illustrate the utility of inventory in decision making and research planning.
10.2 National-Scale Inventories of Invasive Species
National and sub-national programs provide a mechanism for identifying invasive species “hot spots” and detecting poten-tial areas where spread is likely to occur. In addition, these programs afford monitoring of well-known invasives to track impact and spread. Federal agencies and bureaus that are
S. Oswalt (*)U.S. Department of Agriculture, Forest Service, Forest Inventoryand Analysis Program, Washington, DC, USA
Department of Forestry, Wildlife, & Fisheries, University of Tennessee, Knoxville, TN, USAe-mail: [email protected]
C. OswaltU.S. Department of Agriculture, Forest Service, Southern ResearchStation Forest Inventory and Analysis, Knoxville, TN, USA
A. CrallNational Ecological Observatory Network, Boulder, CO, USA
R. RabagliaU.S. Department of Agriculture, Forest Service,State & Private Forestry, Forest Health Protection,Washington, DC, USA
M. K. SchwartzU.S. Department of Agriculture, Forest Service, NationalGenomics Center for Wildlife and Fish Conservation,Missoula, MT, USA
B. K. Kerns U.S. Department of Agriculture, Forest Service, Pacific Northwest Research Station, Corvallis, OR, USA
10
This work was supported in part by the U.S. Department of Agriculture, Forest Service.The findings and conclusions in this publication are those of the authors and should not be construed to represent any official USDA or U.S. Government determination or policy.
232
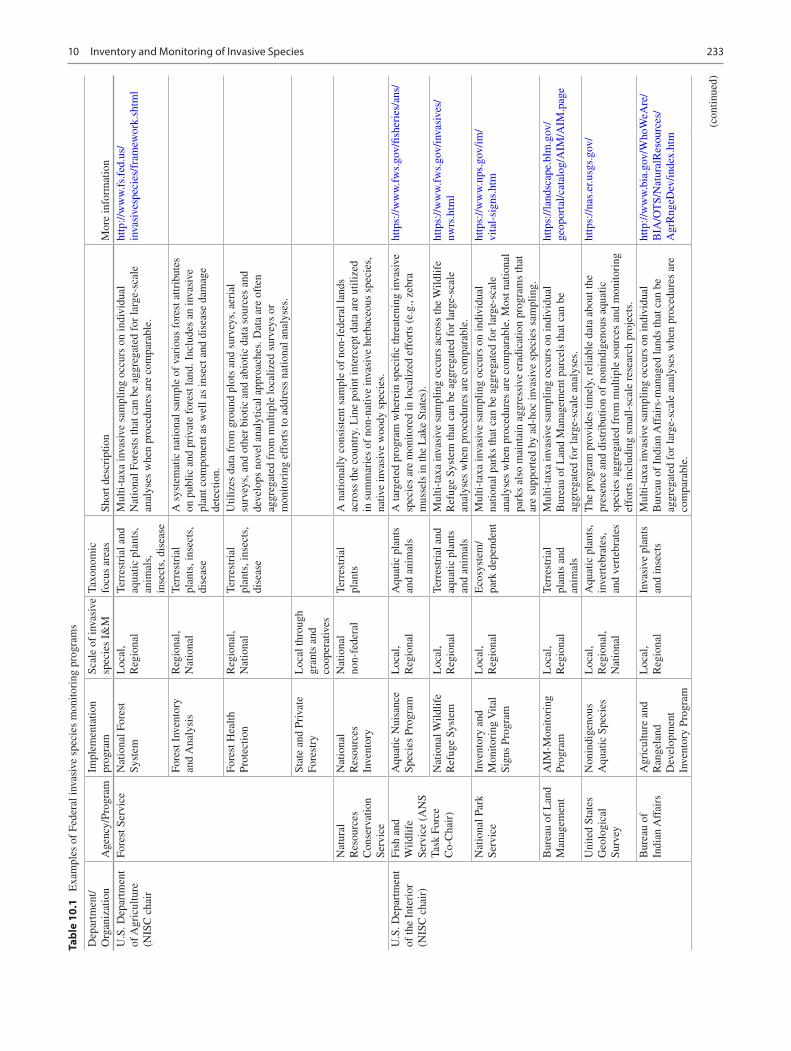
overseen by the members of the National Invasive Species Council (NISC) inventory and monitor certain plant and ani-mal populations and conduct research (Table 10.1). Information gained from these efforts is used to guide inva-sive species early detection and rapid response efforts that are broadly coordinated on a national scale by frameworks devel-oped by NISC. Many of the broad-scale national efforts dis-cussed here are considered “surveillance monitoring” programs (Nichols and Williams 2006) and represent strate-gic inventories. Tactical inventories or monitoring is equally important and often implemented on much smaller scales. In a scientific context, one can think of strategic inventories or monitoring as a hypothesis generator and tactical inventories as those monitoring systems used to guide specific tests or science programs. From a management perspective, the same dichotomy can be thought of as a system to generate broad policies, with the latter as a system to guide localized actions or management. Both are imperative for a robust national sys-tem to monitor invasive species across large landscapes.
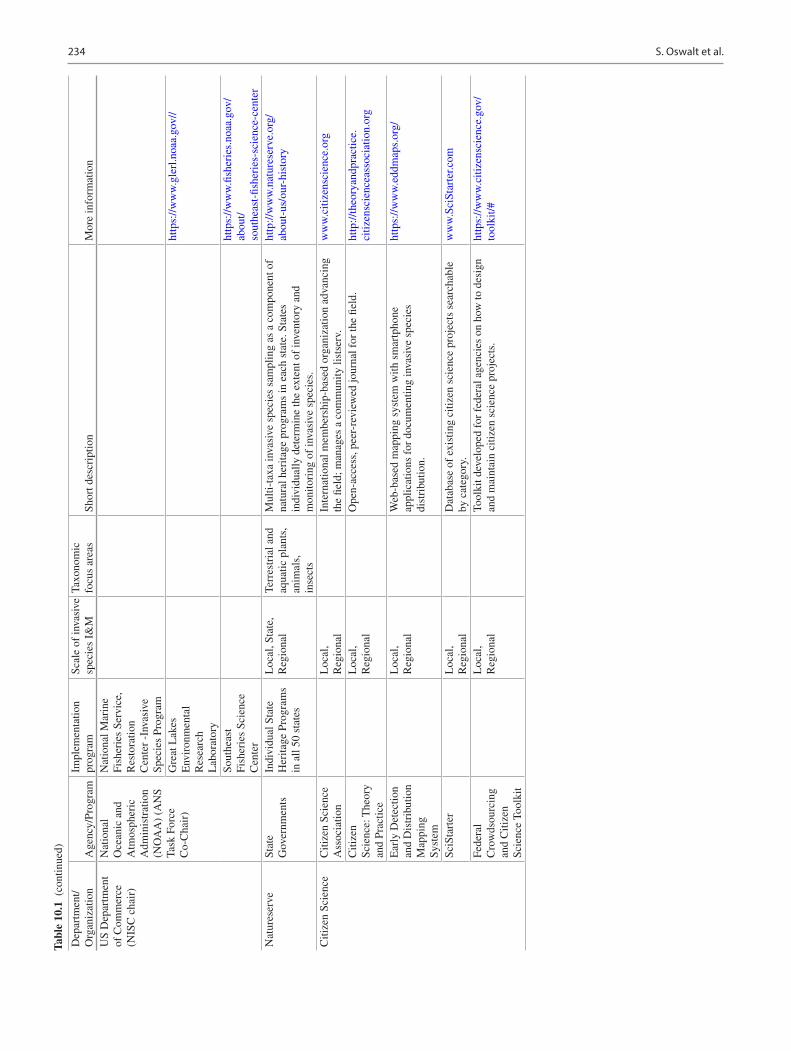
Examples of national-scale inventory and monitoring pro-grams include the FIA program, which includes some inva-sive plant monitoring; the USDA Natural Resources Conservation Service National Resources Inventory (NRI), which tracks invasive plants on grasslands and rangelands in the United States; the Forest Health Protection (FHP) pro-gram of the Forest Service, which provides a broad-scale example of the strength of survey and monitoring for inva-sive insects and disease; the U.S. Geological Survey (USGS) Nonindigenous Aquatic Species (NAS) program, which doc-uments invasive aquatic invertebrates, vertebrates, and aquatic plants; and the USDA PLANTS database for native and invasive species which documents herbaria records of plant occurrence nationwide.
10.2.1 Forest Inventory and Analysis and Invasive Plants
The FIA program has existed since the mid-1930s as the country’s pre-eminent forest inventory program. While much of the history of the program centered on summarizing tree data to better understand timber availability and resource capacity, invasive species have been a component of the pro-gram for the better part of a decade. With over 350,000 plots across the Nation on public and private land, FIA supplies a mechanism for identifying and tracking broad-scale patterns for some invasive plants that plague forested landscapes. The FIA program collects data on plots distributed in a random, systematic fashion on both private and public land across the United States. The plot design consists of four 0.067-ha fixed-radius subplots arranged in a “tri-areal” configuration (Bechtold and Patterson 2005). Several environmental con-ditions, tree-level variables, and abiotic measures are recorded on each subplot. Detailed explanations of the FIA plot design and sampling phases are given in Bechtold and Patterson (2005). Details specific to invasive plants are also covered in Gray (2008)
Historically, data on invasive plants on FIA plots were collected using different methodologies in each of the pro-gram’s various regions, which led to difficulties if one wished to compare patterns across the national landscape or among or between regions. Currently, FIA is working to collect invasive plant data using a more uniform methodol-ogy that facilitates broad-scale comparisons. However, not all areas have implemented these protocols. For all invasive plant inventory and monitoring programs, the sheer number of plant species present is one of the many challenges to monitoring. Therefore, lists of priority plants are frequently developed, although each region maintains its own lists of
NRCS - NRI
Local County State Regional National
Inland aquatic
Insects
Pathogens
ForestPlants
Range
USFS Forest Inventory & Analysis
USFS Forest Health Protection
USFS Forest Health Protection
USGS NASCitizen Science
Multi-taxa programs (USFS, USFWS, BLM, BIA, NPS)
Fig. 10.1 The operating space of select large inventory and monitoring programs in the United States. Scale (on the x-axis) represents the scope of regular, systematic sampling. USFS USDA Forest Service, USFWS US Fish and Wildlife Service, BLM Bureau of Land Management, BIA
Bureau of Indian Affairs, NPS National Park Service, USGS US Geological Survey, NAS Nonindigenous Aquatic Species, NRCS Natural Resources Conservation Service, NRI National Resources Inventory
S. Oswalt et al.
233
Tabl
e 10
.1
Exa
mpl
es o
f Fe
dera
l inv
asiv
e sp
ecie
s m
onito
ring
pro
gram
s
Dep
artm
ent/
Org
aniz
atio
nA
genc
y/Pr
ogra
mIm
plem
enta
tion
prog
ram
Scal
e of
inva
sive
sp
ecie
s I&
MTa
xono
mic
fo
cus
area
sSh
ort d
escr
iptio
nM
ore
info
rmat
ion
U.S
. Dep
artm
ent
of A
gric
ultu
re
(NIS
C c
hair
Fore
st S
ervi
ceN
atio
nal F
ores
t Sy
stem
Loc
al,
Reg
iona
lTe
rres
tria
l and
aq
uatic
pla
nts,
an
imal
s,
inse
cts,
dis
ease
Mul
ti-ta
xa in
vasi
ve s
ampl
ing
occu
rs o
n in
divi
dual
N
atio
nal F
ores
ts th
at c
an b
e ag
greg
ated
for
larg
e-sc
ale
anal
yses
whe
n pr
oced
ures
are
com
para
ble.
http
://w
ww
.fs.
fed.
us/
inva
sive
spec
ies/
fram
ewor
k.sh
tml
Fore
st I
nven
tory
an
d A
naly
sis
Reg
iona
l, N
atio
nal
Terr
estr
ial
plan
ts, i
nsec
ts,
dise
ase
A s
yste
mat
ic n
atio
nal s
ampl
e of
var
ious
for
est a
ttrib
utes
on
pub
lic a
nd p
riva
te f
ores
t lan
d. I
nclu
des
an in
vasi
ve
plan
t com
pone
nt a
s w
ell a
s in
sect
and
dis
ease
dam
age
dete
ctio
n.Fo
rest
Hea
lth
Prot
ectio
nR
egio
nal,
Nat
iona
lTe
rres
tria
l pl
ants
, ins
ects
, di
seas
e
Util
izes
dat
a fr
om g
roun
d pl
ots
and
surv
eys,
aer
ial
surv
eys,
and
oth
er b
iotic
and
abi
otic
dat
a so
urce
s an
d de
velo
ps n
ovel
ana
lytic
al a
ppro
ache
s. D
ata
are
ofte
n ag
greg
ated
fro
m m
ultip
le lo
caliz
ed s
urve
ys o
r m
onito
ring
eff
orts
to a
ddre
ss n
atio
nal a
naly
ses.
Stat
e an
d Pr
ivat
e Fo
rest
ryL
ocal
thro
ugh
gran
ts a
nd
coop
erat
ives
Nat
ural
R
esou
rces
C
onse
rvat
ion
Serv
ice
Nat
iona
l R
esou
rces
In
vent
ory
Nat
iona
l no
n-fe
dera
lTe
rres
tria
l pl
ants
A n
atio
nally
con
sist
ent s
ampl
e of
non
-fed
eral
land
s ac
ross
the
coun
try.
Lin
e po
int i
nter
cept
dat
a ar
e ut
ilize
d in
sum
mar
ies
of n
on-n
ativ
e in
vasi
ve h
erba
ceou
s sp
ecie
s,
nativ
e in
vasi
ve w
oody
spe
cies
.U
.S. D
epar
tmen
t of
the
Inte
rior
(N
ISC
cha
ir)
Fish
and
W
ildlif
e Se
rvic
e (A
NS
Task
For
ce
Co-
Cha
ir)
Aqu
atic
Nui
sanc
e Sp
ecie
s Pr
ogra
mL
ocal
, R
egio
nal
Aqu
atic
pla
nts
and
anim
als
A ta
rget
ed p
rogr
am w
here
in s
peci
fic th
reat
enin
g in
vasi
ve
spec
ies
are
mon
itore
d in
loca
lized
eff
orts
(e.
g., z
ebra
m
usse
ls in
the
Lak
e St
ates
).
http
s://w
ww
.fw
s.go
v/fis
heri
es/a
ns/
Nat
iona
l Wild
life
Ref
uge
Syst
emL
ocal
, R
egio
nal
Terr
estr
ial a
nd
aqua
tic p
lant
s an
d an
imal
s
Mul
ti-ta
xa in
vasi
ve s
ampl
ing
occu
rs a
cros
s th
e W
ildlif
e R
efug
e Sy
stem
that
can
be
aggr
egat
ed f
or la
rge-
scal
e an
alys
es w
hen
proc
edur
es a
re c
ompa
rabl
e.
http
s://w
ww
.fw
s.go
v/in
vasi
ves/
nwrs
.htm
l
Nat
iona
l Par
k Se
rvic
eIn
vent
ory
and
Mon
itori
ng V
ital
Sign
s Pr
ogra
m
Loc
al,
Reg
iona
lE
cosy
stem
/pa
rk d
epen
dent
Mul
ti-ta
xa in
vasi
ve s
ampl
ing
occu
rs o
n in
divi
dual
na
tiona
l par
ks th
at c
an b
e ag
greg
ated
for
larg
e-sc
ale
anal
yses
whe
n pr
oced
ures
are
com
para
ble.
Mos
t nat
iona
l pa
rks
also
mai
ntai
n ag
gres
sive
era
dica
tion
prog
ram
s th
at
are
supp
orte
d by
ad-
hoc
inva
sive
spe
cies
sam
plin
g.
http
s://w
ww
.nps
.gov
/im/
vita
l-si
gns.
htm
Bur
eau
of L
and
Man
agem
ent
AIM
-Mon
itori
ng
Prog
ram
Loc
al,
Reg
iona
lTe
rres
tria
l pl
ants
and
an
imal
s
Mul
ti-ta
xa in
vasi
ve s
ampl
ing
occu
rs o
n in
divi
dual
B
urea
u of
Lan
d M
anag
emen
t par
cels
that
can
be
aggr
egat
ed f
or la
rge-
scal
e an
alys
es.
http
s://l
ands
cape
.blm
.gov
/ge
opor
tal/c
atal
og/A
IM/A
IM.p
age
Uni
ted
Stat
es
Geo
logi
cal
Surv
ey
Non
indi
geno
us
Aqu
atic
Spe
cies
Loc
al,
Reg
iona
l, N
atio
nal
Aqu
atic
pla
nts,
in
vert
ebra
tes,
an
d ve
rteb
rate
s
The
pro
gram
pro
vide
s tim
ely,
rel
iabl
e da
ta a
bout
the
pres
ence
and
dis
trib
utio
n of
non
indi
geno
us a
quat
ic
spec
ies
aggr
egat
ed f
rom
mul
tiple
sou
rces
and
mon
itori
ng
effo
rts
incl
udin
g sm
all-
scal
e re
sear
ch p
roje
cts.
http
s://n
as.e
r.usg
s.go
v/
Bur
eau
of
Indi
an A
ffai
rsA
gric
ultu
re a
nd
Ran
gela
nd
Dev
elop
men
t In
vent
ory
Prog
ram
Loc
al,
Reg
iona
lIn
vasi
ve p
lant
s an
d in
sect
sM
ulti-
taxa
inva
sive
sam
plin
g oc
curs
on
indi
vidu
al
Bur
eau
of I
ndia
n A
ffai
rs-m
anag
ed la
nds
that
can
be
aggr
egat
ed f
or la
rge-
scal
e an
alys
es w
hen
proc
edur
es a
re
com
para
ble.
http
://w
ww
.bia
.gov
/Who
WeA
re/
BIA
/OT
S/N
atur
alR
esou
rces
/A
grR
ngeD
ev/in
dex.
htm
(con
tinue
d)
10 Inventory and Monitoring of Invasive Species
234
Dep
artm
ent/
Org
aniz
atio
nA
genc
y/Pr
ogra
mIm
plem
enta
tion
prog
ram
Scal
e of
inva
sive
sp
ecie
s I&
MTa
xono
mic
fo
cus
area
sSh
ort d
escr
iptio
nM
ore
info
rmat
ion
US
Dep
artm
ent
of C
omm
erce
(N
ISC
cha
ir)
Nat
iona
l O
cean
ic a
nd
Atm
osph
eric
A
dmin
istr
atio
n (N
OA
A)
(AN
S Ta
sk F
orce
C
o-C
hair
)
Nat
iona
l Mar
ine
Fish
erie
s Se
rvic
e,
Res
tora
tion
Cen
ter
-Inv
asiv
e Sp
ecie
s Pr
ogra
mG
reat
Lak
es
Env
iron
men
tal
Res
earc
h L
abor
ator
y
http
s://w
ww
.gle
rl.n
oaa.
gov/
/
Sout
heas
t Fi
sher
ies
Scie
nce
Cen
ter
http
s://w
ww
.fish
erie
s.no
aa.g
ov/
abou
t/so
uthe
ast-
fishe
ries
-sci
ence
-cen
ter
Nat
ures
erve
Stat
e G
over
nmen
tsIn
divi
dual
Sta
te
Her
itage
Pro
gram
s in
all
50 s
tate
s
Loc
al, S
tate
, R
egio
nal
Terr
estr
ial a
nd
aqua
tic p
lant
s,
anim
als,
in
sect
s
Mul
ti-ta
xa in
vasi
ve s
peci
es s
ampl
ing
as a
com
pone
nt o
f na
tura
l her
itage
pro
gram
s in
eac
h st
ate.
Sta
tes
indi
vidu
ally
det
erm
ine
the
exte
nt o
f in
vent
ory
and
mon
itori
ng o
f in
vasi
ve s
peci
es.
http
://w
ww
.nat
ures
erve
.org
/ab
out-
us/o
ur-h
isto
ry
Citi
zen
Scie
nce
Citi
zen
Scie
nce
Ass
ocia
tion
Loc
al,
Reg
iona
lIn
tern
atio
nal m
embe
rshi
p-ba
sed
orga
niza
tion
adva
ncin
g th
e fie
ld; m
anag
es a
com
mun
ity li
stse
rv.
ww
w.c
itize
nsci
ence
.org
Citi
zen
Scie
nce:
The
ory
and
Prac
tice
Loc
al,
Reg
iona
lO
pen-
acce
ss, p
eer-
revi
ewed
jour
nal f
or th
e fie
ld.
http
://th
eory
andp
ract
ice.
citiz
ensc
ienc
eass
ocia
tion.
org
Ear
ly D
etec
tion
and
Dis
trib
utio
n M
appi
ng
Syst
em
Loc
al,
Reg
iona
lW
eb-b
ased
map
ping
sys
tem
with
sm
artp
hone
ap
plic
atio
ns f
or d
ocum
entin
g in
vasi
ve s
peci
es
dist
ribu
tion.
http
s://w
ww
.edd
map
s.or
g/
SciS
tart
erL
ocal
, R
egio
nal
Dat
abas
e of
exi
stin
g ci
tizen
sci
ence
pro
ject
s se
arch
able
by
cat
egor
y.w
ww
.Sci
Star
ter.c
om
Fede
ral
Cro
wds
ourc
ing
and
Citi
zen
Scie
nce
Tool
kit
Loc
al,
Reg
iona
lTo
olki
t dev
elop
ed f
or f
eder
al a
genc
ies
on h
ow to
des
ign
and
mai
ntai
n ci
tizen
sci
ence
pro
ject
s.ht
tps:
//ww
w.c
itize
nsci
ence
.gov
/to
olki
t/#
Tabl
e 10
.1 (
cont
inue
d)S. Oswalt et al.
235
invasive forest plants. These lists may be developed in con-junction with Forest Service regional experts or State experts on the species of concern within their forest sys-tems. Sometimes the lists are developed using State nox-ious weed lists, which tend to focus more narrowly on nuisance species in agricultural settings. In addition, given that the physiography, climate, and geography of each region differs, the species that become truly noxious tend to differ as well.
Another issue common to all invasive plant programs is that the reliable identification of species in the field requires considerable botanical expertise needed to distinguish them from the numerous and varied native species. Some species can be very distinctive, but many invasive plants belong to families that require advanced skills to reliably key out and identify (e.g., Compositae or Gramineae). Focused invento-ries or lists, as noted above, of a single or a few selected species, however, can effectively use non-specialist person-nel by providing some training and thorough guides for plant identification. These guides can usually incorporate more tips on identification and distinguishing among similar spe-
cies than what are generally available in formal keys of pub-lished flora.
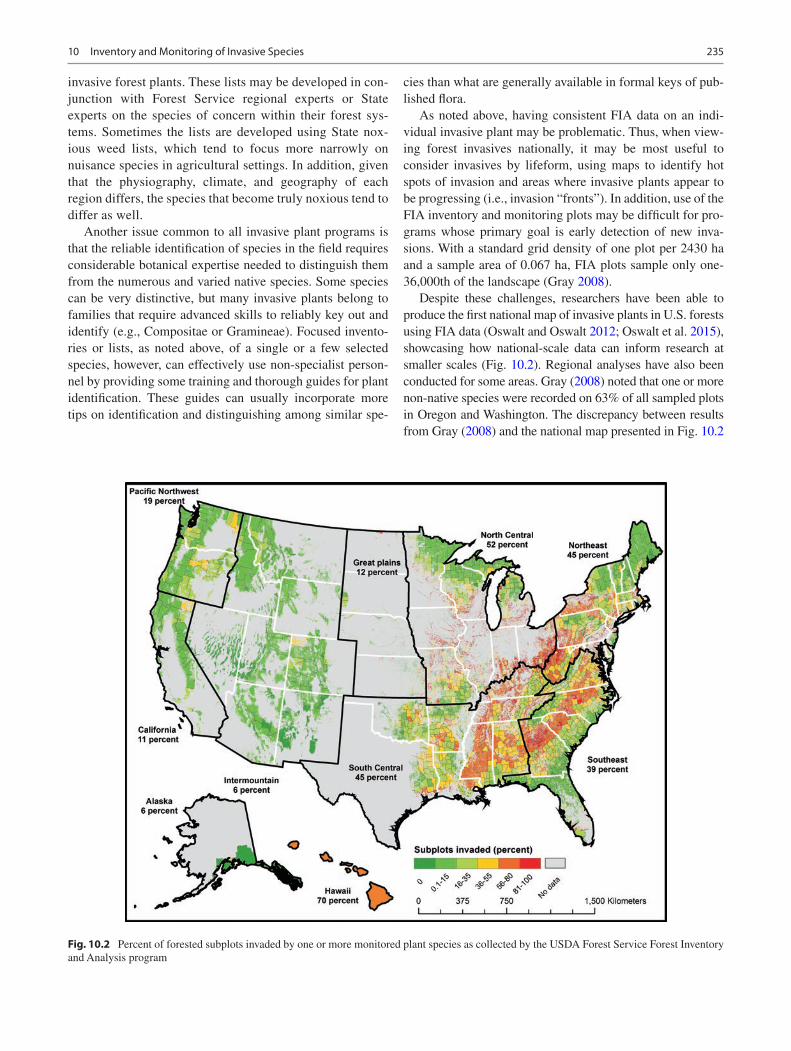
As noted above, having consistent FIA data on an indi-vidual invasive plant may be problematic. Thus, when view-ing forest invasives nationally, it may be most useful to consider invasives by lifeform, using maps to identify hot spots of invasion and areas where invasive plants appear to be progressing (i.e., invasion “fronts”). In addition, use of the FIA inventory and monitoring plots may be difficult for pro-grams whose primary goal is early detection of new inva-sions. With a standard grid density of one plot per 2430 ha and a sample area of 0.067 ha, FIA plots sample only one- 36,000th of the landscape (Gray 2008).
Despite these challenges, researchers have been able to produce the first national map of invasive plants in U.S. forests using FIA data (Oswalt and Oswalt 2012; Oswalt et al. 2015), showcasing how national-scale data can inform research at smaller scales (Fig. 10.2). Regional analyses have also been conducted for some areas. Gray (2008) noted that one or more non-native species were recorded on 63% of all sampled plots in Oregon and Washington. The discrepancy between results from Gray (2008) and the national map presented in Fig. 10.2
Fig. 10.2 Percent of forested subplots invaded by one or more monitored plant species as collected by the USDA Forest Service Forest Inventory and Analysis program
10 Inventory and Monitoring of Invasive Species
236
is most likely due to analysis of different lists of which species are considered non-native versus invasive or “monitored.” Similarly, FIA invasive plant data have been used to highlight the continued northward expansion of Chinese tallowtree (Triadica sebifera), an invasive in the southern U.S. Coastal Plain. Reports based on FIA data documenting tallowtree expansion were picked up by local and regional news organi-zations and received extensive coverage. This increased expo-sure may increase private landowner awareness and, potentially, influence public response and behavior.
Recently, invasive plant data collected by the FIA program and compiled nationally has led to significant advancements in understanding biological invasions and working with large national datasets. Potter et al. (2016) outlined an approach using spatial neighborhood analy-sis to identify geographic areas with high and low inva-sive plant diversity across the United States. Invasive plant data collected by FIA have also been used to illus-trate the improved understanding of biotic resistance to invasions gained by accounting for sub-regional vari-ability in ecological processes (Iannone et al. 2016). When aggregated with trait-based data, this national dataset has also promoted the documentation of sub-con-tinental patterns of invasive species across the United States (Iannone et al. 2015a). In concert, recent utiliza-tion of FIA invasive plant data has helped advance the relatively new field of macroecology (Fei et al. 2015; Iannone et al. 2015b). However, issues related to consis-tency among the FIA programs, including which species are identified or recorded as invasive, should be consid-ered when using this large national database. Increased consistency among the FIA programs would help to eliminate these issues.
10.2.2 Natural Resources Conservation Service National Resources Inventory
Invasive plants in rangeland systems can differ greatly from invasive plants in forests, although there is often overlap in drier forest ecosystems. The NRI, the Bureau of Land Management (BLM), and the Forest Service all conduct inva-sive inventory and monitoring programs in range systems in the United States at varying scales. The NRI utilizes geo-graphic information systems (GIS), remotely sensed imagery, soil surveys, and climate models combined with line-point intercept data collected on the ground across 17 Western States from North Dakota to Texas and westward to estimate invasive plant species distribution (Breidt and Fuller 1999; Nusser and Goebel 1997). Recent analyses of NRI data have demonstrated that 48% of rangeland area and 50% of total rangeland plant cover are impacted by invasive plants (Herrick et al. 2010).
10.2.3 USDA Forest Service Forest Health Protection Program
Detection and monitoring are critical components of effec-tive invasive insect and disease management. Risk assess-ments, pathway analysis, and early detection (Chap. 6) are critical to cost-effective eradication and management actions. Once invasive insects and pathogens are established, continuing surveys to delimit their spread and monitor asso-ciated impacts are important.
The FHP program of the Forest Service provides a broad- scale example of the strength of survey and monitor-ing for invasive insects and disease. Forest Health Protection works closely with a network of forest health specialists in States, tribes, universities, and other Federal agencies to conduct broad-scale surveillance and reporting of insect and disease infestations. Each year, FHP and partners con-duct systematic aerial and ground-based pest detection sur-veys on 400–500 million acres of forest lands across the United States. Although these surveys may not be targeted specifically at invasive species, any damage or infestation detected is checked for causal agent which may be an inva-sive species.
Forest Health Protection also coordinates several inva-sive insect- and pathogen-specific surveys to detect or delimit newly introduced or established species (e.g., detec-tion surveys for bark and ambrosia beetles, sudden oak death (Phytophthora ramorum), walnut twig beetle (Pityophthorus juglandis), and hemlock woolly adelgid (Adelges tsugae)). The Slow the Spread program is a coop-erative program conducted by the Forest Service FHP, the USDA Animal and Plant Health Inspection Service (APHIS), and State partners to detect, monitor, and treat gypsy moth (Lymantria dispar) infestations throughout the United States (Chap. 7). In the uninfested areas of the West and South, APHIS works with States and other partners to conduct systematic surveys for the European and Asian sub-species of gypsy moth. The basis for the Slow the Spread Program is a grid of pheromone- baited traps that are deployed along the leading edge of the infestation to moni-tor male moth captures and is used to help make future treat-ment decisions.
The FHP Forest Health Monitoring (FHM) program, in coordination with FIA, collects data on the condition of the Nation’s forests and the impacts of invasive species over time. Combining data from FIA plots and pest survey data, FHM conducts analyses to report on tree health and other ecosystem components. Forest Health Monitoring disseminates survey and monitoring data in annual pest conditions reports and through an online database (https://www.fs.fed.us/foresthealth/protecting-forest/forest-health- monitoring/).
S. Oswalt et al.
237
10.2.4 U.S. Geological Survey Nonindigenous Aquatic Species Program
While most aquatic species are monitored at local or regional scales, there is an effort to compile information from small- scale monitoring programs adequate to meet national infor-mation needs. The USGS NAS Database maintains a nationwide data repository and reporting, tracking, and alert system for more than 1100 aquatic invertebrates, aquatic plants, freshwater animals, and marine fish that has been operational for over 30 years. The NAS database is spatially referenced and provides data that can be queried, species profiles, spatial data sets, distribution maps, and general information related to invasives. Information is obtained from literature, museums, agency biologists, and online reporting by the general public. The NAS database is used by State, Federal, and non-governmental agencies for a wide variety of research and management needs, including learn-ing about new introductions to their localities or regions in real time. The NAS database also accounts for the movement of invasives from other countries into the United States by tracking imports from foreign countries (Fuller and Cannister 2013).
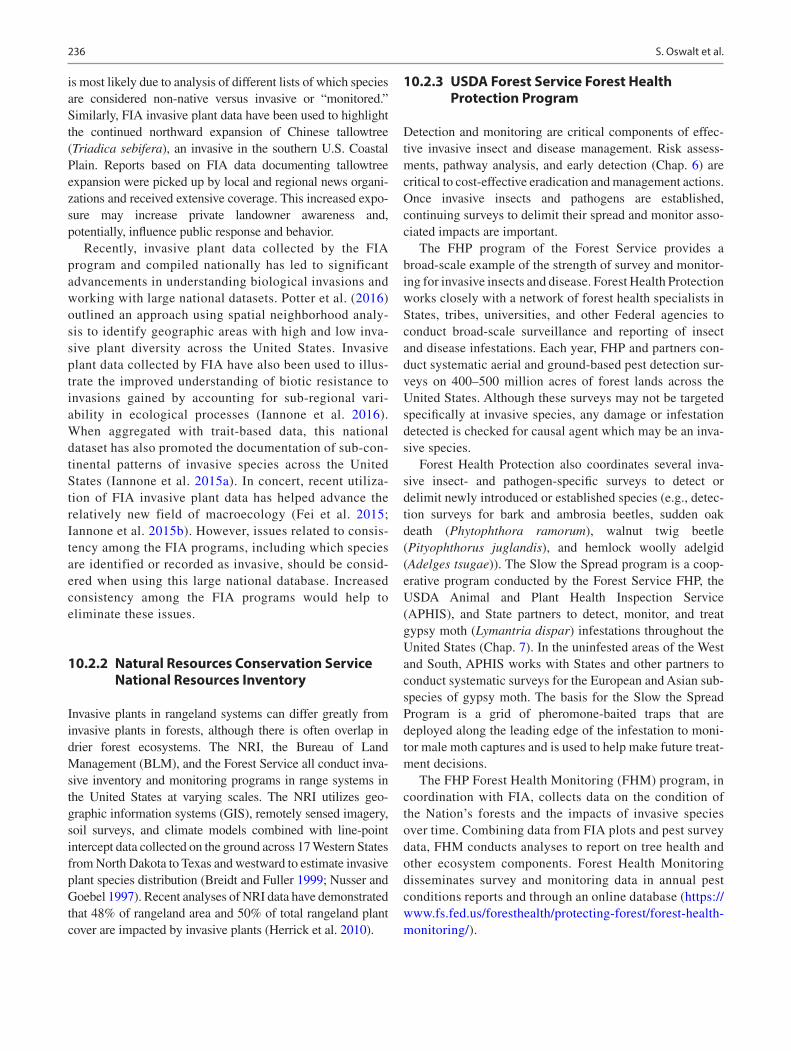
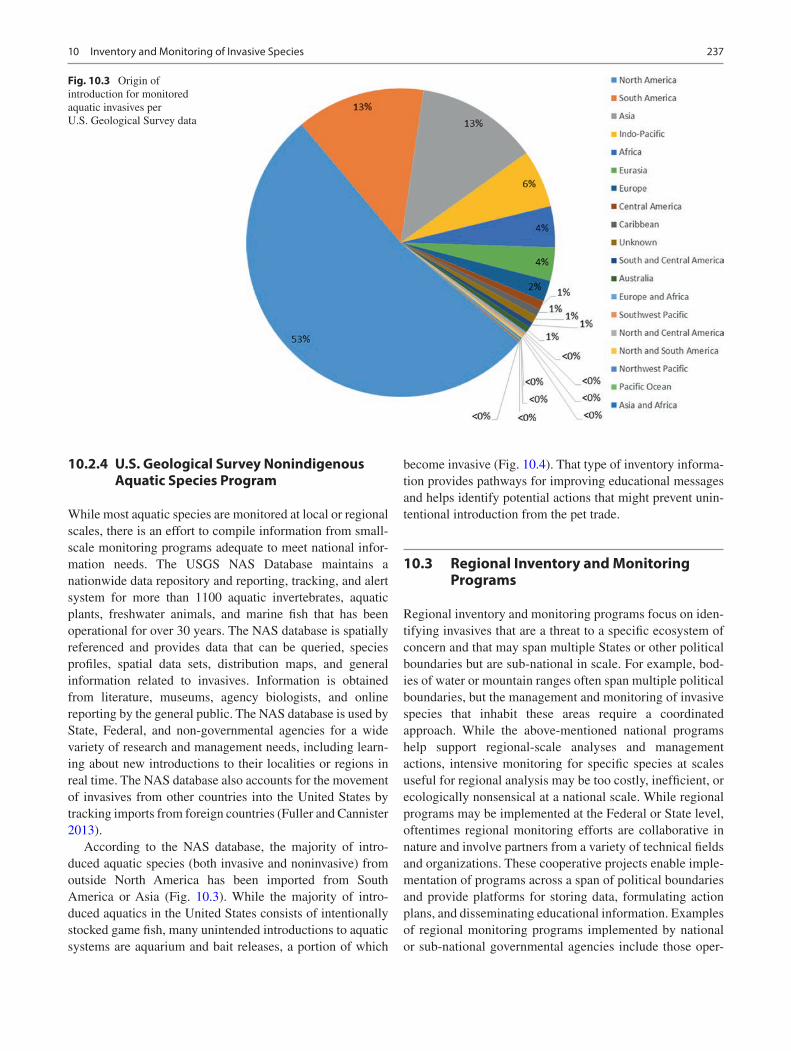
According to the NAS database, the majority of intro-duced aquatic species (both invasive and noninvasive) from outside North America has been imported from South America or Asia (Fig. 10.3). While the majority of intro-duced aquatics in the United States consists of intentionally stocked game fish, many unintended introductions to aquatic systems are aquarium and bait releases, a portion of which
become invasive (Fig. 10.4). That type of inventory informa-tion provides pathways for improving educational messages and helps identify potential actions that might prevent unin-tentional introduction from the pet trade.
10.3 Regional Inventory and Monitoring Programs
Regional inventory and monitoring programs focus on iden-tifying invasives that are a threat to a specific ecosystem of concern and that may span multiple States or other political boundaries but are sub-national in scale. For example, bod-ies of water or mountain ranges often span multiple political boundaries, but the management and monitoring of invasive species that inhabit these areas require a coordinated approach. While the above-mentioned national programs help support regional-scale analyses and management actions, intensive monitoring for specific species at scales useful for regional analysis may be too costly, inefficient, or ecologically nonsensical at a national scale. While regional programs may be implemented at the Federal or State level, oftentimes regional monitoring efforts are collaborative in nature and involve partners from a variety of technical fields and organizations. These cooperative projects enable imple-mentation of programs across a span of political boundaries and provide platforms for storing data, formulating action plans, and disseminating educational information. Examples of regional monitoring programs implemented by national or sub-national governmental agencies include those oper-
Fig. 10.3 Origin of introduction for monitored aquatic invasives per U.S. Geological Survey data
10 Inventory and Monitoring of Invasive Species
238
ated by the National Oceanic and Atmospheric Administration (NOAA) Great Lakes Environmental Research Laboratory, which inventories the Great Lakes for species like the highly reproductive zebra mussel (Dreissena polymorpha), and the NOAA Southeast Fisheries Science Center, which investigates invasive species in the Southeastern United States. Examples of multi-organiza-tional inventory and monitoring cooperatives, partnerships, and working groups are widespread and varied and cannot be adequately documented here. However, one example is the St. Lawrence Eastern Lake Ontario Partnership for Regional Invasive Species Management (SLELO PRISM), which formed in 2011 to provide region-wide coordination for invasive species monitoring and management across the terrestrial and aquatic ecosystems within five counties around Lake Ontario.
As mentioned earlier, the NAS also contains regionally collected information. A significant amount of effort has been spent in recent years monitoring Asian carp (Cyprinus spp.) in the upper Mississippi River drainage and the Great Lakes, and though this sampling effort is specific to carp, it may detect other species. Some of the most sam-pled-for species are the zebra mussel and quagga mussel (Dreissena bugensis). Because of the habitat-changing effects they have, there are concerted efforts nationwide to detect these species in waters where they do not occur. Now that they have largely spread through much of the Mississippi Basin, detection efforts are largely concen-trated in the West. Plankton samples are checked for veli-gers, and surfaces are checked for attached adults. Several natural resource agencies are currently working together to ensure that the Columbia River Basin is adequately monitored. These groups pool their anticipated sampling
locations yearly in an effort to avoid duplication or data gaps.
The Aquatic Nuisance Species (ANS) Program of the U.S. Fish and Wildlife Service (USFWS) is another example of regional targeted monitoring. The ANS program is focused on species-specific monitoring in targeted ecosystems (e.g., zebra mussels in the Great Lakes). The ANS program has been a significant partner in the Great Lakes Restoration Initiative in which efforts are underway to use new and emerging monitoring technologies such as environmental DNA (see Chap. 8) to track invasive aquatic density in and around the Great Lakes. The USFWS also tracks invasive species on 545 national wildlife refuges, encompassing approximately 96 million acres across the United States. While monitoring programs are generally focused on singu-lar or small groups of refuges and targeted toward localized management efforts, data can be aggregated to address larger scale issues and analyses.
Consistent with monitoring that occurs within the National Wildlife Refuge System of the USFWS, agencies such as the National Park Service (NPS), BLM, Bureau of Indian Affairs (BIA), and the Forest Service National Forest System (NFS) all monitor invasive species locally across multiple taxa. The NPS Inventory and Monitoring Vital Signs Monitoring pro-gram is currently collecting data on invasive plant and animal species in 238 park units. At least 229 park units are collect-ing data for invasive plant species, and 29 park units are col-lecting data on invasive animal species (see https://www.nps.gov/subjects/invasive/index.htm). The BLM’s Assessment, Inventory, and Monitoring (AIM) Strategy for Integrated Renewable Resources Management was developed in 2011 with the goal of developing consistent monitoring procedures to be utilized across all BLM- stewarded land. The BLM AIM
Fig. 10.4 Identified aquatic invasive introduction pathways per U.S. Geological Survey data
S. Oswalt et al.
239
program provides for consistent monitoring data of invasive species on a localized level (individual BLM land units) that can facilitate easily combining data for larger scale analyses. Through the BIA Agriculture and Rangeland Development Inventory Program, small-scale monitoring occurs to address localized infestations with a strong emphasis on managing the monitored infestations. Much like the agency programs immediately above, the Forest Service tracks invasive species on each individual national forest. Attempts are made to col-lect data consistently to facilitate aggregation of data across all regions of the NFS.
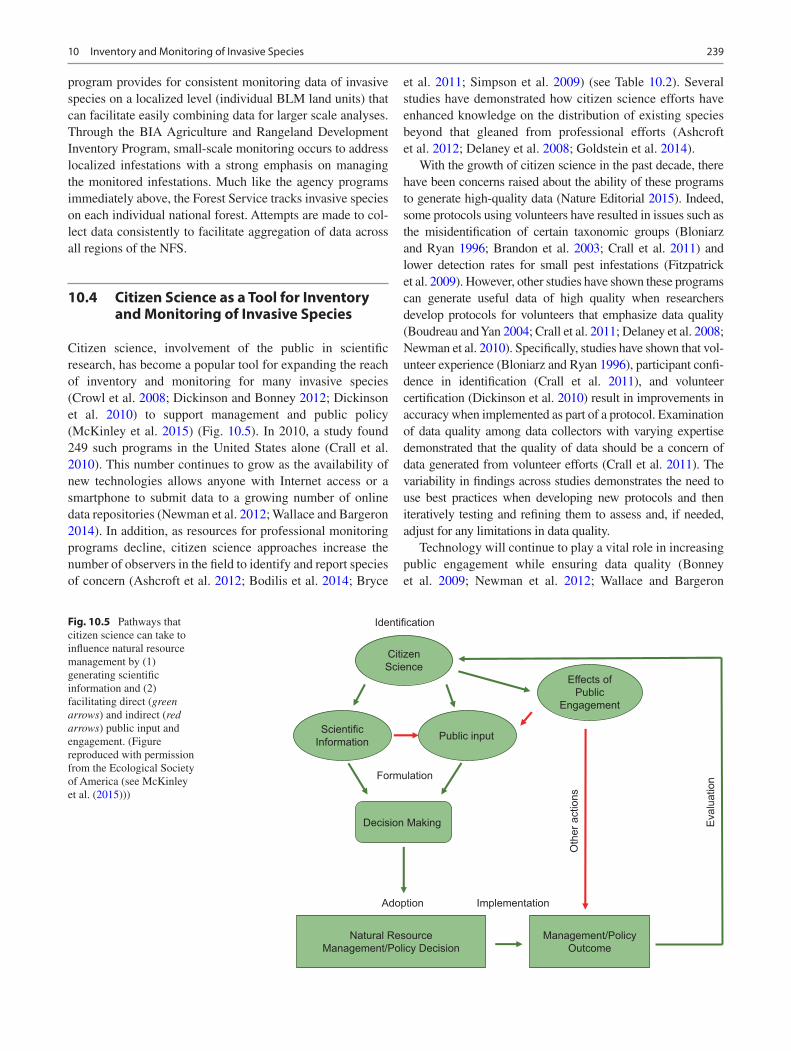
10.4 Citizen Science as a Tool for Inventory and Monitoring of Invasive Species
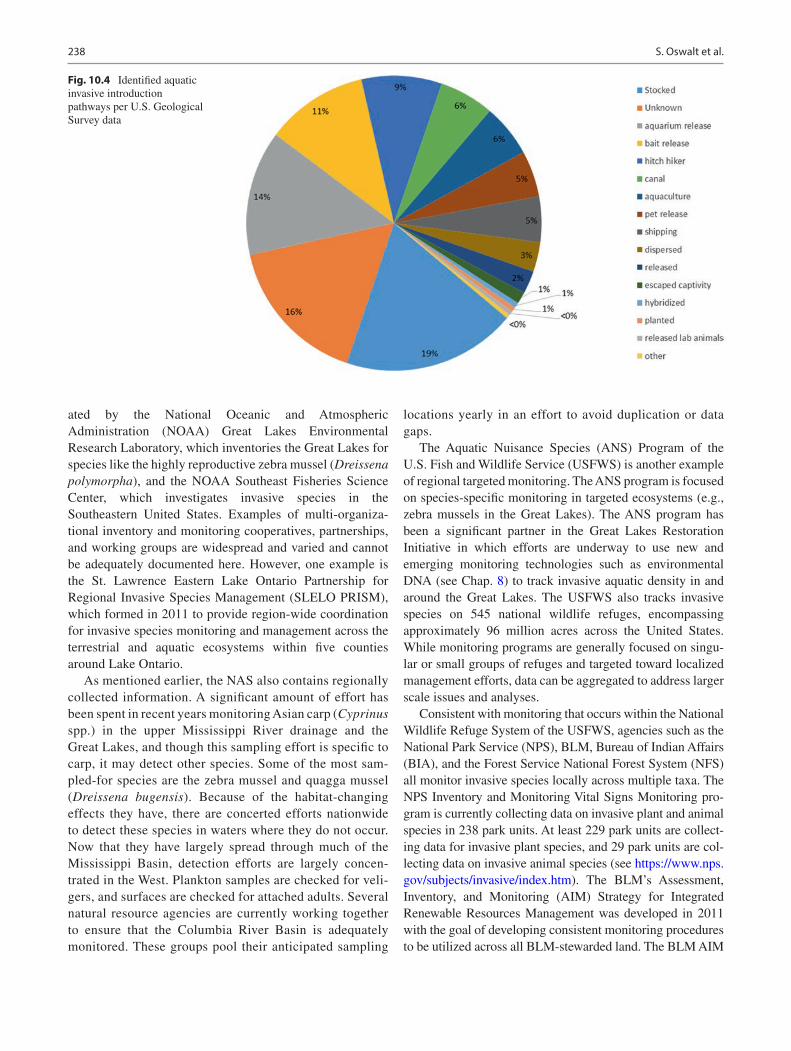
Citizen science, involvement of the public in scientific research, has become a popular tool for expanding the reach of inventory and monitoring for many invasive species (Crowl et al. 2008; Dickinson and Bonney 2012; Dickinson et al. 2010) to support management and public policy (McKinley et al. 2015) (Fig. 10.5). In 2010, a study found 249 such programs in the United States alone (Crall et al. 2010). This number continues to grow as the availability of new technologies allows anyone with Internet access or a smartphone to submit data to a growing number of online data repositories (Newman et al. 2012; Wallace and Bargeron 2014). In addition, as resources for professional monitoring programs decline, citizen science approaches increase the number of observers in the field to identify and report species of concern (Ashcroft et al. 2012; Bodilis et al. 2014; Bryce
et al. 2011; Simpson et al. 2009) (see Table 10.2). Several studies have demonstrated how citizen science efforts have enhanced knowledge on the distribution of existing species beyond that gleaned from professional efforts (Ashcroft et al. 2012; Delaney et al. 2008; Goldstein et al. 2014).
With the growth of citizen science in the past decade, there have been concerns raised about the ability of these programs to generate high-quality data (Nature Editorial 2015). Indeed, some protocols using volunteers have resulted in issues such as the misidentification of certain taxonomic groups (Bloniarz and Ryan 1996; Brandon et al. 2003; Crall et al. 2011) and lower detection rates for small pest infestations (Fitzpatrick et al. 2009). However, other studies have shown these programs can generate useful data of high quality when researchers develop protocols for volunteers that emphasize data quality (Boudreau and Yan 2004; Crall et al. 2011; Delaney et al. 2008; Newman et al. 2010). Specifically, studies have shown that vol-unteer experience (Bloniarz and Ryan 1996), participant confi-dence in identification (Crall et al. 2011), and volunteer certification (Dickinson et al. 2010) result in improvements in accuracy when implemented as part of a protocol. Examination of data quality among data collectors with varying expertise demonstrated that the quality of data should be a concern of data generated from volunteer efforts (Crall et al. 2011). The variability in findings across studies demonstrates the need to use best practices when developing new protocols and then iteratively testing and refining them to assess and, if needed, adjust for any limitations in data quality.
Technology will continue to play a vital role in increasing public engagement while ensuring data quality (Bonney et al. 2009; Newman et al. 2012; Wallace and Bargeron
Natural ResourceManagement/Policy Decision
Management/PolicyOutcome
Decision Making
CitizenScience
ScientificInformation
Effects ofPublic
Engagement
Public input
Formulation
Adoption Implementation
Eva
luat
ion
Oth
er a
ctio
ns
IdentificationFig. 10.5 Pathways that citizen science can take to influence natural resource management by (1) generating scientific information and (2) facilitating direct (green arrows) and indirect (red arrows) public input and engagement. (Figure reproduced with permission from the Ecological Society of America (see McKinley et al. (2015)))
10 Inventory and Monitoring of Invasive Species
240
2014). Additional details on the availability of tools and technology are provided in Chap. 11. The project iNaturalist uses a crowd-sourced approach where the online community must agree with the identification of a species made by an observer. Based on the level of community agreement with the observation, the observation will be tagged as “casual” or “research” grade. Other projects, like eBird, have embedded code that automatically performs data quality checks on new sightings entered into the system (Bonter and Cooper 2012). Photo vouchers uploaded to regional websites that include a network of trained taxonomists facilitate rapid verification and response for this and other projects (Crall et al. 2012; Simpson et al. 2009).
As researchers and managers begin to adopt citizen sci-ence more broadly, efforts should be initiated to better inte-grate the data collection efforts of both professionals and volunteers. Through data synergy, researchers and natural resource managers can fill gaps in species distributions to support the development of habitat suitability models that can be used to predict future spread (Ashcroft et al. 2012; Crall et al. 2015; Crowl et al. 2008; Lodge et al. 2006). Less rigorous monitoring approaches can also be used to inform more rigorous approaches (Aslan and Rejmanek 2010). For example, Crall et al. (2010) propose an iterative sampling design that integrates monitoring efforts of these two groups guided by habitat suitability models. It distinguishes the role of the professional from the volunteer and provides recom-mendations to build on the benefits and weaknesses of each approach. Testing of this approach in the field indicated more species could be found with less sampling effort (Crall et al. 2015). Protocols utilizing and building upon both volunteer and professional data collection in the field have been pro-posed and tested but not broadly implemented.
Since a majority of volunteer data is collected opportunis-tically (Crall et al. 2010), sampling design and other moni-toring procedures should be considered when designing as well as integrating data from these multiple groups. Appropriate metadata can be used to provide the necessary information to help identify only those data appropriate to address certain research questions (Dickinson et al. 2010).
10.5 Integration Across Scales
Monitoring at multiple geographic scales delivers unique strengths but may also impart some misperceptions. Researchers must recognize that monitoring and inventory systems at large scales are useful for different management goals and storytelling than are monitoring and inventory pro-grams at local levels. For example, at a local scale, an infes-tation by an invasive species may severely impact a resource, but that impact may be limited to a particular waterbody, for-est, or neighborhood. Thus, to the local community, that invasive species may be a serious threat to local biodiversity or economies. In contrast, the same invasive species may be relatively limited at a regional or national scale. This “prob-lem of scale” can become particularly challenging when sci-entists studying impacts at the stand level (for forests) or similar report devastating effects to the ecosystem in ques-tion, while impacts to the overall landscape remain relatively limited. Engaging scientists, landowners, managers, and politicians in discussions involving the impacts of species at various scales is important in developing invasive species prevention and management strategies.
One method of using large-scale inventory and monitor-ing data is that of “hot spot” detection and/or prioritizing where to direct resources at the broad scale. For example, in a map of invasive plant occurrence on southern U.S. forest land, it is immediately apparent where highly infested areas occur. Noting where these “hot spots” exist can help direct resources to the edges of those hotspots in surrounding coun-ties to help potentially reduce the spread of species beyond their current boundaries.
10.6 Key Findings, Gaps, and Challenges in Inventory and Monitoring
10.6.1 Key Findings
• Inventory and monitoring of invasive species across mul-tiple scales and taxa are integral to understanding where to focus management time, effort, and financial resources.
Table 10.2 General resources available for designing an effective citizen science program
Resource Description WebsiteCitizen Science Association International membership- based organization
advancing the field; manages a community listservhttps://www.citizenscience.org
Citizen Science: Theory and Practice
Open-access, peer-reviewed journal for the field https://theoryandpractice.citizenscienceassociation.org
Early Detection and Distribution Mapping System
Web-based mapping system with smartphone applications for documenting invasive species distribution
https://www.eddmaps.org
SciStarter Database of existing citizen science projects searchable by category
https://scistarter.com
Federal Crowdsourcing and Citizen Science Toolkit
Toolkit developed for Federal agencies on how to design and maintain citizen science projects
https://www.citizenscience.gov/toolkit
S. Oswalt et al.
241
• National and sub-national programs are considered sur-veillance monitoring programs and can be used to iden-tify invasive species “hot-spots,” to monitor spread, and to conduct other broad-scale studies.
• Early detection of the spread of species is the most cost- effective method for controlling invasives, yet most national programs are better suited for monitoring spread rather than early detection.
• Assessment of inventory data has revealed that invasives impact a broad portion of the terrestrial and aquatic landscape.
• Tracking invasive species will become increasingly important in light of a changing climate because invasive species are generally well suited to rapid establishment in novel systems.
• The use of citizen science in monitoring is becoming an increasingly accepted and utilized method for collecting information.
10.6.2 Key Information Needs
Despite the need for inventory and monitoring, and the wide variety of programs and multiple scales tasked with tracking invasive species, there are still gaps in knowledge and chal-lenges related to inventory and monitoring.
• Paucity of Spatially Referenced Standardized Data Although national programs exist, the scale of spatial data is still broad, and generating simple distribution data for many species remains a challenge, especially recently identified species not yet on monitoring lists and species in non-forest systems and aquatic habitats. There is also a significant need to standardize inventory approaches among agencies and partners. Many organizational datas-ets and citizen science datasets containing invasive spe-cies data remain isolated. Opportunities for improvement include working to create consistency within and among programs regionally and nationally, integrating isolated monitoring programs, and developing additional method-ologies for monitoring certain taxa (e.g., insects, disease, and genetics). There is also a need to integrate profes-sional and volunteer datasets for monitoring and early detection/rapid response across political boundaries.
• Longitudinal Datasets Many inventory programs are conducted at temporal scales that do not allow assessment of drivers of invasive species spread. These types of data-sets are needed to understand how invasive species may respond to climate change and other environmental stress-ors or disturbances.
• Adoption and Reliability of Citizen Science and Project Design There are still concerns among managers
and researchers regarding the quality of citizen science data. These concerns need to be adequately addressed to broaden the adoption of citizen science as a tool to moni-tor and manage invasive species. Existing and future research on project successes should be used to support the establishment of new and iterative citizen science projects.
• New Survey and Monitoring Techniques for Non- native Insects and Pathogens New tools and technolo-gies for inventory and monitoring need to be developed and deployed to improve inventory and monitoring of those species that are challenging to survey.
Literature Cited
Ashcroft MB, Gollan JR, Batley M (2012) Combining citizen science, bioclimatic envelope models and observed habitat preferences to determine the distribution of an inconspicuous, recently detected introduced bee (Halictus smaragdulus Vachal Hymenoptera: Halictidae) in Australia. Biol Invasions 14:515–527
Aslan CE, Rejmanek M (2010) Avian use of introduced plants: orni-thologist records illuminate interspecific associations and research needs. Ecol Appl 20:1005–1020
Bechtold WA, Patterson PL (eds) (2005) The enhanced forest inven-tory and analysis program – national sampling design and esti-mation procedures, Gen. Tech. Rep. SRS-80. U.S. Department of Agriculture, Forest Service, Southern Research Station, Asheville, 85 p
Bloniarz DV, Ryan HDP (1996) The use of volunteer initiatives in con-ducting urban forest resource inventories. J Arboric 22:75–82
Bodilis P, Louisy P, Draman M et al (2014) Can citizen science sur-vey non-indigenous fish species in the eastern Mediterranean Sea? Environ Manag 53:172–180
Bonney R, Cooper CB, Dickinson J et al (2009) Citizen science: a developing tool for expanding science knowledge and scientific lit-eracy. Bioscience 59:977–984
Bonter DN, Cooper CB (2012) Data validation in citizen science: a case study from Project FeederWatch. Front Ecol Environ 10:305–307
Boudreau SA, Yan ND (2004) Auditing the accuracy of a volunteer- based surveillance program for an aquatic invader Bythotrephes. Environ Monit Assess 91:17–26
Brandon A, Spyreas G, Molano-Flores B et al (2003) Can volunteers provide reliable data for forest vegetation surveys? Nat Areas J 23:254–261
Breidt FJ, Fuller WA (1999) Design of supplemented panel surveys with application to the National Resources Inventory. J Agric Biol Environ Stat 4:391–403
Bryce R, Oliver MK, Davies L et al (2011) Turning back the tide of American mink invasion at an unprecedented scale through com-munity participation and adaptive management. Biol Conserv 144:575–583
Byers JE, Reichard S, Randall JM et al (2002) Directing research to reduce the impacts of nonindigenous species. Conserv Biol 16:630–640
Crall AW, Newman GJ, Jarnevich C et al (2010) Improving and inte-grating data on invasive species collected by citizen scientists. Biol Invasions 12:3419–3428
Crall AW, Newman G, Waller DM et al (2011) Assessing citizen science data quality: an invasive species case study. Conserv Lett 4:433–442
10 Inventory and Monitoring of Invasive Species
242
Crall AW, Renz M, Panke BJ et al (2012) Developing cost-effective early detection networks for regional invasions. Biol Invasions 14:2461–2469
Crall AW, Jarnevich CS, Young NE et al (2015) Citizen science contrib-utes to our knowledge of invasive plant species distributions. Biol Invasions 17:2415–2427
Crowl TA, Crist TO, Parmenter RR et al (2008) The spread of invasive species and infectious disease as drivers of ecosystem change. Front Ecol Environ 6:238–246
Delaney DG, Sperling CD, Adams CS, Leung B (2008) Marine invasive species: validation of citizen science and implications for national monitoring networks. Biol Invasions 10:117–128
Dickinson JL, Bonney R (eds) (2012) Citizen science: public partici-pation in environmental research. Comstock Publishing Associates, Ithaca, 304 p
Dickinson JL, Zuckerberg B, Bonter DN (2010) Citizen science as an ecological research tool: challenges and benefits. Annu Rev Ecol Evol Syst 41:149–172
Fei S, Iannone BV III, Oswalt CM et al (2015) Understanding mac-roscale invasion patterns and processes with FIA data. In: Stanton SM, Christensen GA (eds) Pushing boundaries: new directions in inventory techniques and applications. Forest Inventory and Analysis (FIA) symposium 2015, December 8–10, Portland, OR, Gen. Tech. Rep. PNW-GTR-931. U.S. Department of Agriculture, Forest Service, Pacific Northwest Research Station, Portland, pp 92–93
Fitzpatrick MC, Preisser EL, Ellison AM, Elkinton JS (2009) Observer bias and the detection of low-density populations. Ecol Appl 19:1673–1679
Fuller P, Cannister M (2013) USGS nonindigenous aquatic species data-base with a focus on the introduced fishes of the lower Tennessee and Cumberland drainages. In: Johansen R, Estes LD, Hamilton SW, Barrass AN (eds) On the natural history of lower Tennessee and Cumberland River Valleys. Center for Excellence for Field Biology, Austin Peay State University, Clarksville, pp 29–42
Goldstein EA, Lawton C, Sheehy E, Butler F (2014) Locating species range frontiers: a cost and efficiency comparison of citizen science and hair-tube survey methods for use in tracking an invasive squir-rel. Wildl Res 41:64–75
Gray A (2008) Monitoring and assessment of regional impacts from nonnative invasive plants in forests of the Pacific Coast, United States. In: Kohli RK, Jose S, Singh HP, Batish DR (eds) Invasive plants and forest ecosystems. CRC Press, Boca Raton, pp 217–235
Hellmann JJ, Byers JE, Bierwagen BG, Dukes JS (2008) Five potential consequences of climate change for invasive species. Conserv Biol 22:534–543
Herrick JE, Lessard VC, Spaeth KE et al (2010) National ecosystem assessments supported by scientific and local knowledge. Front Ecol Environ 8:403–408
Iannone BV III, Oswalt CM, Liebhold AM et al (2015a) Region- specific patterns and drivers of macroscale forest plant invasions. Divers Distrib 21:1181–1192
Iannone BV III, Potter KM, Guo Q et al (2015b) Biological invasion hotspots: a trait-based perspective reveals new sub-continental pat-terns. Ecography 38:1–9
Iannone BV III, Potter KM, Hamil KD et al (2016) Evidence of biotic resistance to invasions in forests of the Eastern USA. Landsc Ecol 31:85–99
Lodge DM, Williams S, MacIsaac HJ et al (2006) Biological inva-sions: recommendations for US policy and management. Ecol Appl 16:2035–2054
McKinley DC, Miller-Rushing AJ, Ballard HL et al (2015) Investing in citizen science can improve natural resource management and environmental protection. Issues Ecol 19:1–27
Myers JH, Simberloff D, Kuris AM, Carey JR (2000) Eradication revis-ited: dealing with exotic species. Trends Ecol Evol 15:316–320
Nature Editorial (2015) Rise of the citizen scientist. Nature 524:265Newman G, Crall A, Laituri M et al (2010) Teaching citizen science
skills online: implications for invasive species training programs. Appl Environ Educ Commun 9:276–286
Newman G, Wiggins A, Crall A et al (2012) The future of citizen sci-ence: emerging technologies and shifting paradigms. Front Ecol Environ 10:298–304
Nichols JD, Williams BK (2006) Monitoring for conservation. Trends Ecol Evol 21:668–673
Nusser SM, Goebel JJ (1997) The national resources inventory: a long- term multi-resource monitoring programme. Environ Ecol Stat 4:181–204
Oswalt SN, Oswalt CM (2012) The national picture of nonnative plants in the United States according to FIA data. In: Morin RS, Liknes GC (eds) Moving from status to trends: forest inventory and analysis (FIA) symposium 2012; 2012 December 4–6; Baltimore, MD, Gen. Tech. Rep. NRS-P-105. U.S. Department of Agriculture, Forest Service, Northern Research Station. [CD-ROM], Newtown Square, pp 262–267
Oswalt CM, Fei S, Guo Q et al (2015) A subcontinental view of forest plant invasions. NeoBiota 24:49–54
Potter KM, Koch FH, Oswalt CM, Iannone BV (2016) Data, data every-where: detecting spatial patterns in fine-scale ecological informa-tion collected across a continent. Landsc Ecol 31:67–84
Simpson A, Jarnevich C, Madson J et al (2009) Invasive species information networks: collaboration at multiple scales for preven-tion, early detection, and rapid response to invasive alien species. Biodiversity 10:5–13
Wallace RD, Bargeron CT (2014) Identifying invasive species in real time: early detection and distribution mapping system (EDDMapS) and other mapping tools. In: Ziska LH, Dukes JS (eds) Invasive species and global climate change. CABI, Wallingford, pp 219–231
Open Access This chapter is licensed under the terms of the Creative Commons Attribution 4.0 International License (http://creativecommons.org/licenses/by/4.0/), which permits use, sharing, adaptation, distribution and reproduction in any medium or format, as long as you give appropri-ate credit to the original author(s) and the source, provide a link to the Creative Commons license and indicate if changes were made.
The images or other third party material in this chapter are included in the chapter’s Creative Commons license, unless indicated otherwise in a credit line to the material. If material is not included in the chapter’s Creative Commons license and your intended use is not permitted by statu-tory regulation or exceeds the permitted use, you will need to obtain permission directly from the copyright holder.
S. Oswalt et al.