inventory and flow time in the us manufacturing industry morris, joshua lubell, and dr. vijay...
TRANSCRIPT
NIST Technical Note 1890
Inventory and Flow Time in the US
Manufacturing Industry
Douglas S. Thomas
Anand M. Kandaswamy
This publication is available free of charge from:
http://dx.doi.org/10.6028/NIST.TN.1890


NIST Technical Note 1890
Inventory and Flow Time in the US
Manufacturing Industry
Douglas S. Thomas
Anand M. Kandaswamy
Applied Economics Office
Engineering Laboratory
This publication is available free of charge from:
http://dx.doi.org/10.6028/NIST.TN.1890
November 2015
U.S. Department of Commerce
Penny Pritzker, Secretary
National Institute of Standards and Technology
Willie E. May, Under Secretary of Commerce for Standards and Technology and Director of NIST

Certain commercial entities, equipment, or materials may be identified in this
document in order to describe an experimental procedure or concept adequately.
Such identification is not intended to imply recommendation or endorsement by the
National Institute of Standards and Technology, nor is it intended to imply that the
entities, materials, or equipment are necessarily the best available for the purpose.
National Institute of Standards and Technology Technical Note 1890
Natl. Inst. Stand. Technol. Tech. Note 1890, 31 pages (November 2015)
CODEN: NTNOEF
This publication is available free of charge from:
http://dx.doi.org/10.6028/NIST.TN.1890

i
Abstract
Advancements in the efficient use of inputs, such as land and labor, have been a key
driver of per capita income growth throughout history. One method for identifying
potential efficiency improvements is lean manufacturing or lean production, a set of tools
to assist in the identification and elimination of waste. Lean classifies waste into seven
categories: overproduction, transportation, rework/defects, over-processing, motion,
inventory, and waiting. Utilizing economic data, one can track the inventory and
transportation time along with the flow time (i.e., the amount of time a unit spends in
process), which reveals some of the categories of waste. This report identifies and
reviews data on manufacturing inventory and flow time along with data on inter-industry
interactions. It then develops a method for tracking the flow time of US manufactured
products. This method is illustrated for automotive and aircraft manufacturing.
Keywords: manufacturing; input output; automotive manufacturing; aircraft
manufacturing; flow time

ii

iii
Preface
This study was conducted by the Applied Economics Office in the Engineering
Laboratory at the National Institute of Standards and Technology. The study provides a
model for tracking manufacturing industry operations activity and illustrates the use of
the model in the automotive industry.
Disclaimer
Certain trade names and company products are mentioned in the text in order to
adequately specify the technical procedures and equipment used. In no case does such
identification imply recommendation or endorsement by the National Institute of
Standards and Technology, nor does it imply that the products are necessarily the best
available for the purpose.
Cover Photographs Credits
Microsoft Clip Art Gallery Images used in compliance with Microsoft Corporation’s non-
commercial use policy.

iv

v
Acknowledgements
The authors wish to thank all those who contributed so many excellent ideas and
suggestions for this report. Special appreciation is extended to Simon Frechette,
Katherine Morris, Joshua Lubell, and Dr. Vijay Srinivasan of the Engineering
Laboratory’s Systems Integration Division for their technical guidance, suggestions, and
support. Special appreciation is also extended to Dr. Robert Chapman and Dr. Jennifer
Helgeson of the Engineering Laboratory’s Applied Economics Office for their thorough
reviews and many insights. The authors also wish to thank Dr. Nicos Martys, of the
Materials and Structural Systems Division for his review.

vi

vii
Table of Contents
ABSTRACT .............................................................................................................................................. I
PREFACE ............................................................................................................................................... III
ACKNOWLEDGEMENTS ........................................................................................................................ V
TABLE OF CONTENTS ......................................................................................................................... VII
LIST OF FIGURES ................................................................................................................................ VIII
LIST OF TABLES .................................................................................................................................. VIII
1 INTRODUCTION ........................................................................................................................... 1
1.1 BACKGROUND ............................................................................................................................... 1 1.2 PURPOSE…………………………………………………………………………………………………………………………………2 1.3 SCOPE AND APPROACH ................................................................................................................... 2
2 GEOGRAPHIC SCOPE AND STANDARD DATA CATEGORIZATION ........................................... 3
2.1 GEOGRAPHIC SCOPE AND IMPORTED GOODS AND SERVICES .................................................................. 3 2.2 STANDARD DATA CATEGORIZATION .................................................................................................. 4
3 DATA AND METHODS .................................................................................................................. 7
3.1 DATA……………………………………………………………………………………………………………………………………..7 3.1.1 BEA Benchmark Input-Output Data ........................................................................................ 7 3.1.2 Inventory Data ........................................................................................................................ 9
3.2 METHODS…………………………………………………………………………………………………………………….……….10 3.2.1 Inter-Industry Linkages ......................................................................................................... 11 3.2.2 Inventory Turns ..................................................................................................................... 11 3.2.3 Industry Reiteration Rate ...................................................................................................... 12
4 TWO CASE STUDIES: AUTOMOBILE AND AIRCRAFT MANUFACTURING .............................. 15
4.1 AUTOMOTIVE MANUFACTURING .................................................................................................... 15 4.2 AIRCRAFT MANUFACTURING.......................................................................................................... 17
5 SUMMARY AND RECOMMENDATIONS FOR FUTURE RESEARCH .......................................... 23
5.1 SUMMARY……………………………………………………………………………………………………………………………..23 5.2 RECOMMENDATIONS FOR FUTURE RESEARCH ................................................................................... 23
APPENDIX A: INVENTORY AND FLOW TIME (DAYS): AUTOMOTIVE MANUFACTURING............. 26
APPENDIX B: INVENTORY AND FLOW TIME (DAYS): AIRCRAFT MANUFACTURING ................... 30

viii
List of Figures
Figure 2-1: US Manufacturing Supply Chain Value Added ............................................... 3
Figure 3-1: Illustration of Tracking a Material through an Industry ................................ 13 Figure 4-1: Automobile Manufacturing Supply Chain ..................................................... 18 Figure 4-2: Aircraft Manufacturing Supply Chain ........................................................... 19
List of Tables Table 2-1: North American Industry Classification System, Two Digit Codes ................. 5 Table 3-1: Part of a Make Table from the 2007 Benchmark Input-Output Data ................ 8
Table 3-2: Part of a Use Table from the 2007 Benchmark Input-Output Data ................... 8 Table 3-3: Annual Survey of Manufactures and Economic Census Inventory Data Layout
........................................................................................................................................... 10 Table 4-1: Longest Flow Path for Automobile Manufacturing ........................................ 16 Table 4-2: Aggregate Flow by Automotive Supply Chain Category ............................... 17
Table 4-3: Longest Flow Path for Aircraft Manufacturing ............................................... 20 Table 4-4: Aggregate Flow by Aircraft Supply Chain Category ...................................... 21

1
1 Introduction
1.1 Background Advancements in the efficient use of inputs, such as land and labor, have been a key
driver of per capita income growth throughout history. The private sector continuously
improves efficiency on its own; however, there are barriers to advancement in some areas
that require public resources. These are, typically, instances where the market outcome or
allocation of goods and services is not Pareto efficient; that is, it is possible to make one
person or entity better off without making another person or entity worse off.
One major barrier to advancement is explored in the book Public Goods, Public Gains by
the economists Albert N. Link and John T. Scott.1 The basic idea underlying Link and
Scott’s thesis is that there are goods and processes where the private hurdle rate, the rate
that determines whether one should invest in a project or not, is much higher than the
social hurdle rate.2 Building on the work of senior NIST economist Gregory Tassey and
Professor Adam B. Jaffe, Link and Scott show that when the private rate of return does
not exceed the private hurdle rate, then innovation is stifled for those cases where the
social rate of return is greater than the social hurdle rate. Thus, a great deal of publicly
beneficial innovation will not take place, absent a public commitment to funding.
NIST, a publicly-funded research organization, “promote[s] US innovation and industrial
competitiveness by advancing measurement science, standards, and technology in ways
that enhance economic security and improve our quality of life.”3 A significant focus for
NIST is in advancing innovation and industrial competitiveness by improving efficiency
in manufacturing. Unfortunately, in a world of scarce resources, there are limited public
funds; therefore, the efforts that have the greatest impact per dollar of public investment
are prioritized over those with a lower impact per dollar.
One method for identifying potential efficiency improvements is lean manufacturing or
lean production, a set of tools to assist in the identification and elimination of waste. Lean
classifies waste into seven categories:
1) Overproduction: occurs when more is produced than is currently required by
customers
2) Transportation: unnecessary transportation does not make any change to the
product and is a source of risk to the product
3) Rework/Defects: discarded defects result in wasted resources or extra costs
correcting the defect
1 See Tassey, Gregory. 2005. Underinvestment in Public Good Technologies. Journal of Technology
Transfer 30: 89-113 and Jaffe, Adam B. 1998. The Importance of ‘Spillovers’ in the Policy Mission of the
ATP. Journal of Technology Transfer 23: 11-19. 2 Link, Albert N. and John T. Scott. Public Goods, Public Gains: Calculating the Social Benefits of Public
R&D. 2011. pp.6-7. 3 National Institute of Standards and Technology. NIST General Information.
<http://www.nist.gov/public_affairs/general_information.cfm>
2
4) Over-processing: occurs when more work is done than is necessary
5) Motion: unnecessary motion results in unnecessary expenditure of time and
resources
6) Inventory: is similar to that of overproduction and results in the need for
additional handling, space, people, and paperwork to manage extra product
7) Waiting: when workers and equipment are waiting for material and parts, these
resources are being wasted
Utilizing economic data, one can track the inventory and transportation time along with
the flow time (i.e., the amount of time a unit spends in process), which can reveal
potential categories of waste. Although the data does not break out every category, it does
encapsulate the total time for a selected product. For example, flow time does not break
out overproduction, rework, or over-processing, but these activities are included in the
average flow time.
1.2 Purpose This report identifies and reviews data on manufacturing inventory and flow time along
with data on inter-industry interactions. It then develops a method for tracking the flow
time of US manufactured products. This method is illustrated for automotive and aircraft
manufacturing.
1.3 Scope and Approach This report takes principles found in operations management and applies them at the
industry level. Operations management refers to the business practices that pursue the
highest level of efficiency within an organization. It is concerned with converting inputs
into outputs as efficiently as possible. Typically, it refers to management at the
organization or firm level. This report identifies a method for tracking industry operations
activity and illustrates this method using a case study of automotive manufacturing and
aircraft manufacturing.
We first discuss the geographic scope of this study and standard data categorization in
Section 2. The data and methods are presented in Section 3. It includes a discussion of the
Annual Survey of Manufactures and the BEA Benchmark Input-Output data. Also
discussed is inventory turns and a proposed industry reiteration rate. Section 4 uses the
method discussed and illustrates it for automobile manufacturing and aircraft
manufacturing. Section 5 presents a summary and recommendations for future research.

3
2 Geographic Scope and Standard Data Categorization
2.1 Geographic Scope and Imported Goods and Services Many change agents are concerned with a certain group of people or organizations. Since
NIST is concerned with "US innovation and competitiveness," this report focuses on
activities within the national borders. In a world of globalization, this effort is
challenging, as some of the parts and materials being used in US manufacturing activities
are imported. NIST Technical Note 1810 examined the proportion of the US
manufacturing supply chain that is imported. The value added for the U.S. manufacturing
industry and its supply chain is presented in Figure 2-1. It should be noted that
manufacturing supply chains have their own unique characteristics and performance
metrics.4 The values in the figure progress from top to bottom, starting with foreign
activities used in US manufacturing and progressing to domestic activities. The values at
the top, shown in red, represent value added that is imported to the U.S. for use by the
manufacturing industry. The top value, shown in a lighter red, represents intermediate
imported non- manufactured goods and services, such as raw materials from mining. The
second one, shown in a darker red, represents intermediate imported manufactured goods
used by the U.S. manufacturing industry. Domestic U.S. manufacturing activity is shown
in three shades of blue. The light blue represents intermediate non-manufactured goods
Figure 2-1: US Manufacturing Supply Chain Value Added
Source: Thomas, Douglas S. The US Manufacturing Value Chain: An International Perspective. February 2014. NIST Technical Note
1810. <http://www.nist.gov/customcf/get_pdf.cfm?pub_id=914022>
4 Gunasekaran, A., Patel, C., & Tirtiroglu, E., 2001 "Performance measures and metrics in a supply chain
environment." International Journal of Operations & Production Management 21, no. 1/2: 71-87.
0
500
1000
1500
2000
2500
3000
1995 1996 1997 1998 1999 2000 2001 2002 2003 2004 2005 2006 2007 2008 2009
Foreign Intermediate Non-manufacturing 111 117 124 116 129 155 140 137 150 180 206 227 235 253 181
Foreign Intermediate Manufacturing 98 97 102 103 111 118 101 100 101 124 129 133 131 118 89
U.S. Intermediate Non-manufacturing 609 635 677 686 712 726 717 696 705 691 707 692 723 657 628
U.S. Intermediate Manufacturing 883 888 939 1009 1057 1034 971 1003 980 1003 988 981 945 820 860
U.S. Final Product 664 671 711 762 758 742 705 716 722 763 780 794 807 758 742
$B
illio
n 2
00
9
4
and services, such as agricultural products or finance products, produced in the U.S. and
used by the U.S. manufacturing industry. The darker blue represents intermediate
manufactured products used by the U.S. manufacturing industry; for example, a bolt used
to assemble a car. The bottom value, shown in a dark blue, represents final products
manufactured in the U.S. As can be seen in the figure, the imported values are a relatively
small percentage of the total activity. In terms of 2009 imported supply chain value added
used by a nation’s manufacturing industry as a percent of all value added associated with
that nation’s manufacturing industry, the U.S. imported 10.8 % of its supply chain. These
imports have environmental impacts, require natural resources, and utilize labor; thus,
they are important in regards to a firm’s production. NIST, however, promotes US
innovation and industrial competitiveness; therefore, the imported goods and services are
outside of the scope of this report.
2.2 Standard Data Categorization A number of datasets are used in developing an inventory and model of industry
operations activities. Bringing these datasets together requires standard categories of
classification. Standard categorization is critical to tracking resources. Domestic data
tends to be in the North American Industry Classification System (NAICS). It is the
standard used by Federal statistical agencies since 1997 for classifying business
establishments in the U.S. NAICS was jointly developed by the U.S. Economic
Classification Policy Committee, Statistics Canada, and Mexico’s Instituto Nacional de
Estadística y Geografía. NAICS has several major categories each with subcategories.
Historic data and some organizations continue to use the predecessor of NAICS, which is
the Standard Industrial Classification system (SIC). NAICS codes are categorized at
varying levels of detail. Table 2-1 presents the lowest level of detail, which is the two
digit NAICS. There are 20 two-digit categories. Additional detail is added by adding
additional digits; thus, three digits provides more detail than the two digit codes and the
four digit provides more detail than the three digit. The maximum is six digits, as
illustrated for automobile manufacturing (NAICS 336111) and light truck and utility
manufacturing (NAICS 336112). Aircraft manufacturing is also shown in the table
(NAICS 336411). It is still part of NAICS 336, as it is also transportation equipment, but
is has a separate four digit NAICS (NAICS 3364). Sometimes a two, three, four, or five
digit code is followed by zeros, which do not represent categories. They are null or place
holders. For example, the code 336000 represents NAICS 336.

5
Table 2-1: North American Industry Classification System, Two Digit Codes
Sector Description
11 Agriculture, Forestry, Fishing and Hunting
21 Mining, Quarrying, and Oil and Gas Extraction
22 Utilities
23 Construction
31-33 Manufacturing
336 Transportation Equipment Manufacturing
3361 Motor Vehicle Manufacturing
33611 Automobile and Light Duty Motor Vehicle Manufacturing
336111 Automobile Manufacturing
336112 Light Truck and Utility Manufacturing
3364 Aerospace Product and Parts Manufacturing
33641 Aerospace Product and Parts Manufacturing
336411 Aircraft Manufacturing
42 Wholesale Trade
44-45 Retail Trade
48-49 Transportation and Warehousing
51 Information
52 Finance and Insurance
53 Real Estate and Rental and Leasing
54 Professional, Scientific, and Technical Services
55 Management of Companies and Enterprises
56 Administrative and Support and Waste Management and Remediation Services
61 Educational Services
62 Health Care and Social Assistance
71 Arts, Entertainment, and Recreation
72 Accommodation and Food Services
81 Other Services (except Public Administration)
92 Public Administration

6

7
3 Data and Methods
3.1 Data There are two datasets that are needed to track flow and inventory time in US
manufacturing: the Annual Survey of Manufactures from the U.S. Census Bureau and the
Bureau of Economic Analysis (BEA) Benchmark Input-Output data. This data is
supplemented by a third dataset, the Survey of Plant Capacity Utilization from the Census
Bureau. This dataset provides the average hours that factories are operating per week.
The following sections discuss these datasets and how they are used in the method.
3.1.1 BEA Benchmark Input-Output Data
Annual input-output data is available from the BEA for the years 1997 through 2013.
These tables provide data on the inter-industry relationships for 71 industries. Every five
years the BEA computes Benchmark input-output tables, which tends to have over 350
industries. 5 In 2007, there were 389 industries in the Benchmark data. This data is
provided in the form of make and use tables, with their corresponding matrices replacing
the Leontief method.6 Make tables show the production of commodities (products) by
industry, as illustrated in Table 3-1. Use tables show the components required for
producing the output of each industry, as illustrated in Table 3-2. The codes are altered
NAICS codes that represent different levels of aggregation. There are two types of make
and use tables: “standard” and “supplementary.” Standard tables closely follow NAICS
and are consistent with other economic accounts and industry statistics, which classify
data based on establishment. Note that an “establishment” is a single physical location
where business is conducted.
This should not be confused with an “enterprise” such as a company, corporation, or
institution. Establishments are classified into industries based on the primary activity
within the NAICS code definitions. Establishments often have multiple activities. For
example, a hotel with a restaurant has income from lodging, a primary activity, and from
food sales -- a secondary activity. An establishment is classified based on its primary
activity. Data for an industry reflects all the products made by the establishments within
that industry; therefore, secondary products are included.
Supplementary make-use tables reassign secondary products to the industry in which they
are primary products. The data in this report utilizes the original make-use tables. The
make-use tables are used for input-output analysis as developed by the Nobel Prize-
winning economist Wassily Leontief, although as noted above, they replace part of the
Leontief model.7 Within this model, economies of scale are ignored; thus, it operates
5 Bureau of Economic Analysis. November 2014. Input-Output Accounts Data.
<http://www.bea.gov/industry/io_annual.htm> 6 A System of National Accounts, Studies in Methods, Series F/No. 2/Rev. 3, United Nations, New York,
1968. 7 Guo, Jiemin, Ann M. Lawson, and Mark A. Planting. October 2002. From Make-Use to Symmetric I-O
Tables: An Assessment of Alternative Technology Assumptions.
<https://www.bea.gov/papers/pdf/alttechassump.pdf>

8
Table 3-1: Part of a Make Table from the 2007 Benchmark Input-Output Data
Au
tom
ob
ile
man
ufa
ctu
rin
g
Ligh
t tr
uck
an
d u
tilit
y
veh
icle
man
ufa
ctu
rin
g
Hea
vy d
uty
tru
ck
man
ufa
ctu
rin
g
Code Industry Description 336111 336112 336120 … Total Industry Output
336111 Automobile manufacturing 77
691 4 061 45 … 87 807
336112 Light truck and utility vehicle manufacturing 2 222 156 703 333 … 160 904
336120 Heavy duty truck manufacturing 0 1 19 412 … 20 011
336211 Motor vehicle body manufacturing 0 555 4 282 … 12 235
⋮ ⋮ …
T007 Total Commodity Output 80
444 161 731 24 246 … 26 151 297
Table 3-2: Part of a Use Table from the 2007 Benchmark Input-Output Data
Au
tom
ob
ile
man
ufa
ctu
rin
g
Ligh
t tr
uck
an
d u
tilit
y ve
hic
le m
anu
fact
uri
ng
Hea
vy d
uty
tru
ck
man
ufa
ctu
rin
g
Code Commodity Description 336111 336112 336120 … Total Final
Uses
Total Commodity
Output
336111 Automobile manufacturing 104 0 0 … 80 339 80 444
336112 Light truck and utility vehicle 0 0 0 … 161 716 161 731
336120 Heavy duty truck manufacturing 0 0 50 … 20 701 24 246
336211 Motor vehicle body manufacturing 1 092 1 263 18 … 3 292 6 834
⋮ ⋮ …
T005 Total Intermediate 66 129 130 438 16 342 …
V00100 Compensation of employees 13 058 6 191 2 386 …
V00200 Taxes less subsidies 284 129 35 …
V00300 Gross operating surplus 8 336 24 146 1 248 …
T006 Total Value Added 21 677 30 466 3 669 … 14 477 634
T008 Total Industry Output 87 807 160 904 20 011 … 26 151 297

9
under constant returns to scale.8 The model also assumes that a sector uses inputs in fixed
proportions. This report uses an industry-by-commodity format as outlined in Horowitz
and Planting.9 This accounts for the fact that an industry may produce more than one
commodity or product such as secondary and by-products. This calculation, however,
does not take into account the fact that competitive imports are included in the make-use
tables; therefore, to analyze the domestic manufacturing industry’s inter -industry
relationships, imports must be removed. This is done by subtracting imports
proportionally throughout the use matrix.
When examining a sector, such as automotive manufacturing, there are two types of
activities: the activities within that industry and the purchases from other industries that
go into that industry. The primary measure of output in the input-output accounts is gross
output, which is similar to shipments from the Annual Survey of Manufactures. In
general, gross output includes the value of both intermediate product and final product
measured using market value (revenues received) for goods and services. With much of
the data being from the Economic Census, the basic measure used for each industry
varies, but is often referred to as “receipts.” It is identified as shipments for mining and
manufacturing, revenue for utilities, sales for merchant wholesale trade and retail trade,
receipts for most services, and commissions for commodity brokerage. For the purpose of
this report, it will simply be called output.
3.1.2 Inventory Data
The Annual Survey of Manufactures (ASM) is conducted every year except for when the
Economic Census is conducted (i.e., years ending in 2 or 7).10 The ASM provides
statistics on employment, payroll, supplemental labor costs, cost of materials consumed,
operating expenses, value of shipments, value added, fuels and energy used, and
inventories. It uses a sample survey of approximately 50,000 establishments with new
samples selected at 5-year intervals. The ASM data allows the examination of multiple
factors (value added, payroll, energy use, and more) of manufacturing at a detailed
subsector level. The Economic Census, used for years ending in 2 or 7, is a survey of all
employer establishments in the U.S. that has been taken as an integrated program at 5-
year intervals since 1967. Both the ASM and the Economic Census use NAICS
classifications, as illustrated in Table 3-3; however, prior to NAICS the Standard
Industrial Classification system was used. 11 The Economic Census sent out nearly 4
million forms to businesses representing all US locations and industries.
The inventory data from the Economic Census and Annual Survey of Manufactures is
broken into materials inventory, work-in-process inventory, and finished goods
8 Lau, Lawrence J. and Shuji Tamura. November-December 1972, Volume 80, No. 6. Economies of Scale,
Technical Progress, and the Nonhomothetic Leontief Production Function: As Application to the Japanese
Petrochemical Processing Industry. Journal of Poltical Economy. 9 Horowitz, Karen J. and Mark A. Planting. September 2006. Concepts and Methods of the Input-Output
Accounts. <http://www.bea.gov/papers/pdf/IOmanual_092906.pdf> 10 US Census Bureau. Annual Survey of Manufactures.
<http://www.census.gov/manufacturing/asm/index.html> 11 Census Bureau. “Annual Survey of Manufactures.” < http://www.census.gov/manufacturing/asm/>

10
Table 3-3: Annual Survey of Manufactures and Economic Census Inventory Data Layout
NAICS Code Description To
tal i
nve
nto
ries
, beg
inn
ing
of
year
Fin
ish
ed g
oo
ds
inve
nto
rie
s,
beg
inn
ing
of
year
Wo
rk-i
n-p
roce
ss in
ven
tori
es,
beg
inn
ing
of
year
Mat
eria
ls a
nd
su
pp
lies
inve
nto
ries
, beg
inn
ing
of
year
Tota
l in
ven
tori
es, e
nd
of
the
year
Fin
ish
ed g
oo
ds
inve
nto
rie
s, e
nd
of
year
Wo
rk-i
n-p
roce
ss in
ven
tori
es,
end
of
year
Mat
eria
ls a
nd
su
pp
lies
inve
nto
ries
, en
d o
f ye
ar
336111 Automobile manufacturing 336112 Light truck and utility vehicle 336120 Heavy duty truck manufacturing 336211 Motor vehicle body
manufacturing
⋮ ⋮
inventory. It is important to note that a finished product for an establishment in one
industry might be reported as a raw material by an establishment in a different industry.
For example, the finished product inventories of a steel mill might be included in the
material inventories of a stamping plant. The inventory data does not have a breakout for
transport time or down time; therefore, other data must be used for these purposes. In
order to estimate the work-in-process downtime (i.e., the time that materials are in work-
in-process, but the plant is closed) one can employ data from the Survey of Plant
Capacity Utilization. This data provides quarterly statistics on the rates of capacity
utilization for the US manufacturing industry by NAICS code. It surveys 7500
establishments selected from the Economic Census. They are selected from the Census
Bureau’s Business Register with updated information from the Economic Census. They
are selected with probabilities proportionate to their value of shipments within each
industry. In addition to providing capacity utilization, it also provides data on the average
plant hours per week in operation for an industry. “Simple weighted estimates of the
plant hours are formed by applying the plant’s sample weight to its respective values and
adding these weighted values across the reporting plants. The average is formed as the
ratio of the plant hours weighted sum to the sum of the weights for the reporting
plants.”12
3.2 Methods Metrics in operations management often measure the time that it takes to produce a
product. These metrics vary in complexity, use, and development.13 Having too many
materials and goods on hand is often considered an indication of a problem, as inventory
12 US Census Bureau. “Survey of Plant Capacity Utilization: How the Data are Collected.”
<http://www.census.gov/manufacturing/capacity/how_the_data_are_collected/index.html> 13 Melnyk, Steven A., Douglas M. Stewart, and Morgan Swink. Metrics and Performance Measurement in
Operations Management: Dealing with the Metrics Maze. Journal of Operations Management 22 (2004).
pp.209-217.

11
deteriorates over time, consumes resources to maintain it, and ties up capital. To track the
flow time and inventory time, it is necessary to follow the materials used in production
from the extraction out of the ground to the final product. The Benchmark Input-output
data allows for tracking this. In addition to the inter-industry linkages in the BEA data,
two measures are necessary to track the industry time it takes to produce a product:
inventory turns and an industry reiteration rate.
3.2.1 Inter-Industry Linkages
The Use table from the BEA Benchmark Input-Output tables provides the items each
industry purchases from other industries. This data, however, includes not only the
materials, but also the energy, machinery, services, and other items that are not part of the
final product. To track the flow time and inventory time, it is necessary to identify only
those activities that process materials that are physically part of the final product. To
identify these activities, the data from the Use table that applies to manufacturing was
extracted. A subset of these items were selected based on their contribution to the
industry of interest (e.g., automobile manufacturing and aircraft manufacturing). Using
input-output analysis, the items that contributed to the industry of interest were sorted
based on the value they contributed. Items were selected from the largest to the smallest
until 90 % of the supply chain value was accounted for. Each of these supply chain
entities was reviewed along with their supply chain entities. Some were eliminated from
the list as they were not part of the final product. Some items were added to the list when
they were identified as being a part of the final product, but not originally selected.
3.2.2 Inventory Turns
Inventory turnover is the number of times inventory is sold or used in a time period such
as a year. It is calculated as the cost of goods sold (“COGS” or “throughput”) divided by
the average inventory. The throughput is usually stated in yearly terms.14 Academics use
inventory turnover ratios in studying a number of fields, like distributive trade.15 The
Annual Survey of Manufacturing has data to calculate the cost of goods sold. It is the
sum of payroll; benefits; materials; depreciation; capital expenditures; rental payments;
other expenses; and beginning of year inventories less end of year inventories.
Inventories are calculated as the average of the beginning of year inventories and end of
year inventories. The Annual Survey of Manufactures provides data on total inventories,
material and supplies inventories, work-in-process inventories, and finished goods
inventories by NAICS code. The days that a dollar spends in each of these inventories
can be calculated by taking the total number of days in a year and dividing it by the
number of inventory turns. One item that this calculation excludes is the down time for
work-in-process; that is, the time that a good is in work-in-process but the factory is
actually closed. To make this calculation we use data from the Quarterly Survey of Plant
Capacity Utilization, which provides the average plant hours by NAICS code. This data
can be used to estimate the proportion of work-in-process time that is actually down time.
14 Hopp, Wallace J. and Mark L. Spearman. Factory Physics, Third Edition. 2008. p.230. 15 Karic, Marijan, Ivan Kristek, and Maja Vidovic. Measuring the Inventory Turnover in Distributive
Trade.
<ftp://ftp.repec.org/opt/ReDIF/RePEc/osi/bulimm/PDF/BusinessLogisticsinModernManagement13/blimm1
308.pdf>

12
3.2.3 Industry Reiteration Rate
Using the Annual Survey of Manufactures data to make the inventory calculations
provides the average days a dollar spends in inventory for an establishment in a particular
NAICS code; however, a material that is moving through an industry may be processed
in more than one establishment in an industry, as illustrated in Figure 3-1. For example, a
chemical plant could produce chemical A while another plant produces chemical B from
chemical A. A third plant might yet be using chemical B to produce chemical C.
Chemical A was processed through three establishments, similar to the flow in Figure
3-1. That would mean that these items were in inventory approximately twice as long as
would be calculated using the inventory data from the Annual Survey of Manufactures.
This paper proposes a method to estimate the number of times a material is processed in
one industry, which will be referred to as the industry reiteration rate. Two datasets are
used to make this estimation: the BEA Benchmark Input-Output Use data from 2007 and
the Annual Survey of Manufactures. The Benchmark Use table provides inter-industry
purchases, including the purchases an industry makes from itself. The Annual Survey of
Manufactures provides the cost of materials, parts, containers, and packaging used as
well as the cost of resales, which is items purchased and resold without being altered. The
inter-industry purchases is divided by the sum of the cost of materials, parts, containers,
and packaging used and the cost of resales. This provides a proportion of material
purchases from the same industry:
𝑃 = 𝑃𝑢𝑐ℎ𝑎𝑠𝑒𝑠 𝑎𝑛 𝐼𝑛𝑑𝑢𝑠𝑡𝑟𝑦 𝑀𝑎𝑘𝑒𝑠 𝑓𝑟𝑜𝑚 𝐼𝑡𝑠𝑒𝑙𝑓
𝑀𝑎𝑡𝑒𝑟𝑖𝑎𝑙𝑠, 𝑃𝑎𝑟𝑡𝑠, 𝐶𝑜𝑛𝑡𝑎𝑖𝑛𝑒𝑟𝑠, 𝑎𝑛𝑑 𝑃𝑎𝑐𝑘𝑎𝑔𝑖𝑛𝑔 + 𝑅𝑒𝑠𝑎𝑙𝑒𝑠
Where 𝑃 = Proportion of materials, parts, containers, packaging, and resales that are
purchased from an entity in the same industry.
This is an average proportion of materials purchased from an entity within the same
industry; thus, if 𝑃 equals 0.3 for industry X, then, on average, an establishment in
industry X purchases 30 % of its materials from other establishments in that industry. If it
is assumed that each establishment in an industry maintains this proportion of purchases,
then we can estimate how many establishments a material goes through before it is
diminished below a certain level. In the example of 𝑃 equaling 0.3 or 30 %, after two
establishments 9 % of the material has gone through two establishments (30 % multiplied
by 30 %). After three establishments, 2.7 % of the material has been through three
establishments (30 % multiplied by 30 % multiplied by 30 % or 0.3 to the power of 3).
With the assumption that each establishment in an industry maintains this proportion of
purchases, then, one can calculate the number of establishments a dollar goes through
before it is diminished below a certain threshold. Without a threshold, the material would
be calculated as going through the industry indefinitely. In our example, no matter what
power we raise 0.3 to, it will never reach 0. One can calculate the number of
establishments a dollar goes through before it is diminished below a certain threshold
using a logarithmic function with base 𝑃, which is the industry reiteration rate:
𝐼𝑛𝑑𝑢𝑠𝑡𝑟𝑦 𝑅𝑒𝑖𝑡𝑒𝑟𝑎𝑡𝑖𝑜𝑛 𝑅𝑎𝑡𝑒 = 𝑙𝑜𝑔𝑝𝑇

13
Where
𝑇 = The selected threshold, which is between 0 and 1
𝑃 = Proportion of materials, parts, containers, packaging, and resales that are purchased
from an entity in the same industry.
For example, let’s say that industry x has a proportion 𝑃 of 0.50 and one selects a
threshold of 0.125. The industry reiteration rate would be:
𝑙𝑜𝑔0.50.125 = 3
This suggests that, given this threshold, a material is likely to go through around three
establishments in industry x, on average. For those industries that are below the
threshold, the reiteration rate is simply 1. The threshold represents the level at which it is
believed materials would only go through one establishment in that industry; therefore,
for values of 𝑃 that are less than 𝑇 the industry reiteration rate is 1. A threshold can be
Figure 3-1: Illustration of Tracking a Material through an Industry
selected by examining 𝑃 values from industries where a product only goes through one
establishment in that industry. The threshold would then either be equal to one of those 𝑃
values or based on them (e.g., average or maximum value). For this report a threshold of
0.03 was selected. Industries that would be expected to go through only 1 establishment
tended to have a 𝑃 value of 0.03 or less. For example, printing is likely to go through
only one establishment and had a 𝑃 value of 0.028. Another example with a value of
0.002 is automobile manufacturing (i.e., assembly), which is an industry that is separate
from auto parts production and, therefore, would likely only go through one
establishment. As the threshold is lowered the reiteration rate increases; therefore, a
higher threshold moves toward assuming that a material moves through fewer
establishments while a lower threshold moves toward assuming it moves through more
establishments.
Industry NAICS Code
Establishment
•Material and supplies inventories
•Work-in-process
•Finished goods inventories
Establishment
•Material and supplies inventories
•Work-in-process
•Finished goods inventories
Establishment
•Material and supplies inventories
•Work-in-process
•Finished goods inventories

14
The reiteration rate provides a rate that can be compared between industries and
represents the number of establishments a material would go through in a particular
industry. It must be noted, that this is not a perfect measure. In order to know the average
number of establishments a material travels through, it would be necessary to map the
interactions of the hundreds, thousands, and even tens of thousands of establishments in
each industry. Such an effort would be technically infeasible; therefore, we must rely on
imperfect metrics.

15
4 Two Case Studies: Automobile and Aircraft Manufacturing
This section illustrates the methods discussed in Section 3 for the automobile and aircraft
manufacturing industries. These two industries require a myriad of parts and raw
materials that results in a complex supply chain.
4.1 Automotive Manufacturing Final stage automotive manufacturing consists of three primary NAICS codes: 336120
Heavy duty truck manufacturing, 336112 Light truck and utility vehicle manufacturing,
and 336111 Automobile manufacturing. These items connect to a series of NAICS codes
related to automotive manufacturing:
336370 Motor vehicle metal stamping
336211 Motor vehicle body manufacturing
336310 Motor vehicle gasoline engine and engine parts manufacturing
336320 Motor vehicle electrical and electronic equipment manufacturing
336350 Motor vehicle transmission and power train parts manufacturing
336360 Motor vehicle seating and interior trim manufacturing
336390 Other motor vehicle parts manufacturing
3363A0 Motor vehicle steering, suspension component and brake systems manufacturing
These items were grouped or relabeled into seven categories: body, engine, vehicle
electronics, powertrain, interior, other parts, and steering and suspension. The remaining
NAICS for automobile manufacturing supply chain entities were grouped into three
categories: basic elements, simple intermediate parts, and complex intermediate parts.
NAICS codes for basic elements were categorized into seven categories: copper, iron and
steel, aluminum, other metals, plastic, rubber, and inorganic chemicals. Simple
intermediate parts includes nineteen categories: fabric, carpet, paint, adhesives, other
plastic products, tires, hoses and belts, rubber products, glass products, crown and
closure, springs and wires, machine shops, screws and nuts, valves and fittings, ball and
roller bearings, other metal products, wiring, batteries, and hardware. Complex
intermediate parts includes four categories: audio and video, semiconductors, other
electronic components, and circuits.
There are numerous flow paths from raw material extraction to the assembled
automobile, as seen in Figure 4-1. This figure provides a diagram of all the NAICS code
connections selected for automobile manufacturing. It is a complex diagram that is
challenging to follow, illustrating the difficulty in tracking supply chains. The longest
flow path that was identified for automotive manufacturing was 794.0 days and is traced
in Table 4-1. The flow would start in the industry at the top, oil and gas extraction
(NAICS 211000), which has an inventory time of 8.4 days. It would then flow to the
petroleum refineries (NAICS 324110). It would go through the industry’s materials and
supplies inventories, work in process, work in process downtime, and finished goods
inventory. It would then flow to the next industry, starting again with the materials and
supplies inventories. This flow includes inventory and transportation time and is

16
multiplied using the reiteration rate. Oil and gas extraction through plastics material and
resin manufacturing accounts for 432.9 days or 54 % of the flow. Work-in-process
accounts for only 56.1 days or 7.1 % of the time.16 Work-in-process down time (i.e., time
when the factory is closed) accounts for 72.8 days or 9.3 % of the time. Materials and
supplies inventory along with finished goods inventory, which includes transportation,
accounts for 83.6 % of the flow.
It is important to note that the determination of these paths is flexible. For example, one
might posit that two activities can or do occur parallel to one another rather than in series.
Also, the reiteration rate may vary. Appendix A provides a list of the NAICS codes for
the automotive flow, including the reiteration rate, work in process time, and various
inventory times. This is the time that is spent just in that industry, excluding time the
materials spent in the supply chain prior to reaching the industry. The largest reiteration
rate is petrochemical manufacturing at 10.4. This rate suggests that petrochemicals go
through, on average, 10.4 establishments before leaving the industry. This raises
petrochemicals from a 19.8 day flow to a 205.0 day flow. Ball and roller bearing
manufacturing is the second largest reiteration rate at 3.8, but this process requires 70.0
days without the reiteration rate. Table 4-2 provides the aggregate flow for each of the
categories described for automotive manufacturing.
Table 4-1: Longest Flow Path for Automobile Manufacturing
Mat
eria
ls a
nd
sup
plie
s In
ven
tory
Wo
rk in
Pro
cess
Wo
rk-i
n-P
roce
ss
(do
wn
tim
e)
Fin
ish
ed g
oo
ds
Inve
nto
ry
Tota
l
211000 Oil and gas extraction - - - - 8.4
324110 Petroleum refineries 7.2 2.3 4.1 10.5 24.1
325110 Petrochemical manufacturing 73.1 7.3 8.9 115.7 205.0
325190 Other basic organic chemical manufacturing 19.2 5.8 2.0 43.0 69.9
325130 Synthetic dye and pigment manufacturing 27.7 4.9 1.7 31.5 65.8
325211 Plastics material and resin manufacturing 15.6 5.5 0.7 37.9 59.7
335930 Wiring device manufacturing 26.9 4.5 7.7 27.6 66.8
334418 Printed circuit assembly manufacturing 51.7 6.9 14.2 13.2 86.0
33441A Other electronic component manufacturing 71.6 13.4 25.7 27.9 138.6
336320 Motor vehicle electrical and electronics manufacturing 26.1 4.9 6.7 22.2 59.8
336111 Automobile manufacturing 7.4 0.7 1.2 0.7 9.9
TOTAL 326.5 56.1 72.8 330.2 794.0
16 Note that oil and gas extraction is excluded from this calculation as that data is not available

17
Table 4-2: Aggregate Flow by Automotive Supply Chain Category
Category Aggregate
Flow (Days)
Category Aggregate
Flow (Days)
Automobile Manufacturing 794.0 Tires 458.8
Vehicle electronics 784.1 Plastic 432.9
other electronic components 724.3 Rubber 424.8
audio and video 664.8 Machine shops 397.3
Body 647.4 Screws and nuts 395.1
Engine 617.6 Springs and wires 391.8
Power train 614.1 Other metal products 371.9
Steering and suspension 604.6 Crown and closure 366.6
Ball and roller bearings 588.9 Paint 349.2
circuits 585.7 Adhesives 347.7
Valves and fittings 572.1 Semiconductors 338.4
Hardware 536.6 Other metal 322.6
interior 506.6 Iron and steel 319.2
wiring 499.7 copper 250.4
Rubber products 492.2 aluminum 231.2
Battery 483.4 Glass products 165.5
Other parts 483.0 Carpet 113.2
Other plastic products 481.5 Fabric 109.2
Hoses and belts 473.6
4.2 Aircraft Manufacturing Final stage aircraft manufacturing is categorized as NAICS 336411 Aircraft
Manufacturing. For the purpose of this report, the supply chain flow for aircraft
manufacturing was categorized by four sets: basic elements, simple intermediate,
complex intermediate, and aircraft parts. Basic elements includes copper, iron and steel,
aluminum, other metal, plastic, rubber, other minerals, other petroleum products, and
other chemicals. Simple intermediate includes fabric, carpet, paint, other plastic products,
hoses and belts, rubber products, crown and closure, springs and wires, machine shops,
screws and nuts, valves and fittings, ball and roller bearings, other metal products, wiring,
hardware, carbon and graphite, other stamping, pipes, and refractory. Complex
intermediate includes semiconductors, other electronic components, circuits, signal
testing, measuring device, wireless communications, navigation and detection,
propulsion, plastic sheets, turbine, meters and counting devices, vehicle electronics,
power transmission, gears, industrial control, motor and generator, switchgears and
switchboards, other engine equipment. Aircraft parts includes aircraft engine, other parts,
other aircraft parts. The supply chain is mapped in Figure 4-2.
The final stage, aircraft assembly, alone takes 194.5 days on average with 66.8 days
being work in process. Supply chain NAICS codes for aircraft manufacturing were
selected in a similar manner as that for automotive manufacturing. Each of the associated
NAICS codes are listed in Appendix B. The longest flow path is shown in Table 4-3,
which amounts to 1853.4 days or a little over 5 years from raw material extraction to

18
Figure 4-1: Automobile Manufacturing Supply Chain
Raw Materials Intermediate Goods Finished Product

19
Figure 4-2: Aircraft Manufacturing Supply Chain
Raw Materials Intermediate Goods Finished Product

20
final assembly. Aircraft manufacturing is longer than automotive due to additional
complexity resulting in additional industry activity. It is also due to the fact that aircraft
assembly requires 66.8 days of work in process while automotive assembly only requires
0.7 days. It should be noted that work-in-process time also includes practices such as
testing, which for aircraft assembly is extensive. Approximately 359.9 days are spent in
work in process or 19.5 % of the total with an additional 459.5 days or 24.9 % in
downtime when the factory is closed.17 Approximately 56.2 % of the time materials are in
inventory or transportation. The task of reducing flow time in aircraft manufacturing has
occupied both industry professionals and academics.18 Table 4-4 provides the aggregate
flow for the categories for aircraft manufacturing and its supply chain entities.
Table 4-3: Longest Flow Path for Aircraft Manufacturing
BEA NAICS Code and Description
Fin
ish
ed
go
od
s
Mat
eria
ls a
nd
sup
plie
s
WIP
WIP
: Do
wn
tim
e
Tota
l
211000 Oil and gas extraction 8.4
324110 Petroleum refineries 10.5 7.2 2.3 4.1 24.1
325110 Petrochemical manufacturing 115.7 73.1 7.3 8.9 205.0
325190 Other basic organic chemical manufacturing 43.0 19.2 5.8 2.0 69.9
325130 Synthetic dye and pigment manufacturing 31.5 27.7 4.9 1.7 65.8
325211 Plastics material and resin manufacturing 37.9 15.6 5.5 0.7 59.7
335930 Wiring device manufacturing 27.6 26.9 4.5 7.7 66.8
334418 Printed circuit assembly manufacturing 13.2 51.7 6.9 14.2 86.0
33441A Other electronic component manufacturing 27.9 71.6 13.4 25.7 138.6
334220 Broadcast and wireless communications equipment 44.0 63.9 50.6 127.1 285.6
33641A Propulsion units and parts for space vehicles 37.7 27.5 88.5 81.4 223.7
336412 Aircraft engine and engine parts manufacturing 104.5 121.8 103.6 95.3 425.3
336411 Aircraft manufacturing 19.2 18.0 66.8 90.6 194.5
TOTAL 512.8 524.3 359.9 459.5 1853.4
17 Note that this calculation excludes oil and gas extraction. 18 For example, see Jackson S. Chao and Stephen C. Graves. Reducing Flow Time in Aircraft
Manufacturing. <http://web.mit.edu/sgraves/www/papers/chaograves/chaograves.htm#impact> and Roger
Schmenner. “The Merit of Making Things Fast.” Sloan Management Review, Fall 1988, pp.11-17.

21
Table 4-4: Aggregate Flow by Aircraft Supply Chain Category
Category Aggregate
Flow (Days) Category
Aggregate Flow (Days)
Aircraft assembly 1853.4 Other plastic products 481.5
Aircraft engine 1658.9 Hoses and belts 473.6
Propulsion 1233.6 Other engine equipment 473.5
Navigation and detection 1060.3 Carbon and graphite 459.6
Wireless communications 1009.9 Other stamping 452.5
Measuring device 1008.0 Plastic 432.9
Other parts 989.9 Pipes 430.8
Industrial control 939.7 Rubber 424.8
Turbine 932.3 Refractory 413.8
Other aircraft parts 932.1 Machine shops 397.3
Signal testing 911.8 Screws and nuts 395.1
Meters and counting devices 817.6 Springs and wires 391.8
Power transmission 792.0 Other metal products 371.9
Vehicle electronics 784.1 Crown and closure 366.6
other electronic components 724.3 Paint 349.2
Gears 679.6 Semiconductors 338.4
Ball and roller bearings 588.9 Other metal 322.6
circuits 585.7 Iron and steel 319.2
Motor and generator 574.4 Other chemicals 307.4
Valves and fittings 572.1 Other petroleum products 282.2
Hardware 536.6 copper 250.4
wiring 499.7 Other mineral 234.9
Rubber products 492.2 aluminum 231.2
Plastic sheets 483.5 Carpet 113.2
Switchgears and switchboards 483.3 Fabric 37.5

22

23
5 Summary and Recommendations for Future Research
5.1 Summary
Private firms, driven by competition, frequently achieve advances in efficiency on their
own accord; however, there are often barriers to advancement that surpass the ability of
any single firm. Additionally, competition, lack of communication, and other factors can
prevent the collaborative efforts necessary to overcome such barriers.19 It is in these types
of situations that publicly-funded research efforts are often necessary for advancing
industry efficiency. This report identifies and reviews data on manufacturing inventory
and flow time along with data on inter-industry interactions. It then develops a method
for tracking the flow time of US manufactured products. The method developed is
illustrated for the automotive and aircraft manufacturing industries.
5.2 Recommendations for Future Research
There are three categories of future research: research to advance the accuracy of the
model, research to advance the detail of the model, and using the model to examine other
industries. To advance the accuracy there is a need to temporally extend the model. Due
to the nature of the data, the model is based on 2007 data; however, data is available on
an annual basis that can be used to make estimates for more recent years. These estimates
will provide a more up to date analysis while also providing an opportunity to examine
how resource use is changing over time. Much of the data provides relative standard error
estimates. Using these estimates along with Monte Carlo analysis, which relies on
repeated random sampling, can provide insight into the error bands for the model.20
In addition to advancing accuracy, efforts can also extend the detail of this method. One
potential area for expansion is in transportation. Currently, the four categories of
inventory time engulf transportation; therefore, it is not explicitly broken out. Data is
available from the Department of Transportation that might break out this detail. For a
thorough understanding of time use in the supply chain, it is necessary to map the
industry supply chain for each final product using NAICS codes. Currently, only two
industries were examined. Also, future data collection might begin to supplement the
model to estimate overproduction, rework/defects, over-processing, and waiting, which
constitutes 4 of the 7 lean manufacturing categories of waste.
Finally, the model can be applied to other industries to reveal areas of potential efficiency
improvements. This might include additional reports such as this one or it might include a
tool that users can use to examine industry activity themselves.
19 For more on lack of effective communication in the manufacturing process, see “Communication
Barriers to Effective Manufacturing” in Manufacturing Systems: Foundations of World-Class Practice.
Committee on Foundations of Manufacturing, National Academy of Engineering. 1992. pp.176-179. 20 Heffernan, Randy. “Monte Carlo and Manufacturing” in Quality Magazine. April 1, 2014.
<http://www.qualitymag.com/articles/91769-monte-carlo-and-manufacturing>

24
Works Cited
A System of National Accounts, Studies in Methods, Series F/No. 2/Rev. 3, United
Nations, New York, 1968.
Bureau of Economic Analysis. November 2014. Input-Output Accounts Data.
<http://www.bea.gov/industry/io_annual.htm>
Committee on Foundations of Manufacturing, National Academy of Engineering.
“Communication Barriers to Effective Manufacturing” in Manufacturing Systems:
Foundations of World-Class Practice. 1992. pp.176-179.
Gunasekaran, A., Patel, C., & Tirtiroglu, E., 2001 "Performance measures and metrics in
a supply chain environment." International Journal of Operations & Production
Management 21, no. 1/2: 71-87.
Guo, Jiemin, Ann M. Lawson, and Mark A. Planting. October 2002. From Make-Use to
Symmetric I-O Tables: An Assessment of Alternative Technology Assumptions.
<https://www.bea.gov/papers/pdf/alttechassump.pdf>
Heffernan, Randy. “Monte Carlo and Manufacturing” in Quality Magazine. April 1,
2014. <http://www.qualitymag.com/articles/91769-monte-carlo-and-manufacturing>
Hopp, Wallace J. and Mark L. Spearman. Factory Physics, Third Edition. 2008. p.230.
Horowitz, Karen J. and Mark A. Planting. September 2006. Concepts and Methods of the
Input-Output Accounts. <http://www.bea.gov/papers/pdf/IOmanual_092906.pdf>
Jackson S. Chao and Stephen C. Graves. Reducing Flow Time in Aircraft
Manufacturing.
<http://web.mit.edu/sgraves/www/papers/chaograves/chaograves.htm#impact>
Jaffe, Adam B. 1998. The Importance of ‘Spillovers’ in the Policy Mission of the ATP.
Journal of Technology Transfer 23: 11-19Karic, Marijan, Ivan Kristek, and Maja
Vidovic. Measuring the Inventory Turnover in Distributive Trade.
<ftp://ftp.repec.org/opt/ReDIF/RePEc/osi/bulimm/PDF/BusinessLogisticsinModernMana
gement13/blimm1308.pdf>
Lau, Lawrence J. and Shuji Tamura. November-December 1972, Volume 80, No. 6.
Economies of Scale, Technical Progress, and the Nonhomothetic Leontief Production
Function: As Application to the Japanese Petrochemical Processing Industry. Journal of
Poltical Economy.
Link, Albert N. and John T. Scott. Public Goods, Public Gains: Calculating the Social
Benefits of Public R&D. 2011. pp.6-7.

25
Melnyk, Steven A., Douglas M. Stewart, and Morgan Swink. Metrics and Performance
Measurement in Operations Management: Dealing with the Metrics Maze. Journal of
Operations Management 22 (2004). pp.209-217.
National Institute of Standards and Technology. NIST General Information.
<http://www.nist.gov/public_affairs/general_information.cfm>Schmenner, Roger. “The
Merit of Making Things Fast.” Sloan Management Review, Fall 1988, pp.11-17.
Tassey, Gregory. 2005. Underinvestment in Public Good Technologies. Journal of
Technology Transfer 30: 89-113
Thomas, Douglas S. The US Manufacturing Value Chain: An International Perspective.
February 2014. NIST Technical Note 1810.
<http://www.nist.gov/customcf/get_pdf.cfm?pub_id=914022>
US Census Bureau. “Survey of Plant Capacity Utilization: How the Data are Collected.”
<http://www.census.gov/manufacturing/capacity/how_the_data_are_collected/
index.html>
US Census Bureau. Annual Survey of Manufactures.
<http://www.census.gov/manufacturing/asm/index.html>

26
Appendix A: Inventory and Flow Time (Days): Automotive Manufacturing Below is the inventory and flow time for each stage of each industry (without the reiteration rate) associated with automobile
manufacturing. A material going through a particular industry would go through each stage (materials and supplies, WIP, WIP:
downtime, and finished goods).
BEA NAICS Code and Description
Rei
tera
tio
n R
ate
Mat
eria
ls a
nd
sup
plie
s
WIP
WIP
: Do
wn
tim
e
Fin
ish
ed
go
od
s
Tota
l
Tota
l wit
h
Rei
tera
tio
n
332991 Ball and roller bearing manufacturing 3.8 21.2 8.2 16.8 23.7 70.0 266.3
325110 Petrochemical manufacturing 10.4 7.1 0.7 0.9 11.2 19.8 205.0
334300 Audio and video equipment manufacturing 2.7 35.1 1.2 2.9 21.3 60.3 165.1
331110 Iron and steel mills and ferroalloy manufacturing 2.6 26.6 8.9 5.4 18.4 59.3 156.2
33291A Valve and fittings other than plumbing 1.7 28.2 7.0 14.4 32.0 81.6 139.3
33441A Other electronic component manufacturing 2.4 30.1 5.6 10.8 11.7 58.3 138.6
33441A Other electronic component manufacturing 2.4 30.1 5.6 10.8 11.7 58.3 138.6
331490 Nonferrous metal (except copper and aluminum) rolling, drawing, extruding and alloying 1.8 24.1 16.3 19.8 16.3 76.5 134.4
327200 Glass and glass product manufacturing 2.7 15.0 2.4 2.3 28.9 48.7 131.0
33211A All other forging, stamping, and sintering 2.0 24.9 10.9 16.2 14.6 66.5 130.0
331419 Primary smelting and refining of nonferrous metal (except copper and aluminum) 2.4 16.8 5.8 7.1 13.6 43.4 103.9
332500 Hardware manufacturing 2.0 18.1 6.5 8.1 18.9 51.7 103.8
325180 Other basic inorganic chemical manufacturing 2.3 14.3 4.9 1.7 20.3 41.2 94.5
336211 Motor vehicle body manufacturing 1.6 23.0 7.5 12.6 14.4 57.6 89.8
331420 Copper rolling, drawing, extruding and alloying 2.8 7.8 4.7 5.8 13.7 31.9 89.7
334413 Semiconductor and related device manufacturing 2.0 9.6 8.7 16.8 7.9 43.0 87.9
334418 Printed circuit assembly (electronic assembly) manufacturing 1.9 27.8 3.7 7.7 7.1 46.3 86.0
332430 Metal can, box, and other metal container (light gauge) manufacturing 2.0 15.2 2.0 2.5 22.1 41.8 82.7
33131A Alumina refining and primary aluminum production 2.2 20.3 5.0 1.8 8.7 35.8 80.3
313300 Textile and fabric finishing and fabric coating mills 1.7 17.6 4.2 3.6 19.6 45.0 78.3
331411 Primary smelting and refining of copper 3.2 2.6 12.5 4.5 4.9 24.5 77.8
331200 Steel product manufacturing from purchased steel 1.1 34.8 9.1 5.5 22.7 72.1 77.3
326110 Plastics packaging materials and unlaminated film and sheet manufacturing 1.7 18.4 2.6 3.1 21.1 45.2 75.4
33131B Aluminum product manufacturing from purchased aluminum 1.8 12.3 9.0 42.4 74.9

27
332710 Machine shops 1.7 9.9 7.7 9.7 16.5 43.8 74.7
332720 Turned product and screw, nut, and bolt manufacturing 1.3 14.4 5.7 11.7 22.7 54.5 72.5
313200 Fabric mills 1.3 15.9 11.3 3.2 24.6 55.1 71.7
325190 Other basic organic chemical manufacturing 2.0 9.7 2.9 1.0 21.9 35.5 69.9
332600 Spring and wire product manufacturing 1.3 18.5 3.2 4.0 26.6 52.4 69.2
326290 Other rubber product manufacturing 1.9 16.2 2.8 2.6 13.2 34.8 67.3
335930 Wiring device manufacturing 1.2 22.4 3.8 6.4 23.0 55.6 66.8
332800 Coating, engraving, heat treating and allied activities 1.5 21.2 2.9 6.0 15.2 45.3 66.5
325130 Synthetic dye and pigment manufacturing 1.0 27.7 4.9 1.7 31.5 65.8 65.8
332310 Plate work and fabricated structural product manufacturing 1.4 20.8 7.1 8.9 8.2 45.0 64.7
335920 Communication and energy wire and cable manufacturing 1.6 12.2 3.3 5.5 18.8 39.7 62.8
336320 Motor vehicle electrical and electronic equipment manufacturing 1.6 16.5 3.1 4.2 14.0 37.8 59.8
325211 Plastics material and resin manufacturing 1.5 10.6 3.7 0.5 25.8 40.6 59.7
332320 Ornamental and architectural metal products manufacturing 1.3 21.2 3.2 6.6 13.3 44.3 56.1
332114 Custom roll forming 1.0 30.8 3.8 4.7 16.0 55.4 55.4
3252A0 Synthetic rubber and artificial and synthetic fibers and filaments manufacturing 1.0 13.9 4.5 1.4 31.8 51.7 51.7
335911 Storage battery manufacturing 1.0 9.8 9.7 16.5 14.5 50.5 50.5
336390 Other motor vehicle parts manufacturing 1.7 14.7 2.1 2.9 9.8 29.5 50.2
33299B Other fabricated metal manufacturing 1.0 22.6 3.8 7.8 15.1 49.3 49.3
326220 Rubber and plastics hoses and belting manufacturing 1.0 16.5 2.5 3.1 26.7 48.8 48.8
326190 Other plastics product manufacturing 1.2 15.5 2.2 1.9 19.4 39.1 48.6
331510 Ferrous metal foundries 1.0 16.9 4.9 5.9 19.3 46.9 46.9
33211B Crown and closure manufacturing and metal stamping 1.0 16.1 4.0 5.1 17.5 42.8 44.0
325510 Paint and coating manufacturing 1.0 15.8 0.9 1.5 23.7 41.8 41.8
314110 Carpet and rug mills 1.0 15.8 4.2 4.3 17.2 41.5 41.5
325520 Adhesive manufacturing 1.0 16.7 1.3 2.5 19.8 40.3 40.3
326140 Polystyrene foam product manufacturing 1.0 14.1 1.9 1.6 21.6 39.2 39.2
313100 Fiber, yarn, and thread mills 1.3 9.9 4.1 2.6 11.9 28.5 37.5
331520 Nonferrous metal foundries 1.0 14.2 5.0 7.4 10.7 37.3 37.3
326150 Urethane and other foam product (except polystyrene) manufacturing 1.0 18.4 2.5 2.2 11.5 34.6 34.6
326210 Tire manufacturing 1.2 10.7 2.0 1.7 13.7 28.1 34.0
335912 Primary battery manufacturing 1.0 13.4 6.0 10.2 3.9 33.4 33.4
3363A0 Motor vehicle steering, suspension component (except spring), and brake systems manufacturing 1.0 15.7 2.4 3.3 11.1 32.5 32.5
336120 Heavy duty truck manufacturing 1.0 15.2 5.1 4.2 5.8 30.3 30.3
336310 Motor vehicle gasoline engine and engine parts manufacturing 1.0 15.7 2.9 5.1 5.1 28.8 28.8
336350 Motor vehicle transmission and power train parts manufacturing 1.0 11.7 3.5 4.7 5.3 25.3 25.3

28
336360 Motor vehicle seating and interior trim manufacturing 2.0 8.2 0.9 1.3 2.0 12.4 25.1
324110 Petroleum refineries 1.0 7.2 2.3 4.1 10.5 24.1 24.1
336370 Motor vehicle metal stamping 1.0 8.6 2.8 3.8 5.7 21.0 21.0
336111 Automobile manufacturing 1.0 7.4 0.7 1.2 0.7 9.9 9.9
336112 Light truck and utility vehicle manufacturing 1.0 3.7 1.0 2.3 0.9 7.9 7.9
211000 Oil and gas extraction 8.4
212100 Coal mining 13.4
212230 Copper, nickel, lead, and zinc mining 45.6
2122A0 Iron, gold, silver, and other metal ore mining 38.7
2123A0 Other nonmetallic mineral mining and quarrying 34.5

29

30
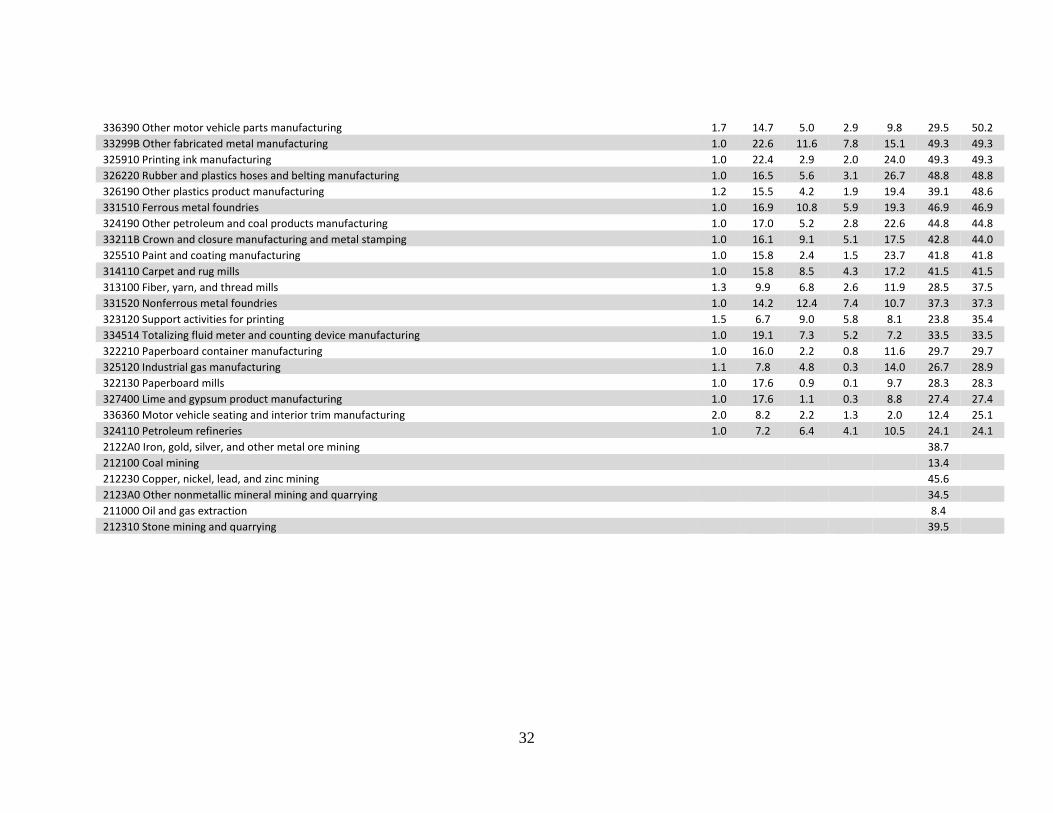
Appendix B: Inventory and Flow Time (Days): Aircraft Manufacturing Below is the inventory and flow time for each stage of each industry (without the reiteration rate) associated with aircraft
manufacturing. A material going through a particular industry would go through each stage (materials and supplies, WIP, WIP:
downtime, and finished goods).
BEA NAICS Code and Description
Rei
tera
tio
n R
ate
Mat
eria
ls a
nd
sup
plie
s
WIP
WIP
: Do
wn
tim
e
Fin
ish
ed
go
od
s
Tota
l
Tota
l wit
h
Rei
tera
tio
n R
ate
336412 Aircraft engine and engine parts manufacturing 7.7 15.8 25.9 12.4 13.6 55.3 425.3
336413 Other aircraft parts and auxiliary equipment manufacturing 2.9 27.6 72.0 34.5 23.6 123.2 360.0
334220 Broadcast and wireless communications equipment 4.7 13.6 37.8 27.1 9.4 60.8 285.6
332991 Ball and roller bearing manufacturing 3.8 21.2 25.0 16.8 23.7 70.0 266.3
33641A Propulsion units and parts for space vehicles and guided missiles 7.1 3.9 23.8 11.4 5.3 31.3 223.7
325110 Petrochemical manufacturing 10.4 7.1 1.6 0.9 11.2 19.8 205.0
327992 Ground or treated mineral and earth manufacturing 2.9 34.0 10.5 6.4 22.4 66.8 195.5
336411 Aircraft manufacturing 1.1 17.0 148.6 85.6 18.1 183.7 194.5
334515 Electricity and signal testing instruments manufacturing 2.8 32.7 16.1 11.4 17.3 66.1 187.5
327100 Clay product and refractory manufacturing 2.3 22.5 8.3 4.0 46.4 77.2 178.9
327910 Abrasive product manufacturing 3.1 18.2 19.9 12.2 19.8 57.9 177.6
331110 Iron and steel mills and ferroalloy manufacturing 2.6 26.6 14.3 5.4 18.4 59.3 156.2
333611 Turbine and turbine generator set units manufacturing 1.6 55.4 23.3 15.4 7.9 86.7 140.3
33291A Valve and fittings other than plumbing 1.7 28.2 21.4 14.4 32.0 81.6 139.3
33441A Other electronic component manufacturing 2.4 30.1 16.4 10.8 11.7 58.3 138.6
331490 Nonferrous metal (except copper and aluminum) rolling, drawing, extruding and alloying 1.8 24.1 36.1 19.8 16.3 76.5 134.4
33211A All other forging, stamping, and sintering 2.0 24.9 27.1 16.2 14.6 66.5 130.0
335314 Relay and industrial control manufacturing 1.9 29.3 17.8 11.2 16.7 63.8 122.1
333613 Mechanical power transmission equipment manufacturing 1.8 17.0 19.6 11.0 27.5 64.2 112.4
332996 Fabricated pipe and pipe fitting manufacturing 1.6 34.0 14.9 10.0 18.0 67.0 108.2
331419 Primary smelting and refining of nonferrous metal (except copper and aluminum) 2.4 16.8 13.0 7.1 13.6 43.4 103.9
332500 Hardware manufacturing 2.0 18.1 14.7 8.1 18.9 51.7 103.8
335312 Motor and generator manufacturing 1.7 26.9 13.3 8.4 20.7 61.0 101.0
33399B Fluid power process machinery 1.4 26.9 20.5 13.5 23.6 70.9 100.4

31
33351B Cutting and machine tool accessory, rolling mill, and other metalworking machinery manufacturing 1.4 18.5 26.8 17.7 23.7 69.0 98.3
33451A Watch, clock, and other measuring and controlling device manufacturing 1.2 35.2 19.4 13.7 25.8 80.3 96.1
325180 Other basic inorganic chemical manufacturing 2.3 14.3 6.6 1.7 20.3 41.2 94.5
333612 Speed changer, industrial high-speed drive, and gear manufacturing 1.1 24.7 30.7 17.3 29.4 84.8 90.7
33399A Other general purpose machinery manufacturing 1.2 23.7 30.5 20.0 20.3 74.5 90.0
331420 Copper rolling, drawing, extruding and alloying 2.8 7.8 10.5 5.8 13.7 31.9 89.7
334413 Semiconductor and related device manufacturing 2.0 9.6 25.5 16.8 7.9 43.0 87.9
334418 Printed circuit assembly (electronic assembly) manufacturing 1.9 27.8 11.3 7.7 7.1 46.3 86.0
33131A Alumina refining and primary aluminum production 2.2 20.3 6.8 1.8 8.7 35.8 80.3
331411 Primary smelting and refining of copper 3.2 2.6 17.0 4.5 4.9 24.5 77.8
331200 Steel product manufacturing from purchased steel 1.1 34.8 14.5 5.5 22.7 72.1 77.3
3259A0 All other chemical product and preparation manufacturing 1.6 19.6 7.9 4.3 20.6 48.0 76.3
333618 Other engine equipment manufacturing 1.7 16.0 13.4 7.6 14.4 43.8 76.2
335991 Carbon and graphite product manufacturing 1.0 23.5 28.3 17.8 24.1 75.9 75.9
326110 Plastics packaging materials and unlaminated film and sheet manufacturing 1.7 18.4 5.7 3.1 21.1 45.2 75.4
33131B Aluminum product manufacturing from purchased aluminum 1.8 12.3 21.1 9.0 42.4 74.9
332710 Machine shops 1.7 9.9 17.4 9.7 16.5 43.8 74.7
332720 Turned product and screw, nut, and bolt manufacturing 1.3 14.4 17.4 11.7 22.7 54.5 72.5
313200 Fabric mills 1.3 15.9 14.5 3.2 24.6 55.1 71.7
325190 Other basic organic chemical manufacturing 2.0 9.7 3.9 1.0 21.9 35.5 69.9
332600 Spring and wire product manufacturing 1.3 18.5 7.3 4.0 26.6 52.4 69.2
326290 Other rubber product manufacturing 1.9 16.2 5.4 2.6 13.2 34.8 67.3
335930 Wiring device manufacturing 1.2 22.4 10.2 6.4 23.0 55.6 66.8
332800 Coating, engraving, heat treating and allied activities 1.5 21.2 8.9 6.0 15.2 45.3 66.5
325130 Synthetic dye and pigment manufacturing 1.0 27.7 6.6 1.7 31.5 65.8 65.8
332310 Plate work and fabricated structural product manufacturing 1.4 20.8 16.0 8.9 8.2 45.0 64.7
33712A Other household nonupholstered furniture 1.0 26.8 5.8 4.3 31.8 64.4 64.4
335920 Communication and energy wire and cable manufacturing 1.6 12.2 8.8 5.5 18.8 39.7 62.8
336320 Motor vehicle electrical and electronic equipment manufacturing 1.6 16.5 7.3 4.2 14.0 37.8 59.8
325211 Plastics material and resin manufacturing 1.5 10.6 4.2 0.5 25.8 40.6 59.7
332114 Custom roll forming 1.0 30.8 8.5 4.7 16.0 55.4 55.4
334511 Search, detection, and navigation instruments manufacturing 1.0 10.2 35.4 25.1 6.8 52.3 52.3
3252A0 Synthetic rubber and artificial and synthetic fibers and filaments manufacturing 1.0 13.9 5.9 1.4 31.8 51.7 51.7
333511 Industrial mold manufacturing 1.2 10.5 22.2 13.7 9.1 41.8 50.7
326130 Laminated plastics plate, sheet (except packaging), and shape manufacturing 1.0 23.4 7.6 3.5 19.6 50.6 50.6
335313 Switchgear and switchboard apparatus manufacturing 1.1 20.3 11.6 7.3 12.5 44.5 50.4
32
336390 Other motor vehicle parts manufacturing 1.7 14.7 5.0 2.9 9.8 29.5 50.2
33299B Other fabricated metal manufacturing 1.0 22.6 11.6 7.8 15.1 49.3 49.3
325910 Printing ink manufacturing 1.0 22.4 2.9 2.0 24.0 49.3 49.3
326220 Rubber and plastics hoses and belting manufacturing 1.0 16.5 5.6 3.1 26.7 48.8 48.8
326190 Other plastics product manufacturing 1.2 15.5 4.2 1.9 19.4 39.1 48.6
331510 Ferrous metal foundries 1.0 16.9 10.8 5.9 19.3 46.9 46.9
324190 Other petroleum and coal products manufacturing 1.0 17.0 5.2 2.8 22.6 44.8 44.8
33211B Crown and closure manufacturing and metal stamping 1.0 16.1 9.1 5.1 17.5 42.8 44.0
325510 Paint and coating manufacturing 1.0 15.8 2.4 1.5 23.7 41.8 41.8
314110 Carpet and rug mills 1.0 15.8 8.5 4.3 17.2 41.5 41.5
313100 Fiber, yarn, and thread mills 1.3 9.9 6.8 2.6 11.9 28.5 37.5
331520 Nonferrous metal foundries 1.0 14.2 12.4 7.4 10.7 37.3 37.3
323120 Support activities for printing 1.5 6.7 9.0 5.8 8.1 23.8 35.4
334514 Totalizing fluid meter and counting device manufacturing 1.0 19.1 7.3 5.2 7.2 33.5 33.5
322210 Paperboard container manufacturing 1.0 16.0 2.2 0.8 11.6 29.7 29.7
325120 Industrial gas manufacturing 1.1 7.8 4.8 0.3 14.0 26.7 28.9
322130 Paperboard mills 1.0 17.6 0.9 0.1 9.7 28.3 28.3
327400 Lime and gypsum product manufacturing 1.0 17.6 1.1 0.3 8.8 27.4 27.4
336360 Motor vehicle seating and interior trim manufacturing 2.0 8.2 2.2 1.3 2.0 12.4 25.1
324110 Petroleum refineries 1.0 7.2 6.4 4.1 10.5 24.1 24.1
2122A0 Iron, gold, silver, and other metal ore mining 38.7
212100 Coal mining 13.4
212230 Copper, nickel, lead, and zinc mining 45.6
2123A0 Other nonmetallic mineral mining and quarrying 34.5
211000 Oil and gas extraction 8.4
212310 Stone mining and quarrying 39.5