inventor ceos and corporate innovation
TRANSCRIPT

Inventor CEOs and Corporate InnovationInventor CEOs and Corporate InnovationInventor CEOs and Corporate InnovationInventor CEOs and Corporate Innovation
AbstractAbstractAbstractAbstract
One in four U.S. high-tech firms are led by CEOs with hands-on innovation experience
as inventors. We show that these “Inventor CEOs” stimulate higher quality firm-level
innovation, especially when they have a personal history of high-impact patents. A
CEO’s technology-class specific inventor experience also predicts the technology classes
in which a firm has its greatest innovation success. Utilizing exogenous CEO turnovers
and R&D tax credit shocks to address the endogenous matching of firms with CEOs
suggests these effects are causal. One channel through which Inventor CEOs stimulate
higher quality innovation is through a superior ability to evaluate innovation-intensive
investment opportunities.
JEL Classification:JEL Classification:JEL Classification:JEL Classification: G32, G34, J24, l26, O31, O32
Key words:Key words:Key words:Key words: Inventor CEOs, Innovation, R&D, Human Capital

1
“Innovation has nothing to do with how many R&D“Innovation has nothing to do with how many R&D“Innovation has nothing to do with how many R&D“Innovation has nothing to do with how many R&D dollars you have. dollars you have. dollars you have. dollars you have.
When Apple came up with the Mac, IBM was spending at least 100 times When Apple came up with the Mac, IBM was spending at least 100 times When Apple came up with the Mac, IBM was spending at least 100 times When Apple came up with the Mac, IBM was spending at least 100 times
more on R&D. It’s not about money. It’s about the people you have, how more on R&D. It’s not about money. It’s about the people you have, how more on R&D. It’s not about money. It’s about the people you have, how more on R&D. It’s not about money. It’s about the people you have, how
you’re led, and how much you get it.”you’re led, and how much you get it.”you’re led, and how much you get it.”you’re led, and how much you get it.” - Steve Jobs, former CEO, Apple Inc.
1111 IntroductionIntroductionIntroductionIntroduction
A CEO’s personal “style” can have a significant impact on corporate policies and
performance (Bertrand and Schoar (2003)). One important, yet unexplored aspect of a
CEO’s personal background that may influence their “style”, is the extent to which they
possess hands-on innovation experience as an inventor. In this study, we examine
whether CEOs with such first-hand experience (Inventor CEOs) impact upon the nature
of their firm’s innovation activities.
To understand why a CEO’s first-hand exposure to technical innovation should
matter, we drawn upon the learning-by-doing literature. This literature contends that
hands-on experience is a critical channel through which individuals acquire and refine
specialized skills (see Arrow (1962), Alchian (1963) and Irwin and Klenow (1994)). In
our context, we hypothesize that a CEO’s inventor experience endows them with a
unique ability to evaluate, select and execute innovative investment projects for the
firms they lead.
Hands-on experience has also been shown to explain the quality of investment de-
cisions in a somewhat related context. Cai, Sevilir and Tian (2015) show that venture
capitalists with experience as entrepreneurs have a positive impact on the performance
of their VC funds. Their argument follows a similar logic to our hypothesis: A VCs
entrepreneurial experience provides them with an information advantage in evaluating
start-up firms. An anecdote provided by Sanjay Mehrota, an Inventor-CEO with more
than 70 patents registered in his name, helps to illustrate how our hypothesis applies in
practise. In describing how his inventor experience has enhanced his executive functions
he notes: “It’s helped me a great deal in understanding the capabilities of our technology,
and in assessing the complexities of the challenges ahead. That makes a big difference
2
in determining strategic plans and in managing execution. It becomes easier to focus
attention on the right issues”.1
To determine the effect of a CEO’s inventor experience on their firm’s innovation,
we assemble a novel hand collected dataset that tracks the patenting history of CEOs
in U.S. high technology firms over a 17-year period prior to the beginning of our sample
period. CEOs that are awarded at least one patent in their own name are designated as
“Inventor CEOs”. We document the presence of Inventor CEOs in 18.7% of all firm-
years in our sample. We choose to limit our focus to the U.S. high-tech sector for two
reasons. First, this sector accounted for virtually the entire U.S. R&D boom, especially
young firms in these industries (Brown, Fazzari and Petersen (2009)). Second, Hambrick,
Black and Fredrickson (1992) show that, unsurprisingly, top executives with technical
backgrounds are concentrated in high-technology industries, where such experience is
most relevant. Thus, we are not likely to observe sufficient variations in Inventor and
Non-inventor CEO led firms outside of these industries.
We find that firms led by Inventor CEOs are associated with a greater volume of
registered patents, more highly cited patents and greater innovation efficiency (patent
output relative to R&D). We also show that Inventor CEO-led firms are more likely to
spur ground-breaking or disruptive innovations, shown by their greater propensity to
produce patents that receive the highest number of citations in any given industry-year.
The positive correlation between Inventor CEOs and innovation needs to be inter-
preted with caution. Inventor CEOs and/or the firms they lead could be self-selected
based on unobservable characteristics that also relate to more successful innovation. We
address this concern in two ways. First, we analyze variations among only the Inventor
CEO sample. If a CEO’s first-hand inventor experience does indeed drive the above
1 The academic profession provides yet another anecdote regarding why hands-on “doing” experience matters
when evaluating innovation. The task of evaluating a paper’s scholarly contribution (or innovation) is exclusively
entrusted to those with proven hands-on experience “doing” innovative research (journal editors and referees). The
implicit assumption behind this practise is that these individuals can identify innovative research precisely because
they have done it themselves.

3
positive correlation, then this effect should be more observable for CEOs with stronger
inventor credentials. Our results show that Inventor CEOs with a history of high-impact
patents are more strongly associated with successful firm-level innovation.
Second, we attempt to tie an Inventor CEO’s specific technology-class experience
more closely with the specific innovation outputs of their firm. In particular, if an In-
ventor CEO’s advantage lies in being able to more effectively evaluate innovation inten-
sive investment opportunities, then we should expect them to exploit this advantage by
focusing on investments in technology-classes related to their own hands-on experience.
To test this conjecture, we categorize each Inventor CEO’s individual patenting experi-
ence before becoming the CEO at their firm into discrete technology classes as defined
by the U.S. Patent and Trademark Office. We then test whether an Inventor CEO’s
prior technology-class expertise affects the technology-class distribution of patents pro-
duced by their firm. We find that technology classes in which an Inventor CEO possesses
first-hand experience increase their percentage share of firm-level patents by around 8
percentage points following the appointment of an Inventor CEO. We also find that an
Inventor CEO’s experience in a particular technology class significantly increases the
likelihood that a firm achieves technological breakthroughs (or radical innovation) in
that specific technology class.
Our analysis of variations among the Inventor CEO sample also uncovers a novel
fact. Almost half of all Inventor CEOs continue to register patents in their own name
during their tenure as CEO.2 We designate CEOs that are named inventors on their
firms’ patents during their tenure, as “Innovation Active CEOs”.3 By construction, an
2 Reconciling a CEO’s everyday activities, with being an active inventor can seem somewhat perplexing. A Silicon
Valley patent lawyer clarifies how this works in practise. “…a lot of innovation is going to involve user-level features.
That’s what CEOs think about in their day job. Those innovations don’t require expensive labs. They can be sketched
out on a white board. In fact, you can develop them sufficiently in an hour or two to support a patent application.”
see https://www.forbes.com/sites/georgeanders/2012/07/16/geniuses-or-dabblers/#7fda011b231a 3 An example of Innovation Active CEO is Netflix’s Reed Hastings. One of Netflix’s important yet simple innovations
was the propeitary design of a DVD envelope that allowed safe and cost effcitive shiping. Patent records show Hastings
was a co-inventor of the envelop design during his tenure as CEO.

4
Innovation Active CEO’s experience is aligned with their current firm’s innovation ac-
tivities. In such cases, their inventor expertise may be more valuable to the firm. Further,
since Innovation Active CEOs have hands-on involvement in their firm’s innovation,
they are likely to be more connected to grass roots innovation efforts within their organ-
izations. Such an innovation-centric leadership style has also been shown to spur superior
innovation within a firm.4 Our results show that the presence of Innovation Active CEOs
is more strongly associated with a firm’s patent impact and patent volume. These results
hold even when excluding firm patents on which the CEO is a named inventor. This
suggests that, in additional to hands-on innovation experience, a CEOs first-hand in-
volvement in their firm’s innovation has important spill-over benefits for firm-wide in-
novation.
The correlation we establish between Inventor CEOs and firm-level corporate in-
novation activities can be interpreted in at least two ways. First, innovative firms or
firms with higher innovation potential may optimally hire Inventor CEOs because they
have the relevant skillset to achieve the firm’s objectives (i.e. endogenous matching).
For example, a firm may wish to innovate in a promising new technology class, and thus
hires an Inventor CEO with relevant experience in this class. The second interpretation
is that Inventor CEOs may in fact be imposing their particular “style” on the firm and
it is this that leads to both a change in technology class focus and higher quality inno-
vation outcomes. It is important to note that both of these interpretations imply the
existence of a unique skillset for Inventor CEOs in stimulating innovation. Thus, we
believe the correlations we document are in themselves an important contribution of our
paper. Nevertheless, it is only the second interpretation that confirms that Inventor
CEOs actively cause firms to become better at innovation, since under the endogenous
matching interpretation it remains unclear whether an Inventor CEO actually delivers
4 Studies in the management literature suggest that CEOs with a transformational (as opposed to a transactional)
leadership style that intellectually engage with their employees, create a corporate culture more conducive to inno-
vation (see Bass and Avolio (1993, 1994), Jung, Chow and Wu (2003))

5
on the strategy they are hired to execute. In other words, the primary driver of innova-
tion outcomes may be the firm’s optimal strategy, rather than the CEO’s role in execut-
ing the strategy.
To identify the causal effect of Inventor CEOs, we study exogenous Inventor CEO
departures and show that firms switching from Inventor to Non-inventor CEOs, experi-
ence an economically sizable and statistically significant reduction in corporate innova-
tion output and impact relative to firms experience an exogenous switch from a non-
inventor to a non-inventor CEO. In a smaller sample of cases, we are also able to study
the effects of these same exogenous departures on the distribution of a firm’s patents
across technology classes. We find that the departure of an Inventor CEO significantly
reduces the likelihood that a firm produces radical innovation in the technology class
where outgoing CEO’s experience lies.
One potential criticism with studying exogenous CEO turnovers is that the choice
of the Inventor CEO’s successor may not be exogenous. In particular, firms replacing
inventors with non-inventors may do so because it is no longer optimal to have an
Inventor CEO. However, since exogenous CEO departures should occur randomly over
time, we argue that the CEO succession choice should not, on average, be systemically
related to a firm’s time-varying innovation potential and thus the decision not to hire
an Inventor CEO.5
To further address the concern that firm-types hiring inventor CEOs are inherently
more innovative, we use a propensity score matched sample of firms to ensure that
Inventor-CEO led firms are compared with appropriate counterfactuals. We continue to
find a strong and economically meaningful positive effect of Inventor CEOs on corporate
5 Our preliminary evidence suggests that the decision not to continue hiring inventor CEOs is likely to be related to
the lack of supply of such CEOs in the labour market, which is exogenous to an individual firm’s innovation activ-
ity. For instance, we find Inventor CEO’s receive significantly higher total compensation, reflecting their short sup-
ply in the labor market.

6
innovation using counterfactuals from the exact same industry and similar propensity
scores constructed using an extensive set of covariates.
We also attempt to rule out several alternative explanations for our story. There
are three such candidate explanations which are particularly compelling. First, it is plau-
sible that many Inventor CEOs are also founder CEOs and it is in fact a founder effect
that is driving our results. After including a founder CEO dummy in our empirical
specifications, we continue to find very similar coefficients on the Inventor CEO coeffi-
cient. In an unreported test, we also exclude all founder CEO firms from our sample and
continue to find a positive and significant coefficient on Inventor CEOs. Second, the
Inventor CEO variable may just be picking up a CEO’s technical expertise, and not
necessarily their inventor experience per se. To deal with this, we control for a CEO’s
technical education (having an undergraduate degree or a Ph.D. in Science, Technology,
Engineering, and Mathematics) and find our results continue to hold. Third, Inventor
CEOs may just be a subset of corporate executives with specialist management skills
suited to high-tech firms (rather than inventor experience). We use the General Ability
Index from Custodio, Ferreira and Matos (2017) to account for the nature of a CEO’s
life-time executive experience and continue to find that Inventor CEOs have a positive
incremental effect on corporate innovation outcomes.
The results also survive the use of firm-fixed effects (for our time varying Inventor
CEO measures) and the inclusion of a host of other control variables that account for
other potentially confounding explanations. These include CEO overconfidence (Hirsh-
leifer, Low and Teoh (2012)), CEO incentives (e.g. CEOs’ ownership, equity based pay,
CEO Delta, CEO Vega), and internal and external corporate governance (e.g. board size,
board independence, and institutional holdings). Our results are also robust to alterna-
tive econometric specifications.
We next investigate the firm-value implications of Inventor-CEOs. The superior
innovation performance of Inventor CEO firms may also result from an over-investment

7
in innovation. Here, while the CEO maybe technically adept, he/she may lack the ability
to evaluate the commercial potential of their innovation and thus harm outside share-
holder value. Further, Innovation Active CEOs may be distracted from their core exec-
utive duties, which could be also detrimental to firm value. Using a simple OLS regres-
sion we document a positive correlation between Inventor CEO-run firms and firm value.
We find that this positive correlation is even stronger for Innovation Active CEOs. To
make stronger causal claims about this result, we employ the same set of exogenous
Inventor CEO departures used above, and conduct a difference-in-difference analysis
examining the changes in valuations around such departures. We find that a change
form an Inventor to a Non-inventor CEO leads to a statistically significant reduction in
firm value, relative to firms that transition from non-inventor to non-inventor CEOs.
Finally, we investigate the economic channels through which Inventors CEOs pro-
mote higher quality innovation at their firms. We focus on providing more direct evi-
dence on whether Inventor CEOs possess a superior ability to select and evaluate inno-
vative investment opportunities. To do this we study one of the largest (and most ob-
servable) investment decisions made by firms, corporate acquisitions. The existence of
superior Inventor CEO investment selection skill, generates several deal-level predictions
in the M&A market.
Bidders in the M&A market can face a winner’s curse problem (Thaler (1988),
Barberis and Thaler, (2003), Baker, Ruback, and Wurgler, (2007)). This problem is most
severe when the target’s valuation is uncertain and when some bidders are more informed
than others. If Inventor CEOs are more informed about the true value of certain types
of target firms, then fearing the winners curse, competing bidders would in equilibrium,
stay away from these targets. Conversely, Inventor CEOs should optimally target firms
which allow them to exploit this information advantage. The lack of bidder competition
for such firms should also generate greater value for the acquirer. We find evidence
consistent with these arguments. Inventor CEO-run firms are more likely to acquire

8
private high-tech firms and firms with larger patent portfolios (i.e. firms that are harder
to value). We also show that when Inventor CEOs acquire such targets, their firms
attract significantly higher acquirer announcements returns relative to acquirers that are
led by non-inventor CEOs. These effects are strongest for Innovation Active CEOs and
high-impact Inventor CEOs.
For many high-tech firms, the success of their investment decisions is ultimately
determined by the traction their products (the investment outputs) achieve with cus-
tomers. Thus, we also study the stock price reaction to new product announcements
made by Inventor CEO-led firms. We show that the stock market reacts more positively
to new product announcements made by Inventor CEOs. This incremental value creation
suggests that the greater volume and impact of patenting produced by firms led by
inventor CEOs reflects the protection of valuable proprietary assets that translate into
superior products and thus increase value for shareholders. It also supports the notion
that Inventor CEOs possess superior skills in choosing to invest in products whose inno-
vativeness appears to be recognised with higher market returns.
The superior ability of Inventor CEOs to select and evaluate investment projects
may not be the only channel through which their inventor experience matters. Our
results may also be explained through other channels which we have not been able to
capture. For example, Inventor CEOs may create an innovation-centric corporate culture
which cannot be easily measured or observed. Inventor CEOs may also naturally possess
personal traits that pre-dispose them to innovative activity. For example, they may be
more ‘open to new experiences’ and thus willing to take more risks or have a higher
tolerance for failure. Acemoglu, Akcigit and Celik (2014) suggest that such personal
characteristics can have a significant impact on corporate innovation.
Our paper makes several contributions to the literature. Firstly, we contribute to
the corporate innovation literature, by uncovering a new CEO characteristic which can
positively affect corporate innovation. This builds on recent work such as Custodio et

9
al. (2017) and Sunder et al. (2016) who show that generalist CEOs and sensation seeking
CEOs, positively affect corporate innovation. Our finding that Inventor CEOs appear to
be more capable of facilitating innovation in their firms, adds to the understanding of
why some firms are more innovative than others (Acemoglu et al. (2014)).
More broadly, our findings complement existing studies on how heterogeneity in
CEO characteristics influences firm outcomes (Bertrand and Schoar (2003)). These stud-
ies suggest that CEOs having particular career experiences can affect firm-level policies.
Daellenbach et al. (1999) find that higher R&D spending is associated with top manage-
ment teams and CEOs’ having technical work experience. Custodio and Metzger (2013,
2014) show that a CEO’s specific expertise affects acquisition returns as well as corporate
policies and firm value. Dittmar and Duchin (2015) show that CEOs with distress expe-
rience use less debt, save more cash and invest less than other CEOs. Bernile et al. (2017)
show a non-monotonic relation between CEO’s early-life exposure to fatal disasters and
corporate risk taking.
2222 DataDataDataData
2.12.12.12.1 Sample SelectionSample SelectionSample SelectionSample Selection
Our sample comprises high-tech publicly traded firms in the S&P 1500 from 1992-
2008 for which we have reliable data on CEO characteristics from ExecuComp. We focus
on high-tech firms because a significant majority of innovation takes place in the high-
tech industries (Brown et al. (2009)) and this is where an Inventor CEO’s experience is
likely to be most directly relevant. We define a firm as being in a high-tech industry
based on the classification in Loughran and Ritter (2004).6 We exclude regulated finan-
cial firms and utilities in our sample as they have negligible R&D investments.
6 Specifically, it includes industries such as computer hardware (SIC codes 3571, 3572, 3575, 3577,
3578); communications equipment (3661, 3663, 3669); electronics (3671, 3672, 3674, 3675, 3677, 3678,
3679); navigation equipment (3812); measuring and controlling devices (3823, 3825, 3826, 3827, 3829);
medical instruments (3841, 3845); telephone equipment (4812, 4813); communications services (4899); and
software (7371, 7372, 7373, 7374, 7375, 7378, 7379).

10
For a firm to be included in our sample, we first require that it is present in the
Kogan, Papanikolaou, Seru amd Stoffman (2016) (henceforth KPSS) Patent dataset.
We use the KPSS (2016) patent data instead of the NBER patent data because it has
six additional years of data coverage. The KPSS patent dataset provides data for all
patents that are granted by U.S. Patent and Trademark Office (USPTO) over 1926-
2010. The dataset provides information on the number of patents and the number of
citations received by each patent filed with the USPTO. We follow the innovation liter-
ature and date the patents by the year of their application (Hall, Grilches and Hausman
(1986)). This also ensures that anomalies caused by the time lag between the applications
and the grant date of a patent are taken care of. We restrict the sample to patents
applications up to 2008 considering that patents applied for after 2008 may not appear
in the dataset until 2010 (the final year of data) because of the time lag in granting
patents. We use PERMNO of the assignee of KPSS patent data to merge the patent
data with Compustat and CRSP. In the baseline OLS based specifications, we assign
zero to firm-years observations without any patenting activity.
2.22.22.22.2 Classifying InventorClassifying InventorClassifying InventorClassifying Inventor CEOsCEOsCEOsCEOs
A major challenge in determining the effect of CEO’s hands on innovation expe-
rience on corporate innovation is the construction an accurate dataset of Inventor CEOs.
We use the US Patent Inventor Database from Li et al. (2014) (henceforth PID) to
identify CEOs in our panel who have been awarded at least one patent. We describe the
matching of the PID dataset to Execucomp in detail in the Appendix.
When we find that a CEOs in our panel has been awarded at least one patent in
their own name, from that point forward, we designate them as an Inventor CEO. To
further explore the effect of Inventor CEO heterogeneity we also construct several other
Inventor CEO measures that reflect their nature of their inventor experience. We first
distinguish Inventor CEOs with a particularly successful inventor track record. To do

11
this, we collect data on how impactful their patents have been, as measured by their
forward-looking citation data. We designate an Inventor CEO as having High-Impact
Innovation experience if they are an patentee on more than 2 patents that accumulates
an above median number of citations in a patent-class-year. In our sample, this median
value is equal to 2. Conversely an Inventor CEO with Low-Impact Innovation experience
will have a below-median number of patent class-year adjusted citations.
Our analysis of CEO patenting behaviour also reveals a somewhat surprising fact.
Half of the Inventor CEOs in our sample, continue to be an active inventor during their
tenure as CEO. We designate such CEOs as “Innovation Active”. In all cases in our
sample, Innovation Active CEOs are named inventors (or co-inventors) on patents reg-
istered to their current firm. This implies that an Innovation Active CEOs patenting
experience is directly relevant to their firm’s innovation activities. To account for the
fact that a CEO can be involved in patent applications well before they are registered,
we designate a CEO to be Innovation active if they have at least one patent issued in
their own name around 2 years of focal firm year while they are CEO.
2.32.32.32.3 MeasurMeasurMeasurMeasuringinginging Innovation at the FirmInnovation at the FirmInnovation at the FirmInnovation at the Firm----levelevelevelevellll
Since we relate a CEO’s Inventor experience to their firm’s innovation outcomes,
we construct several measures to capture firm-level innovation. Following the extant
literature (e.g., Hirshleifer et al. (2012)), we use number of patents applied for (and
subsequently granted) as a proxy for the quantity of innovation. To distinguish major
technological breakthroughs from incremental technological improvements, we also use
the number of citations received by these patents to measure quality of innovation.7
7 Studies employing these two variables to measure innovation performance include among others
Hirshleifer et al. (2012), Seru (2014), Tian and Wang (2014), He and Tian (2013), Hsu, Tian and Xu
(2014) Fang, Tian and Tice (2014), Chemannur and Tian (2013), Bereskin and Hsu (2013), Kang, Liu,
Low and Zhang (2014), Atanassov (2013)

12
We also construct a number of additional variables that capture the efficiency of in-
novation activities. Specifically, we construct log of citations scaled by Patents (average
citations) as this is expected to measure the average quality of the innovation. Addition-
ally, to distinguish ‘disruptive’ innovation form mere technological improvement, we also
construct a variable labelled, “Radical innovation”, a dummy variable equals 1 if the
patent has accumulated the maximum number of citations among all patents applied in
a given year and in a given industry. A similar variable is used in Acemoglu et al. (2014)
to distinguish incremental innovation from radical or disruptive innovation. Specifically,
they measure the fraction the patents of a company that are at the 99th percentile of the
overall citations distribution relative to those that are at the median number of citations.
2.42.42.42.4 ControlControlControlControl VariablesVariablesVariablesVariables
In the baseline specifications, following the innovation literature, we control for
standard covariates that are important determinants of corporate innovation activities.
Our firm-level controls are Firm size defined as the natural log of book value of total
assets of the firm.8 Sufficient investment into innovation inputs (R&D expenditure) is
a necessary but not sufficient condition for innovation success. Since it is plausible that
inventor CEOs could invest more in R&D to achieve above-average innovation success,
we control for R&D scaled by assets to shed light on the efficiency aspect of innovation.
It is important to distinguish any potential Inventor CEO effects from firm age
effects. Thus, we control for firm age in all our specifications since firms’ life cycle may
affect corporate innovation as well as the propensity to hire an Inventor CEO. We also
control for other strategic investments such as capital expenditure scaled by assets. Since
market value is highly correlated with the number of citations of patents, we also control
for Log (Tobin’s Q). The capital structure of R&D intensive firms customarily exhibits
8 Chemmanur and Tian (2013) and Sapra et al. (2014), among others, use natural log of assets to measure firm
size. Hirshleifer et al. (2012) and Kang et al. (2014), among others, use natural log of sales to measure firm size. Our
results are robust using alternative measurements of firm size.
13
considerably less leverage than other firms (Hall (2002)). To account for differences in
financial risk between innovative and non-innovative firms, we control for a firms’ book
leverage in our baseline specifications.
One could argue that CEO tenure could also potentially impact innovation, since
firm specific CEO experience might lead to more efficient innovation, leading us to find
a spurious correlation between Inventor CEOs and corporate innovation. We, therefore,
control for CEO tenure in our baseline regressions. One might also argue that differences
in CEO specific human capital may explain the Inventor CEO effect. As such, we control
for CEO specific human capital using proxies used in the literature. Specifically, we
follow Malmendier and Tate (2008), Galasso and Simcoe (2011), to identify CEOs with
an MBA9 or technical education. To control for CEOs’ expertise in the fields relevant
for innovation, we follow Sunder et al. (2016) and create a separate indicator for CEOs
who hold PhDs in STEM (Science, Technology, Engineering, and Mathematics).
We also control for an Inventor CEOs founder status. Any Inventor CEO effects
may be those generated by an Inventor-founder (Lee, Kim and Bae (2016)). Since no
major dataset has compiled systematic data on founder-CEOs, we hand-collect all rele-
vant information on founders of all the firms in the sample. Specifically, we collect the
data related to names and number of founders of each firm, founding year, etc., from
several sources including 10-K filings of the firms with the SEC available in Electronic
Data-Gathering, Analysis, and Retrieval (EDGAR), the Funding Universe website, com-
pany websites, and other Internet resources including Wikipedia, Forbes pages, Bloom-
berg’s Business Week website, among others. ‘Founder-Dummy’ in a given year is a
dummy variable that equals one if any sources explicitly mention that the current CEO
is one of the original founders of the firm or was a main executive at the time the
company was founded (see, Adams et al. (2009) and Fahlenbrach (2009)).
9 We also consider CEOs’ acquiring Finance Education following Sunder et al. (2016) defined as an indicator
equal to one if CEO received a degree in accounting, finance, business (including MBA), or economics or zero
otherwise. We get similar results.

14
We consider the possibility that the Inventor CEO proxy is picking up the dif-
ference between generalist and specialist CEOs. Custodio et al. (2017) construct a Gen-
eral Ability Index (GAI) that measures the extent to which an executive’s life-time
experience is specialised. We use this index to control for the confounding effect of in-
dustry expertise on our results.
In robustness tests, we also control for other covariates for which the coverage
for our sample firms is far from complete. These are CEO age (Acemoglu et al. (2014)),
CEO Ownership (Kim and Lu (2011)), CEOs extrinsic incentives such as log (1+Delta)
and log (1+Vega) (Sunder et al. (2016), Benabou and Tirole (2003)), CEO overconfi-
dence (Hirshleifer et al. (2012), Galasso and Simcoe (2011)), We show that our findings
are not driven by these factors.
Later in the analysis, we use natural log of Tobin’s Q, log (Tobin’s Q) to measure
the market valuation of the firms. Tobin’s Q is estimated as firm’s market value to the
book value where market value is calculated as the book value of assets minus the book
value of equity plus the market value of equity.
The majority of our financial data is from Compustat’s fundamentals annual data and
ExecuComp. CEO-specific data are collected from ExecuComp and Risk Metrics. The
final KPSS Patent-Compustat-CRSP-ExecuComp-Inventor CEOs merged file leaves us
with 4621 firm-year observations for 543 unique high-tech firms.
2.52.52.52.5 Summary StatisticsSummary StatisticsSummary StatisticsSummary Statistics
We report the distribution of Inventor CEOs by year (Panel A) and by Fama-
French Industry (12) group (Panel B) in Table 1. We identify 150 unique Inventor CEOs
in 134 unique firms. The percentage of Inventor CEOs ranges from 13.5% in 1993 to
23.2% in 2005. Many of the Inventor CEOs are in the Medical Equipment industry group
followed by Electronic Equipment industry group. In panel C of Table 1, we report the
cumulative number of patents Inventor CEOs have been granted as of 2008. A total of

15
48 Inventor CEOs have been awarded a single patent grant, 19 have been awarded 2,
while the rest have been awarded more than 2 patents. We provide a list of Inventor
CEOs with more than 50 patent grants in Panel D of Table 1. The maximum number
of patents that a CEO has been awarded as a patentee in our sample is 222 by Steve
Jobs of Apple Inc.
We provide descriptive statistics for the major variable used in this study in Table 2.
We classify the sample based on the Inventor CEOs variable, our main variable of in-
terest, and report the means, medians and standard deviations for selected variables. We
also compare the sample means and medians between the groups (Inventor CEOs and
Non-Inventor CEOs) and indicate the statistical significance by conducting t-tests and
Wilcoxon-Mann-Whitney tests. We find that a firm with an Inventor CEOs, on average,
has 11.34 (25%) more patents and 112.56 (15.78%) more citations counts per firm-year
observations compared to those of a firm run by Non-Inventor CEOs. Importantly, av-
erage citations per patent are very high for Inventor CEO run firms compared to those
of non-Inventor CEOs run firms (1.59 compared to 1.184) and statistically highly signif-
icant at 1% level. Inventor CEOs, on average, have more strategic investments. Specifi-
cally, Inventor CEOs run firms, on average, spend 1.56 % more in R&D/assets compared
to that of non-Inventor CEOs run firm and given the sample mean of 8.72%, this trans-
lates to approximately 14% more inputs to innovation. This suggests that Inventor CEOs
provide the necessary access to resources to spur innovation. However, to ensure that
this incremental spending on R&D is not driving our results, we control for R&D in all
our specifications of innovations. R&D is only an input to the innovation process and
Inventor CEOs may overspend on R&D, presumably, because of their natural inclination
towards such projects.
In relation to the remaining control variables, Inventor CEO-run firms are, on
average, younger in age, use lower level of leverage and have a higher market value. In
terms of CEO characteristics, Inventor CEOs have, on average, longer tenure and higher

16
stock ownership. We do not find any statistically significant differences in CEO age and
CEO equity-based pay for both the groups. Though there is statistically significant dif-
ference in extrinsic incentives based on the Delta measure, the median difference using
Vega based measure is not statistically significant.
3333 Baseline resultsBaseline resultsBaseline resultsBaseline results
3.13.13.13.1 The effect of Inventor CEOs on firm level innovation.The effect of Inventor CEOs on firm level innovation.The effect of Inventor CEOs on firm level innovation.The effect of Inventor CEOs on firm level innovation.
To examine the effect of Inventor CEOs on corporate innovation, we estimate the
following empirical baseline OLS regressions:
�����������,�� = � + ��������� − ����, + ���, + ��������� + ���� + �,!1#
Where i indexes firm and t indexes time and n indexes periods (1,2 years). Innovation
measure includes Patents i,t+n, Citations i,t+n, Avg Citations i,t+n, defined as log (1+# of
patents), log (1+# of Citations), and log (1+ #of Citations/patents) respectively. Since
the innovation process requires significant time to produce patentable innovation, we
examine the effect of Inventor CEOs on corporate innovation in subsequent periods (at
t+1 and t+2). The results are consistent across across both time period measures so we
only report the one period ahead measures. Z is a vector of firm and CEO level control
variables (described in previous section) that have been found in the innovation litera-
ture to impact the innovation outputs.
Presumably, the innovation performance of high-tech firms in S&P 1500 would
in part be driven by common unobserved year effects. As such, we incorporate year-fixed
effects in our models. Following Zhou (2001), to estimate the real effects of Inventor
CEOs on corporate innovation, which changes little over time but varies substantially
across firms, we do not use firm-fixed effects in our specifications since inclusion of firm
fixed effects absorbs any effect of Inventor CEOs. However, we expect differences in

17
variability to be more systematically related to industry; thus, we use industry-fixed
effects. Following Petersen (2009), we cluster standard errors at the firm level.
Table 3 reports the baseline findings. In columns 1 through 9, the coefficients of
Inventor CEOs are both positive and significant. Specifically, we find that Inventor
CEOs run firms are associated with approximately 27.64% more patents compared to
non-Inventor CEOs run firms (column 1)10. In addition, these Inventor CEOs run firms
are also associated with approximately a 27.64% higher citation count (column 2). This
suggests that Inventor CEOs run firms file patents that are of higher quality. Further,
these firms are also associated with approximately 25.34% more average citations (col-
umn 3) underscoring their impactful innovation. Since innovation can materialize over
long periods of time, we also run the regressions using two-year ahead forward-looking
innovation measures (yeart+2). The unreported results show that a continued to find
consistent association of Inventor CEOs with corporate innovation.
The sign and magnitude of other control variables are broadly consistent with
literature. For example, the coefficient on R&D/Total Assets is positive and significant
in all the regressions. Larger firms (Firm size) are associated with higher quantity and
quality of innovations. Firm leverage is negatively associated with corporate innovation
consistent with literature (Hall (2002)). We also find positive coefficient on Tobin’s Q
consistent with the literature (Lerner (1994)).
In specifications (4) through to (9) we also include additional control variables
that could explain the Inventor CEO effect. These are a Founder CEO effect, a measure
of CEO overconfidence and measure of whether the CEO is a generalist or a specialist
from Custodio et al (2017). Our result continues to hold even after controlling for these
effects.
10 The mean value of Patents (t+1) is 1.7553. Therefore, the economic magnitude is calculated as
$ %������!� + 1#⁄ / or 0.485/1.7553 or 27.64%. Similarly, we calculate such magnitude for Citations (t+1) and Average
Citations (t+1).

18
In Table 4 we focus on studying the effect of Inventor CEO heterogeneity on firm
level innovation. In particular, we examine the effect of the Innovation Active CEOs
and High and Low Impact Inventor CEOs as defined in the previous section. In line with
our expectations, the firm-level innovation effects of Inventor CEOs are intensified when
the firm is run by an Innovation Active or a High impact CEO. In column (9) we exclude
Innovation Active CEOs to ensure that we can establish an independent effect of High-
impact inventors, who were active in the past but not presently. The results support the
notion that corporate innovation outcomes tend to be superior, when the CEO has past
high impact inventor experience, but does not actively invent during their tenure.
3.23.23.23.2 Do Inventor CEOs spur Radical Innovation?Do Inventor CEOs spur Radical Innovation?Do Inventor CEOs spur Radical Innovation?Do Inventor CEOs spur Radical Innovation?
In this section we test whether Inventor CEOs, on average, are associated with
radical or break-through innovations.11 We define radical innovation as those patents in
industry-year pairs that have been cited the maximum number of times thereby indica-
tion that they are highly influential and radical in nature. Specifically, ‘Radical Innova-
tion’ is dummy variable taking the value one if the firm has filed the patent that accu-
mulated the maximum number of citation in the industry-year pair. This construction
of innovation measure is similar to ‘tail innovations’ as in Acemoglu et al. (2014) who
define tail innovation using overall citations distributions (specifically, patents cited at
the 99th percentile of the citations distribution). We report the results of the regressions
in Table 5. In columns 1 through 3, we report the results from the logit model. In the
11 In motivating their study on openness to disruption and creative innovation, Acemoglu et al. (2014) provide
two examples of radical innovation: 1) “systems and methods for selective electrosurgical treatment of body struc-
tures” by the ArthroCare Corporation which garnered 50 citations ( compared to median citations of four within
field of drugs and medical innovation) and 2) “method and system for placing a purchase order via a communica-
tions network” by Amazon which garnered citations 263 citations ( compared to median citations of five within the
technology class) within five years (2088 citation as of date)11. Interestingly, both firms are also among the firms
run by Inventor CEOs in our sample. In case of Arthrocare Corporation, CEO Michael A. Baker is an active inno-
vator awarded with as many as 12 patents. In the second example, Jeffrey P. Bezos himself is one of the four co-
patentees of this radical innovation and thus an Inventor CEOs as per our definition.

19
last column, we report the results form a liner probability model. Overall, we show that
Inventor CEOs run firms are associated with higher probability of filing patents that are
radical in nature.
We also examine whether the likelihood of filing ground breaking patents is higher
among those Inventor CEOs who are either Innovation Active or who have a history of
high impact patents as Inventors. The results show that when CEOs are actively in-
volved their firm’s innovation and/or when they have a history of high impact patents,
their firm is more likely to responsible for radical innovations. Therefore, these Inventor
CEOs are associated with innovations that cause the most fundamental “creative de-
struction” (Acemoglu et al. (2014)).
3.33.33.33.3 Does an Inventor CEODoes an Inventor CEODoes an Inventor CEODoes an Inventor CEO’’’’s Specific s Specific s Specific s Specific Technology Class Technology Class Technology Class Technology Class Experi-Experi-Experi-Experi-
enceenceenceence Matter?Matter?Matter?Matter?
In this section we breakdown an Inventor CEO’s past experience before becoming
CEO into various technology classes, defined by the USPTO. In total, there are 430
different technology classes under which patents can be registered. Once we determine
the classes in which the CEO has patents, the next step is to determine the distribution
of a firm’s newly registered patents across these same technology classes in every sample
year. This is defined as the percentage share of a firm’s total registered patents in each
sample year, that occurs in each of the possible 430 technology classes. For every firm-
year, the percentage of patents across all technology classes must sum to one.
We then estimate several OLS regression models to determine how a CEO’s patent-
technology-class experience is related to the firm’s patent outputs. In this analysis, the
unit of observation is a firm-year-technology class. The dependant variable in this re-
gression is the percentage of a firm’s patents in a given year that are registered in each
class. The key explanatory variable is an indicator variable equal to one when the CEO
is an Inventor with prior personal patenting experience in the given technology class,
and zero otherwise.

20
We also control for a number of other firm factors that could explain variations in
the share of patents produced in a given class. The first is a firm’s patent breadth,
defined as the number of patent classes in which the firm holds patents. As the firm
expands the number of patent classes in which it innovates, then the share of patents in
each class should mechanically fall. Second, we control for firm size, as larger firms may
be more capable of producing patents across a more diverse range of classes. Finally we
control for a firm’s research and development expenditure, as this can also explain the
number and diversity of new patents being registered. We drop many of the controls
used in earlier models, as there does not appear to be any economic rationale for these
controls to influence the distribution of patents across different classes, which is our
main concern here.
The results are in reported Table 6. We report a variety of specifications, that
vary based on the level at which we impose fixed-effects, and on whether control varia-
bles are included. Regardless of the specifications used, the Inventor CEO class experi-
ence dummy is consistently positive and statistically significant and maintains a strik-
ingly consistent economic magnitude. Specifically, in years where a firm has an Inventor
CEO with experience in a technology class, a firm’s share of patents registered in that
class increases by around 7 to 8 percentage points. Given that the mean share of patens
in a class is 8.29 percent (based on firm-years with patents), then this represents a
doubling of a firm’s focus on particlar techology class when a CEO has experience in this
class.
Finally, we examine whether a CEO’s specific experience increases the likelihood
that a firm produces radical innovation in a particular technology class. We define a
firm as having radical innovation in a particular class, if one of the patents registered
by the focal firm within that technology class in a year is cited in the 99th (or 90th)
percentile of the citations distribution of a patent-class-year. If this is the case then we
specify the dependant variable, Radical Innovation 99th Percentile as being equal to 1
21
and zero otherwise. The independent variables are the same as those in in Table 6, with
one exception. We include the total number of patents registered by a firm in a year as
an additional control, as a greater volume of patenting may mechanically increase the
likelihood that a firm produces a patent that becomes highly cited. The results reported
in Table 7 indicate an Inventor CEO’s technology class experience, significantly increases
the likelihood that their firm generates radical innovation in that same class.
4444 Identification StrategiesIdentification StrategiesIdentification StrategiesIdentification Strategies
4.14.14.14.1 Exogenous CEO turnoversExogenous CEO turnoversExogenous CEO turnoversExogenous CEO turnovers
As mentioned earlier, it is likely that highly innovative firms or firms with higher
innovation potential may hire Inventor CEOs who would ideally suit such organizational
settings. Inventor CEOs may also wish to join more innovative firms to exploit their
potential. Thus, the relationship that we find could be plagued by endogenous matching
of Inventor CEOs to highly innovative firms. Claiming causality thus hinges on identi-
fying a source of exogenous variation in CEOs that potentially breaks this endogenous
matching link. To tackle this endogeneity issue, ideally one would like to have a natural
experiment where one can randomly assign Inventor CEOs to firms and observe the
outcome of interest. Unfortunately, this is not feasible. Another alternative could be to
observe changes in CEO position caused by sudden death and study how that affect
corporate innovation. However, limited observations on sudden CEO deaths for the panel
under study, renders such tests infeasible again. Alternatively, one could study all CEO
turnovers, in general, and study the effect of such incidents on corporate innovation as
in Galasso and Simcoe (2011) and Sunder et al. (2016). However, as documented in the
literature, many CEO transitions are also highly endogenous since it is possible that
CEO turnovers are related to the variable of interest.
To overcome this probable endogenous matching of Inventor CEOs by innovative
firms and provide causal evidence, we rely on data in Eisfeldt and Kuhnen (2013) that

22
classifies CEO turnovers during the period 1992-2006 as exogenous, forced and unclassi-
fied turnovers.12 They identify a CEO turnover as exogenous if the CEO departures were
announced at least six months before the succession, or caused by a well-specified health
problem. A similar approach (age based natural retirements as exogenous cases of man-
agerial changes) is followed in Denis and Denis (1995) and Weisbach (1995). As argued
in the literature (e.g., Fee, Hadlock and Pierce (2013)), we do not use forced CEO turn-
overs and unclassified CEO turnovers since these events are highly endogenous (e.g.,
Weisbach (1988), Warner, Watts and Wruck (1988), Fee and Hadlock (2000)).
Methodologically, we follow CEO switching analysis as in Galasso and Simcoe
(2011), however deviate in terms of event selection. Galasso and Simcoe (2011) use 28
cases of CEO switching, regardless of CEO change type (endogenous or plausibly exog-
enous). To deal with the endogeneity of CEO transitions, we conduct analysis on a
matched sample of only exogenous CEO turnovers. For “exogenous CEO turnovers”
involving Inventor CEOs (our treated firms), we find corresponding matched firm-year
observations of exogenous CEO turnover events where a non-Inventor CEOs was re-
placed by another non-Inventor CEOs (counterfactual turnover firms). More importantly,
we also require that the matched event should be from the same 2 digit SIC and within
certain range of firm size.13 When we merge the Eisfeldt and Kuhnen (2013) data with
our sample, we find 372 events of CEO changes of which 77 are exogenous CEO turno-
vers. Of these 77 exogenous CEO turnovers, 15 CEO turnovers involve a transition from
‘Inventor CEOs’ to non-Inventor CEOs. From the remaining exogenous CEO turnovers,
we find the corresponding matches following the matching criteria described above. No-
tably, we do not include those exogenous turnover events where an Inventor CEOs was
replaced by another Inventor CEOs or a non-Inventor CEOs was replaced by an Inventor
CEOs to conduct a cleaner test. We retain data for firm-year observations from 3 years
12 https://sites.google.com/site/andrealeisfeldt/ . 13 We use within 15% of focal firm size to consider a probable match.

23
before exogenous CEO turnover and 3 years after such exogenous turnover events for
both the treated and the control firms.
We employ firm fixed effects specification in this matched sample of CEO turno-
ver analysis since we have variations (by construction) in our main explanatory variable-
Inventor CEOs. Specifically, we run the following regression
�����������,��
= � + �'������(��)��))� + ��*�+�������������
+ ,'������(��)��))� ∗ �*�+�����'������� +���� + .��)�
+ �,!2#
Treated firm dummy is a dummy variable that takes the value 1 (both in pre and
post exogenous turnover events) if the firm has experienced a CEO transition of Inventor
CEOs to non-Inventor CEOs or 0 otherwise for control firms (that is 0 if transition is
from non-inventor to non-Inventor CEOs). Exogenous turnover is a dummy variable
taking the value 1 in periods following such exogenous turnover and 0 for pre-exogenous
turnover. The coefficient on interaction term (Treated firm * Exogenous turnover) is of
particular interest. If there is any causal effect of Inventor CEOs on corporate innovation,
we would expect a negative coefficient on this interaction terms since the exogenous
change of Inventor CEOs to non-Inventor CEOs should cause a decline in innovation
efficiency. One more confounding factor that we should consider is unobservable time
invariant firm-level characteristics that could simultaneously determine changes in CEO
position and corporate innovation outcome. We take this into account by employing
firm-fixed effects with and without other potentially important firm and CEO charac-
teristics that we observe such as Firm size, R&D to Assets, CAPEX to Asset, log (To-
bin’s Q) and Founder-CEO status.
We report the results of the regressions in Table 8. In column 1, we find that the
interaction term is negative and significant implying that corporate innovations of firms
experiencing a transition from Inventor CEOs to non-Inventor CEOs decline significantly

24
compared to those of firms where non-Inventor CEOs were replaced by other non-Inven-
tor CEOs. We show that, post-exogenous CEO turnover, corporate innovation increases
for firms in general. However, for firms run by Inventor CEOs, we show an economically
sizable and statistically significant reduction in corporate innovation post exogenous
CEO turnover, thereby implying that the relationship between Inventor CEOs and cor-
porate innovation is causal with causation running from Inventor CEOs to innovation.
4.24.24.24.2 QuasiQuasiQuasiQuasi----natural experimentnatural experimentnatural experimentnatural experiment using R&D Tax Credit Shocks.using R&D Tax Credit Shocks.using R&D Tax Credit Shocks.using R&D Tax Credit Shocks.
In this section, we design a quasi-natural experiment using the staggered changes
of R&D tax credits across U.S. states and over time to examine whether the Inventor
CEOs responded differently to changes in incentives to innovate. This strategy enables
us to find plausibly exogenous sources of variation in incentives to innovate.
More importantly, the staggered nature of the changes in R&D tax credit (shocks)
allows us to create appropriate counterfactual firms. We use two counterfactuals to con-
duct two tests. First, we construct a set of non-Inventor CEOs (control firms) from the
states that have induced R&D tax credit shocks and compare their responses against
those of Inventor CEOs (treated firms) from the same shock inducing states both in pre
and post shock periods. This is methodologically similar to Almeida, Kim and Kim (2015)
which use Asian financial crisis of 1997 as a shock to study differential responses of
Chaebol (treated firms) and Non-Chaebol firm (Control firms).
In our context, since both Inventor CEOs (treated firms) and non-Inventor CEOs
(Control firms) are exposed to the same shock, this would enable us to provide causal
evidence since such shocks are plausibly exogenous. More importantly, we create the
sample of control firms by matching them with treated firms using pre-shock firm level
covariates and industry of operation. We report the results in Panel A of Table 9. We
show that the pre-treatment difference between the groups widens in the post-treatment
period in favour of the Inventor CEOs. More importantly, the difference-in-differences
is positive and significant which suggest that Inventor CEOs have a superior response

25
to such innovation enhancing incentives in ways that provides their firms with compet-
itive advantages.
However, the response of the Inventor CEOs to the shock can be driven by un-
observable firm characteristics that are correlated with having an Inventor CEO. A
related possibility is that Inventor CEO-run firms increase their innovation constantly
over time, and this explains the difference documented earlier. To address this, we use
our second set of counterfactual firms which comprise of Inventor CEOs from states that
did not experience R&D tax credit shock. Within this group, any difference will not be
driven by unobserved heterogeneity. Since we are comparing Inventor CEOs from states
(e.g., California, Illinois) that experienced such shock (treated group) to Inventor CEOs
from other states (e.g., New York, Massachusetts) that did not experience such a shock
(control group), we can tease out whether Inventor CEOs proactively take advantage of
the change in the tax environment. This would highlight their innovation-spurring abil-
ity as opposed to innovative firms who are just matched with Inventor CEOs, since for
both groups CEO assignment has already occurred in pre-shock period.
Methodologically, this test is similar to Card and Kruger (1994) which compare
the impact of increase in minimum wage in New Jersey (law enacting states) to that of
eastern Pennsylvania (state that did not enact such law). In addition, following Card
and Krueger (1994), we match the control firms with treated firms on important pre-
shock dimensions. Specifically, we match the control firms based pre-treatment R&D
intensity, pre-treatment firm size and Industry of operation. Since we compare changes
in key outcomes from pre-shock period to post-shock period, our methodology “differ-
ences out” unobserved time-invariant heterogeneity. We provide the difference-in-differ-
ence Matching Estimator (DID-ME) in Panel B of Table 9.
In the pre-shock period, there is no statistically significant difference in innovation
outcomes (patents (t+1)) of Inventor CEOs run firms from shock inducing states
(treated firms) and Inventor CEOs run firms from states that did not induce such shocks

26
(control firms). In the post shock periods, we find statistically significant positive differ-
ence in favor of the treated groups. More importantly, difference-in-differences is positive
and significant suggesting that Inventor CEOs from states that experienced such shock
outperformed the control group. This evidence underscores the innovation spurring abil-
ity of the Inventor CEOs as opposed to endogenous matching based explanations.
4.34.34.34.3 Propensity score matched samplePropensity score matched samplePropensity score matched samplePropensity score matched sample
Though we control for observable firm and CEO characteristics in our baseline
specification, linear controls may not be sufficient since Inventor CEO-run firms may
differ systematically from non-Inventor firms. In this section we provide evidence on
effect Inventor CEOs on corporate innovation using propensity score matching (PSM)
technique. Specifically, we estimate propensity scores using all the control variables of
baseline specification along with industry and year-fixed effects. After estimating the
propensity scores, we match each treated firm-years to counterfactuals or control firm-
year observations that (1) are from the exact same 2 digit SIC industry, (2) have esti-
mated propensity scores that differ from treated firms propensity score by no more than
10% (Caliper 0.10). Each Inventor CEOs firm-year observation is matched to either one
or two of its nearest neighbours.
The PSM procedure yields a more balanced sample of firm-year observations
where the firm characteristics are similar. We report the results of regressions for this
balanced sample in Table 10. In columns 1 through 4 (columns 5 through 8), we use one
(two) matches per treated firm. We continue to find positive effect of Inventor CEOs on
corporate innovation. Since this propensity score matched sample controls for observable
differences between Inventor CEOs run firms and non-Inventor CEOs run firms, this
PSM based analysis instils confidence in our interpretation by reducing the potential for
endogeneity induced by selection bias.
4.44.44.44.4 Value creation by Inventor CEOsValue creation by Inventor CEOsValue creation by Inventor CEOsValue creation by Inventor CEOs

27
While we have provided evidence suggesting a causal link between Inventor CEOs
and corporate innovation, this need not be value enhancing for all firms. Inventor CEOs
could be overinvesting in innovation. For example, some studies have documented dis-
satisfaction with corporate venture capital programs because CEO’s make risky invest-
ments in early stage innovative projects that do not generate sufficient returns for share-
holders. Further, Innovation Active CEOs, may become distracted from other important
aspects of their executive role, and this may be value reducing. Another dimension of
this problem is that Innovation Active CEOs could use corporate resources to pursue an
activity (inventing) from which they derive personal enjoyment, but that is not value
enhancing for shareholders.
We test whether Inventor CEOs indeed generate greater market value for share-
holders. We use Tobin’s Q as the dependent variable to measure market valuation and
report the results in Table 11. We find that Inventor CEOs are associated with higher
market valuation and the magnitude is both economically and statistically significant.
The results are even stronger for Innovation Active CEOs. To make stronger causal
claims about this results we examine the same set of exogenous CEO turnovers used in
our previous analysis, to examine the valuation consequences of an exogenous transition
from an Inventor to Non-Inventor CEO. The results in Column (4) of Table 11, are in
line with the aggregate correlation from the broader sample. This suggests that Inventor
CEOs indeed create value for the shareholders they serve in addition to playing an
important economic function by spurring high impact innovation.
5555 EconoEconoEconoEconomic Channels through which Inventor CEOs Fa-mic Channels through which Inventor CEOs Fa-mic Channels through which Inventor CEOs Fa-mic Channels through which Inventor CEOs Fa-
cilitate Innovationcilitate Innovationcilitate Innovationcilitate Innovation
5.15.15.15.1 The Acquisition Behaviour of Inventor CEOsThe Acquisition Behaviour of Inventor CEOsThe Acquisition Behaviour of Inventor CEOsThe Acquisition Behaviour of Inventor CEOs

28
While we conjecture that Inventor CEOs can spur greater innovation at their firms for
various reasons, our evidence thus far does not nail down any specific channels through
which this occurs. In this section, we focus on whether the investment decisions of In-
ventor CEOs reflect a superior ability to identify and evaluate innovation-intensive in-
vestment opportunities. To do this we focus on acquisitions made by firms in our sample.
Acquisitions are among the largest investment decisions made by firms and importantly,
possess many observable characteristics that make it possible to identify differences be-
tween the acquisition behaviour of Inventor versus non-Inventor CEOs.
We expect that Inventor CEOs have a greater ability to evaluate the innovative
potential of investment projects because of their own first-hand knowledge of the inno-
vation process. In the context of the M&A market, this advantage has several testable
empirical implications. First, we expect that Inventor CEOs should exploit their infor-
mation advantage to acquire other innovation-intensive firms. Second, their advantage
should be most valuable when it is hard to value the innovation intensive assets of the
target, and third such acquisitions by Inventor CEOs should create more value for share-
holders relative to similar acquisitions conducted by non-inventor CEOs.
We test these predictions by assembling a set of acquisitions made by our sample firms
from the SDC database from 1992-2008. In deal selection, we follow Masulis, Wang and
Xie (2007). Specifically, we require the following criteria:
1. The Acquisition is complete.
2. The acquirer controls less than 50% of the shares prior to the announcement
and owns 100% of the target’s share after the transaction.
3. The deal value is more than $ 1 million and at least 1% of the acquirer’s
market value of equity measured on the 11th trading day prior to the an-
nouncement date.
4. The Acquirer has annual financial statement information available from Com-
pustat and stock return data from CRSP.

29
Our first empirical test focuses on whether Inventor CEOs target firms with
greater patent intensity. To test this, we employ logistic regression where the dependent
variable is an indicator variable which takes the value 1 if the target in a M&A deal is
a firm that has received patent grants in the past. The results in Table 12, column 2
show that the Inventor CEO dummy is positive and statistically significant and thus
suggest that Inventor CEOs are more likely to select innovative firms as targets. An
alternative interpretation of this results, is that Inventor CEOs may also be better able
to integrate the technologies of both the acquirer and target.
Next, we examine whether Inventor CEOs have a greater propensity to acquire
private targets. Presumably private targets should have greater information asymmetry
and thus inventor CEOs should have a greater advantage in making value accretive
acquisition decisions with respect to these firms. We test this in columns 1 of Table 12
where the dependent variable is an indicator that takes the value 1 if the target in a
M&A deal is a private firm. The results in suggest that indeed Inventor CEOs have a
greater propensity to acquire private firms.
An inventor CEO’s decision to acquire private innovative targets can be risky for
shareholders given the information asymmetry surrounding such deals. Thus, our final
test seeks to determine whether such deals are perceived to be value enhancing. In par-
ticular, we explore whether the innovation-specific experience of a CEO impact the mar-
ket’s perception of a quality of a deal. To test this implication, we calculate 5-day cu-
mulative abnormal returns (CARs) during the window encompassed by event days (-2,
+2), where event day 0 is the announcement day of acquisition (Masulis et al. (2007)).
We also control for other determinants of acquirers returns following the M&A literature.
Specifically, we control for host of firm level characteristics such as firm size (Moeller,
Schlingemann, and Stulz (2004), leverage (Garvey and Hanka (1999)), Cash to assets
ratio (Jensen (1986)), Tobin’s Q (Lang, Stulz, and Walking (1991); Servaes (1991); and
Moeller et al. (2004)) among other control variables. We also control for our baseline

30
CEO characteristics. In addition, we control for deal-specific characteristics such as
public target indicator and private target Indicator (Fuller, Netter, and Stegemoller
(2002), relative deal size (Asquith, Brunner, and Mullins (1983); Moeller et al. (2004)),
diversifying deal indicator (Morck, Shleifer, and Vishny (1990)). Controlling for a host
of factors that can affect acquisition announcement returns, we find that acquiring firm
led by an Inventor CEO experience significantly higher announcement returns. The co-
efficient estimates in Table 13 suggest that Inventor CEOs increase firm value by about
0.8% from M&A deal announcements. Panel B of Table 13 Indicates that Innovation
active CEOs have an even larger effect.
Inventor CEOs’ advantage in valuing the innovation intensive assets of the target
should be most valuable when the information asymmetry is high. Specifically, when the
target firms are private and /or have patent portfolios, the market should weigh in the
first-hand innovation experience of the Inventor CEOs more positively. To test this
hypothesis, we conduct two separate tests. First, we split the sample into private targets
and non-private targets. Second, we split the sample based on whether the target is a
private firm that also has received patents in the past. We present the results of these
tests in columns 2 and 3 (Private vs. non-private split) and in columns 4 and 5 (Private
and innovative targets vs. non-private and non-innovative targets) of Table 13. The
results indicate that the magnitude of this effect is around 1.4 percentage points, on an
average, when the target firms are private. More importantly, we find even more strong
market response of about 3 percentage points for Inventor CEOs when the targets are
private and innovative firms. The economic magnitude of this effect is quite significant
given that on average the announcement returns to an acquisition on a target firm is
about 0.17%, in our sample. In Panel B of Table 13 we find that the effect of Innovation
Active CEOs to be even larger.
5.25.25.25.2 Market reactions to Major Product AnnouncementsMarket reactions to Major Product AnnouncementsMarket reactions to Major Product AnnouncementsMarket reactions to Major Product Announcements

31
In this section, we provide additional evidence on incremental value creation us-
ing abnormal positive stock market reactions from major product announcements. Since
Inventor CEOs cause higher innovation productivity, it is more likely that such innova-
tion success would translate to introduction of breakthrough products. Chaney and
Devinney (1992) provide direct evidence on firms’ earning significant excess return on
announcing new products or services. They also show that truly new product or innova-
tions are shown to outperform the simple reformulation of existing products. Since we
document that Inventor CEOs run firms generate radical innovation or breakthrough
innovations, the likelihood of introducing truly new products by Inventor CEOs run
firms would be high. As such, Inventor CEOs run firm are more likely to generate incre-
mental value from positive abnormal announcement returns from announcements of such
breakthrough products. We test this conjecture by collecting data on new product an-
nouncement returns from Mukherjee, Singh and Zaldokas (2016)14 and present the re-
sults in Table 14.
Mukherjee et al. (2016) combine textual analysis with event studies on stock
market returns to construct the new product announcement returns. They implement
event study methodology by fitting a market model over (-246,-30) period, and then
estimate cumulative abnormal returns over the three (-1, 1) day period around a firm
corporate press release related to product announcement. Specifically, in column 1 we
show that Inventor CEOs run firms enjoy approximately 20 basis point higher announce-
ment returns over the year and this is both economically and statistically significant. In
column 2, we show that response is slightly higher for Innovation Active CEO. Column
3 indicates that High-impact Inventor CEOs also experience significant positive an-
nouncement returns, although they are not as large.
14 https://sites.google.com/site/abhiroopmukherjee/

32
We also run regressions o the log of number of new product announcements with
cumulative returns above the 75 percentile as dependent variable in Columns (5), (6)
and (7). A positive coefficient (large and statistically significant) confirms our conjecture
that all types of Inventor CEOs indeed are associated with more breakthrough product
announcements. Thus, this test provides direct evidence on incremental value creation
by the Inventor CEOs.
6666 ConclusionConclusionConclusionConclusion
In this paper we show that Inventor CEOs are more capable of stimulating high
quality innovation within the organizations they lead. We identify Inventor CEOs as
those who have patents in their own names and hence possess demonstrated ability and
first-hand experience in innovation. We argue that inventor CEOs hand-on personal
experience endows them with a superior ability to select and evaluate innovative invest-
ment opportunities.
We use exogenous CEO turnover as an identification strategy to infer causality.
The evidence is suggestive of causal relationship between Inventor CEOs and corporate
innovation with causality running from Inventor CEOs to innovation. Exploring the
channels through which Inventor CEOs spur greater innovation at their firms, we find
evidence consistent with the notion that they possess a superior ability to identify inno-
vative investment opportunities and products. We contribute to the understanding on
the effect of CEO characteristics on firms’ outcome by offering a new identifiable CEO
characteristic that is measurable, independently verified under rigorous scrutiny of pa-
tent examiners of a USPTO and is meaningfully related to an important firm outcome.

33
ReferencesReferencesReferencesReferences
Acemoglu, D., Akcigit, U., & Celik, M. A. (2014). Young, restless and creative: Openness
to disruption and creative innovations (No. w19894). National Bureau of Economic Re-
search.
Adams, R., Almeida, H., & Ferreira, D. (2009). Understanding the relationship between
founder–CEOs and firm performance. Journal of Empirical Finance, 16(1), 136-150.
Aghion, P., Van Reenen, J., & Zingales, L. (2013). Innovation and institutional owner-
ship. The American Economic Review, 103(1), 277-304.
Alchian, A. (1963). Reliability of progress curves in airframe production. Econometrica:
Journal of the Econometric Society, 679-693.
Almeida, H., KIM, C. S., & Kim, H. B. (2015). Internal capital markets in business
groups: Evidence from the Asian financial crisis. The Journal of Finance, 70(6), 2539-
2586.
Amabile, T. M. (1996). Creativity in context: Update to the social psychology of crea-
tivity. Boulder, CO: Westview Press.
Arrow, Kenneth J. "The Economic Implications of Learning by Doing." Rev. Econ. Stud-
ies 29 (June 1962): 155-73
Asquith, Paul, Robert F. Bruner, and David W. Mullins, Jr., 1983, The gains to bidding
firms from merger, Journal of Financial Economics 11, 121–139
Atanassov, J., 2013. Do hostile takeovers stifle innovation? Evidence from antitakeover
legislation and corporate patenting. Journal of Finance 68, 1097–1131.
Bass, B. M., & Avolio, B. J. (1997). Full range leadership development: Manual for the
Multifactor Leadership Questionnaire (pp. 43-44). Palo Alto, CA: Mind Garden.
Benabou, R., Tirole, J., 2003. Intrinsic and extrinsic motivation. Review of Economic
Studies 70, 489–520
Bereskin, F., & Hsu, P. H. (2013). New dogs new tricks: CEO turnover, CEO-related
factors, and innovation performance. Working paper series. SSRN.

34
Bertrand, M. and A. Schoar (2003). Managing with Style: The effect of Managers on
Firm Policies. Quarterly Journal of Economics, 118(4), 1169-1208.
Bloom, N., Schankerman, M., & Van Reenen, J. (2013). Identifying technology spillovers
and product market rivalry. Econometrica, 81(4), 1347-1393.
Brown, J.R., Fazzari, S.M. and Petersen, B.C (2009). Financing Innovation and Growth:
Cash Flow, External Equity, and the 1990s R&D Boom. The Journal of Finance, 64 (1).
Card, D. & Krueger, A.B., 1993. Minimum wages and employment: A case study of
the fast food industry in New Jersey and Pennsylvania. The American Economic Review,
Vol. 84, No. 4. (Sep., 1994), pp. 772-793
Celikyurt, U., Sevilir, M., & Shivdasani, A. (2012). Venture capitalists on boards of
mature public firms. The Review of Financial Studies, 27(1), 56-101.
Chaney, P.K. & Devinney. T. M. (1992), New product announcement and stock price
performances. Journal of Business Finance & Accounting, 19(5),677-695.
Chemmanur, T. J., & Tian, X. (2013, March). Do anti-takeover provisions spur corpo-
rate innovation?. In AFA 2012 Chicago Meetings Paper.
Custódio, C., & Metzger, D. (2013). How do CEOs matter? The effect of industry ex-
pertise on acquisition returns. Review of Financial Studies, 26(8), 2008-2047.
Custódio, C., & Metzger, D. (2014). Financial expert CEOs: CEO׳s work experience
and firm׳ s financial policies. Journal of Financial Economics, 114(1), 125-154.
Custodio, C., Ferreira, M. A., & Matos, P. P. (2017). Do general managerial skills spur
innovation? Management Science (forthcoming)
Coles, J. L., Daniel, N. D., & Naveen, L. (2006). Managerial incentives and risk-taking.
Journal of Financial Economics, 79(2), 431-468.
Coles, J. L., Daniel, N. D., & Naveen, L. (2014). Co-opted boards. Review of Financial
Studies, 27(6), 1751-1796.
Daellenbach, U. S., McCarthy, A. M., & Schoenecker, T. S. (1999). Commitment to
innovation: The impact of top management team characteristics. R&D Management,
29(3), 199-208.

35
Datta, D. K., & Guthrie, J. P. (1994). Executive succession: Organizational antecedents
of CEO characteristics. Strategic Management Journal, 15(7), 569-577.
Denis, D. J., and D. K. Denis. 1995. Performance changes following top management
dismissals. Journal of Finance 50:1029–57.
Dittmar, A., & Duchin, R. (2015). Looking in the rearview mirror: the effect of managers'
professional experience on corporate financial policy. The Review of Financial Studies,
29(3), 565-602.
Eisfeldt, A. L., & Kuhnen, C. M. (2013). CEO turnover in a competitive assignment
framework. Journal of Financial Economics, 109(2), 351-372.
Fahlenbrach, R. (2009). Founder-CEOs, investment decisions, and stock market perfor-
mance. Journal of financial and Quantitative Analysis, 44(02), 439-466.
Fang, V., Tian, X., Tice, S., 2014. Does stock liquidity enhance or impede firm innova-
tion? Journal of Finance 69, 2085–2125.
Fee, C. E., & Hadlock, C. J. (2000). Management Turnover and Product Market Com-
petition: Empirical Evidence from the US Newspaper Industry. The Journal of Business,
73(2), 205-243.
Fee, C., Hadlock, C., Pierce, J., 2013. Managers with and without style: Evidence using
exogenous variation. Review of Financial Studies 26, 567–601.
Fuller, Kathleen, Jeffry Netter, and Mike Stegemoller, 2002, What do returns to acquir-
ing firms tell us? Evidence from firms that make many acquisitions, Journal of Finance
57, 1763–1794.
Galasso, A., Simcoe, T., 2011. CEO overconfidence and innovation. Management Science
57, 1469–1484.
Garvey, Gerald T., and Gordon Hanka, 1999, Capital structure and corporate control:
The effect of state antitakeover laws on firm leverage, Journal of Finance 54, 519–546
Bernile, G., Bhagwat, V., & Rau, P. R. (2017). What Doesn't Kill You Will Only Make
You More Risk‐Loving: Early‐Life Disasters and CEO Behavior. The Journal of Finance,
72(1), 167-206.

36
Griliches, Z. (1992). Introduction to" output measurement in the service sectors". In
Output measurement in the service sectors (pp. 1-22). University of Chicago Press.
Hall, B. H., Griliches, Z., & Hausman, J. A. (1986). Patents and R&D: Is there a lag?
International Economic Review 27, 265–283.
Hall, B. H., Jaffe, A., & Trajtenberg, M. (2005). Market value and patent citations.
RAND Journal of Economics, 16-38.
Hall, Bronwyn H., 2002, The financing of research and development, Oxford Review of
Economic Policy 18, 35–51.
Hambrick, D. C., Black, S., & Fredrickson, J. W. (1992). Executive leadership of the
high technology firm: What is special about it. Advances in Global High- technology
Management, 2, 3-18.
He, J. J., & Tian, X. (2013). The dark side of analyst coverage: The case of innovation.
Journal of Financial Economics, 109(3), 856-878.
Hirshleifer, D., Low, A., & Teoh, S. H. (2012). Are overconfident CEOs better innovators?
The Journal of Finance, 67(4), 1457-1498.
Hsu, P. H., Tian, X., & Xu, Y. (2014). Financial development and innovation: Cross-
country evidence. Journal of Financial Economics, 112(1), 116-135.
Irwin, D. A., & Klenow, P. J. (1994). Learning-by-doing spillovers in the semiconductor
industry. Journal of political Economy, 102(6), 1200-1227.
Jaffe, Adam B., 1996, Economic Analysis of Research Spillovers—Implications for the
Advanced Technology Program (Washington, DC): Advanced Technology Program, Na-
tional Institute of Standards and Technology, U.S. Department of Commerce.
Jensen, Michael C., 1986, Agency costs of free cash flow, corporate finance, and takeovers,
American Economic Review 76, 323–329.
Jung, D. I., Chow, C., & Wu, A. (2003). The role of transformational leadership in
enhancing organizational innovation: Hypotheses and some preliminary findings. The
Leadership Quarterly, 14(4), 525-544.
Kang, J. K., Liu, W. L., Low, A., & Zhang, L. (2014). Friendly boards and innovation.
FIRN Research paper.

37
Kaplan, S. N., M. M. Klebanov, and M. Sorensen (2012). Which CEO Characteristics
and Abilities Matter? Journal of Finance, 67(3), 973-1007.
Kempf, E., Manconi, A., & Spalt, O. G. (2016). Learning by doing: The value of expe-
rience and the origins of skill for mutual fund managers. SSRN
Kim, E. H., & Lu, Y. (2011). CEO ownership, external governance, and risk-taking.
Journal of Financial Economics, 102(2), 272-292.
Kogan, L., Papanikolaou, D., Seru, A., Stoffman, N., 2016. Technological innovation,
resource allocation, and growth. Quarterly Journal of Economics, forthcoming.
Lang, Larry H. P., Rene M. Stulz, and Ralph A. Walkling, 1991, A test of the free cash
flow hypothesis: The case of bidder returns. Journal of Financial Economics 29, 315–336
Li, G. C., Lai, R., D’Amour, A., Doolin, D. M., Sun, Y., Torvik, V. I., ... & Fleming, L.
(2014). Disambiguation and co-authorship networks of the US patent inventor database
(1975–2010). Research Policy, 43(6), 941-955.
Lee, J. M., Kim, J., & Bae, J. (2016). Founder CEOS and Innovation: Evidence from
S&P 500 Firms. Available at SSRN 2733456.
Lerner, J. (1994). The importance of patent scope: an empirical analysis. The RAND
Journal of Economics, 319-333.
Loughran T, Ritter J. 2004. Why has IPO underpricing changed over time? Financial
Management 33(3): 5–37.
Malmendier, U., Tate, G., 2005. CEO overconfidence and corporate investment. Journal
of Finance 6, 2661–2700.
Malmendier, U., Tate, G., 2008. Who makes acquisitions? CEO overconfidence and the
market’s reaction. Journal of Financial Economics 89, 20–43.
Manso, G., 2011. Motivating innovation. Journal of Finance 66, 1823–1860.
Masulis, R. W., Wang, C., & Xie, F. (2007). Corporate governance and acquirer returns.
The Journal of Finance, 62(4), 1851-1889.

38
Moeller, Sara B., Frederik P. Schlingemann, and Rene M. Stulz, 2004, Firm size and the
gains from ´ acquisitions, Journal of Financial Economics 73, 201–228
Morck, Randall, Andrei Shleifer, and Robert W. Vishny, 1990, Do managerial incentives
drive bad acquisitions? Journal of Finance 45, 31–48.
Mukherjee, A., Singh, M. and Zaldokas, A., 2016. Do Corporate Taxes Hinder Innovation”
Journal of Financial Economics, forthcoming.
Petersen, M. 2009. Estimating standard errors in finance panel data sets: Comparing
approaches. Review of Financial Studies 22:435–80.
Pérez-González, F. (2006). Inherited control and firm performance. The American Eco-
nomic review, 96(5), 1559-1588.
Rotemberg, J. J., and G. Saloner 2000. Visionaries, managers, and strategic direction.
RAND Journal of Economics 31:693–716
Sapra, H., Subramanian, A., & Subramanian, K. V. (2014). Corporate governance and
innovation: Theory and evidence. Journal of Financial and Quantitative Analysis, 49(04),
957-1003.
Seru, A. (2014). Firm boundaries matter: Evidence from conglomerates and R&D activ-
ity. Journal of Financial Economics, 111(2), 381-405.
Servaes, Henri, 1991, Tobin’s q and the gains from takeover, Journal of Finance 46, 409–
419.
Solow, R. M. (1957). Technical change and the aggregate production function. The Re-
view of Economics and Statistics, 312-320.
Sunder, J., Sunder, S. V., & Zhang, J. (2016). Pilot CEOs and Corporate Innovation.
Forthcoming, Journal of Financial Economics.
Tian, X., & Wang, T. Y. (2014). Tolerance for failure and corporate innovation. Review
of Financial Studies, 27(1), 211-255.
Tierney, P., Farmer, S. M., & Graen, G. B. (1999). An examination of leadership and
employee creativity: The relevance of traits and relationships. Personnel psychology,
52(3), 591-620.
39
Warner, J., R. L.Watts, and K. H.Wruck. 1988. Stock prices and top management
changes. Journal of Financial Economics 20:461–92.
Weisbach, M. S. 1988. Outside directors and CEO turnover. Journal of Financial Eco-
nomics 20:431–60.
Weisbach, M. S. 1995. CEO turnover and the firm’s investment decision. Journal of
Financial Economics 37: 159–88
Yukl, G. (2001). Leadership in organizations. Upper Saddle River, NJ: Prentice-Hall.
Zhou, X. (2001). Understanding the determinants of managerial ownership and the link
between ownership and performance: comment. Journal of financial economics, 62(3),
559-571.

40
Table 1Table 1Table 1Table 1.... Sample Distribution of Inventor CEOs Sample Distribution of Inventor CEOs Sample Distribution of Inventor CEOs Sample Distribution of Inventor CEOs This table provides the breakdown of the number of Inventor CEOs, Non-Inventor CEOs and the per-
centages of Inventor CEOs by year and by industry groups. (excludes financials and regulated utilities).
Panel A: Sample distribution by year
Year
Non-Inventor
CEOs
Inventor
CEOs
Inventor CEOs
(%)
1992 146 23 13.6%
1993 166 26 13.5%
1994 168 31 15.6%
1995 186 37 16.6%
1996 200 37 15.6%
1997 225 48 17.6%
1998 233 57 19.7%
1999 223 61 21.5%
2000 236 60 20.3%
2001 251 58 18.8%
2002 261 57 17.9%
2003 255 64 20.1%
2004 239 61 20.3%
2005 208 63 23.2%
2006 231 55 19.2%
2007 266 66 19.9%
2008 262 61 18.9%
To-
tal 3,756 865 18.7%
Panel B: Sample distribution of Inventor CEOs by Fama-French 12 Industry groups
Industry
#of Non Inventor
CEOs
# of Inventor
CEOs
Inventor CEOs
(%)
Medical Equipment 250 132 34.6%
Communication 325 19 5.5%
Business Services 970 106 9.9%
Computers 597 121 16.9%
Electronic Equipment 1,204 395 24.7%
Measuring and Control 410 92 18.3%
Total 3,756 865 18.7%

41
Panel C: Distribution by cumulative number of patents granted to Inventor CEOs
Cumulative # of Patents up to 2008 # of CEOs
1 48
2 19
>2 83
Total 150
Panel D: List of Inventor CEOs with more than 50 patent awards
CEO Name Company Name
Steve Jobs Apple Inc.
Jerome Swartz Symbol Technologies
Eli Harari Sandisk Corp
Donald R. Scifres SDL inc.
Balu Balakrishnan Power Integrations Inc.
Stephen P. A. Fodor Affymetrix Inc.
John C. C. Fan Kopin Corp
Navdeep S. Sooch Silicon Laboratories Inc
Fred P. Lampropoulos Merit Medical Systems Inc
John O. Ryan Rovi Corp
Samuel H. Maslak Acuson Corp
George A. Lopez ICU medical Inc.
Panel E: Innovation-Active CEOs among the Inventor-CEOs sample
Year
Innovation Active
CEOs
% of Innovation
Active CEOs
No Yes 1992 9 14 60.9%
1993 8 18 69.2%
1994 13 18 58.1%
1995 18 19 51.4%
1996 19 18 48.6%
1997 24 24 50.0%
1998 23 34 59.6%
1999 21 34 61.8%
2000 23 37 61.7%
2001 21 37 63.8%
2002 23 34 59.6%
2003 33 31 48.4%
2004 30 31 50.8%
2005 35 28 44.4%
2006 34 21 38.2%
2007 44 22 33.3%
2008 44 17 27.9%
Total 428 437 50.5%

42
Table 2Table 2Table 2Table 2.... Summary StatisticsSummary StatisticsSummary StatisticsSummary Statistics This table presents summary statistics for select variables used in this study. T-test (Wilcoxon-Mann-Whitney tests) are conducted to test for differences between
the means and (medians) for firm-year observations with and without Inventor CEOs. Variable definitions are provided in Appendix. *,**,*** denote significance
level at the 10%, 5%, and 1% level, respectively.
VariablesVariablesVariablesVariables NonNonNonNon----Inventor CEOsInventor CEOsInventor CEOsInventor CEOs Inventor CEOsInventor CEOsInventor CEOsInventor CEOs
N Mean Median Std. Dev N Mean Median Std. Dev
Dependent variablesDependent variablesDependent variablesDependent variables No of Patents 3756 45.18 2.00 169.84 865 56.53* 8.00*** 170.98
No of Citations 3756 600.39 8.00 2640.12 865 712.97* 57.00*** 2455.31
Patents (t+1) 3756 1.63 1.10 1.83 865 2.31*** 2.08*** 1.77
Patents (t+2) 3586 1.58 0.69 1.85 835 2.16*** 1.95*** 1.84
Citation(t+1) 3756 2.55 1.61 2.80 865 3.54*** 3.58*** 2.70
Citations (t+1) 3559 2.39 1.10 2.78 808 3.19*** 3.07*** 2.74
Avg. Citations(t+1) 3756 1.18 0.57 1.35 865 1.60*** 1.51*** 1.32
Avg. Citations(t+2) 3559 1.07 0.34 1.30 835 1.38*** 1.19*** 1.28
Other variablesOther variablesOther variablesOther variables Overconfident CEO (67) 3328 0.31 0.00 0.46 808 0.36*** 0.00*** 0.48
CEO Age 3634 53.15 53.00 7.74 845 53.10 53.00 8.46
Firm Size 3756 6.62 6.39 1.69 865 6.29*** 6.02*** 1.64
RD/Assets 3756 0.08 0.07 0.08 865 0.10*** 0.09*** 0.07
CAPEX 3756 0.05 0.04 0.05 865 0.06*** 0.04** 0.05
Firm Age 3756 2.48 2.56 0.88 865 2.37*** 2.48*** 0.79
Leverage 3756 0.13 0.04 0.17 865 0.10*** 0.01*** 0.15
Tobin's Q 3756 0.79 0.69 0.59 865 0.90*** 0.82*** 0.63
CEO Tenure 3756 7.82 6.00 6.92 865 12.03*** 10.00*** 8.85
Volatility 3355 1.00 0.95 0.43 826 0.98 0.93 0.46
Founder-CEO 3756 0.21 0.00 0.41 865 0.54*** 1.00*** 0.50
Board size 2545 8.14 8.00 2.32 600 7.63*** 7.00*** 2.03
Co-option 1915 0.48 0.45 0.31 442 0.61*** 0.67*** 0.35

43
Institutional Holdings (%) 2824 0.79 0.85 0.21 740 0.74*** 0.80*** 0.24
CEO ownership 3517 0.02 0.00 0.06 799 0.05*** 0.01*** 0.09
CEO Equity-based pay 2951 0.44 0.49 0.33 672 0.46 0.53 0.35
Delta 3474 943.46 212.75 5726.46 775 7742.07*** 307.82*** 47081.80
Vega 3620 125.04 44.85 311.53 811 147.00* 45.76 423.05

44
Table 3. Inventor CEOs and Innovation outputsTable 3. Inventor CEOs and Innovation outputsTable 3. Inventor CEOs and Innovation outputsTable 3. Inventor CEOs and Innovation outputs The table presents results of regressing innovation outputs on Inventor CEO. Inventor CEO is equal to one if the CEO has at least one patent issued in her own
name from US Patent and Trademark office (USPTO). Tobin's Q is defined as (book value of assets-book value of equity +market value of equity) /book value of
assets. Firm Size is the natural log of book value of Asset of the firm. Firm-age is the Log of firm age where firm age is the number of years since the inception of
the firms. CAPEX is Capital expenditure scaled by Assets. Missing values are coded with zero. R&D/Assets is Research and development expenditures scaled by
total assets. Missing values are coded with zero. Leverage is defined as (long-term debt+ Short-term debt) /Total assets. CEO-Tenure is the CEO tenure in years.
PhD (STEM) is an indicator variable equal to one for CEOs with PhD in Science, Technology, Engineering and Mathematics and zero otherwise. Technical
Education is an indicator variable equal to one for CEOs with undergraduate or graduate degrees in engineering, physics, operation research, chemistry, mathematics,
biology, pharmacy, or other applied science and zero otherwise. MBA is an indicator variable equal to one if the CEO received MBA degree or zero otherwise. No
school information is an indicator equal to one if we cannot identify the CEOs’ undergraduate school and zero otherwise. Founder CEO is equal to one if the CEO
is a founder of the firm or CEO since the founding year of the firm. Overconfident CEO (67) is an indicator variable equal to one for all years after the CEO’s
options exceed 67% moneyness and zero otherwise. General Ability Index (GAI) is as defined in Custodio et al. (2013). All regressions include year and industry
(based on two digit SIC code) fixed effects. Dependent variables in Columns 1, 2 and 3 are Patents, defined as log (1+#of patents) at time (t+1), Citations, defined
as log (1+# of Citations) at time (t+1) and Avg. Citations is defined as log(1+ Average Citations) scaled by total patents. Columns (4)-(9) examine the effect of
alternate control variables. Standard errors are clustered at the firm level. t- ratios are reported in parentheses. *, **, and *** denote significance at the 10%, 5%,
and 1% level, respectively.
(1) (2) (3) (4) (5) (6) (7) (8) (9)
VariablesVariablesVariablesVariables Patents Citations Avg.
Citations Patents Citations Patents Citations Patents Citations
Inventor CEO 0.485*** 0.741*** 0.319*** 0.457*** 0.717*** 0.420*** 0.636*** 0.460*** 0.636***
(4.153) (4.425) (4.271) (3.797) (4.118) (3.660) (3.884) (3.300) (3.295)
Firm-size 0.677*** 0.836*** 0.197*** 0.678*** 0.837*** 0.754*** 0.905*** 0.774*** 0.908***
(16.027) (15.887) (9.460) (16.067) (15.917) (16.961) (16.877) (14.788) (14.103)
RD/Assets 4.266*** 5.841*** 2.180*** 4.303*** 5.873*** 4.519*** 5.981*** 6.249*** 8.171***
(6.752) (6.317) (5.106) (6.802) (6.349) (7.120) (6.478) (6.653) (6.479)
CAPEX 2.998*** 3.936*** 0.602 2.988*** 3.928*** 3.125*** 3.698*** 3.323*** 4.119***
(3.078) (2.942) (1.105) (3.062) (2.934) (3.010) (2.597) (2.768) (2.599)
Firm-Age 0.107* 0.046 -0.069* 0.123* 0.060 0.110 0.066 0.126 0.120
(1.734) (0.541) (-1.867) (1.957) (0.687) (1.602) (0.715) (1.549) (1.103)
Leverage -0.742*** -0.983*** -0.297 -0.740*** -0.981*** -0.907*** -1.098*** -0.757** -0.758

45
(-2.954) (-2.638) (-1.621) (-2.943) (-2.633) (-3.326) (-2.729) (-2.262) (-1.567)
Log(Tobin's Q) 0.242*** 0.357*** 0.130*** 0.233*** 0.350*** 0.247*** 0.361*** 0.265*** 0.433***
(3.488) (3.654) (2.959) (3.329) (3.546) (3.401) (3.529) (3.069) (3.635)
CEO Tenure -0.008 -0.008 -0.000 -0.013** -0.013 -0.005 -0.006 -0.006 -0.007
(-1.553) (-1.119) (-0.027) (-2.262) (-1.463) (-0.862) (-0.763) (-0.981) (-0.799)
PhD (STEM) 0.178 0.110 -0.037 0.166 0.100 0.181 0.111 0.326** 0.311
(1.295) (0.549) (-0.399) (1.207) (0.500) (1.301) (0.550) (2.273) (1.591)
Technical Education 0.023 0.148 0.131** 0.031 0.155 0.148 0.294** 0.046 0.154
(0.223) (1.024) (2.050) (0.302) (1.072) (1.415) (1.979) (0.366) (0.879)
MBA -0.011 0.007 0.024 0.003 0.019 -0.006 -0.050 0.058 0.103
(-0.116) (0.050) (0.351) (0.032) (0.133) (-0.061) (-0.341) (0.515) (0.620)
No school information -0.122 -0.201 -0.062 -0.100 -0.182 -0.066 -0.206 -0.010 -0.055
(-0.895) (-0.928) (-0.539) (-0.732) (-0.834) (-0.458) (-0.901) (-0.047) (-0.181)
Founder-CEO Dummy 0.164 0.141
(1.364) (0.750) Overconfident CEO
(67) -0.110 -0.076
(-1.072) (-0.512) General Ability Index
(GAI) -0.022 -0.037
(-0.443) (-0.562)
Constant -2.607*** -1.340*** 1.123*** -2.676*** -1.400*** -3.135*** -1.684*** -3.342*** -1.889***
(-7.969) (-3.198) (5.513) (-8.179) (-3.360) (-9.323) (-3.912) (-7.480) (-3.240)
Observations 4,621 4,621 4,621 4,621 4,621 4,136 4,136 3,189 3,189
Adjusted R-squared 0.561 0.540 0.457 0.562 0.541 0.589 0.568 0.583 0.568
Industry Fixed effects Y Y Y Y Y Y Y Y Y
Year Fixed effects Y Y Y Y Y Y Y Y Y

46
Table 4Table 4Table 4Table 4.... Inventor CEO Heterogeneity and Firm Innovation OutputsInventor CEO Heterogeneity and Firm Innovation OutputsInventor CEO Heterogeneity and Firm Innovation OutputsInventor CEO Heterogeneity and Firm Innovation Outputs The table presents results of regressing innovation outputs on Inventor CEOs having recent innovation experience and innovation experience of high impact and
low impact considering the forward citations received by Inventor CEOs’ patents. Innovation Active-CEO is equal to one if the CEO has at least one patent issued
in her own name around 2 years of focal firm year from US Patent and Trademark office (USPTO). High-Impact Innovation experience is equal to 1 if the number
of patents registered with the CEO as one of the assignees that accumulates above median number of patents-class-year adjusted citations is more than 2 (which
is the median of the distribution of such impactful innovation by all the inventor CEOs) and is 0 otherwise. Low-Impact Innovation experience is equal to 1 if the
number of patents registered with the CEO as one of the assignees that accumulates above median number of patents-class-year adjusted citations is less than or
equal to 2 and is 0 otherwise. Tobin's Q is defined as (book value of assets-book value of equity +market value of equity) /book value of assets. Firm Size is the
natural log of book value of Asset of the firm. Firm-age is the Log of firm age where firm age is the number of years since the inception of the firms. CAPEX is
Capital expenditure scaled by Asset. Missing values are coded with zero. R&D/Asset is Research and development expenditures scaled by total assets. Missing
values are coded with zero. Leverage is defined as (long-term debt+ Short-term debt) /Total assets. CEO-Tenure is the CEO tenure in years. PhD (STEM) is an
indicator variable equal to one for CEOs with PhD in Science, Technology, Engineering and Mathematics and zero otherwise. Technical Education is an indicator
variable equal to one for CEOs with undergraduate or graduate degrees in engineering, physics, operation research, chemistry, mathematics, biology, pharmacy, or
other applied science and zero otherwise. MBA is an indicator variable equal to one if the CEO received MBA degree or zero otherwise. No school information is
an indicator equal to one if we cannot identify the CEOs’ undergraduate school and zero otherwise. All regressions include year and industry (based on two digit
SIC code) fixed effects. Patents(t+1) is defined as log (1+# of patents) in time (t+1), Citations(t+1) is defined as log (1+# of Citations) in time (t+1) and Avg.
Citations(t+1 is defined as log(1+ average Citations) in time (t+1), where average citations are Citations scaled by patents, as dependent variables, respectively.
Standard errors are clustered at the firm level. t- ratios are reported in parentheses. *, **, and *** denote significance at the 10%, 5%, and 1% level, respectively.
VariablesVariablesVariablesVariables Full Sample
Inventor CEO Sam-
ple Full Sample Full Sample
Exc. Innovation
Active CEOs Patents Citations Patents Citations Patents Citations Patents Citations Patents
(1) (2) (3) (4) (5) (6) (7) (8) (9)
Innovation-Active CEOs 0.865*** 1.450*** 0.699*** 1.214*** 0.265*** 0.610***
(7.271) (7.915) (4.626) (5.328) (2.701) (3.903)
Low-impact innovation experience 0.246* 0.349* -0.024
(1.731) (1.824) (-0.146)
High-impact innovation experience 0.818*** 1.290*** 0.396*
(6.199) (6.360) (1.842)
Firm-size 0.684*** 0.849*** 0.771*** 0.893*** 0.293*** 0.316*** 0.680*** 0.842*** 0.679***
(16.277) (16.373) (10.128) (9.050) (5.208) (2.810) (16.120) (16.105) (15.182)

47
RD/Assets 4.317*** 5.910*** 2.923*** 3.434** 0.449 0.950 4.229*** 5.780*** 4.416***
(6.932) (6.508) (2.837) (2.342) (1.178) (1.268) (6.719) (6.288) (6.636)
CAPEX 2.865*** 3.692*** 2.768** 3.173* 0.864 1.207 3.072*** 4.059*** 3.006***
(2.964) (2.763) (2.453) (1.750) (1.569) (1.281) (3.177) (3.062) (2.795)
Firm-Age 0.112* 0.056 -0.103 -0.221 0.103 0.237 0.114* 0.057 0.134**
(1.828) (0.667) (-0.961) (-1.376) (1.044) (1.368) (1.847) (0.672) (2.082)
Leverage -0.708*** -0.921** -1.331** -1.003 -0.110 0.063 -0.728*** -0.959** -0.633**
(-2.842) (-2.503) (-2.381) (-1.335) (-0.731) (0.201) (-2.906) (-2.578) (-2.470)
Log(Tobin's Q) 0.226*** 0.328*** 0.248** 0.394*** 0.095** 0.170** 0.232*** 0.341*** 0.228***
(3.246) (3.375) (2.176) (2.618) (2.535) (2.517) (3.364) (3.513) (3.017)
CEO Tenure -0.009* -0.010 -0.007 -0.015 -0.000 -0.001 -0.009* -0.010 -0.009*
(-1.719) (-1.359) (-0.755) (-1.076) (-0.101) (-0.169) (-1.747) (-1.339) (-1.670)
PhD (STEM) 0.194 0.121 0.192 0.216 -0.022 -0.153 0.139 0.046 0.143
(1.490) (0.646) (0.986) (0.829) (-0.191) (-0.744) (1.029) (0.231) (0.935)
Technical Education 0.021 0.144 0.127 0.040 0.008 0.225 0.017 0.139 0.030
(0.212) (1.014) (0.715) (0.135) (0.094) (1.571) (0.174) (0.978) (0.286)
MBA 0.001 0.029 -0.201 -0.172 0.069 0.033 0.007 0.036 0.018
(0.011) (0.208) (-1.132) (-0.574) (0.850) (0.227) (0.068) (0.253) (0.180)
No school information -0.094 -0.159 -0.146 -0.264 -0.103 -0.179 -0.115 -0.190 -0.059
(-0.702) (-0.755) (-0.504) (-0.572) (-0.858) (-0.832) (-0.850) (-0.890) (-0.400)
Constant -2.666*** -1.448*** -2.802*** -0.494 -0.537* 0.893 -2.645*** -1.404*** -2.730***
(-8.320) (-3.581) (-5.384) (-0.616) (-1.715) (1.412) (-8.113) (-3.402) (-7.782)
Observations 4,621 4,621 865 865 4,621 4,621 4,621 4,621 4,184
Adjusted R-squared 0.569 0.552 0.621 0.635 0.312 0.448 0.565 0.545 0.556
Industry Fixed effects Y Y Y Y N N Y Y Y
Year Fixed effects Y Y Y Y Y Y Y Y Y
Firm-Fixed effects N N N N Y Y N N N
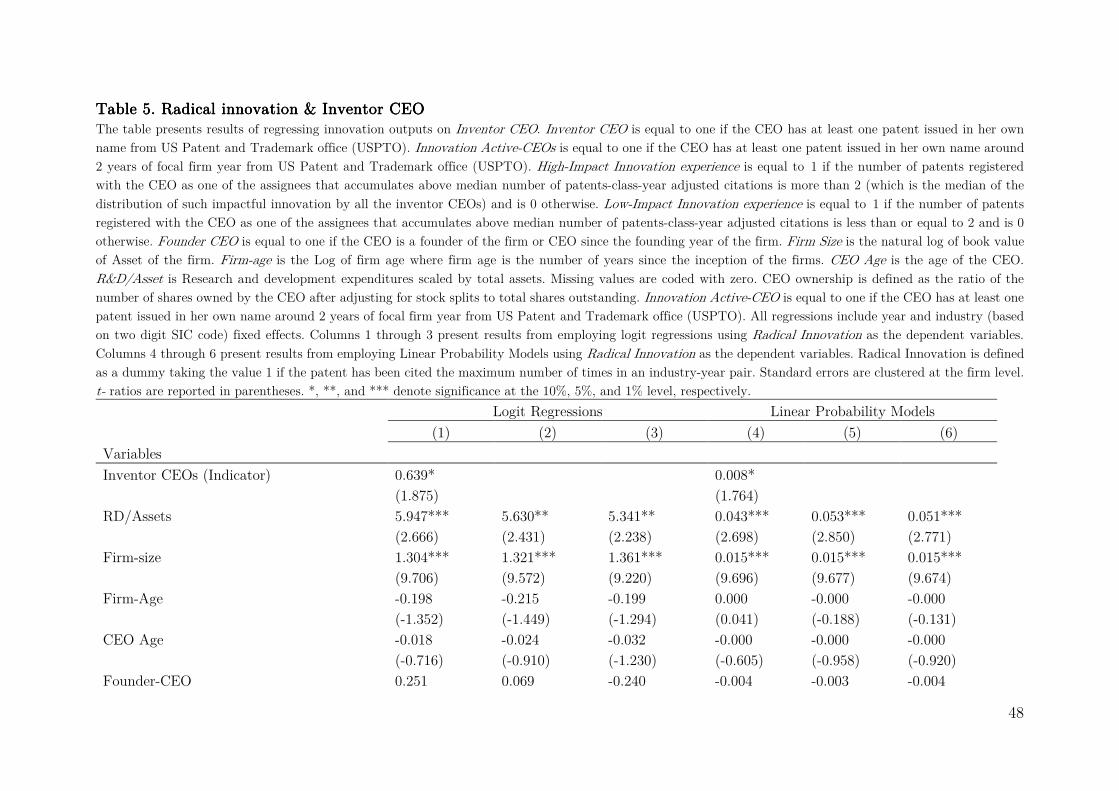
48
Table 5.Table 5.Table 5.Table 5. Radical innovation & Inventor CEO Radical innovation & Inventor CEO Radical innovation & Inventor CEO Radical innovation & Inventor CEO The table presents results of regressing innovation outputs on Inventor CEO. Inventor CEO is equal to one if the CEO has at least one patent issued in her own
name from US Patent and Trademark office (USPTO). Innovation Active-CEOs is equal to one if the CEO has at least one patent issued in her own name around
2 years of focal firm year from US Patent and Trademark office (USPTO). High-Impact Innovation experience is equal to 1 if the number of patents registered
with the CEO as one of the assignees that accumulates above median number of patents-class-year adjusted citations is more than 2 (which is the median of the
distribution of such impactful innovation by all the inventor CEOs) and is 0 otherwise. Low-Impact Innovation experience is equal to 1 if the number of patents
registered with the CEO as one of the assignees that accumulates above median number of patents-class-year adjusted citations is less than or equal to 2 and is 0
otherwise. Founder CEO is equal to one if the CEO is a founder of the firm or CEO since the founding year of the firm. Firm Size is the natural log of book value
of Asset of the firm. Firm-age is the Log of firm age where firm age is the number of years since the inception of the firms. CEO Age is the age of the CEO.
R&D/Asset is Research and development expenditures scaled by total assets. Missing values are coded with zero. CEO ownership is defined as the ratio of the
number of shares owned by the CEO after adjusting for stock splits to total shares outstanding. Innovation Active-CEO is equal to one if the CEO has at least one
patent issued in her own name around 2 years of focal firm year from US Patent and Trademark office (USPTO). All regressions include year and industry (based
on two digit SIC code) fixed effects. Columns 1 through 3 present results from employing logit regressions using Radical Innovation as the dependent variables.
Columns 4 through 6 present results from employing Linear Probability Models using Radical Innovation as the dependent variables. Radical Innovation is defined
as a dummy taking the value 1 if the patent has been cited the maximum number of times in an industry-year pair. Standard errors are clustered at the firm level.
t- ratios are reported in parentheses. *, **, and *** denote significance at the 10%, 5%, and 1% level, respectively.
Logit Regressions Linear Probability Models
(1) (2) (3) (4) (5) (6)
Variables
Inventor CEOs (Indicator) 0.639* 0.008*
(1.875) (1.764) RD/Assets 5.947*** 5.630** 5.341** 0.043*** 0.053*** 0.051***
(2.666) (2.431) (2.238) (2.698) (2.850) (2.771)
Firm-size 1.304*** 1.321*** 1.361*** 0.015*** 0.015*** 0.015***
(9.706) (9.572) (9.220) (9.696) (9.677) (9.674)
Firm-Age -0.198 -0.215 -0.199 0.000 -0.000 -0.000
(-1.352) (-1.449) (-1.294) (0.041) (-0.188) (-0.131)
CEO Age -0.018 -0.024 -0.032 -0.000 -0.000 -0.000
(-0.716) (-0.910) (-1.230) (-0.605) (-0.958) (-0.920)
Founder-CEO 0.251 0.069 -0.240 -0.004 -0.003 -0.004

49
(0.757) (0.197) (-0.656) (-1.113) (-1.045) (-1.347)
CEO ownership 1.990 2.327 2.987 0.035** 0.043** 0.048***
(1.051) (1.147) (1.522) (2.015) (2.313) (2.748)
Innovation-Active-CEOs 0.905** 0.011*
(1.971) (1.695) High impact Innovation experience 1.538*** 0.016**
(3.672) (2.072)
Low impact Innovation experience -0.228 -0.003
(-0.448) (-0.541)
Constant -12.419*** -12.030*** -11.924*** -0.069*** -0.058*** -0.059***
(-7.056) (-6.923) (-6.993) (-3.897) (-3.186) (-3.193)
Observations 4,203 4,203 4,203 4,203 4,203 4,203
Adjusted R-squared 0.044 0.048 0.049
Industry fixed effects Y Y Y Y Y Y
Year Fixed effects Y Y Y Y Y Y

50
Table 6: Table 6: Table 6: Table 6: The The The The effect ofeffect ofeffect ofeffect of an Inventor an Inventor an Inventor an Inventor CEOCEOCEOCEO’s ’s ’s ’s patenting experience patenting experience patenting experience patenting experience on firm’son firm’son firm’son firm’s patent patent patent patent technology class distributiontechnology class distributiontechnology class distributiontechnology class distribution....
This table presents the results of the regressions showing the directional effect of inventor-CEOs on firm level patenting focus. CEOs’ patent class
relevant experience Indicator is a variable that takes the value of 1 if the CEO has patenting experience in that focal technology class before becoming
the CEO of the focal firm. Patent Breadth is the unique number of patent classes that the firm has registered patents with the USPTO in that year.
# of Patents in relevant class is the total number of patents that has been applied for by the firm in the focal technology class. Share of patent
class in a yearly patent portfolio is the fraction of a firms’ patent portfolio in a given year that comes for patents in a given technology class.
R&D/Asset is Research and development expenditures scaled by total assets. Missing values are coded with zero. All regressions include year, firm
and technology class fixed effects as indicated. Standard errors are clustered at the firm level. t- ratios are reported in parentheses. *, **, and ***
denote significance at the 10%, 5%, and 1% level, respectively.
(1) (2) (3) (4) (5) (6) (7)
Variables Share of patent class in yearly patent portfolio
CEOs' patent class relevant experience indicator 0.078*** 0.079*** 0.073*** 0.078*** 0.079*** 0.073*** 0.073***
(6.461) (6.507) (6.084) (6.460) (6.508) (6.082) (6.075)
Patent Breadth 0.000*** 0.000** 0.000*** 0.000***
(5.567) (2.501) (5.045) (5.036)
Firm Size 0.000*** 0.000*** 0.000*** 0.000***
(4.323) (2.976) (4.655) (4.648)
RD/Assets 0.004*** 0.000 0.004*** 0.004***
(6.006) (0.879) (6.108) (6.098)
Constant 0.002*** 0.002*** 0.002*** 0.000* 0.001*** 0.000* 0.000
(31.581) (18.040) (16.456) (1.795) (2.935) (1.697) (1.206)
Observations 1,423,268 1,423,268 1,423,268 1,423,268 1,423,268 1,423,268 1,423,268
R-squared 0.011 0.013 0.028 0.012 0.013 0.029 0.033
Year Fixed Effects N Y Y N Y Y N
Patent Class Fixed Effects N N Y N N Y N
Firm Fixed Effects N Y N N Y N N
Patent class* year fixed effects N N N N N N Y
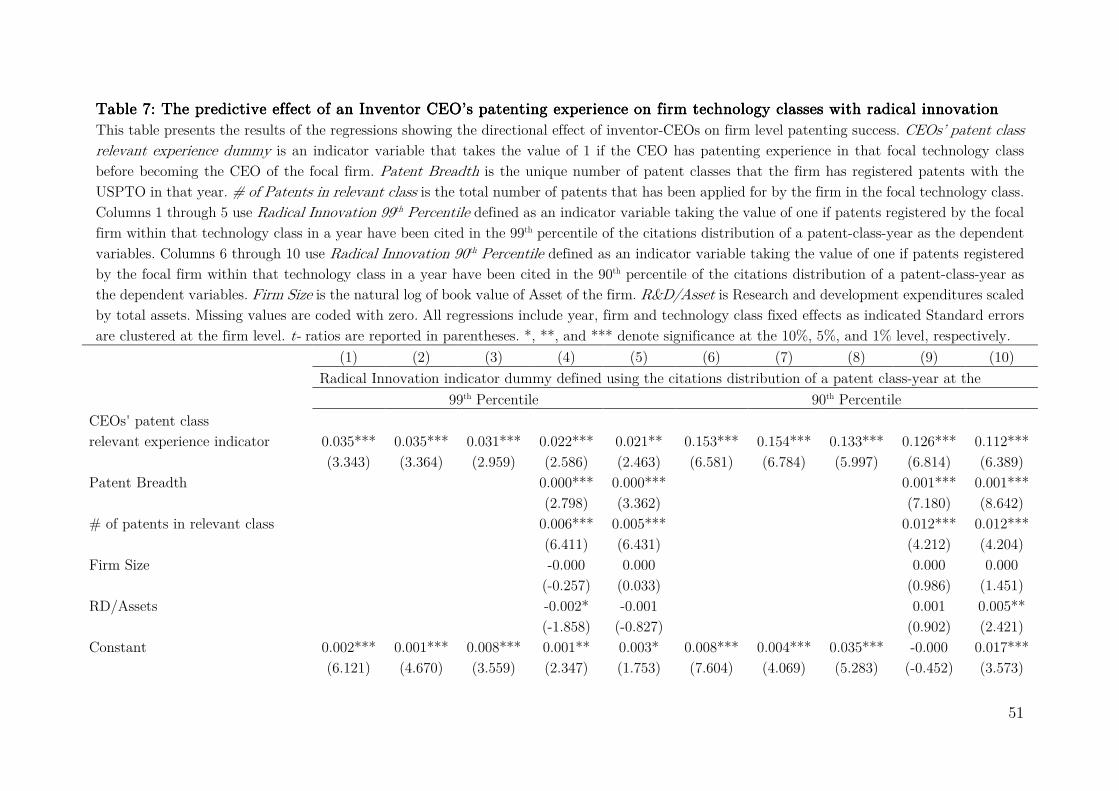
51
Table 7: Table 7: Table 7: Table 7: The predictive The predictive The predictive The predictive effect ofeffect ofeffect ofeffect of an Inventor an Inventor an Inventor an Inventor CEOCEOCEOCEO’s ’s ’s ’s patenting experience patenting experience patenting experience patenting experience on firm technology classes with on firm technology classes with on firm technology classes with on firm technology classes with rrrradical adical adical adical iiiinnovationnnovationnnovationnnovation
This table presents the results of the regressions showing the directional effect of inventor-CEOs on firm level patenting success. CEOs’ patent class
relevant experience dummy is an indicator variable that takes the value of 1 if the CEO has patenting experience in that focal technology class
before becoming the CEO of the focal firm. Patent Breadth is the unique number of patent classes that the firm has registered patents with the
USPTO in that year. # of Patents in relevant class is the total number of patents that has been applied for by the firm in the focal technology class.
Columns 1 through 5 use Radical Innovation 99th Percentile defined as an indicator variable taking the value of one if patents registered by the focal
firm within that technology class in a year have been cited in the 99th percentile of the citations distribution of a patent-class-year as the dependent
variables. Columns 6 through 10 use Radical Innovation 90th Percentile defined as an indicator variable taking the value of one if patents registered
by the focal firm within that technology class in a year have been cited in the 90th percentile of the citations distribution of a patent-class-year as
the dependent variables. Firm Size is the natural log of book value of Asset of the firm. R&D/Asset is Research and development expenditures scaled
by total assets. Missing values are coded with zero. All regressions include year, firm and technology class fixed effects as indicated Standard errors
are clustered at the firm level. t- ratios are reported in parentheses. *, **, and *** denote significance at the 10%, 5%, and 1% level, respectively.
(1) (2) (3) (4) (5) (6) (7) (8) (9) (10)
Radical Innovation indicator dummy defined using the citations distribution of a patent class-year at the
99th Percentile 90th Percentile
CEOs' patent class
relevant experience indicator 0.035*** 0.035*** 0.031*** 0.022*** 0.021** 0.153*** 0.154*** 0.133*** 0.126*** 0.112***
(3.343) (3.364) (2.959) (2.586) (2.463) (6.581) (6.784) (5.997) (6.814) (6.389)
Patent Breadth 0.000*** 0.000*** 0.001*** 0.001***
(2.798) (3.362) (7.180) (8.642)
# of patents in relevant class 0.006*** 0.005*** 0.012*** 0.012***
(6.411) (6.431) (4.212) (4.204)
Firm Size -0.000 0.000 0.000 0.000
(-0.257) (0.033) (0.986) (1.451)
RD/Assets -0.002* -0.001 0.001 0.005**
(-1.858) (-0.827) (0.902) (2.421)
Constant 0.002*** 0.001*** 0.008*** 0.001** 0.003* 0.008*** 0.004*** 0.035*** -0.000 0.017***
(6.121) (4.670) (3.559) (2.347) (1.753) (7.604) (4.069) (5.283) (-0.452) (3.573)

52
Observations 1,423,268 1,423,268 1,423,268 1,423,268 1,423,268 1,423,268 1,423,268 1,423,268 1,423,268 1,423,268
Adjusted R-squared 0.001 0.001 0.007 0.152 0.163 0.005 0.005 0.028 0.169 0.213
Year Fixed Effects N Y Y Y Y N Y Y Y Y
Patent Class Fixed Effects N N Y N Y N N Y N Y
Firm Fixed Effects N Y N Y N N Y N Y N

53
Table Table Table Table 8888. Exogenous CEO turnovers and Firm Level Patenting . Exogenous CEO turnovers and Firm Level Patenting . Exogenous CEO turnovers and Firm Level Patenting . Exogenous CEO turnovers and Firm Level Patenting The table presents results of regressing innovation outputs in the context of exogenous CEO Turnovers. The dependent variables are Patents defined as log (1+#
of patents) at time (t+1), Citations defined as log (1+# of Citations) in time (t+1), and Patents/R&D is the log (# of patents/R&D Investments). Exogenous
CEO turnover is as defined in Eisfeldt and Kuhnen (2013). Treated firm is a dummy variable taking the value 1 if exogenous CEO turnover involves a transition
from Inventor CEO to Non-Inventor CEO and 0 Otherwise. R&D/Asset is Research and development expenditures scaled by total assets. Missing values are coded
with zero. Firm Size is the natural log of book value of Asset of the firm. Leverage is defined as (long-term debt+ Short-term debt) /Total assets. CAPEX is
Capital expenditure scaled by Assets. Missing values are coded with zero. Tobin's Q is defined as (book value of assets-book value of equity +market value of
equity) /book value of assets. Founder CEO is equal to one if the CEO is a founder of the firm or CEO since the founding year of the firm. All regressions include
year and 2 digit SIC based Industry or Firm Fixed effects (based on unique GVKEY) as indicated. Standard errors are clustered at the firm level. t- ratios are
reported in parentheses. *, **, and *** denote significance at the 10%, 5%, and 1% level, respectively.
(1) (2) (3)
Variables Patents Citations Patents/R&D
Exogenous CEO turnover * Treated Firm dummy (a*b) -0.473** -0.175* -0.068*** (-4.818) (-2.544) (-5.858)
Exogenous CEO turnover: b 0.267** 0.451** -0.015 (4.469) (4.946) (-0.364)
RD/Assets 1.305 2.434
(0.591) (1.496)
Firm Age 0.150 0.465 -0.025
(0.309) (2.302) (-0.736)
Firm size 0.293*** -0.114 -0.055
(7.128) (-0.495) (-0.920)
Leverage 0.161** -0.377 -0.056
(3.708) (-1.002) (-1.384)
CAPEX 1.456 -1.165 -0.351
(1.288) (-0.695) (-1.379)
Log(Tobin's Q) 0.219** 0.002 0.022
(3.238) (0.008) (1.781)

54
Constant -0.446 4.518 0.557
(0.820) (0.555)
Observations 233 233 233
Adjusted R-squared 0.303 0.413 0.155
Number of firms 41 41 41
Year Fixed effects Y Y Y
Firm-Fixed effects Y Y Y
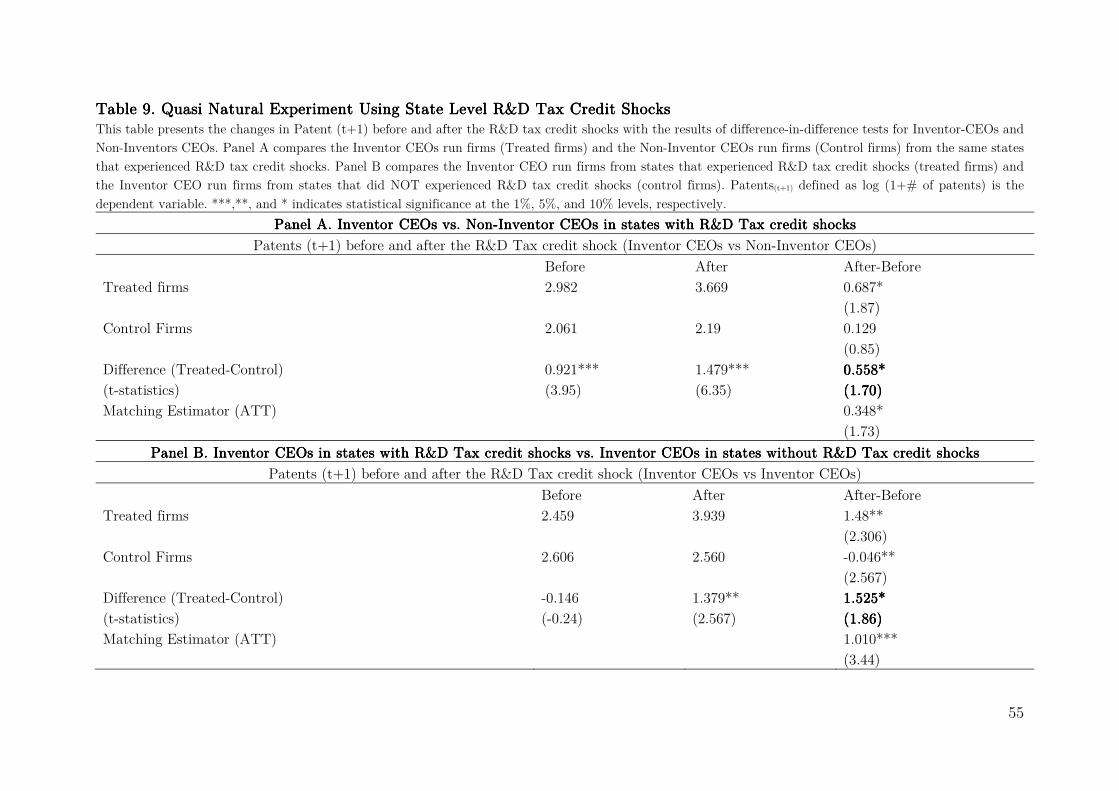
55
Table Table Table Table 9999. Quasi Natural Experiment Using State Level R&D Tax Credit Shocks. Quasi Natural Experiment Using State Level R&D Tax Credit Shocks. Quasi Natural Experiment Using State Level R&D Tax Credit Shocks. Quasi Natural Experiment Using State Level R&D Tax Credit Shocks This table presents the changes in Patent (t+1) before and after the R&D tax credit shocks with the results of difference-in-difference tests for Inventor-CEOs and
Non-Inventors CEOs. Panel A compares the Inventor CEOs run firms (Treated firms) and the Non-Inventor CEOs run firms (Control firms) from the same states
that experienced R&D tax credit shocks. Panel B compares the Inventor CEO run firms from states that experienced R&D tax credit shocks (treated firms) and
the Inventor CEO run firms from states that did NOT experienced R&D tax credit shocks (control firms). Patents(t+1) defined as log (1+# of patents) is the
dependent variable. ***,**, and * indicates statistical significance at the 1%, 5%, and 10% levels, respectively.
Panel A. Inventor CEOs vs. NonPanel A. Inventor CEOs vs. NonPanel A. Inventor CEOs vs. NonPanel A. Inventor CEOs vs. Non----Inventor CEOs in states with R&D Tax credit shocksInventor CEOs in states with R&D Tax credit shocksInventor CEOs in states with R&D Tax credit shocksInventor CEOs in states with R&D Tax credit shocks
Patents (t+1) before and after the R&D Tax credit shock (Inventor CEOs vs Non-Inventor CEOs)
Before After After-Before
Treated firms 2.982 3.669 0.687*
(1.87)
Control Firms 2.061 2.19 0.129
(0.85)
Difference (Treated-Control) 0.921*** 1.479*** 0.558*0.558*0.558*0.558*
(t-statistics) (3.95) (6.35) (1.70)(1.70)(1.70)(1.70)
Matching Estimator (ATT) 0.348*
(1.73)
Panel B. Inventor CEOs in states with R&D Tax credit shocks vs. Inventor CEOs in states without R&D Tax Panel B. Inventor CEOs in states with R&D Tax credit shocks vs. Inventor CEOs in states without R&D Tax Panel B. Inventor CEOs in states with R&D Tax credit shocks vs. Inventor CEOs in states without R&D Tax Panel B. Inventor CEOs in states with R&D Tax credit shocks vs. Inventor CEOs in states without R&D Tax credit shockscredit shockscredit shockscredit shocks
Patents (t+1) before and after the R&D Tax credit shock (Inventor CEOs vs Inventor CEOs)
Before After After-Before
Treated firms 2.459 3.939 1.48**
(2.306)
Control Firms 2.606 2.560 -0.046**
(2.567)
Difference (Treated-Control) -0.146 1.379** 1.525*1.525*1.525*1.525*
(t-statistics) (-0.24) (2.567) (1.86)(1.86)(1.86)(1.86)
Matching Estimator (ATT) 1.010***
(3.44)
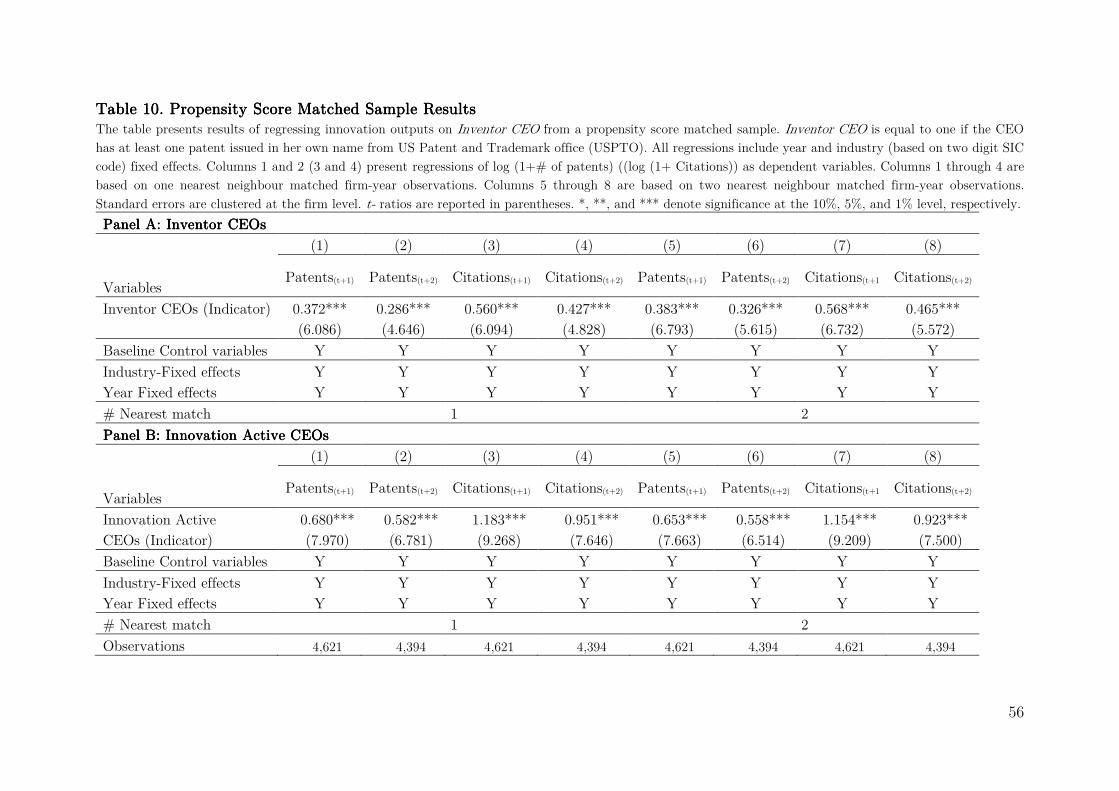
56
Table Table Table Table 10101010. Propensity Score Matched Sample Results. Propensity Score Matched Sample Results. Propensity Score Matched Sample Results. Propensity Score Matched Sample Results The table presents results of regressing innovation outputs on Inventor CEO from a propensity score matched sample. Inventor CEO is equal to one if the CEO
has at least one patent issued in her own name from US Patent and Trademark office (USPTO). All regressions include year and industry (based on two digit SIC
code) fixed effects. Columns 1 and 2 (3 and 4) present regressions of log (1+# of patents) ((log (1+ Citations)) as dependent variables. Columns 1 through 4 are
based on one nearest neighbour matched firm-year observations. Columns 5 through 8 are based on two nearest neighbour matched firm-year observations.
Standard errors are clustered at the firm level. t- ratios are reported in parentheses. *, **, and *** denote significance at the 10%, 5%, and 1% level, respectively.
Panel A: Inventor CEOsPanel A: Inventor CEOsPanel A: Inventor CEOsPanel A: Inventor CEOs
(1) (2) (3) (4) (5) (6) (7) (8)
Patents(t+1) Patents(t+2) Citations(t+1) Citations(t+2) Patents(t+1) Patents(t+2) Citations(t+1 Citations(t+2) Variables
Inventor CEOs (Indicator) 0.372*** 0.286*** 0.560*** 0.427*** 0.383*** 0.326*** 0.568*** 0.465***
(6.086) (4.646) (6.094) (4.828) (6.793) (5.615) (6.732) (5.572)
Baseline Control variables Y Y Y Y Y Y Y Y
Industry-Fixed effects Y Y Y Y Y Y Y Y
Year Fixed effects Y Y Y Y Y Y Y Y
# Nearest match 1 2
Panel Panel Panel Panel BBBB: : : : Innovation Active Innovation Active Innovation Active Innovation Active CEOsCEOsCEOsCEOs
(1) (2) (3) (4) (5) (6) (7) (8)
Patents(t+1) Patents(t+2) Citations(t+1) Citations(t+2) Patents(t+1) Patents(t+2) Citations(t+1 Citations(t+2) Variables
Innovation Active 0.680*** 0.582*** 1.183*** 0.951*** 0.653*** 0.558*** 1.154*** 0.923***
CEOs (Indicator) (7.970) (6.781) (9.268) (7.646) (7.663) (6.514) (9.209) (7.500)
Baseline Control variables Y Y Y Y Y Y Y Y
Industry-Fixed effects Y Y Y Y Y Y Y Y
Year Fixed effects Y Y Y Y Y Y Y Y
# Nearest match 1 2
Observations 4,621 4,394 4,621 4,394 4,621 4,394 4,621 4,394

57
Table Table Table Table 11111111. Inventor CEOs and Value Creation. Inventor CEOs and Value Creation. Inventor CEOs and Value Creation. Inventor CEOs and Value Creation The table presents results of regressing Log (Tobin’s Q) on Inventor CEO and Innovation-Active CEOs. Inventor CEO is equal to one if the CEO has at least one
patent issued in her own name from US Patent and Trademark office (USPTO). Innovation Active-CEOs is equal to one if the CEO has at least one patent issued
in her own name around 2 years of focal firm year from US Patent and Trademark office (USPTO). Tobin's Q is defined as (book value of assets-book value of
equity +market value of equity) /book value of assets. Firm Size is the natural log of book value of Asset of the firm. Firm-age is the Log of firm age where firm
age is the number of years since the inception of the firms. Volatility is the volatility of stock returns. Leverage is defined as (long-term debt+ Short-term debt)
/Total assets. CAPEX is Capital expenditure scaled by Asset. Missing values are coded with zero. CEO ownership is defined as the ratio of the number of shares
owned by the CEO after adjusting for stock splits to total shares outstanding. CEO-Tenure is CEO tenure in years. Founder CEO is equal to one if the CEO is a
founder of the firm or CEO since the founding year of the firms. ROA is defined as net income before extraordinary items and discontinued operations / book value
of assets. Stock Return is firms’ yearly stock return. Exogenous CEO turnover is as defined in Eisfeldt and Kuhnen (2013). Treated firm is a dummy variable
taking the value 1 if exogenous CEO turnover involves a transition from Inventor CEO to Non-Inventor CEO and 0 Otherwise. All regressions include year and 2
digit SIC based Industry or Firm Fixed effects (based on unique GVKEY) as indicated. Standard errors are clustered at the firm level. t- ratios are reported in
parentheses. *, **, and *** denote significance at the 10%, 5%, and 1% level, respectively.
VariablesVariablesVariablesVariables Log (Tobin's Q)
(1) (2) (3) (4)
Inventors CEO (Indicator) 0.084*
(1.832) Innovation Active CEOs 0.138** 0.097*
(2.569) (1.856) Firm-Size 0.063* 0.065* -0.046 -0.057
(1.834) (1.880) (-1.193) (-0.436)
Firm Age -0.149*** -0.149*** -0.313*** -0.563**
(-5.750) (-5.754) (-5.757) (-2.045)
Volatility -0.086 -0.089 -0.458*** -0.819**
(-1.156) (-1.219) (-3.848) (-2.376)
Leverage -0.697*** -0.687*** -0.407*** -0.597***
(-6.362) (-6.324) (-4.304) (-3.191)
CAPEX 1.178*** 1.161*** 1.379*** 2.335***
(3.218) (3.230) (4.891) (3.276)
Log (Net Property, Plant & Equipment) -0.033 -0.034 -0.011 -0.176**

58
(-1.071) (-1.103) (-0.309) (-2.337)
CEO Tenure -0.001 -0.001 0.004 0.006
(-0.405) (-0.371) (1.455) (1.630)
CEO ownership 0.129 0.123 -0.142 0.225
(0.451) (0.440) (-0.502) (0.436)
Founder CEO 0.074 0.069 0.016 -0.174*
(1.510) (1.429) (0.274) (-1.742)
Stock Return 0.002*** 0.002*** 0.002*** 0.003***
(16.996) (17.059) (19.256) (12.257)
ROA 0.340*** 0.338*** 0.163*** 0.013
(4.521) (4.467) (2.945) (0.089)
Exogenous CEO turnover * Treated Firm dummy (a*b) -0.210*
(-1.942)
Exogenous CEO turnover: b 0.022
(0.402)
Constant 0.646*** 0.642*** 1.724*** 3.410**
(4.075) (4.040) (9.528) (2.561)
Observations 3,508 3,508 3,508 204
Adjusted R-squared 0.411 0.413 0.508 0.708
Number of Firms 475 40
Industry Fixed Effects Y Y N N
Year Fixed effects Y Y Y Y
Firm Fixed-Effects N N Y Y

59
Table Table Table Table 12121212. M&A Target Firm Selection of Inventor CEOs . M&A Target Firm Selection of Inventor CEOs . M&A Target Firm Selection of Inventor CEOs . M&A Target Firm Selection of Inventor CEOs The table presents results from employing logit regressions to study target selection in M&A by the Inventor-CEOs. Private Target Indicator is a variable that
equals one if the target in M&A deal is a private firm. Innovative Target Indicator is a variable that equals one if the target has received patent in the past.
Inventor CEO is equal to one if the CEO has at least one patent issued in her own name from US Patent and Trademark office (USPTO). Innovation Active-CEOs
is equal to one if the CEO has at least one patent issued in her own name around 2 years of focal firm year from US Patent and Trademark office (USPTO). High-
Impact Innovation experience is equal to 1 if the number of patents registered with the CEO as one of the assignees that accumulates above median number of
patents-class-year adjusted citations is more than 2 (which is the median of the distribution of such impactful innovation by all the inventor CEOs) and is 0
otherwise. Low-Impact Innovation experience is equal to 1 if the number of patents registered with the CEO as one of the assignees that accumulates above median
number of patents-class-year adjusted citations is less than or equal to 2 and is 0 otherwise. Tobin's Q is defined as (book value of assets-book value of equity
+market value of equity) /book value of assets. Firm Size is the natural log of book value of Asset of the firm. Firm-age is the Log of firm age where firm age is
the number of years since the inception of the firms. CAPEX is Capital expenditure scaled by Asset. Missing values are coded with zero. R&D/Asset is Research
and development expenditures scaled by total assets. Missing values are coded with zero. Leverage is defined as (long-term debt+ Short-term debt) /Total assets.
CEO-Tenure is the CEO tenure in years. PhD (STEM) is an indicator variable equal to one for CEOs with PhD in Science, Technology, Engineering and
Mathematics and zero otherwise. Technical Education is an indicator variable equal to one for CEOs with undergraduate or graduate degrees in engineering, physics,
operation research, chemistry, mathematics, biology, pharmacy, or other applied science and zero otherwise. MBA is an indicator variable equal to one if the CEO
received MBA degree or zero otherwise. No school information is an indicator equal to one if we cannot identify the CEOs’ undergraduate school and zero otherwise.
Founder CEO is equal to one if the CEO is a founder of the firm or CEO since the founding year of the firm. Cash/Assets is cash scaled by Total Assets. Diversifying
deal indicator is variable that equals one if the target and Acquirer differ in their Fama-French-12 industries (FF12) classification. Relative Deal Size is the ratio
of the deal value and the market capitalization of the bidder. Public Target Indicator is a variable that equals one if the target in M&A deal is a Public firm. All
regressions include year and industry (based on two digit SIC code) fixed effects. Standard errors are clustered at the firm level. t- ratios are reported in parentheses.
*, **, and *** denote significance at the 10%, 5%, and 1% level, respectively.
(1) (2) (3) (4) (5) (6)
Variables
Private Target
Indicator
Innovative Tar-
get Indicator
Private Target
Indicator
Innovative Tar-
get Indicator
Private Target
Indicator
Innovative Tar-
get Indicator
Inventor-CEOs (Indicator) 0.185*** 0.391**
(2.911) (2.371) Innovation-Active CEOs 0.426* 0.459*
(1.777) (1.923) High impact innovation experience 0.213 0.702**
(0.896) (2.025)

60
Low impact innovation experience 0.166 0.181
(0.887) (0.657)
Firm-size -0.293*** 0.219*** -0.292*** 0.223*** -0.293*** 0.220***
(-3.467) (6.558) (-3.589) (3.205) (-3.452) (3.591)
RD/Assets 1.465 1.902 1.414 1.841* 1.462 1.867*
(0.627) (1.616) (0.628) (1.827) (0.631) (1.696)
CAPEX 0.013 1.120 -0.224 0.962 0.005 1.029
(0.005) (0.672) (-0.081) (0.730) (0.002) (0.716)
Log(Tobin's Q) 0.415*** -0.314** 0.418*** -0.312 0.416*** -0.309
(3.555) (-2.137) (3.485) (-1.605) (3.481) (-1.560)
Leverage 0.143 -0.560 0.114 -0.611 0.142 -0.586
(0.652) (-1.018) (0.515) (-0.623) (0.622) (-0.620)
CEO Tenure -0.022 -0.015 -0.028 -0.019 -0.023 -0.019**
(-0.522) (-0.960) (-0.744) (-1.520) (-0.558) (-2.345)
CEO Tenure Squared -0.000 0.001 -0.000 0.001 -0.000 0.001*
(-0.144) (1.432) (-0.007) (1.400) (-0.144) (1.868)
PhD (STEM) 0.388 0.189 0.381 0.207 0.384 0.142
(1.569) (0.826) (1.533) (0.621) (1.517) (0.450)
MBA 0.075 0.359** 0.076 0.347*** 0.075 0.363***
(0.592) (2.529) (0.566) (2.769) (0.589) (3.441)
Technical Education -0.112 0.394*** -0.100 0.413*** -0.111 0.406***
(-1.095) (2.816) (-1.023) (3.346) (-1.107) (3.599)
No school information 0.029 0.471 0.023 0.460*** 0.027 0.452***
(0.094) (1.416) (0.075) (3.125) (0.087) (2.830)
Cash/Assets 1.055** -0.729 1.005** -0.729*** 1.055** -0.737***
(2.375) (-1.353) (2.099) (-4.275) (2.379) (-4.865)
Diversifying Deal Indicator -0.080 -0.083 -0.088 -0.083 -0.080 -0.082
(-0.393) (-0.465) (-0.424) (-0.707) (-0.394) (-0.686)
Relative Deal Size -1.202*** 0.343** -1.206*** 0.338*** -1.203*** 0.343***

61
(-3.318) (2.195) (-3.328) (3.125) (-3.351) (2.908)
Private target Indicator -0.329*** -0.330*** -0.334***
(-3.364) (-2.782) (-2.792)
Public target Indicator 0.487*** 0.492*** 0.482***
(4.184) (4.558) (4.452)
Constant 2.012* -2.216*** 2.064* -2.182*** 2.014* -2.192***
(1.753) (-6.597) (1.907) (-2.941) (1.780) (-3.174)
Observations 1,758 1,758 1,758 1,758 1,758 1,758
Industry Fixed Effects Y Y Y Y Y Y
Year Fixed Effects Y Y Y Y Y Y

62
Table 1Table 1Table 1Table 13333. M&A Cumulative Abnormal Announcement Returns. M&A Cumulative Abnormal Announcement Returns. M&A Cumulative Abnormal Announcement Returns. M&A Cumulative Abnormal Announcement Returns This table shows regressions of mergers’ cumulative abnormal stock price returns of the Acquirer (CAR) on different manager, deal, and company characteristics.
Five-day cumulative abnormal return (in percentage points) calculated using the market model. The market model parameters are estimated over the period (−210,
−11) with the CRSP equally-weighted return as the market index following Masulis et al. (2007). Private Target Indicator is a variable that equals one if the target
in M&A deal is a private firm. Innovative Target Indicator is a variable that equals one if the target has received patent in the past. Inventor CEO is equal to one
if the CEO has at least one patent issued in her own name from US Patent and Trademark office (USPTO). Innovation Active-CEOs is equal to one if the CEO
has at least one patent issued in her own name around 2 years of focal firm year from US Patent and Trademark office (USPTO). High-Impact Innovation experience
is equal to 1 if the number of patents registered with the CEO as one of the assignees that accumulates above median number of patents-class-year adjusted
citations is more than 2 (which is the median of the distribution of such impactful innovation by all the inventor CEOs) and is 0 otherwise. Low-Impact Innovation
experience is equal to 1 if the number of patents registered with the CEO as one of the assignees that accumulates above median number of patents-class-year
adjusted citations is less than or equal to 2 and is 0 otherwise. All regressions include year and Acquirer Industry interacted joint fixed effects. Baseline control
variables and deal level control variables as in Table 10 are included in the models. Standard errors are clustered at the firm level. t- ratios are reported in
parentheses. *, **, and *** denote significance at the 10%, 5%, and 1% level, respectively.
(1) (2) (3) (4) (5)
Variables CAR (-2, +2)
Panel A: Inventor CEO Indicator & M&A announcement return Panel A: Inventor CEO Indicator & M&A announcement return Panel A: Inventor CEO Indicator & M&A announcement return Panel A: Inventor CEO Indicator & M&A announcement return
All M&A Private Target Non-Private
target
Private & Inno-
vative Target
Non-Private or
Non-innovative tar-
get
Inventor CEO Indicator 0.011*** 0.018** -0.004 0.033** 0.004
(2.934) (2.488) (-0.436) (2.087) (0.712)
Year * Industry (AC) FE Y Y Y Y Y
Baseline Control variables Y Y Y Y Y
Deal level Control variables Y Y Y Y Y
Observations 1,563 830 733 271 1,291
Adjusted R-squared 0.105 0.140 0.189 0.266 0.104 Panel B: InnovationPanel B: InnovationPanel B: InnovationPanel B: Innovation----Active CEO Indicator & M&A announcement return Active CEO Indicator & M&A announcement return Active CEO Indicator & M&A announcement return Active CEO Indicator & M&A announcement return
Innovation-Active CEOs 0.022*** 0.026** 0.016 0.054*** 0.016*

63
(3.139) (2.417) (1.012) (2.920) (1.667)
Year * Industry (AC) FE Y Y Y Y Y
Baseline Control variables Y Y Y Y Y
Deal level Control variables Y Y Y Y Y
Observations 1,563 830 733 271 1,291
Adjusted R-squared 0.107 0.141 0.191 0.278 0.105
Panel C: High impact and Low impact Panel C: High impact and Low impact Panel C: High impact and Low impact Panel C: High impact and Low impact innovation experience & M&A announcement returninnovation experience & M&A announcement returninnovation experience & M&A announcement returninnovation experience & M&A announcement return
High impact innovation experience 0.013 0.023* -0.014 0.048** 0.002
(1.638) (1.874) (-0.934) (2.307) (0.199)
Low impact innovation experience 0.010** 0.015** 0.002 0.025 0.005
(2.073) (2.129) (0.200) (1.435) (0.933)
Year * Industry (AC) FE Y Y Y Y Y
Baseline Control variables Y Y Y Y Y
Deal level Control variables Y Y Y Y Y
Observations 1,563 830 733 271 1,291
Adjusted R-squared 0.105 0.140 0.191 0.270 0.104

64
Table 1Table 1Table 1Table 14444. Value Creation . Value Creation . Value Creation . Value Creation from New Product Announcementfrom New Product Announcementfrom New Product Announcementfrom New Product Announcement The table presents results of incremental value creation from new product announcements by the Inventor-CEOs. Inventor CEO is equal to one if the CEO has at
least one patent issued in her own name from US Patent and Trademark office (USPTO). Innovation Active-CEOs is equal to one if the CEO has at least one
patent issued in her own name around 2 years of focal firm year from US Patent and Trademark office (USPTO). High-Impact Innovation experience is equal to 1
if the number of patents registered with the CEO as one of the assignees that accumulates above median number of patents-class-year adjusted citations is more
than 2 (which is the median of the distribution of such impactful innovation by all the inventor CEOs) and is 0 otherwise. Low-Impact Innovation experience is
equal to 1 if the number of patents registered with the CEO as one of the assignees that accumulates above median number of patents-class-year adjusted citations
is less than or equal to 2 and is 0 otherwise. New Product announcement return is defined as the sum of all positive cumulative abnormal returns over the year in
basis points and Major New Product Announcement is the number of announcements with cumulative abnormal returns above the 75th percentile following
Mukherjee et al. (2016). Tobin's Q is defined as (book value of assets-book value of equity +market value of equity) /book value of assets. Firm Size is the natural
log of book value of Asset of the firm. Firm-age is the Log of firm age where firm age is the number of years since the inception of the firms. Volatility is the
volatility of stock return. CAPEX is Capital expenditure scaled by Asset. Missing values are coded with zero. R&D/Asset is Research and development expenditures
scaled by total assets. Missing values are coded with zero. Leverage is defined as (long-term debt+ Short-term debt) /Total assets. CEO-Tenure is the CEO tenure
in years. PhD (STEM) is an indicator variable equal to one for CEOs with PhD in Science, Technology, Engineering and Mathematics and zero otherwise. Technical
Education is an indicator variable equal to one for CEOs with undergraduate or graduate degrees in engineering, physics, operation research, chemistry, mathematics,
biology, pharmacy, or other applied science and zero otherwise. MBA is an indicator variable equal to one if the CEO received MBA degree or zero otherwise. No
school information is an indicator equal to one if we cannot identify the CEOs’ undergraduate school and zero otherwise. All regressions include year and industry
(based on two digit SIC code) fixed effects. Standard errors are clustered at the firm level. t- ratios are reported in parentheses. *, **, and *** denote significance
at the 10%, 5%, and 1% level, respectively.
Variables Full sampleFull sampleFull sampleFull sample Excluding Innova-Excluding Innova-Excluding Innova-Excluding Innova-
tion active CEOstion active CEOstion active CEOstion active CEOs Full sampleFull sampleFull sampleFull sample
Excluding Innova-Excluding Innova-Excluding Innova-Excluding Innova-
tion active CEOstion active CEOstion active CEOstion active CEOs (1) (2) (3) (4) (5) (6) (7) (8)
New Product announcement returnNew Product announcement returnNew Product announcement returnNew Product announcement return Log(1+# Major New Product Announcement)Log(1+# Major New Product Announcement)Log(1+# Major New Product Announcement)Log(1+# Major New Product Announcement)
Inventor CEOs (Indica-
tor) 0.198** 0.295***
(2.352) (2.887) Innovation-Active CEOs 0.212** 0.357***
(2.532) (3.212) High impact innovation
experience 0.164*** 0.109** 0.350*** 0.294**

65
(2.760) (1.982) (3.003) (2.061)
Low impact innovation
experience 0.221* 0.188 0.258** 0.230*
(1.969) (1.588) (2.060) (1.729)
Firm-size 0.132*** 0.132*** 0.131*** 0.120*** 0.289*** 0.290*** 0.290*** 0.279***
(4.817) (4.585) (4.950) (4.474) (8.168) (7.889) (8.222) (7.662)
Firm Age -0.020 -0.019 -0.021 -0.012 -0.051 -0.047 -0.050 -0.041
(-0.915) (-0.854) (-0.953) (-0.687) (-1.136) (-1.062) (-1.115) (-0.914)
Volatility 0.001 0.004 -0.000 -0.012 0.026 0.032 0.029 0.028
(0.065) (0.229) (-0.027) (-0.648) (0.620) (0.730) (0.700) (0.672)
RD/Assets 0.802*** 0.766*** 0.805*** 0.788*** 2.307*** 2.248*** 2.301*** 2.347***
(4.058) (3.990) (4.050) (4.083) (4.581) (4.558) (4.576) (4.528)
CAPEX -0.074 -0.115 -0.084 -0.250 0.257 0.170 0.272 0.069
(-0.163) (-0.256) (-0.181) (-0.583) (0.326) (0.219) (0.344) (0.084)
Leverage -0.446*** -0.447*** -0.446*** -0.394*** -0.927*** -0.927*** -0.927*** -0.798***
(-3.473) (-3.319) (-3.493) (-3.108) (-4.215) (-4.179) (-4.202) (-3.427)
Log(Tobin's Q) 0.061* 0.057 0.061* 0.063* 0.110** 0.103** 0.109** 0.120**
(1.696) (1.513) (1.683) (1.772) (2.268) (2.064) (2.230) (2.415)
CEO Tenure 0.000 0.001 0.000 -0.000 0.000 0.001 -0.000 -0.001
(0.116) (0.391) (0.160) (-0.147) (0.034) (0.172) (-0.013) (-0.391)
PhD (STEM) -0.059 -0.032 -0.054 -0.026 -0.015 0.020 -0.024 -0.029
(-0.819) (-0.530) (-0.776) (-0.346) (-0.133) (0.193) (-0.202) (-0.229)
Technical Education 0.027 0.024 0.028 0.035 0.013 0.007 0.011 0.022
(0.739) (0.630) (0.768) (1.148) (0.194) (0.111) (0.165) (0.337)
MBA 0.013 0.006 0.010 0.020 0.083 0.074 0.086 0.087
(0.412) (0.188) (0.338) (0.718) (1.381) (1.226) (1.445) (1.451)
No school information 0.066 0.062 0.065 0.078* 0.080 0.074 0.081 0.105
(1.347) (1.194) (1.358) (1.695) (0.760) (0.674) (0.771) (0.971)
Constant -0.977*** -0.970*** -0.972*** -0.914*** -1.832*** -1.822*** -1.841*** -1.812***

66
(-3.949) (-3.772) (-4.043) (-3.854) (-4.602) (-4.533) (-4.640) (-4.504)
Observations 1,438 1,438 1,438 1,348 1,438 1,438 1,438 1,348
Adjusted R-squared 0.338 0.328 0.339 0.333 0.364 0.363 0.365 0.348
Industry-Fixed effects Y Y Y Y Y Y Y Y
Year fixed effects Y Y Y Y Y Y Y Y

67
AppendixAppendixAppendixAppendix
Inventor CEO DatasetInventor CEO DatasetInventor CEO DatasetInventor CEO Dataset
In this section, we describe the process of Inventor CEO dummy construction by match-
ing the US Patent Inventor Database (PID) from Li et al. (2014) to ExecuComp list of
CEOs in our sample of High-tech firms during 1992-2008. PID contains information
(name, Country, State, City etc.) on each of the patentee of more than 8 million inven-
tor-patents instances for patents filed since 1901 through 2010 at USPTO. It also con-
tains data on patent Assignees. More importantly, it contains unique inventor ID and
unique assignee ID for all these patents.
Step 1: We use regular expression to standardize the names of the CEOs in ExecuComp
dataset to generate a list of unique CEO names with first, middle and last names. The
names of Inventor in PID are already in Standardized form. In PID, ‘Full name’ defined
as having both first and last name present is available for 99.99% of records.
Step 2: We then match unique CEO names (Last names, Middle names and First names)
in ExecuComp to Patentee names (Last names, Middle names and First names) in PID
and generate a list of probable matches. We retain information on Unique Inventor ID
in this list which we use later to recover all the patents that belong to a particular
patentee from PID.
Step 3: Since we have Company names and Assignee names from this matching process,
we identify instances where we find matches for both CEO names and Company names
from ExecuComp to Patentee names and Assignee names in PID, respectively. If we find
matches in both individual name category (CEO name and Patentee name) and organ-
izational name category (Company name and Assignee), we code them as 1 for Inventor
CEO Indicator variable.
Step 4: Next, we identify rest of the instances in this list where we CEO names and
Patentee names are matched; however Company names and Assignee names do not
match from this list. For example, we find match for Gilberto F. Amelio who was a CEO
for National Semiconductor Corp (1992-1995) and Apple Inc. (1996-1997) in our sample.
However, this list shows ‘Fairchild Camera And Instrument Corporation’ as the Assignee
for all patents applied from 1973 through 1977 by this patentee.
Step 5: Since we collect biographies for all the CEOs in our sample (various sources
including Funding Universe website, Notable Names Data Base (NNDB), company web-
sites, and other Internet resources including Wikipedia, Forbes pages, Bloomberg’s Busi-
ness Week website, LinkedIn pages, Crunchbase.com, among others), for matches in step
4, we track their career history and confirm whether they have worked for these Assignee

68
companies/organizations in the past. Therefore, in step 3 and step 5, we identify inventor
CEOs (regardless of the focal firms in our sample) who have patenting history in USPTO.
To continue with the previous example of Gilberto F. Amelio, we track his career history
and find that he had worked for Fairchild Camera and Instrument Corporation during
1971-1983.15 The detailed executive profile also mentions that he holds several patents.16
15 (https://www.bloomberg.com/profiles/people/1409980-gilbert-f-amelio) 16 http://www.bloomberg.com/research/stocks/people/person.asp?personId=72492&privcapId=30820843

69
Table A1. Variable definitionTable A1. Variable definitionTable A1. Variable definitionTable A1. Variable definition
Patents (t+1) Log(1+# of patents) at t+1
Patents (t+2) Log(1+# of patents) at t+2
Citation(t+1) Log(1+# of Citations) at t+1
Citations (t+2) Log(1+# of Citations) at t+2
Radical Innovation Patents that have cited the maximum number of times in an industry-year pair
Firm Size Log(Total Assets)
RD/Assets
The ratio of research and development expenditures over total assets, expressed as a percentage. Missing values are
set to zero
CAPEX The ratio of Capital Expenditure over total assets, expressed as a percentage. Missing values are set to zero
Firm Age Natural logarithm of the number of years since the firm’s inception
Leverage Sum of Short term debt and Long-term debt scaled by Total Assets
Tobin's Q
The market value of assets divided by the book value of assets where the market value of assets equals the book
value of assets plus the market value of common equity less the sum of the book value of common equity and
balance sheet deferred taxes
CEO Tenure CEO tenure in years
Volatility Volatility of stock return
Founder-CEO Founder CEO is equal to one if the CEO is a founder of the firm or CEO since the founding year of the firm
Overconfident CEO (67)
Overconfident CEO (67) is an indicator variable equal to one for all years after the CEO’s options exceed 67%
moneyness and zero otherwise.
Board size Number of directors in the Corporate Board
Co-option Co-option is the fraction of directors those are appointed after CEO assumed office as defined in Coles et al. (2014).
Institutional Holdings (%) Percentage of shares held by financial institutions
CEO ownership
CEO ownership is defined as the ratio of the number of shares owned by the CEO after adjusting for stock splits
to total shares outstanding.
CEO Equity-based pay
CEO equity-based pay is the value of annual option pay divided by the sum of salary, bonus and annual option
pay
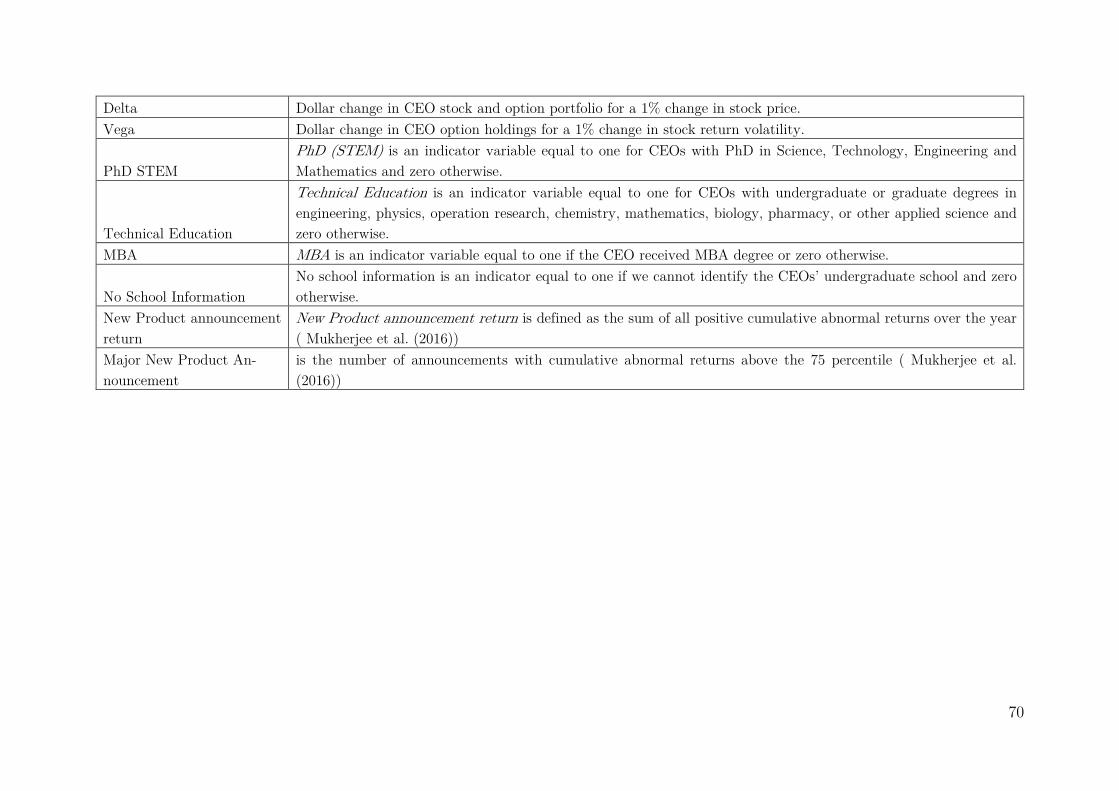
70
Delta Dollar change in CEO stock and option portfolio for a 1% change in stock price.
Vega Dollar change in CEO option holdings for a 1% change in stock return volatility.
PhD STEM
PhD (STEM) is an indicator variable equal to one for CEOs with PhD in Science, Technology, Engineering and
Mathematics and zero otherwise.
Technical Education
Technical Education is an indicator variable equal to one for CEOs with undergraduate or graduate degrees in
engineering, physics, operation research, chemistry, mathematics, biology, pharmacy, or other applied science and
zero otherwise.
MBA MBA is an indicator variable equal to one if the CEO received MBA degree or zero otherwise.
No School Information
No school information is an indicator equal to one if we cannot identify the CEOs’ undergraduate school and zero
otherwise.
New Product announcement
return
New Product announcement return is defined as the sum of all positive cumulative abnormal returns over the year
( Mukherjee et al. (2016))
Major New Product An-
nouncement
is the number of announcements with cumulative abnormal returns above the 75 percentile ( Mukherjee et al.
(2016))