invalid specimen study newborn screening program nysdoh joe orsini, phd ken pass, phd
TRANSCRIPT
Invalid Specimen Study
Newborn Screening Program NYSDOH
Joe Orsini, PhD
Ken Pass, PhD

Full credit to the guy with the idea, and the talent and energy to make it happen:
Joe Orsini, PhD
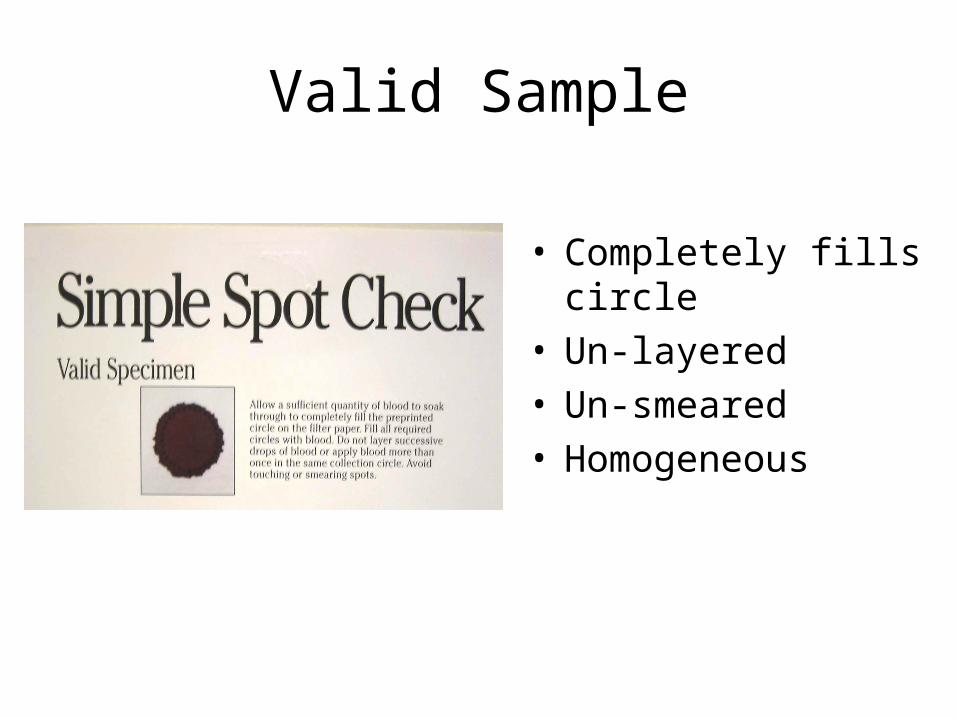
Valid Sample
• Completely fills circle• Un-layered• Un-smeared• Homogeneous
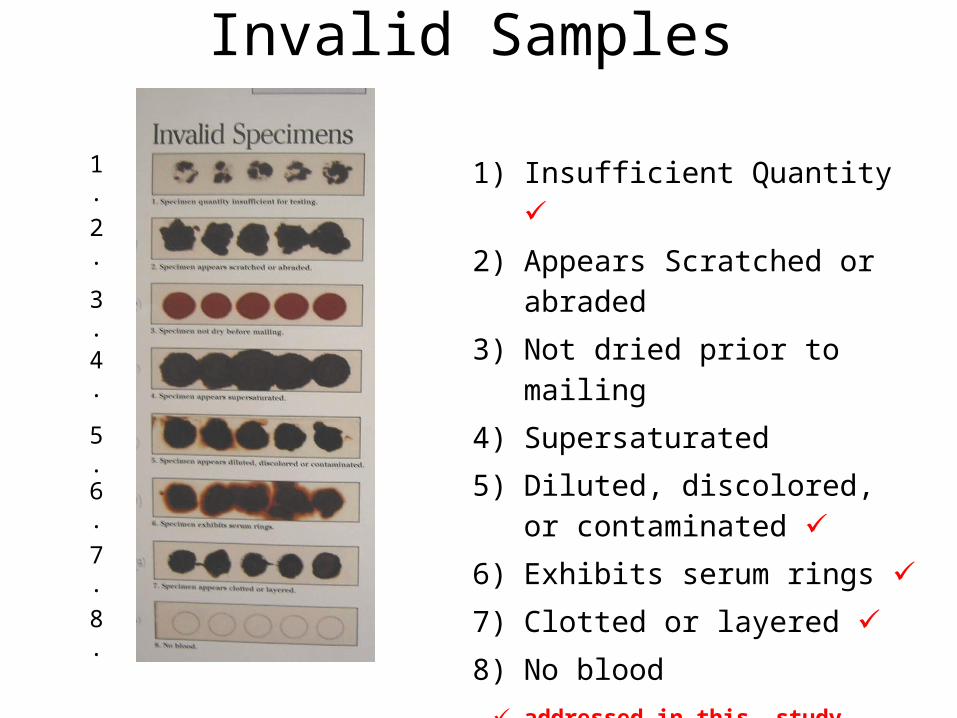
Invalid Samples
1) Insufficient Quantity
2) Appears Scratched or abraded
3) Not dried prior to mailing
4) Supersaturated
5) Diluted, discolored, or contaminated
6) Exhibits serum rings
7) Clotted or layered
8) No blood
addressed in this study
1.
2.
8.
7.
6.
5.
4.
3.
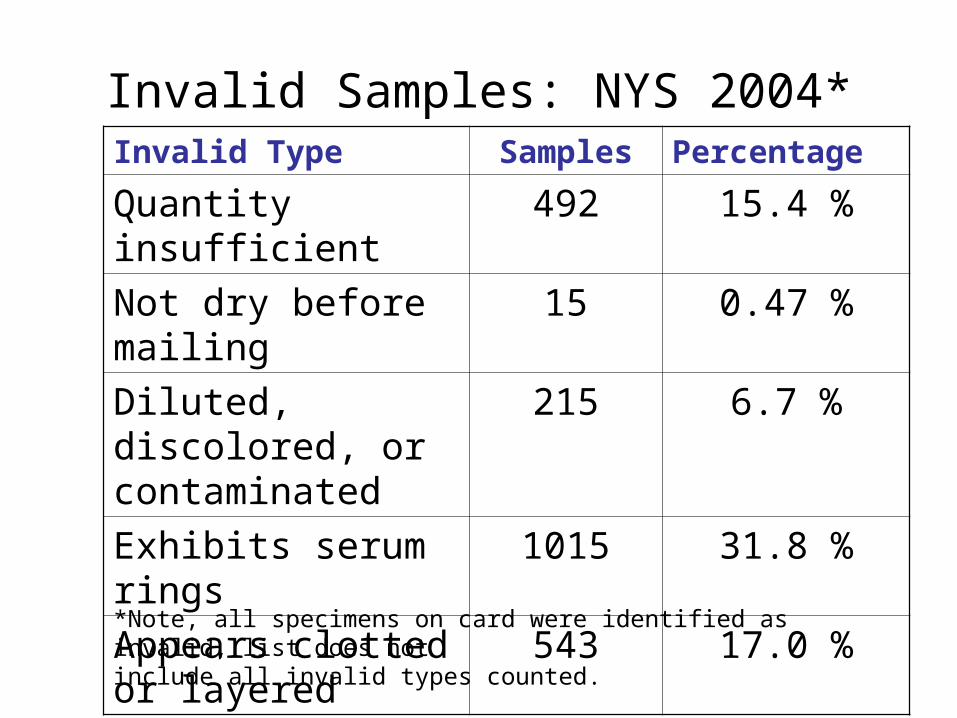
Invalid Samples: NYS 2004*Invalid Type Samples Percentage
Quantity insufficient 492 15.4 %
Not dry before mailing
15 0.47 %
Diluted, discolored, or contaminated
215 6.7 %
Exhibits serum rings 1015 31.8 %
Appears clotted or layered
543 17.0 %
*Note, all specimens on card were identified as invalid, list does not include all invalid types counted.
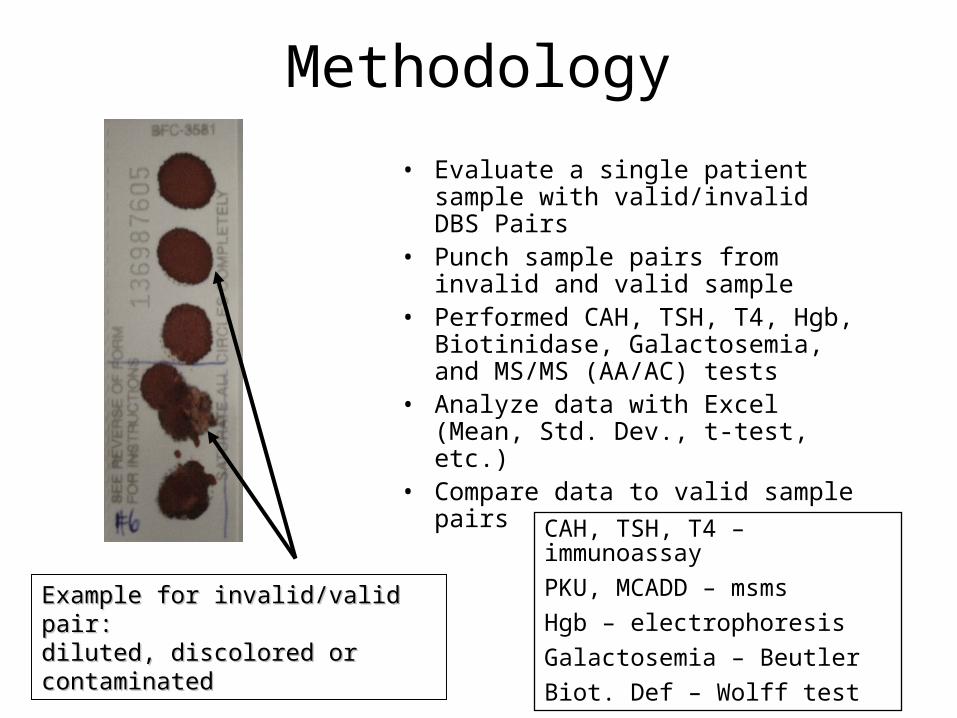
Methodology
• Evaluate a single patient sample with valid/invalid DBS Pairs
• Punch sample pairs from invalid and valid sample
• Performed CAH, TSH, T4, Hgb, Biotinidase, Galactosemia, and MS/MS (AA/AC) tests
• Analyze data with Excel (Mean, Std. Dev., t-test, etc.)
• Compare data to valid sample pairs
Example for invalid/valid pair:Example for invalid/valid pair:diluted, discolored or contaminateddiluted, discolored or contaminated
CAH, TSH, T4 – immunoassay
PKU, MCADD – msms
Hgb – electrophoresis
Galactosemia – Beutler
Biot. Def – Wolff test

Study Method: Pros and Cons
– Use real world specimens
– Invalid and valid samples collected at same time from same specimen
– Random sampling of DBS
– Invalid/valid sample pairs analyzed at same time
– Dependent on available samples
– Not all invalid types were available for this study
– Sometimes difficult to assign invalid sample type
– Unlikely for there to be both an abnormal baby and invalid sample type on same specimen
Pros Cons

Testing Summary
Qualitative testsHeminoglobinopathies
Biotinidase
Galactosemia
Quantitative testsCAH (17-OHP)
CH (T4* and TSH)
MCADD (C8*)
PKU (phenylalanine*)
* Example data shown, other tests showed similar data and are not presented on slides.

Invalid Samples - Study
Invalid Type Samples
Insufficient quantity 24
Diluted, discolored, contaminated
69
Exhibits serum rings 61
Specimen clotted or layered
180
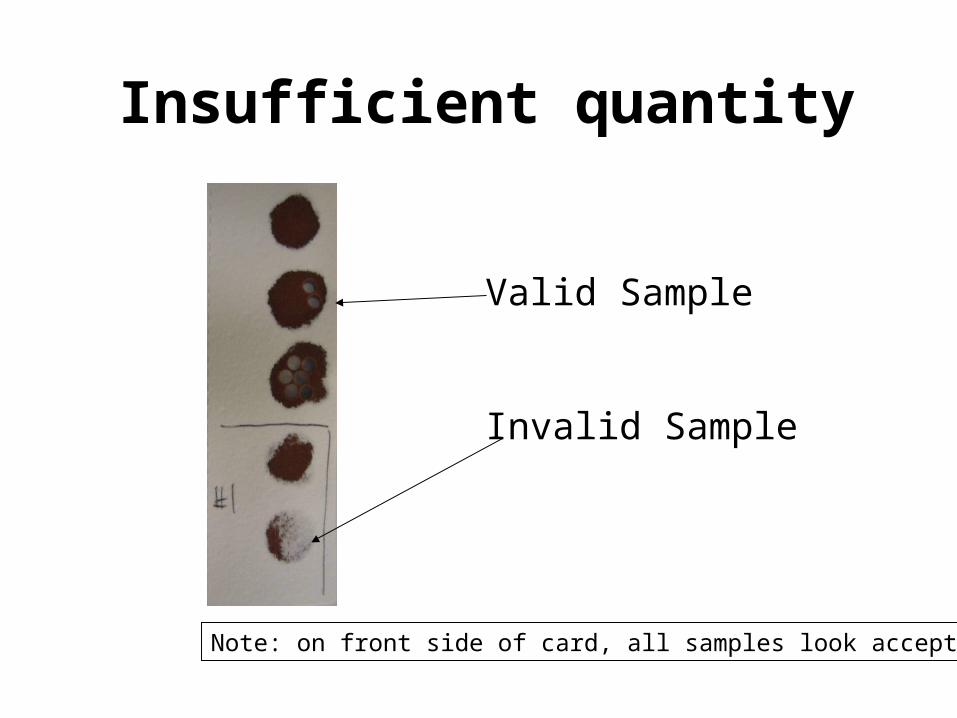
Insufficient quantity
Valid Sample
Invalid Sample
Note: on front side of card, all samples look acceptable
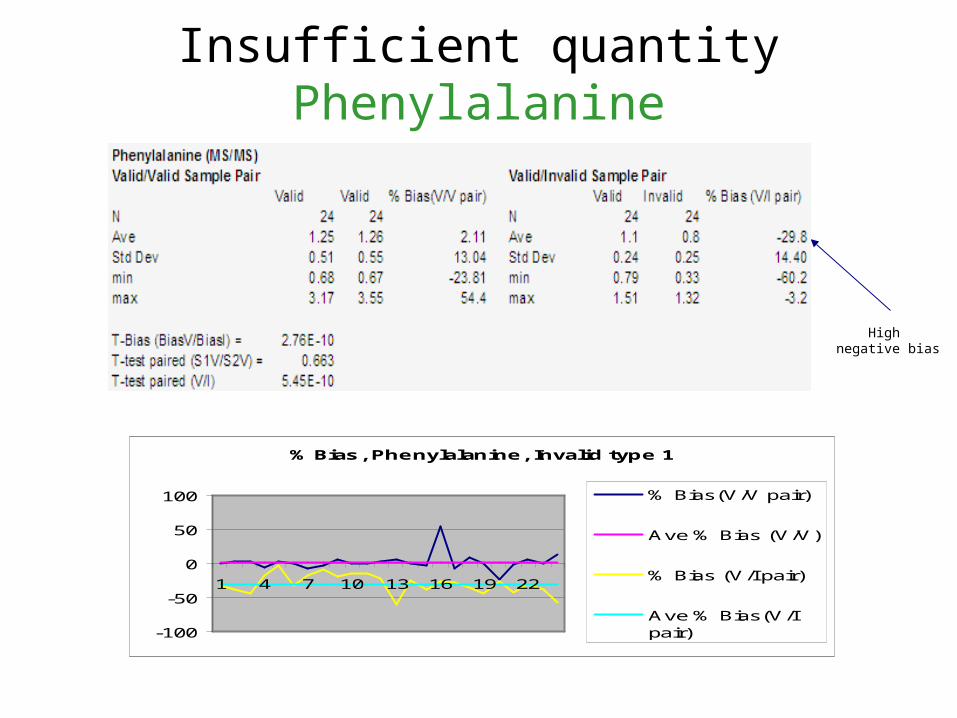
Insufficient quantityPhenylalanine
% Bias, Phenylalanine, Invalid type 1
-100
-50
0
50
100
1 4 7 10 13 16 19 22
% Bias(V/V pair)
Ave % Bias (V/V)
% Bias (V/I pair)
Ave % Bias(V/Ipair)
High negative bias

Insufficient quantity MCADD/C8
High negative bias
% Bias, C8, Invalid type 1
-60
-40
-20
0
20
40
1 4 7 10 13 16 19 22
% Bias(V/V pair)
Ave % Bias (V/V)
% Bias (V/I pair)
Ave % Bias(V/Ipair)

Insufficient quantityThyroxine
High negative bias
% Bias, T4, Invalid Type 1
-100
-80
-60
-40
-20
0
20
40
1 4 7 10 13 16 19 22
%Bias(S1V/S2V)
Ave % Bias(V/V)
% Bias
Ave % Bias

Insufficient quantitysummary
• Overall negative bias• Expected result with less
blood• T-test indicates high
probability that invalid data sets are different from valid data sets (P<0.05)
• Potential for qualifying abnormal specimen as normal (opposite for T4)
Marker % BiasPhenylalanine -29.8
MCADD/C8 -15.3
CAH -25.8
TSH -19.5
Thyroxine -25

Insufficient quantity Decision making
Marker Valid Invalid Cutoff Report
Valid Invalid
CAH 10.6 7.5 ≥ 50 Normal Normal
PKU 1.49 1.05 ≥ 4 Normal Normal
MCADD 0.13 0.08 ≥ 0.8 Normal Normal
T4 (CH) 12.5 2.8 ≤ 5 Normal Abnormal
TSH (CH) 19.7 14.9 ≥ 18 Retest Normal
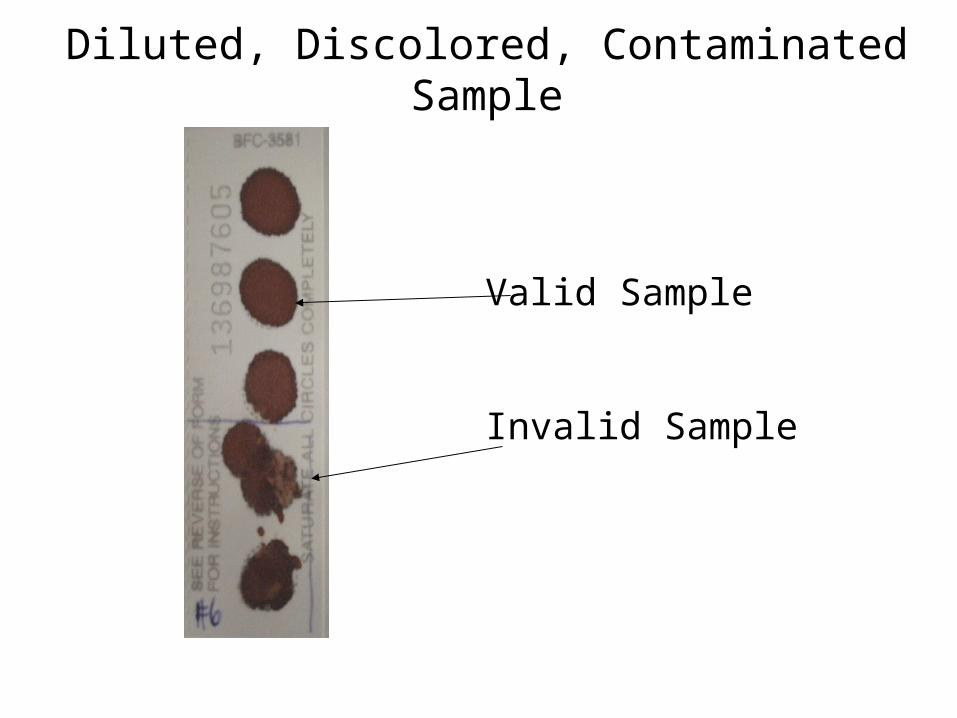
Diluted, Discolored, Contaminated Sample
Valid Sample
Invalid Sample

Diluted, discolored, contaminated Phenylalanine
% Bias, Phenylalanine, Invalid Type 6
-60
-40
-20
0
20
40
60
1 7 13 19 25 31 37 43 49 55 61 67
% Bias(S1V/S2V)
Ave % Bias (V/V)
% Bias (/I)
Ave % bias(V/I)
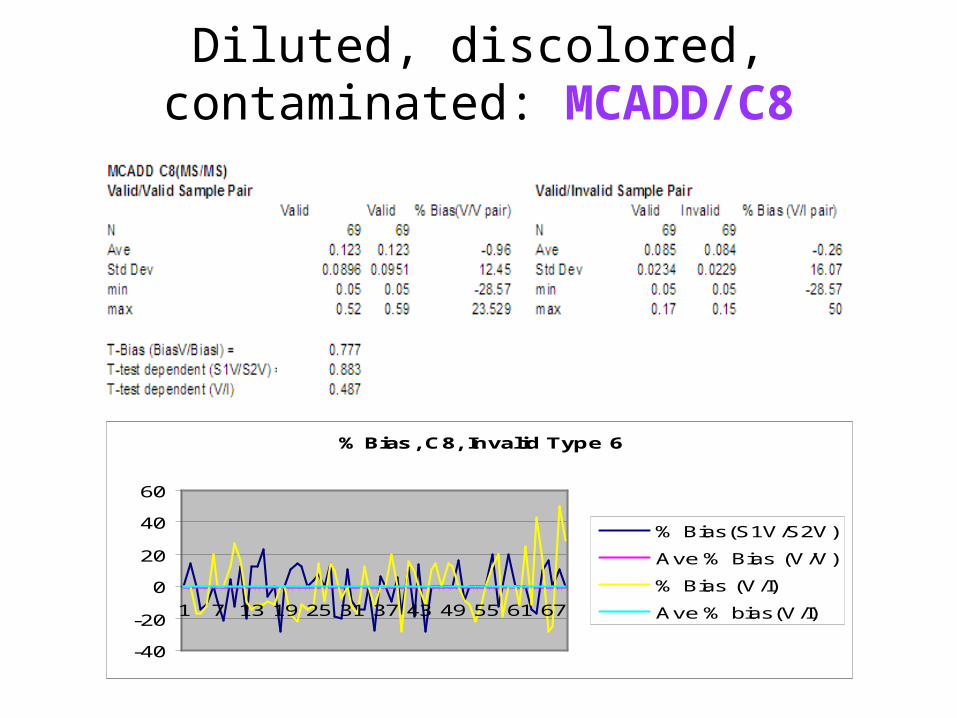
Diluted, discolored, contaminated: MCADD/C8
% Bias, C8, Invalid Type 6
-40
-20
0
20
40
60
1 7 13 19 25 31 37 43 49 55 61 67
% Bias(S1V/S2V)
Ave % Bias (V/V)
% Bias (V/I)
Ave % bias(V/I)

Diluted, discolored, contaminated Thyroxine
%Bias,T4, Invalid type 6
-100
-50
0
50
100
1 7 13 19 25 31 37 43 49 55 61 67
Pair number
% B
ias
% Bias(S1V/S2V)
Ave % Bias (V/V)
% Bias (V/I)
Ave % Bias (V/I)
Std. Dev., T4, Invalid 6
0
2
4
6
8
10
1 7 13 19 25 31 37 43 49 55 61 67
std. dev. (V/V)
Ave std.dev (V/V)
std. dev. (V/I)
Ave std. dev. (V/I)
Ave Std Dev large for V/I pair
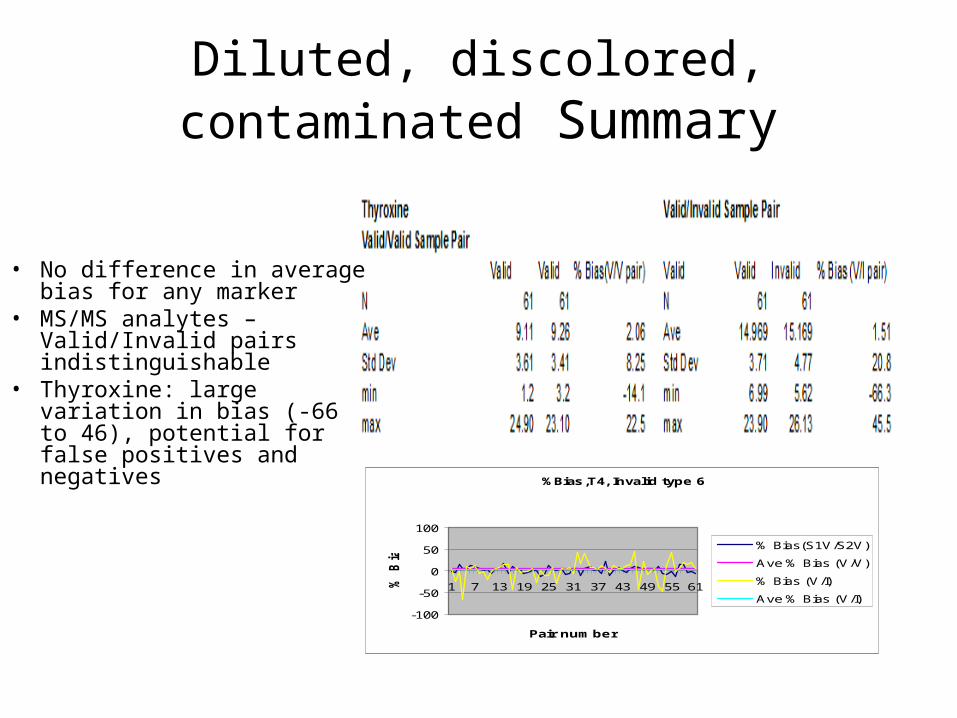
Diluted, discolored, contaminated Summary
• No difference in average bias for any marker
• MS/MS analytes – Valid/Invalid pairs indistinguishable
• Thyroxine: large variation in bias (-66 to 46), potential for false positives and negatives
%Bias,T4, Invalid type 6
-100
-50
0
50
100
1 7 13 19 25 31 37 43 49 55 61
Pair number
% B
ias % Bias(S1V/S2V)
Ave % Bias (V/V)
% Bias (V/I)
Ave % Bias (V/I)
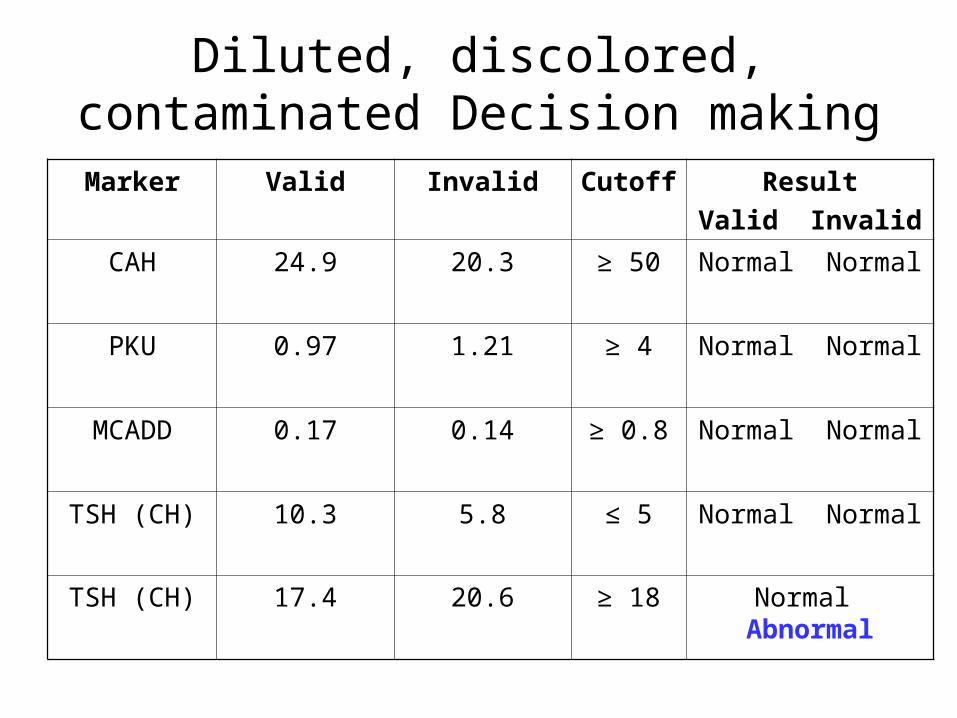
Diluted, discolored, contaminated Decision making
Marker Valid Invalid Cutoff Result
Valid Invalid
CAH 24.9 20.3 ≥ 50 Normal Normal
PKU 0.97 1.21 ≥ 4 Normal Normal
MCADD 0.17 0.14 ≥ 0.8 Normal Normal
TSH (CH) 10.3 5.8 ≤ 5 Normal Normal
TSH (CH) 17.4 20.6 ≥ 18 Normal Abnormal

Serum Rings
Invalid Sample
Valid Sample
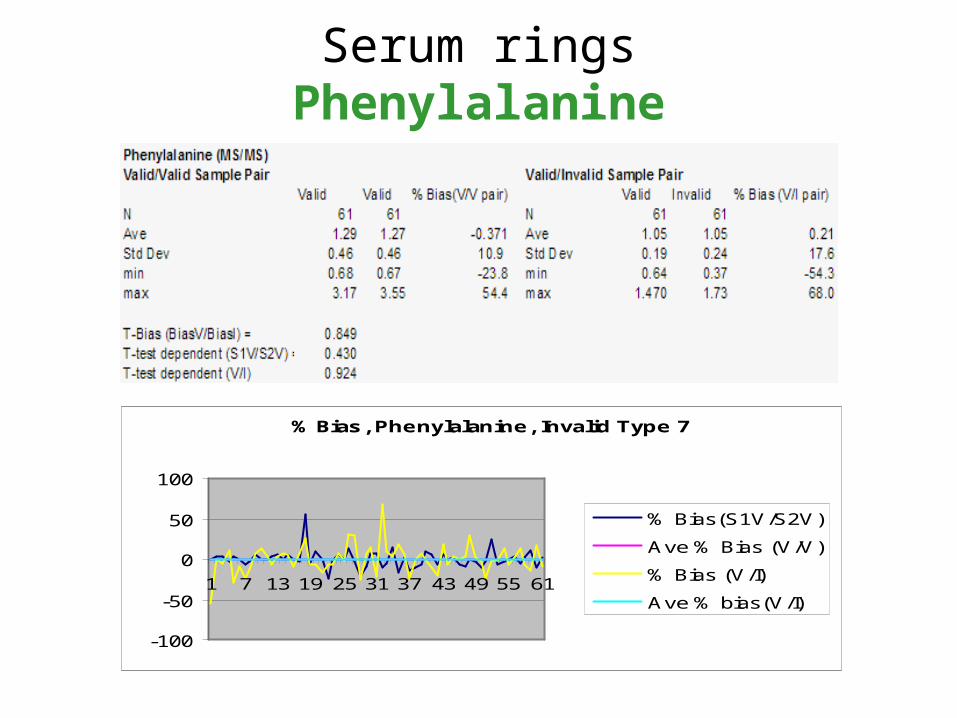
Serum ringsPhenylalanine
% Bias, Phenylalanine, Invalid Type 7
-100
-50
0
50
100
1 7 13 19 25 31 37 43 49 55 61
% Bias(S1V/S2V)
Ave % Bias (V/V)
% Bias (V/I)
Ave % bias(V/I)
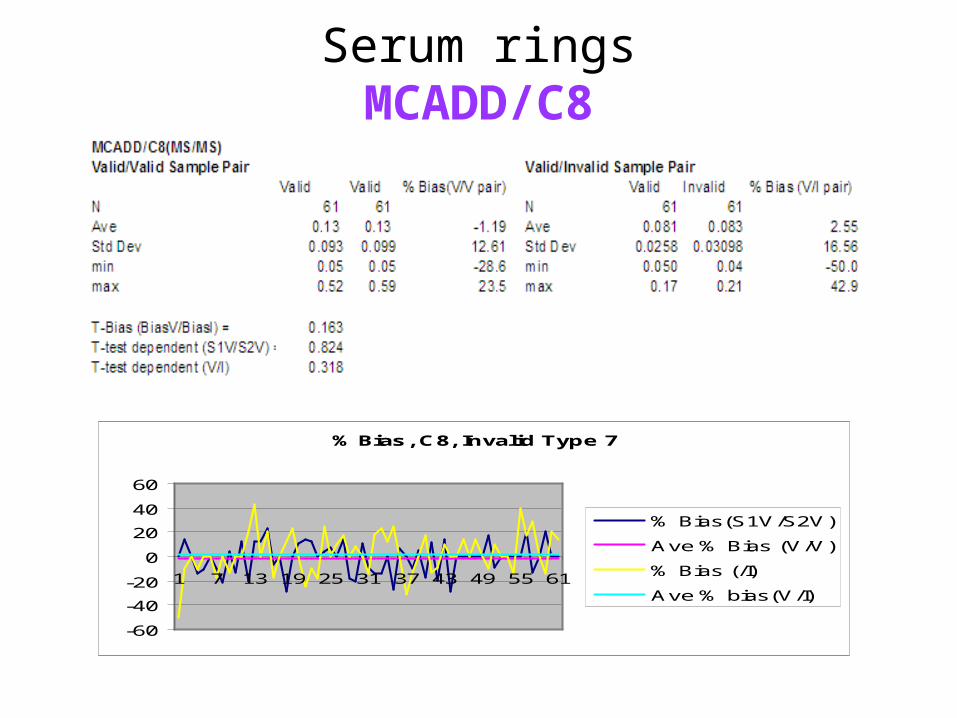
Serum ringsMCADD/C8
% Bias, C8, Invalid Type 7
-60
-40
-20
0
20
40
60
1 7 13 19 25 31 37 43 49 55 61
% Bias(S1V/S2V)
Ave % Bias (V/V)
% Bias (/I)
Ave % bias(V/I)

Serum ringsThyroxine
T4 %Bias, invalid type 7
-60
-40
-20
0
20
40
60
1 7 13 19 25 31 37 43 49
Pair number
% b
ias
% Bias(S1V/S2V)
Ave % bias
% Bias(V/I)
Ave % Bias (V/I)
T4 Std. Dev., invalid type 7
02468
10
1 6 11 16 21 26 31 36 41 46 51
Pair number
Std
Dev
std. dev. (V/V)
Ave std.dev (V/V)
std. dev. (V/I)
Ave std. dev. (V/I)
Serum RingsSummary
T4 %Bias, invalid type 7
-60
-40
-20
0
20
40
60
1 7 13 19 25 31 37 43 49
Pair number
% b
ias % Bias(S1V/S2V)
Ave % bias
% Bias(V/I)
Ave % Bias (V/I)
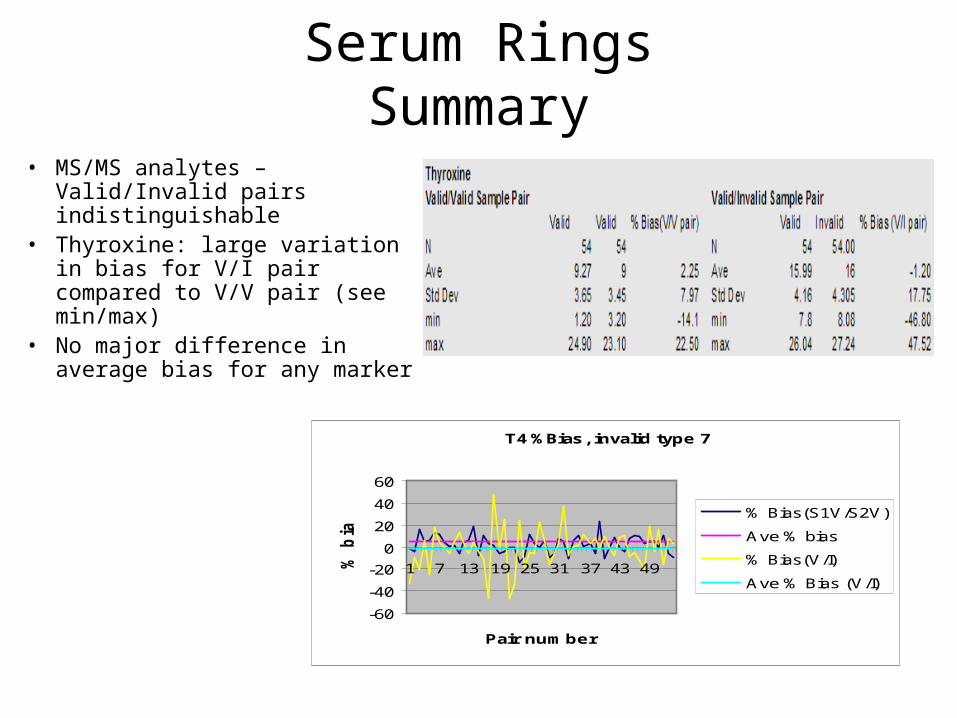
• MS/MS analytes – Valid/Invalid pairs indistinguishable
• Thyroxine: large variation in bias for V/I pair compared to V/V pair (see min/max)
• No major difference in average bias for any marker

Serum RingsDecision making
Marker Valid Invalid Cutoff Result
Valid Invalid
CAH 49.5 15.4 ≥ 50 Normal Normal
PKU 1.03 1.73 ≥ 4 Normal Normal
MCADD 0.16 0.11 ≥ 0.8 Normal Normal
T4 10.3 16.9 ≤ 5 Normal Normal
TSH (CH) 19.1 11.9 ≥ 18 Retest Normal
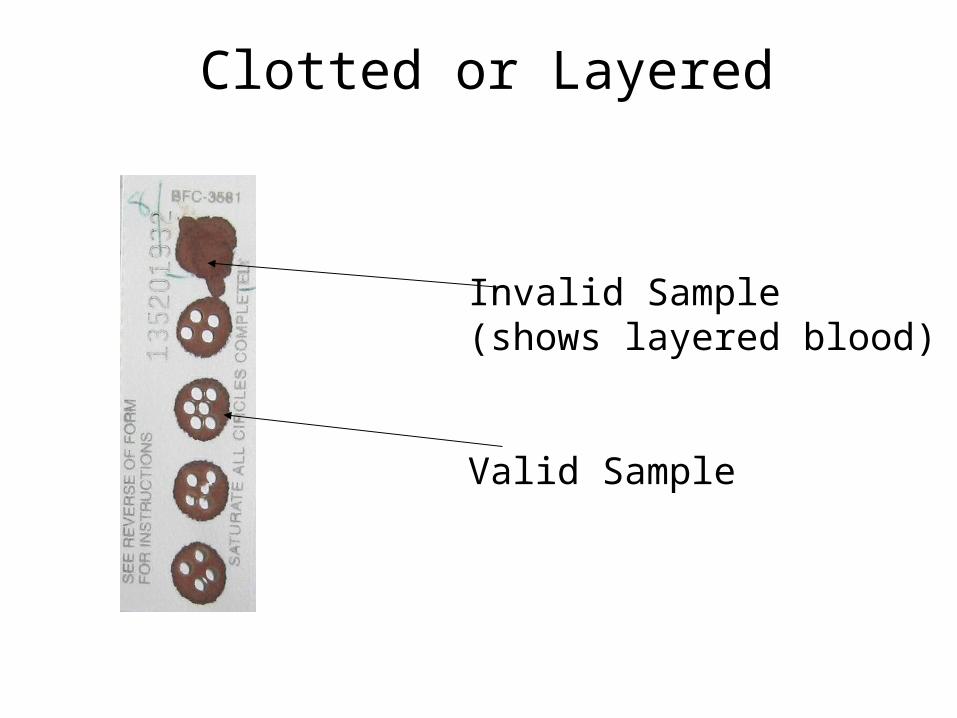
Clotted or Layered
Invalid Sample(shows layered blood)
Valid Sample
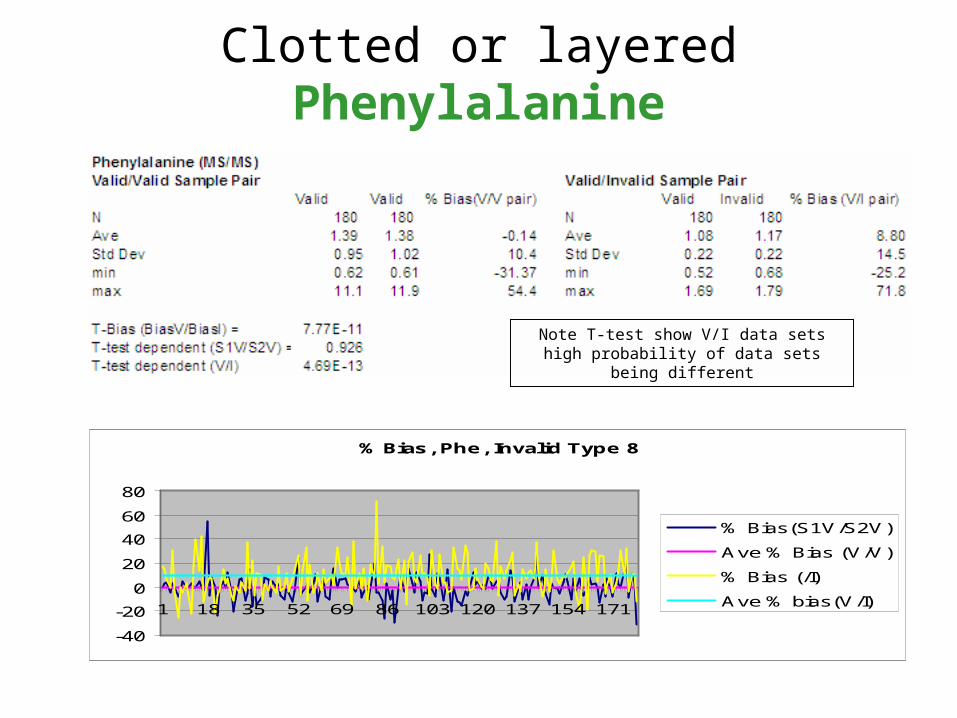
Clotted or layeredPhenylalanine
% Bias, Phe, Invalid Type 8
-40
-20
0
20
40
60
80
1 18 35 52 69 86 103 120 137 154 171
% Bias(S1V/S2V)
Ave % Bias (V/V)
% Bias (/I)
Ave % bias(V/I)
Note T-test show V/I data sets high probability of data sets being different
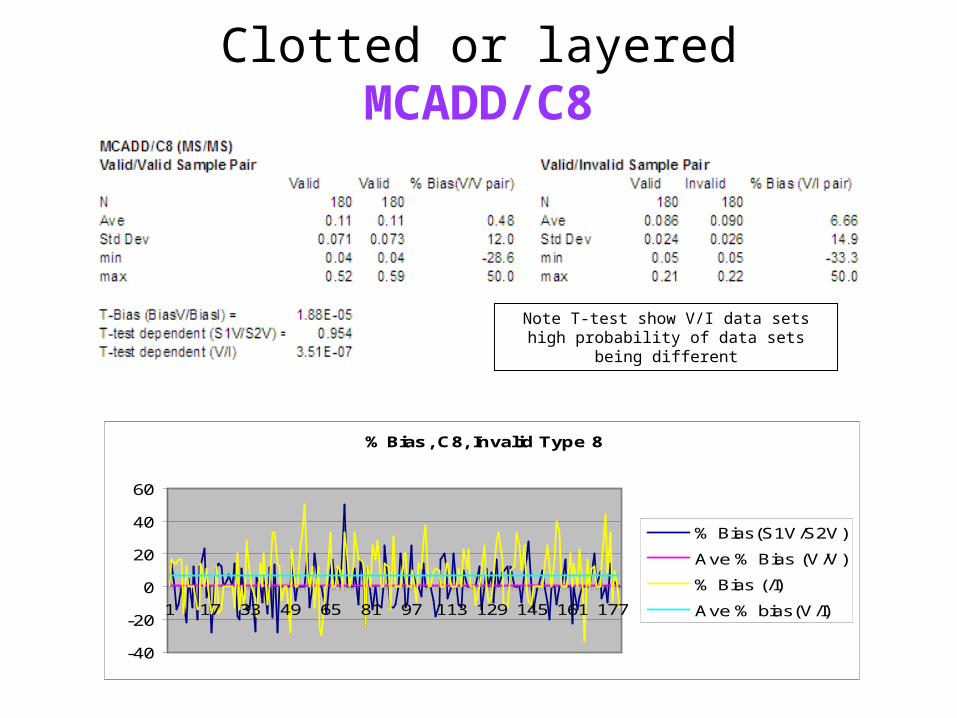
Clotted or layeredMCADD/C8
% Bias, C8, Invalid Type 8
-40
-20
0
20
40
60
1 17 33 49 65 81 97 113 129 145 161 177
% Bias(S1V/S2V)
Ave % Bias (V/V)
% Bias (/I)
Ave % bias(V/I)
Note T-test show V/I data sets high probability of data sets being different
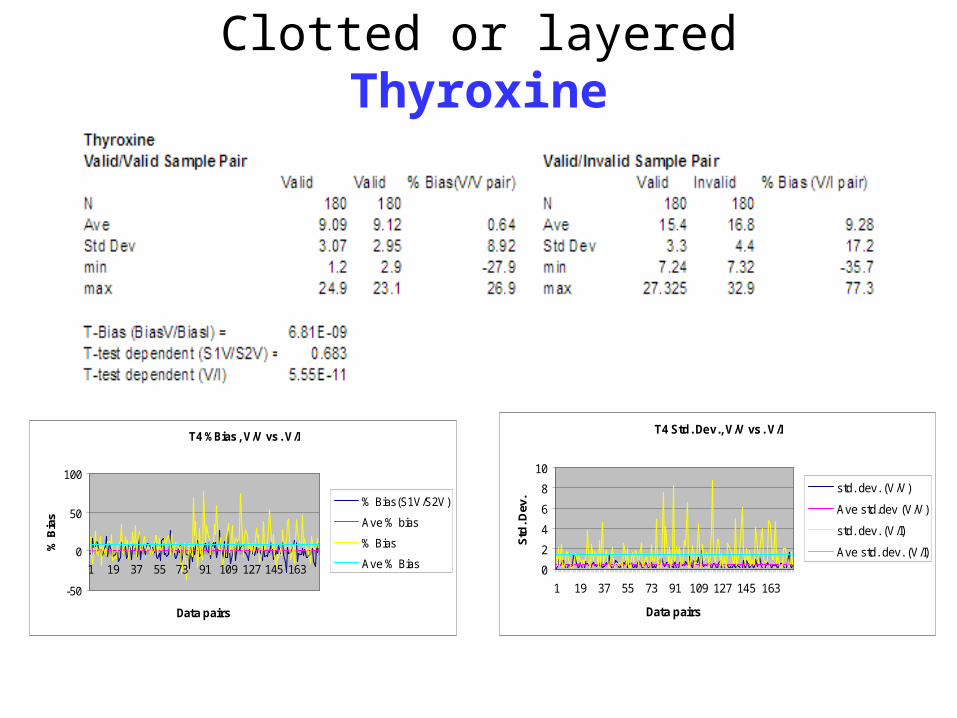
Clotted or layeredThyroxine
T4 %Bias, V/V vs. V/I
-50
0
50
100
1 19 37 55 73 91 109 127 145 163
Data pairs
% B
ias
% Bias(S1V/S2V)
Ave % bias
% Bias
Ave % Bias
T4 Std. Dev., V/V vs. V/I
0
2
4
6
8
10
1 19 37 55 73 91 109 127 145 163
Data pairs
Std
. Dev
.
std. dev. (V/V)
Ave std.dev (V/V)
std. dev. (V/I)
Ave std. dev. (V/I)

Clotted or layeredSummary
• Overall Positive bias• Some specimens w/
large neg. bias results• Potential to have false
positives and false negatives
• Expected due to layering of blood
Marker Average % Bias
17-OHP 9.8
Phenylalanine 8.8
MCADD/C8 6.7
TSH 14.2
Thyroxine 9.3

Clotted or layered: Decision making
*Invalid result lower than valid specimen result
Marker Valid Invalid Cutoff Result
Valid Invalid
CAH 50.2 39.3* ≥ 50 Retest Normal
PKU 0.76 0.96 ≥ 4 Normal Normal
MCADD 0.09 0.11 ≥ 0.8 Normal Normal
T4 18.5 20.1 ≤ 5 Normal Normal
TSH 7.7 19 ≥ 18 Normal Retest
TSH 19.1 11.9 ≥ 18 Retest Normal

Summary
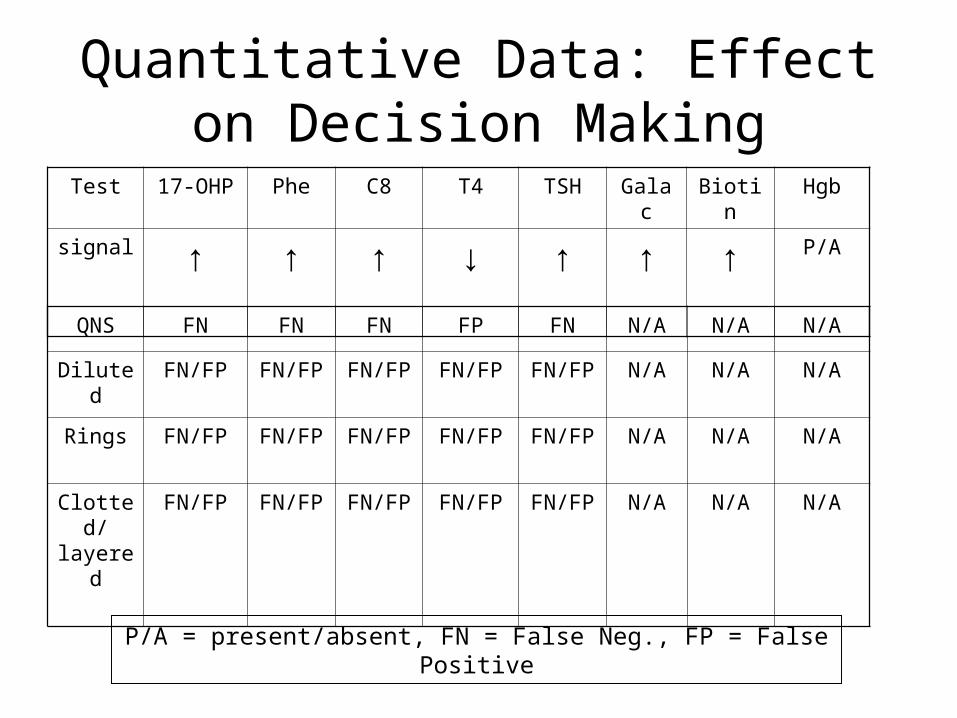
Quantitative Data: Effect on Decision Making
Test 17-OHP Phe C8 T4 TSH Galac Biotin Hgb
signal ↑ ↑ ↑ ↓ ↑ ↑ ↑ P/A
QNS FN FN FN FP FN N/A N/A N/A
Diluted FN/FP FN/FP FN/FP FN/FP FN/FP N/A N/A N/A
Rings FN/FP FN/FP FN/FP FN/FP FN/FP N/A N/A N/A
Clotted/layered
FN/FP FN/FP FN/FP FN/FP FN/FP N/A N/A N/A
P/A = present/absent, FN = False Neg., FP = False Positive

Conclusions
Quantity Insufficient – Bias low results, may be false negative or false
Positive (T4)– Qualitative results were unaffected (however, only 24
points and no positive specimens were tested)
Decision making data summary:
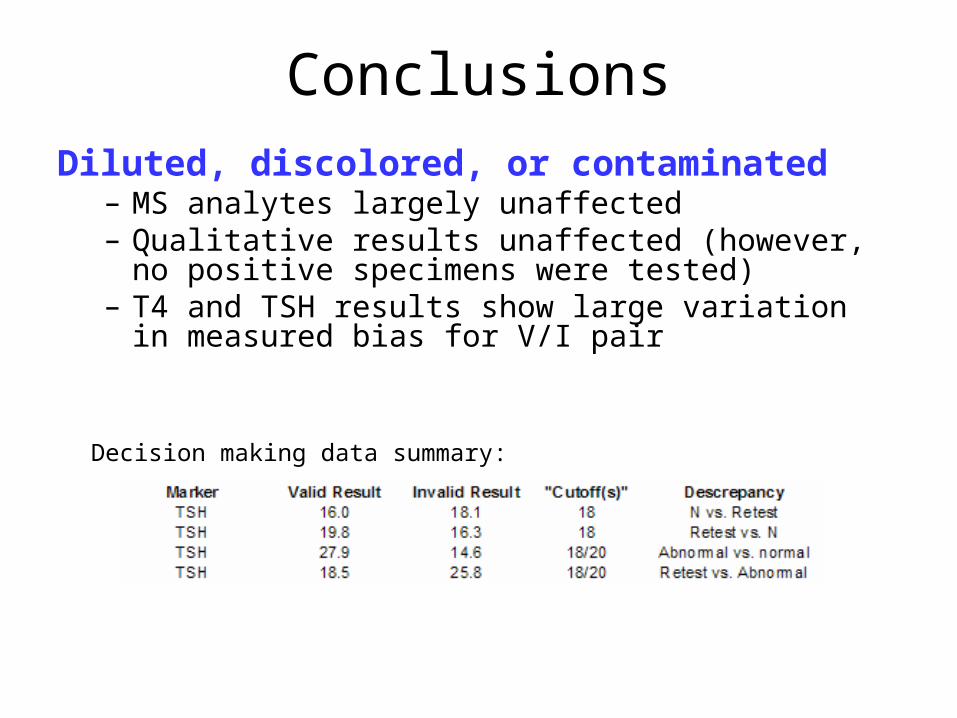
Conclusions
Diluted, discolored, or contaminated– MS analytes largely unaffected– Qualitative results unaffected (however, no positive
specimens were tested)– T4 and TSH results show large variation in
measured bias for V/I pair
Decision making data summary:

ConclusionsSerum Rings
– MS analytes largely unaffected, however there are affected samples (see below)
– Qualitative results unaffected (however, no positive specimens were tested)
– T4 and TSH results show large variation in measured bias for V/I sample pair
Decision making data summary:
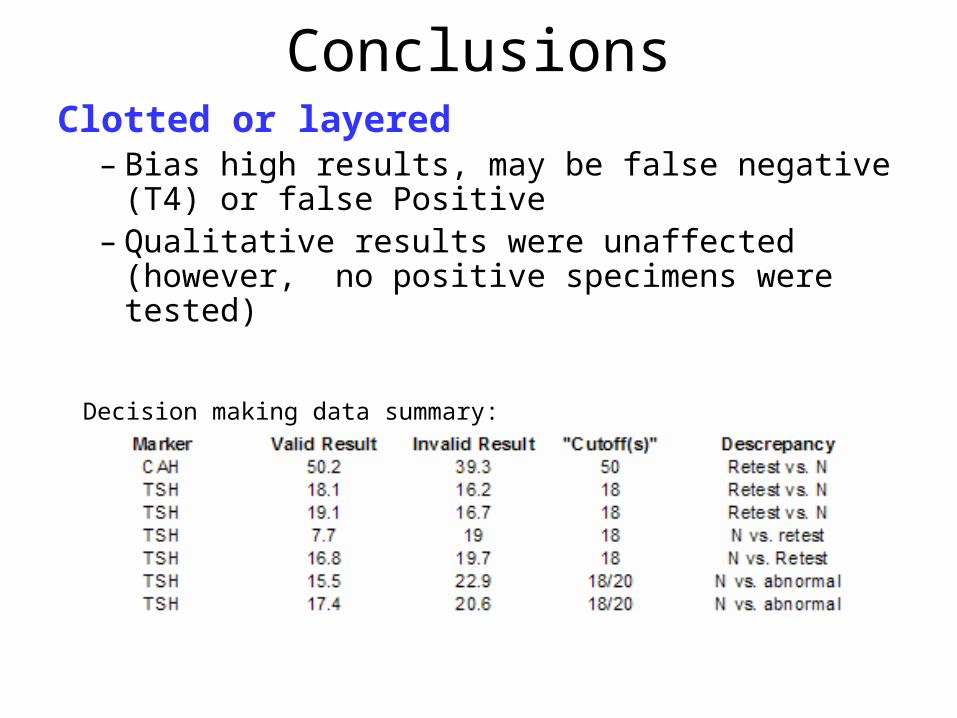
ConclusionsClotted or layered
– Bias high results, may be false negative (T4) or false Positive
– Qualitative results were unaffected (however, no positive specimens were tested)
Decision making data summary:

Conclusions• Quantity Insufficient
– Bias Low results for quantitative tests (false neg. - except T4)– Qualitative tests unaffected
• Diluted, discolored, or contaminated– MS analytes largely unaffected– T4 and TSH results show large variation in bias for V/I pair (+/-)– Qualitative results unaffected
• Serum Rings– MS analytes largely unaffected– T4 and TSH results show large variation in bias for V/I pair (+/-)– Qualitative results unaffected
• Clotted or layered – Generally bias high results, may be false negative (T4) or false positive– Some bias low results (where blood has not been layered) – Qualitative results unaffected
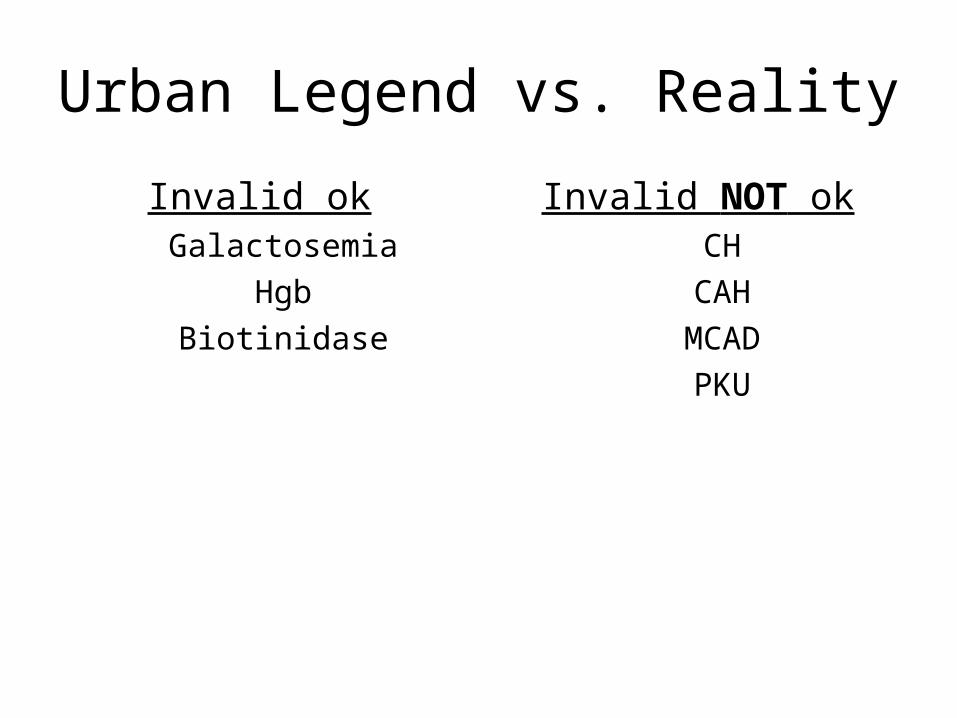
Urban Legend vs. Reality
Invalid okGalactosemia
Hgb
Biotinidase
Invalid NOT okCH
CAH
MCAD
PKU

Thank you.