introductory canadian edition statistics - pearson edition robert gould ... with confidence...
TRANSCRIPT

STATISTICSIntroductory
Exploring The World Through Data
Canadian Edition
A01_GOUL0000_00_SE_FM.indd 1 14/10/15 5:26 PM

A01_GOUL0000_00_SE_FM.indd 2 14/10/15 5:26 PM

STATISTICSIntroductory
Exploring The World Through Data
Canadian Edition
Robert Gould Colleen Ryan Jim Stallard Michelle Boué University of California
at Los AngelesCalifornia Lutheran
University
Toronto
University of Calgary
A01_GOUL0000_00_SE_FM.indd 3 14/10/15 5:26 PM

978-0-321-82365-6
Editorial Director: Claudine O’DonnellAcquisitions Editor: David LeGallaisMarketing Manager: Jennifer SuttonProgram Manager: Emily DillProject Manager: Sarah GallagherManager of Content Development: Suzanne SchaanDevelopmental Editor: Suzanne Simpson MillarMedia Editor: Nicole MellowMedia Developer: Kelli CadetProduction Services: Michael B. Kopf, S4Carlisle Publishing Services, Inc.Permissions Project Manager: Kathryn O’HandleyPhoto Permissions Research: Melody EnglishText Permissions Research: Renae HorstmanInterior and Cover Designer: Anthony LeungCover Image: Borut Trdina/Getty Images
Vice-President, Cross Media and Publishing Services: Gary Bennett
Credits and acknowledgments for material borrowed from other sources and reproduced, with permission, in this textbook appear on the appropriate page within the text [or on page xxxi].
SPSS Images Reprint Courtesy of International Business Machines Corporation, © International Business Machines Corporation.
IBM, the IBM logo, ibm.com, and SPSS are trademarks or registered trademarks of International Business Machines Corporation, registered in many jurisdictions worldwide. Other product and service names might be trademarks of IBM or other companies. A current list of IBM trademarks is available on the Web at “IBM Copyright and trademark information” at www.ibm.com/legal/copytrade.shtml
Original edition published by Pearson Education, Inc., Upper Saddle River, New Jersey, USA. Copyright © 2016 Pearson Education, Inc. This edition is authorized for sale only in Canada.
If you purchased this book outside the United States or Canada, you should be aware that it has been imported without the approval of the publisher or the authors.
Copyright © 2017 Pearson Canada Inc. All rights reserved. Manufactured in the United States of America. This publication is protected by copyright and permission should be obtained from the publisher prior to any prohibited reproduction, storage in a retrieval system, or transmission in any form or by any means, electronic, mechanical, photocopying, recording, or likewise. To obtain permission(s) to use material from this work, please submit a written request to Pearson Canada Inc., Permissions Department, 26 Prince Andrew Place, Don Mills, Ontario, M3C 2T8, or fax your request to 416-447-3126, or submit a request to Permissions Requests at www.pearsoncanada.ca.
10 9 8 7 6 5 4 3 2 1
Library and Archives Canada Cataloguing in PublicationGould, Robert, 1965-, author Introductory statistics : exploring the world through data / Robert Gould(University of California at Los Angeles), Colleen Ryan (California LutheranUniversity), Jim Stallard (University of Calgary), Michelle Boué. — Canadian edition.
Includes index.Issued in print and electronic formats.ISBN 978-0-321-82365-6 (bound).—ISBN 978-0-13-416861-6 (loose leaf).—ISBN 978-0-13-415447-3 (pdf).—ISBN 978-0-13-415457-2 (html)
1. Statistics—Textbooks. I. Ryan, Colleen N. (Colleen Nooter), 1939-, author II. Stallard, Jim, 1969-, author III. Boué, Michelle, 1968-, author IV. Title.
QA276.12.G69 2015 519.5 C2015-904826-5 C2015-904827-3
A01_GOUL0000_00_SE_FM.indd 4 14/10/15 5:26 PM
Dedication
To my parents and family, my friends, and my colleagues who are also friends. Without their patience and support, this would not have been possible.
—Rob
To my teachers and students, and to my family who have helped me in many different ways.
—Colleen
v
To my family, parents, my “Edmonton-Fam,” dearest friends, and trusted colleagues. Thank you for your patience and unwavering support.
—Jim
To my mother, for her inspiring example.
—Michelle
A01_GOUL0000_00_SE_FM.indd 5 14/10/15 5:26 PM

Robert L. Gould (Ph.D., University of California, San Diego) is a leader in the statistics education community. He has served as chair of the American Statistical Association’s Committee on Teacher Enhancement, has served as chair of the ASA’s Statistics Edu-cation Section, and served on a panel of co-authors for the Guidelines for Assessment in Instruction on Statistics Education (GAISE) College Report. As the associate director of pro-fessional development for CAUSE (Consortium for the Advancement of Undergraduate Statistics Education), Rob has worked closely with the American Mathematical Associa-tion of Two-Year Colleges (AMATYC) to provide travelling workshops and summer institutes in statistics. For over 10 years, he has served as Vice-Chair of Undergraduate Studies at the UCLA Department of Statistics, and he is Director of the UCLA Center for the Teaching of Statistics. In 2009, Rob was elected president of the Southern California Chapter of the American Statistical Association.
In his free time, Rob plays the cello, runs, and is an ardent reader of fiction.
Colleen N. Ryan has taught statistics, chemistry, and physics to diverse community col-lege students for decades. She taught at Oxnard College from 1975 to 2006, where she earned the Teacher of the Year Award. Colleen currently teaches statistics part-time at California Lutheran University. She often designs her own lab activities. Her passion is to discover new ways to make statistical theory practical, easy to understand, and sometimes even fun.
Colleen earned a B.A. in physics from Wellesley College, an M.A.T. in physics from Harvard University, and an M.A. in chemistry from Wellesley College. Her first exposure to statistics was with Frederick Mosteller at Harvard.
In her spare time, Colleen sings with the Oaks Camerata, has been an avid skier, and enjoys time with her family.
About the Authors
Robert Gould
Colleen Ryan
vi
A01_GOUL0000_00_SE_FM.indd 6 14/10/15 5:26 PM

James B. Stallard has been teaching statistics and probability at the University of Calgary since 1996, where he currently serves as Associate Head, Teaching and Learning of the Department of Mathematics and Statistics. He has served as chair of the Statistical Education Committee of the SSC (Statistical Society of Canada) and as the President of the Statistical Education Section of the SSC. He earned a B.Sc. in statistics and econom-ics from the University of Alberta, and a M.Sc. from the University of Calgary.
In his spare time, Jim likes to spend time with his family, play hockey, and fish the beautiful rivers that carve their way through the foothills of Southwestern Alberta.
Michelle Boué holds M.Sc. and Ph.D. degrees in Applied Mathematics from Brown University. She has over 20 years of experience teaching mathematics and statistics at different colleges and universities in Canada, the United States and Mexico, includ-ing Trent University, St. Francis Xavier University, the University of Massachusetts ( Amherst), Newbury College, and the ITAM (Instituto Tecnológico Autónomo de México). In recent years, she has turned her attention to the promotion of science and mathematics education in elementary and secondary schools. She is currently a presenter for the Scientists in School organization in Ontario.
Michelle Boué
Jim Stallard
ABOUT THE AUTHORS vii
A01_GOUL0000_00_SE_FM.indd 7 14/10/15 5:26 PM

A01_GOUL0000_00_SE_FM.indd 8 14/10/15 5:26 PM

Brief Contents
Introduction to Data 21CHAPTER
Visualizing Data 322CHAPTER
Numerical Summaries of Centre and Variation 763CHAPTER
Regression Analysis: Exploring Relationships Between Variables 130
4CHAPTER
Modelling Variation with Probability 1925CHAPTER
Modelling Random Events: The Normal and Binomial Models 242
6CHAPTER
Survey Sampling and Inference 2987CHAPTER
Hypothesis Testing for Population Proportions 3448CHAPTER
Inferring Population Means 3949CHAPTER
Relationships Between Categorical Variables 46010CHAPTER
Comparing Several Means: One-Way Analysis of Variance 512
11CHAPTER
Design of Experiments and Sampling 55412CHAPTER
Inference Without Normality 58013CHAPTER
Inference for Regression 61014CHAPTER
Preface xv
Index of Applications xxiii
Credits xxxi
Appendix A Tables A-1
Appendix B Answers to Odd-Numbered Exercises A-9
Index 00
ix
A01_GOUL0000_00_SE_FM.indd 9 14/10/15 5:26 PM

A01_GOUL0000_00_SE_FM.indd 10 14/10/15 5:26 PM
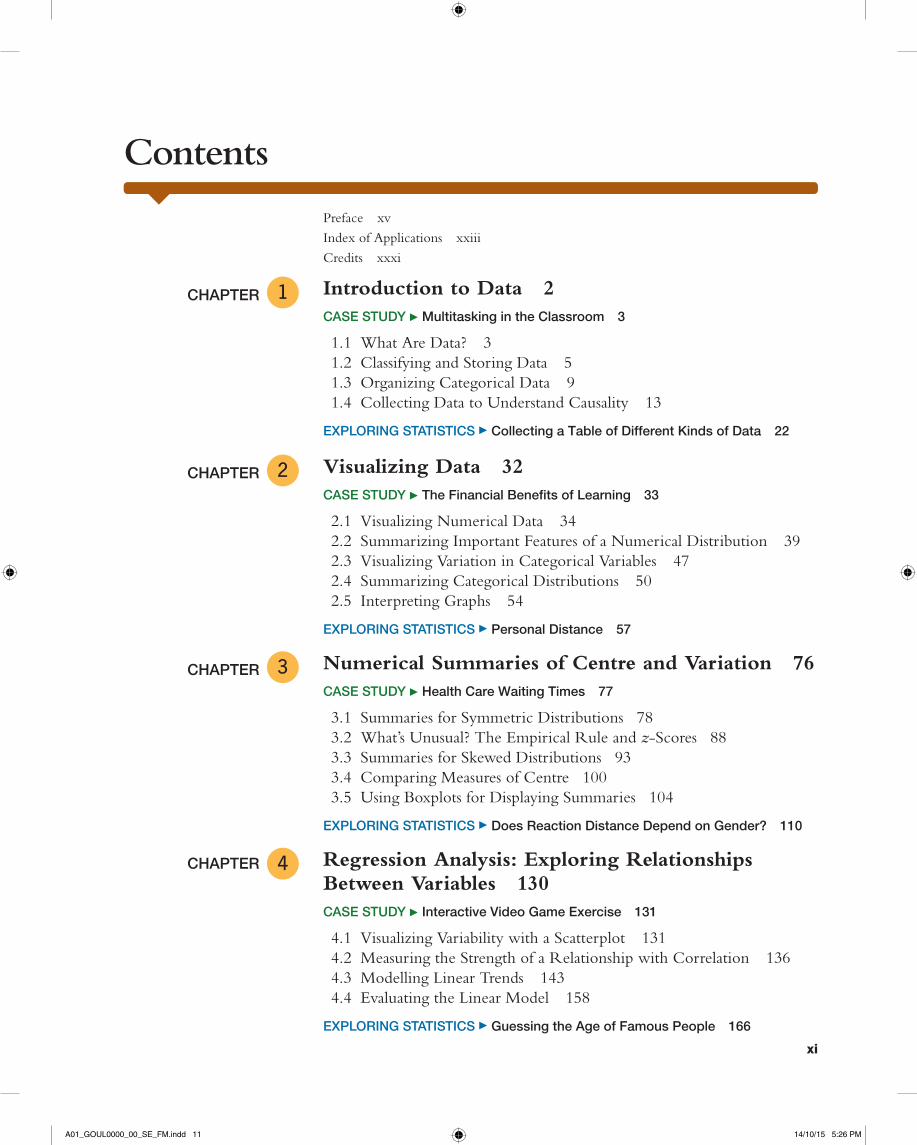
Contents
Introduction to Data 2CASE STUDY Multitasking in the Classroom 3
1.1 What Are Data? 3 1.2 Classifying and Storing Data 5 1.3 Organizing Categorical Data 9 1.4 Collecting Data to Understand Causality 13
EXPLORING STATISTICS Collecting a Table of Different Kinds of Data 22
1CHAPTER
2CHAPTER Visualizing Data 32CASE STUDY The Financial Benefits of Learning 33
2.1 Visualizing Numerical Data 34 2.2 Summarizing Important Features of a Numerical Distribution 39 2.3 Visualizing Variation in Categorical Variables 47 2.4 Summarizing Categorical Distributions 50 2.5 Interpreting Graphs 54
EXPLORING STATISTICS Personal Distance 57
3CHAPTER Numerical Summaries of Centre and Variation 76CASE STUDY Health Care Waiting Times 77
3.1 Summaries for Symmetric Distributions 78 3.2 What’s Unusual? The Empirical Rule and z-Scores 88 3.3 Summaries for Skewed Distributions 93 3.4 Comparing Measures of Centre 100 3.5 Using Boxplots for Displaying Summaries 104
EXPLORING STATISTICS Does Reaction Distance Depend on Gender? 110
4CHAPTER Regression Analysis: Exploring Relationships Between Variables 130CASE STUDY Interactive Video Game Exercise 131
4.1 Visualizing Variability with a Scatterplot 131 4.2 Measuring the Strength of a Relationship with Correlation 136 4.3 Modelling Linear Trends 143 4.4 Evaluating the Linear Model 158
EXPLORING STATISTICS Guessing the Age of Famous People 166
Preface xv
Index of Applications xxiii
Credits xxxi
xi
A01_GOUL0000_00_SE_FM.indd 11 14/10/15 5:26 PM

Modelling Variation with Probability 192CASE STUDY SIDS or Murder? 193
5.1 What Is Randomness? 193 5.2 Finding Probabilities 196 5.3 Relationships Between Categorical Variables 210 5.4 Finding Probabilities with Simulations
EXPLORING STATISTICS Let’s Make a Deal: Stay or Switch? 228
5CHAPTER
6CHAPTER Modelling Random Events: The Normal and Binomial Models 242CASE STUDY Keep an Eye on Your Winning Lottery Ticket 243
6.1 Probability Distributions Are Models of Random Experiments 243 6.2 The Normal Model 249 6.3 The Binomial Model 262
EXPLORING STATISTICS ESP with Coin Flipping 278
7CHAPTER Survey Sampling and Inference 298CASE STUDY Online Polls: Be Careful What You Ask For 299
7.1 Learning About the World Through Surveys 299 7.2 Measuring the Quality of a Survey 306 7.3 The Central Limit Theorem for Sample Proportions 315 7.4 Estimating the Population Proportion
with Confidence Intervals 321 7.5 Margin of Error and Sample Size for Proportions 328
EXPLORING STATISTICS Simple Random Sampling Prevents Bias 330
8CHAPTER Hypothesis Testing for Population Proportions 344CASE STUDY Violence on TV 345
8.1 The Requirements of a Hypothesis Test 345 8.2 Finding p-Values 352 8.3 Hypothesis Testing in Four Steps 356 8.4 Comparing Proportions from Two Populations 364 8.5 Understanding Hypothesis Testing 370
EXPLORING STATISTICS Identifying Flavours of Gum Through Smell 376
xii CONTENTS
A01_GOUL0000_00_SE_FM.indd 12 14/10/15 5:26 PM

Inferring Population Means 394CASE STUDY Epilepsy Drugs and Children 395
9.1 Sample Means of Random Samples 395 9.2 The Central Limit Theorem for Sample Means 400 9.3 Answering Questions About the Mean of a Population 406 9.4 Comparing Two Population Means 420 9.5 Overview of Analyzing Means 431
EXPLORING STATISTICS Pulse Rates 436
9CHAPTER
10CHAPTER Relationships Between Categorical Variables 460CASE STUDY Do Vaccinations Cause Autism in Children? 461
10.1 The Requirements for Testing with Categorical Variables 461 10.2 The Chi-Square Test for Goodness of Fit 471 10.3 Chi-Square Tests for Relationships Between Categorical
Variables 476 10.4 Hypothesis Tests When Sample Sizes Are Small 485
EXPLORING STATISTICS Skittles 491
11CHAPTER Comparing Several Means: One-Way Analysis of Variance 512CASE STUDY Seeing Red 513
11.1 Some General Principles of ANOVA 513 11.2 Understanding the ANOVA Table 520 11.3 The ANOVA Test 527 11.4 Post-Hoc Procedures 531
EXPLORING STATISTICS Recovery Heart Rate 538
12CHAPTER Design of Experiments and Sampling 554CASE STUDY Does Stretching Improve Athletic Performance? 555
12.1 Variation Out of Control 555 12.2 Sampling Techniques 564 12.3 Reading Research Papers
EXPLORING STATISTICS Reporting on Research Abstracts 571
13CHAPTER Inference Without Normality 580CASE STUDY How Arctic Foxes Find the Right Home 581
13.1 The Sign Test for Paired Data 581 13.2 Mann-Whitney Test for Two Independent Groups 585
CONTENTS xiii
A01_GOUL0000_00_SE_FM.indd 13 14/10/15 5:26 PM

14CHAPTER Inference for Regression 610CASE STUDY Identifying Ballot Flaws in an Important Election 611
14.1 The Linear Regression Model 611 14.2 Using the Linear Model 621 14.3 Predicting Values and Estimating Means 631
EXPLORING STATISTICS Older and Slower? 641
Appendix A Tables A-1
Appendix B Answers to Odd-Numbered Exercises A-9
Index 00
13.3 Kruskal-Wallis Test for Comparing Several Groups 590 13.4 Randomization Tests 13.5 Transforming Data
EXPLORING STATISTICS Balancing on One Foot 595
xiv CONTENTS
A01_GOUL0000_00_SE_FM.indd 14 14/10/15 5:26 PM

Preface
About This BookThe primary focus of this text is data. We live in a data-driven economy and, more and more, in a data-centred culture. We don’t choose whether we interact with data; the choice is made for us by websites that track our browsing patterns, membership cards that trace our spending habits, cars that register our driving patterns, and smartphones that record our most personal moments.
The silver lining of what some have called the Data Deluge is that we all have access to rich and valuable data relevant in many important fields: environment, civics, social sciences, economics, health care, and entertainment. This text teaches students to learn from such data and, we hope, to become cognizant of the role of the data that appear all around them. We want students to develop a data habit of mind in which, when faced with decisions, claims, or just plain curiosity, they know to reach for an appropriate data set to answer their questions. More importantly, our goal is for students to have the abil-ity to process and objectively, as well as critically, analyze such data using the statistical tools they will acquire from their study of this text. Clearly, we’ve come a long way from the “mean median mode” days of rote calculation. The modern economy requires much more than knowing how to plug numbers into a formula. Today’s students must know which questions can be answered by applying which statistic and how to use technology to compute such statistics from within complex data sets.
What’s New in the Canadian EditionThe Canadian Edition remains true to the goals of the U.S. text: to provide students with the tools they need to make sense of the world by teaching them to collect, visualize, analyze, and interpret data. However, we have introduced a substantial number of changes that will enable us to better achieve this vision inside the Canadian classroom:
• Canadian and global data of interest to Canadian students have been incorporated throughout the text to demonstrate practical and relevant applications. The new, updated, or revised material includes over 400 exercises, nearly 100 chapter examples, and 11 completely new case studies. New content can be found involv-ing climate change, health care, languages, Aboriginal issues, multiculturalism, sports, vaccinations, and lottery scandals, to name but a few.
• A list of Learning Objectives appears on the introductory page of each chapter. The Learning Objectives are revisited at the end of the chapter, with specific questions answered in the Chapter Summary. This new learning tool reflects the current emphasis on learning objectives and gives the student a quick way of reviewing the key concepts of the chapter.
• Chapter 5 has been substantially revised, with more examples covering conditional probability.
• Chapter 11 has been restructured and expanded, with a new section discussing the calculations required to complete an ANOVA table.
• A new section dedicated to the Kruskal-Wallis test has been added to the non-parametric tests of Chapter 13.
• Material on special topics from several chapters has been moved to MyStatLab so as to make room for new content. All online sections are indicated by an online icon , in the book’s table of contents.
xv
A01_GOUL0000_00_SE_FM.indd 15 14/10/15 5:26 PM

• IBM SPSS Statistics software (“SPSS”)* has been added to the list of calculation tools covered by the text. The steps for performing calculations using SPSS have been added to the end of each chapter when appropriate, and some examples within the text discuss the analysis of SPSS output.
• Snapshot boxes break down key statistical concepts, quickly summarizing each concept or procedure. In this edition we have explicitly included a “When is it used?” summary in each Snapshot.
• The SI metric system of units is used throughout the text.
ApproachOur text is concept-based, as opposed to method-based. We do teach useful statistical methods, but we emphasize that applying the method is secondary to understanding the concept.
In the real world, computers do most of the heavy lifting for statisticians. We there-fore adopt an approach that frees the instructor from having to teach tedious procedures and leaves more time for teaching a deeper understanding of concepts. Accordingly, we present formulas as an aid to understanding the concepts rather than as the focus of study.
We believe students need to learn how to
• determine which statistical procedures are appropriate,
• instruct the software to carry out the procedures, and
• interpret the output.
We understand that students will probably see only one type of statistical software in class. But we believe it is useful for students to compare output from several different sources, so in some examples we ask them to read output from two or more software packages.
One of the authors (Rob Gould) served on a panel of co-authors for the collegiate version of the Guidelines and Instruction in Statistics Education (GAISE). One of the Canadian authors (Jim Stallard) has served as both chair and president of various statistical education branches of the Statistical Society of Canada. In the preparation of this book, we have adopted up-to-date approaches to teaching and learning statistics endorsed by the American Statistical Association and the Statistical Society of Canada.
• We emphasize understanding over rote performance of procedures.
• We use real data whenever possible.
• We encourage the use of technology both to develop conceptual understanding and to analyze data.
• We believe strongly that students learn by doing. For this reason, the homework problems offer students both practice in basic procedures and challenges to build conceptual understanding.
CoverageThe first two-thirds of this book are concept-driven and cover exploratory data analysis and inferential statistics—fundamental concepts that every introductory statistics student should learn. The final third of the book builds on that strong conceptual foundation and is more methods-based. It presents several popular statistical methods and more fully explores methods presented earlier, such as regression and data collection.
Our ordering of topics is guided by the Cycle of Data.
Chapters 1–4: Exploratory Data Analysis. The first four chapters cover data collection and summary. Chapter 1 introduces the important topic of data collection and compares
xvi PREFACE
*SPSS Inc. was acquired by IBM in October, 2009.
A01_GOUL0000_00_SE_FM.indd 16 14/10/15 5:26 PM
and contrasts observational studies with controlled experiments. This chapter also teaches students how to handle raw data so that the data can be uploaded to their statistical soft-ware. Chapters 2 and 3 discuss graphical and numerical summaries of single variables based on samples. We emphasize that the purpose is not just to produce a graph or a number but, instead, to explain what those graphs and numbers say about the world. Chapter 4 introduces simple linear regression and presents it as a technique for providing graphical and numerical summaries of relationships between two numerical variables.
We feel strongly that introducing regression early in the text is beneficial in building student understanding of the applicability of statistics to real-world scenarios. After com-pleting the chapters covering data collection and summary, students have acquired the skills and sophistication they need to describe two-variable relationships and to generate informal hypotheses. Two-variable relationships provide a rich context for class discussion and allow the course to move from fabricated problems (because one-variable analyses are relatively rare in the real world) to real problems that appear frequently in everyday life. We return to regression in Chapter 14, when we discuss statistical inference in the context of regression, which requires quite a bit of machinery. We feel that it would be a shame to delay until the end of the course all the insights that regression without infer-ence can provide.
Chapters 5–8: Inference. These chapters teach the fundamental concepts of statistical in-ference. The main idea is that our data mirror the real world, but imperfectly; although our estimates are uncertain, under the right conditions we can quantify our uncertainty. Verifying that these conditions exist and understanding what happens if they are not satis-fied are important themes of these chapters.
Chapters 9–11: Methods. Here we return to the themes covered earlier in the text and present them in a new context by introducing additional statistical methods, such as esti-mating population means, analyzing categorical variables, and analyzing relations between a numerical and a categorical variable. We also introduce ANOVA as a technique for comparing means of several populations.
Chapters 12–14: Special Topics. Students who have covered all topics up to this point will have a solid foundation in statistics. These final chapters build on that foundation and offer more details, as we explore the topics of designing controlled experiments, survey sampling, additional contexts for hypothesis testing, and using regression to make infer-ences about a population.
In Chapter 12 we provide guidance for reading scientific literature. Even if your sched-ule does not allow you to cover Chapter 12, we recommend using online Section 12.3 to offer students the experience of critically examining real scientific papers.
OrganizationOur preferred order of progressing through the text is reflected in the Contents, but there are some alternative pathways as well.
12- to 14-Week Semester. The first 10 chapters would provide a full, one-semester course in introductory statistics. If time remains, cover Chapter 11 as well, so that students can solidify their understanding of confidence intervals and hypothesis tests by revisiting the topics with several groups.
Proportions First. Ask two statisticians, and you will get three opinions on whether it is best to teach means or proportions first. We have come down on the side of proportions for a variety of reasons. Proportions are much easier to find in popular news media (par-ticularly around election time), so they can be more readily tied to students’ everyday lives. Also, the mathematics and statistical theory is simpler; because there’s no need to provide a separate estimate for the population standard deviation, inference is based on the Nor-mal distribution, and no further approximations (that is, the t-distribution) are required. Hence, we can quickly get to the heart of the matter with fewer technical diversions.
PREFACE xvii
A01_GOUL0000_00_SE_FM.indd 17 14/10/15 5:26 PM
The basic problem here is how to quantify the uncertainty involved in estimating a parameter and how to quantify the probability of making incorrect decisions when pos-ing hypotheses. We cover these ideas in detail in the context of proportions. Students can then more easily learn how these same concepts are applied in the new context of means (and any other parameter they may need to estimate).
Means First. Conversely, many people feel that there is time for only one parameter and that this parameter should be the mean. For this alternative presentation, cover Chapters 6, 7, and 9, in that order. On this path, students learn about survey sampling and the termi-nology of inference (population vs. sample, parameter vs. statistic) and then tackle inference for the mean, including hypothesis testing.
To minimize the coverage of proportions, you might choose to cover Chapter 6, Section 7.1 (which covers in detail the language and framework of statistical inference), and then Chapter 9. Chapters 7 and 8 develop the concepts of statistical inference more slowly than in Chapter 9, but essentially, Chapter 9 develops the same ideas in the context of the mean.
If you present Chapter 9 before Chapters 7 and 8, we recommend that you devote roughly twice as much time to Chapter 9 as you have devoted to previous chapters, be-cause many challenging ideas are explored in this chapter. If you have already covered Chapters 7 and 8 thoroughly, Chapter 9 can be covered more quickly.
FeaturesWe’ve incorporated into this book a variety of features to aid student learning and to facilitate the use of this text in any classroom.
Integrating TechnologyModern statistics is inseparable from technology. We have worked to make this textbook accessible for any classroom, regardless of the level of in-class exposure to technology, while still remaining true to the demands of the analysis. We know that students some-times do not have access to technology when doing homework, so many exercises pro-vide output from software and ask students to interpret and critically evaluate that given output.
Using technology is important because it enables students to handle real data, and real data sets are often large and messy. The following features are designed to guide students.
• Tech Tips outline steps for performing calculations using TI-83/84 graphing calcu-lators, Excel, Minitab, StatCrunch, and SPSS. We do not want students to get stuck because they don’t know how to reproduce the results we show in the book, so whenever a new method or procedure is introduced, an icon, , refers students to the TechTips section at the end of the chapter. Each set of TechTips contains at least one mini-example, so that students are not only learning to use the technology but also practising data analysis and reinforcing ideas discussed in the text.
MyStatLab, which accompanies this text, includes some sections on special topics, as well as all data sets needed for examples and exercises.
Guiding Students • After a short introduction and a list of Learning Objectives, each chapter begins by pos-
ing a real-world Case Study. At the end of the chapter, we show how techniques covered in the chapter helped solve the problem presented in the Case Study.
• Margin Notes draw attention to details that enhance student learning and reading comprehension.
Caution notes provide warnings about common mistakes or misconceptions.
Looking Back reminders refer students to earlier coverage of a topic.
Details clarify or expand on a concept.
xviii PREFACE
A01_GOUL0000_00_SE_FM.indd 18 14/10/15 5:26 PM

• Key Points highlight essential concepts to draw special attention to them. Understanding these concepts is essential for progress.
• Snapshots break down key statistical concepts introduced in the chapter, quickly summarizing each concept or procedure and indicating when and how it should be used.
• An abundance of worked-out examples model solutions to real-world problems relevant to students’ lives. Each example is tied to an end-of-chapter exercise so that students can practise solving a similar problem and test their understanding. Within the exercise sets, the icon TRY indicates which problems are tied to worked-out examples in that chapter, and the numbers of those examples are indicated.
• A Chapter Review concludes each chapter. In it students can find a list of impor-tant new terms, a series of specific questions and answers related to the chapter’s Learning Objectives (including all important formulas), and sources for data, arti-cles, and graphics referred to in the chapter.
Active Learning • For each chapter we’ve included an activity, Exploring Statistics, that students
are intended to do in class as a group. We have used these activities ourselves, and we have found that they greatly increase student understanding and keep stu-dents engaged in class. Detailed instructions are available for instructors in the Instructor’s Edition of the text.
• All exercises are located at the end of the chapter. Section Exercises are designed to begin with a few basic problems that strengthen recall and assess basic knowl-edge, followed by mid-level exercises that ask more complex, open-ended ques-tions. Chapter Review Exercises provide a comprehensive review of material covered throughout the chapter.
The exercises emphasize good statistical practice by requiring students to verify conditions, make suitable use of graphics, find numerical values, and interpret their findings in writing. Most exercises are paired so that students can check their work on the odd-numbered exercise and then tackle the corresponding even-numbered exercise.
Challenging exercises, identified with an asterisk (*), ask open-ended questions and sometimes require students to perform a complete statistical analysis. For exer-cises marked with a , accompanying data sets are available online at MyStatLab. The answers to all odd-numbered exercises appear in the back of the book. All solu-tions have been thoroughly revised and updated by Jim Stallard and Michelle Boué for this edition.
• Most chapters include select exercises, marked with a within the exercise set, to indicate that problem-solving help is available in the Guided Exercises section. If students need support while doing homework they can turn to the Guided Exercises to see a step-by-step approach to solving the problem.
PREFACE xix
A01_GOUL0000_00_SE_FM.indd 19 14/10/15 5:26 PM

The Canadian authors are deeply thankful for the guidance and support of all at Pearson Canada through the writing and production process. Specifically, we would like to thank Cathleen Sullivan for giving us a chance to develop the Canadian edition of this book; to both Laura Armstrong and David Le Gallais for their leadership and guidance through the various publishing processes. Extended thanks also to our Editorial Director, Claudine O’Donnell, and our Project Manager, Sarah Gallagher, for keeping the ship steady and on course. Special thanks to Suzanne Simpson Millar, our Developmental Editor, for keeping us to task and providing the odd shove. Finally, a thank you to Michael Kopf for his guidance and patience.
We would also like to extend our sincere thanks for the suggestions and contribu-tions made by the following reviewers:
Acknowledgments
Fouzia Baki, McMaster UniversityGuy Davis, Lakehead UniversityDavid Desjardins, John Abbott CollegeAlireza Fotouhi, University of the Fraser ValleyParamjit Gill, University of British Columbia OkanaganTaras Gula, George Brown CollegeDorothy Levay, Brock UniversityDavid Medd, Centennial CollegeMargaret-Ellen Messinger, Mount Allison UniversityDot Miners, Brock University
Wendi Morrison, Sheridan CollegeBruce Newbold, McMaster UniversityJianan Peng, Acadia UniversityCarl James Schwarz, Simon Fraser UniversityConnie Stewart, University of New BrunswickTim Swartz, Simon Fraser UniversityXu Wang, St. Francis Xavier UniversitySharon Wong, Ryerson UniversityPaul Wraight, Durham College
xx
A01_GOUL0000_00_SE_FM.indd 20 14/10/15 5:26 PM
Student ResourcesCompanion Website for this text can be accessed at www .pearsoncanada.ca/canadianstats. From there, you can down-load the Student Solutions Manual and Data Sets for use with this text.
Student Solutions Manual provides detailed, worked-out solutions to all odd-numbered text exercises. These down-loadable PDF files are available at the textbook’s Companion Website and on MyStatLab.
Data Sets, used in the textbook, have been provided in various formats for use in different applications, including Excel, Minitab, SPSS, and more. These can be accessed at the textbook’s Companion Website and MyStatLab.
Study Cards for Statistics Software This series of study cards, available for Excel, Minitab, JMP, SPSS, R, StatCrunch, and the TI-83/84 graphing calculators, provides students with easy, step-by-step guides to the most common statistics software. These will be available free of charge through MyStatLab. You can also visit www.myPearsonStore.com for more information.
Instructor ResourcesInstructor’s Solutions Manual contains worked-out solutions to all the text exercises.
Online Test Bank (download only), by Mike Kowalski, University of Alberta, includes three sets of tests for each chapter. The Test Bank is available for download at http://catalogue.pearsoned.ca.
Instructor Podcasts are brief audio podcasts from author Robert Gould that focus on the key points of each chapter, helping both new and experienced instructors prepare for class. Available in MyStatLab or at http://catalogue .pearsoned.ca (ISBN-13: 978-0-321-82423-3; ISBN-10: 0-321-82423-7).
PowerPoint® Lecture Slides, by author Michelle Boué, provide an outline to use in a lecture setting, presenting definitions, figures, Guided Exercises, Case Studies, and Snapshots from the text. These slides are available within MyStatLab or at http://catalogue.pearsoned.ca.
Learning Catalytics is a web-based platform for managing the interactive classroom. Learning Catalytics will gener-ate classroom discussion and promote peer-to-peer learn-ing with real-time analytics and can be accessed through MyStatLab.
MyStatLab™ Online Course (access code required)MyStatLab is a course management system that delivers proven results in helping individual students succeed.
• MyStatLab can be successfully implemented in any environment—lab-based, hybrid, fully online, traditional—and demonstrates the quantifiable differ-ence that integrated usage has on student retention, subsequent success, and overall achievement.
• MyStatLab’s comprehensive online gradebook auto-matically tracks students’ results on tests, quizzes, homework, and in the study plan. Instructors can use the gradebook to provide positive feedback or inter-vene if students have trouble. Gradebook data can be easily exported to a variety of spreadsheet programs, such as Microsoft Excel.
MyStatLab provides engaging experiences that personal-ize, stimulate, and measure learning for each student.
• Tutorial Exercises with Multimedia Learning Aids: The homework and practice exercises in MyStatLab align with the exercises in the textbook, and they regenerate algorithmically to give students unlimited opportunity for practice and mastery. Exercises offer immediate helpful feedback, guided solutions, sample problems, animations, videos, and eText clips for extra help at point-of-use.
• Getting Ready for Statistics: A library of questions now appears within each MyStatLab course to offer the developmental math topics students need for the course. These can be assigned as a prerequisite to other assignments, if desired.
– Data sets from the book are provided in multiple formats.
– Technology Tutorial Videos. These brief video clips walk students through common statistical procedures for Minitab, Excel, and the TI-83/84 graphing calculator.
• Conceptual Question Library: In addition to algo-rithmically regenerated questions that are aligned with your textbook, there is a library of 1000 Conceptual Questions available in the assessment manager that require students to apply their statistical understanding.
• StatCrunch: MyStatLab includes a web-based statisti-cal software, StatCrunch, within the online assessment platform so that students can easily analyze data sets
xxi
Supplements
A01_GOUL0000_00_SE_FM.indd 21 14/10/15 5:26 PM

xxii SUPPLEMENTS
from exercises and the text. In addition, MyStatLab includes access to www.StatCrunch.com, a website where users can access more than 13,000 shared data sets, conduct online surveys, perform complex analyses using the powerful statistical software, and generate compelling reports.
• Integration of Statistical Software: Knowing that students often use external statistical software, we make it easy to copy our data sets, both from the ebook and the MyStatLab questions, into software such as StatCrunch, Minitab, Excel, and more. Students have access to a variety of support tools—Technology Instruction Videos, Technology Study Cards, and Manuals for select titles—to learn how to effectively use statistical software.
And, MyStatLab comes from a trusted partner with educa-tional expertise and an eye on the future.
Knowing that you are using a Pearson product means knowing that you are using quality content. That means that our eTexts are accurate, that our assessment tools work, and that our questions are error-free. And whether you are just getting started with MyStatLab, or have a question along the way, we’re here to help you learn about our technologies and how to incorporate them into your course.
To learn more about how MyStatLab combines proven learning applications with powerful assessment, visit www.mystatlab.com or contact your Pearson representative.
for Statistics Online Course (access code required)MathXL is the homework and assessment engine that runs MyStatLab. (MyStatLab is MathXL plus a learning management system.) With MathXL for Statistics, in-structors can:
• Create, edit, and assign online homework and tests using algorithmically generated exercises correlated at the objective level to the textbook.
• Create and assign their own online exercises and import TestGen tests for added flexibility.
• Maintain records of all student work, tracked in MathXL’s online gradebook.
With MathXL for Statistics, students can:
• Take chapter tests in MathXL and receive personalized study plans and/or personalized homework assignments based on their test results.
• Use the study plan and/or the homework to link directly to tutorial exercises for the objectives they need to study.
• Access supplemental animations and video clips directly from selected exercises.
• Copy our data sets, both from the ebook and the MyStatLab questions, into software like StatCrunch, Minitab, Excel, SPSS, and more.
MathXL for Statistics is available to qualified adopters. For more information, visit www.mathxl.com, or contact your Pearson representative.
Powerful web-based statistical software that allows users to perform complex analyses, share data sets, and generate compelling reports of their data. The vibrant online com-munity offers more than 13,000 data sets for students to analyze.
• Collect. Users can upload their own data to StatCrunch or search a large library of publicly shared data sets, spanning almost any topic of interest. Also, an online survey tool allows users to quickly collect data via web-based surveys.
• Crunch. A full range of numerical and graphical methods allows users to analyze and gain insights from any data set. Interactive graphics help users understand statistical concepts, and are available for export to enrich reports with visual representations of data.
• Communicate. Reporting options help users create a wide variety of visually appealing representations of their data.
Full access to StatCrunch is available with a MyStatLab kit, and StatCrunch is available by itself to qualified adopters. For more information, visit www.statcrunch.com or contact your Pearson representative.
TestGen (www.pearsoned.com/testgen) Enables instructors to build, edit, print, and administer tests using a computerized bank of questions developed to cover all the student learning objectives of the text. TestGen is algorithmically based, and instructors can create multiple but equivalent versions of the same question or test with the click of a button. Instructors can also modify Test Bank questions or add new questions. The software and Test Bank are available for download from Pearson Education’s online catalogue.
A01_GOUL0000_00_SE_FM.indd 22 14/10/15 5:26 PM