introduction to x-ray absorption spectroscopy -...
TRANSCRIPT
1
© 2007 UOP LLC. All rights reserved.
Introduction to X-ray Absorption Spectroscopy
Introduction to X-ray Absorption Spectroscopy
Simon R. Bare([email protected])
2007 APS XAFS Summer School
Simon R. Bare([email protected])
2007 APS XAFS Summer School
July 23, 2007
2
Introduction
2
3
Acronyms
EXAFS – Extended X-ray Absorption Fine Structure
XAS – X-ray Absorption Spectroscopy
XAFS – X-ray Absorption Fine Structure
XANES - X-ray Absorption Near Edge Structure
NEXAFS- Near-Edge X-ray Absorption Fine Structure
4
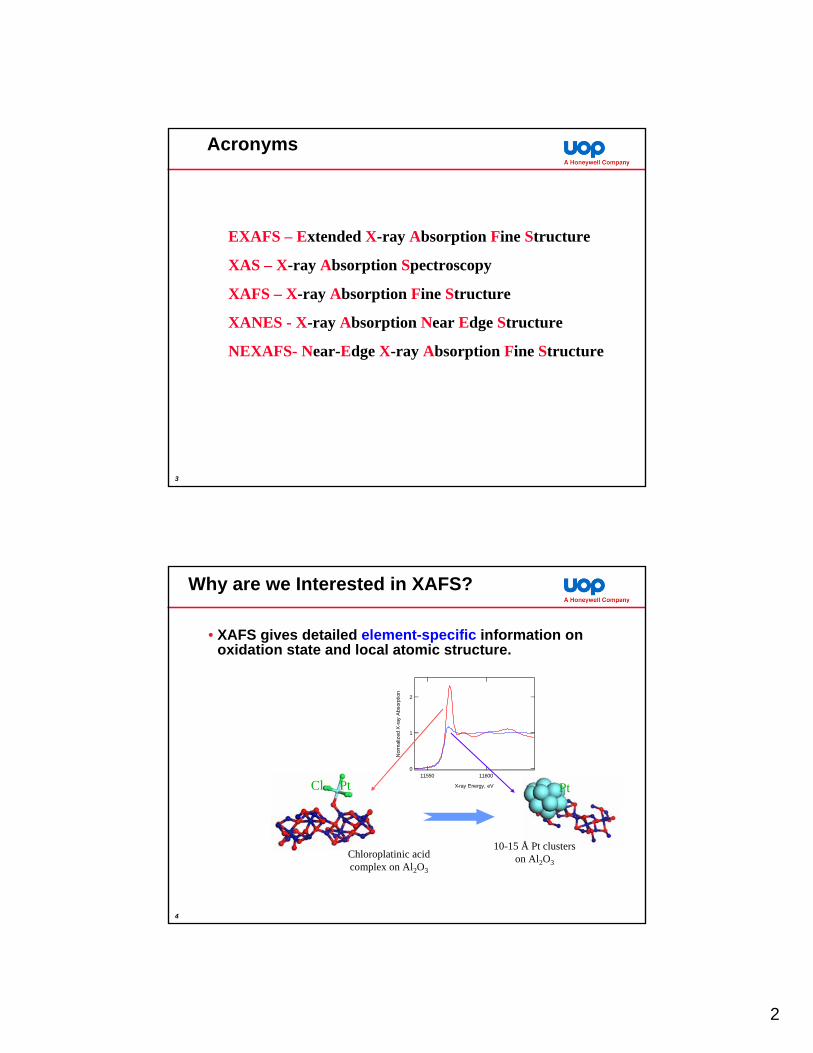
Why are we Interested in XAFS?
• XAFS gives detailed element-specific information on oxidation state and local atomic structure.
PtCl Pt
2
1
0
Nor
mal
ized
X-ra
y A
bsor
ptio
n
1160011550
X-ray Energy, eV
Chloroplatinic acid complex on Al2O3
10-15 Å Pt clusters on Al2O3
3
5
XANESEXAFS
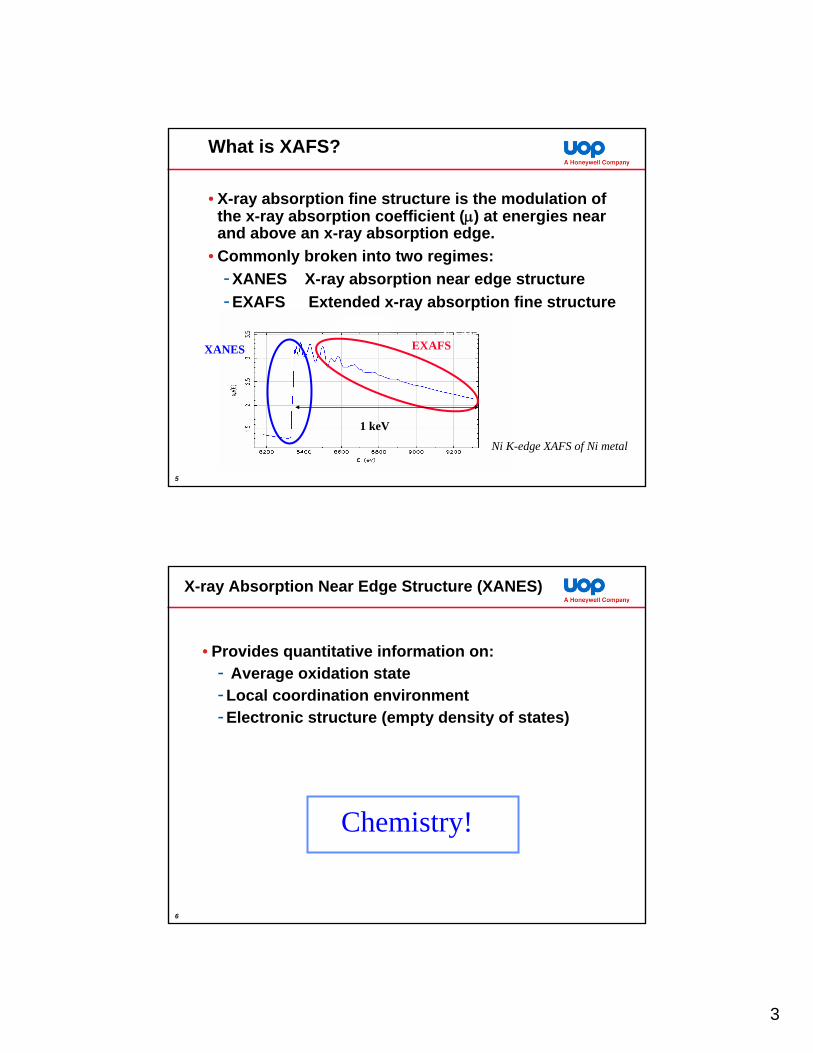
What is XAFS?
• X-ray absorption fine structure is the modulation of the x-ray absorption coefficient (μ) at energies near and above an x-ray absorption edge.
• Commonly broken into two regimes:-XANES X-ray absorption near edge structure-EXAFS Extended x-ray absorption fine structure
Ni K-edge XAFS of Ni metal
1 keV
EXAFS
6
X-ray Absorption Near Edge Structure (XANES)
• Provides quantitative information on:- Average oxidation state-Local coordination environment-Electronic structure (empty density of states)
Chemistry!
4
7
Ba2TiO4
K2TiSi3O9
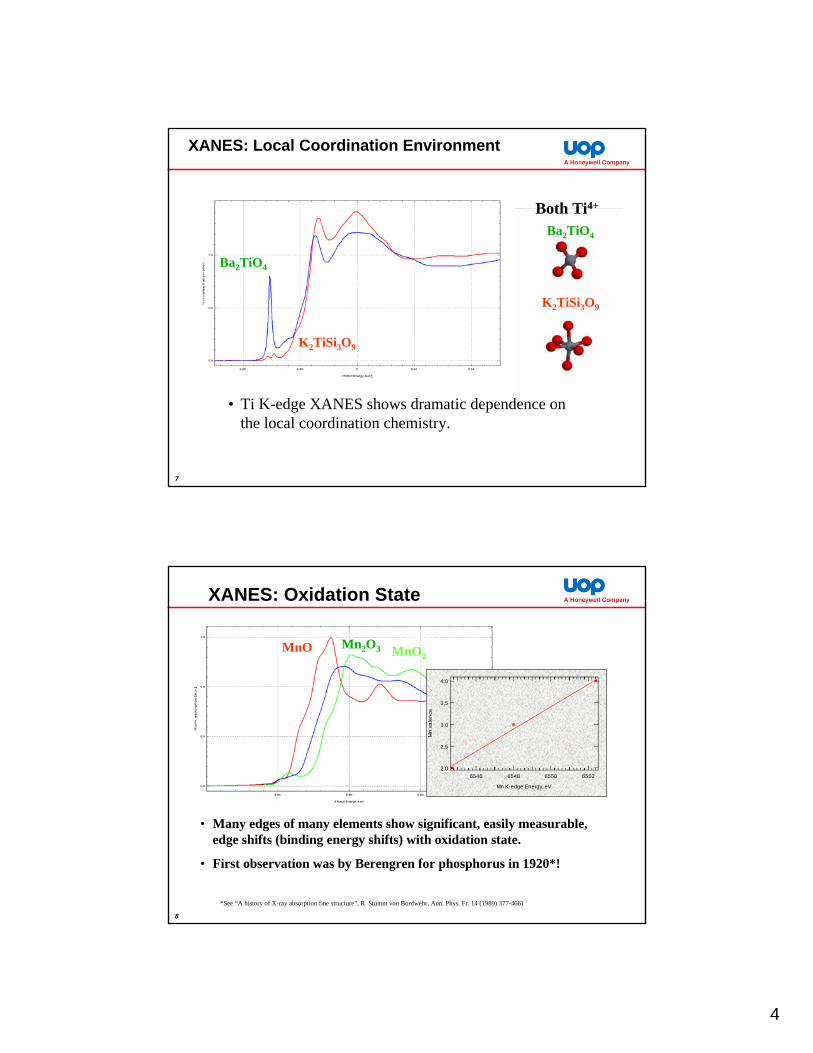
XANES: Local Coordination Environment
Both Ti4+
Ba2TiO4
K2TiSi3O9
• Ti K-edge XANES shows dramatic dependence on the local coordination chemistry.
8
XANES: Oxidation State
MnO Mn2O3 MnO2
4.0
3.5
3.0
2.5
2.0
Mn
vale
nce
6552655065486546
Mn K-edge Energy, eV
• Many edges of many elements show significant, easily measurable,edge shifts (binding energy shifts) with oxidation state.
• First observation was by Berengren for phosphorus in 1920*!
*See “A history of X-ray absorption fine structure”, R. Stumm von Bordwehr, Ann. Phys. Fr. 14 (1989) 377-466)
5
9
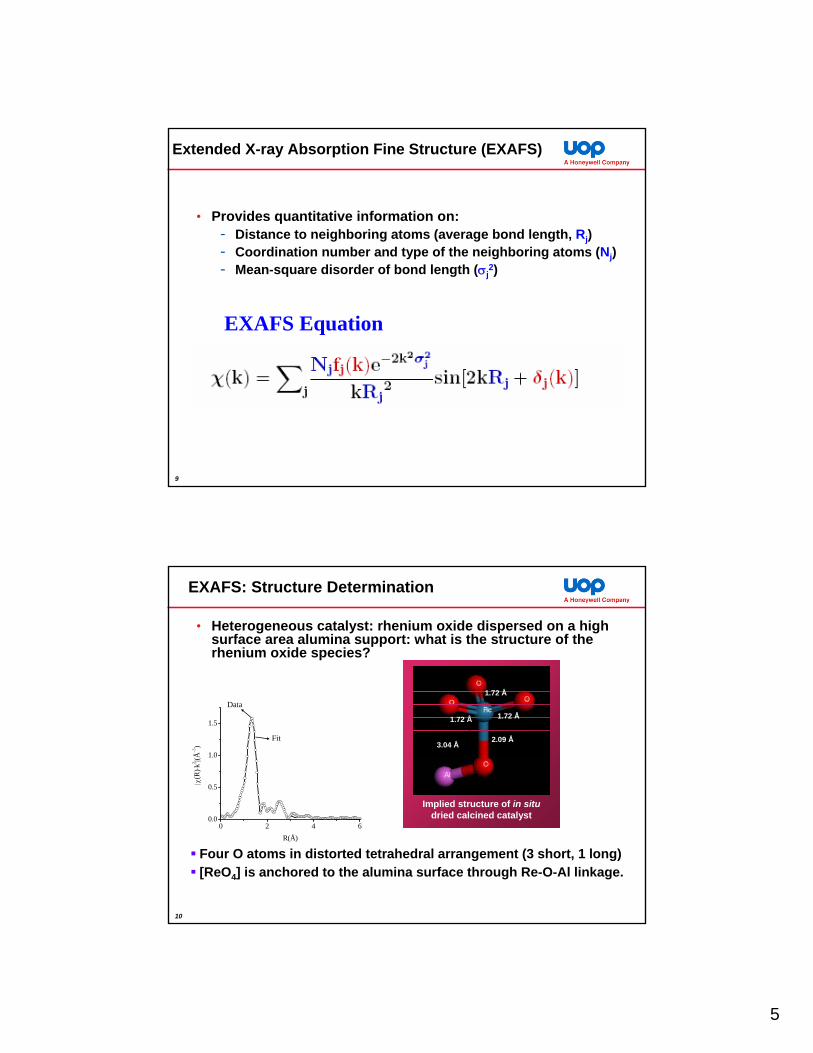
• Provides quantitative information on:- Distance to neighboring atoms (average bond length, Rj)- Coordination number and type of the neighboring atoms (Nj)- Mean-square disorder of bond length (σj
2)
Extended X-ray Absorption Fine Structure (EXAFS)
EXAFS Equation
10
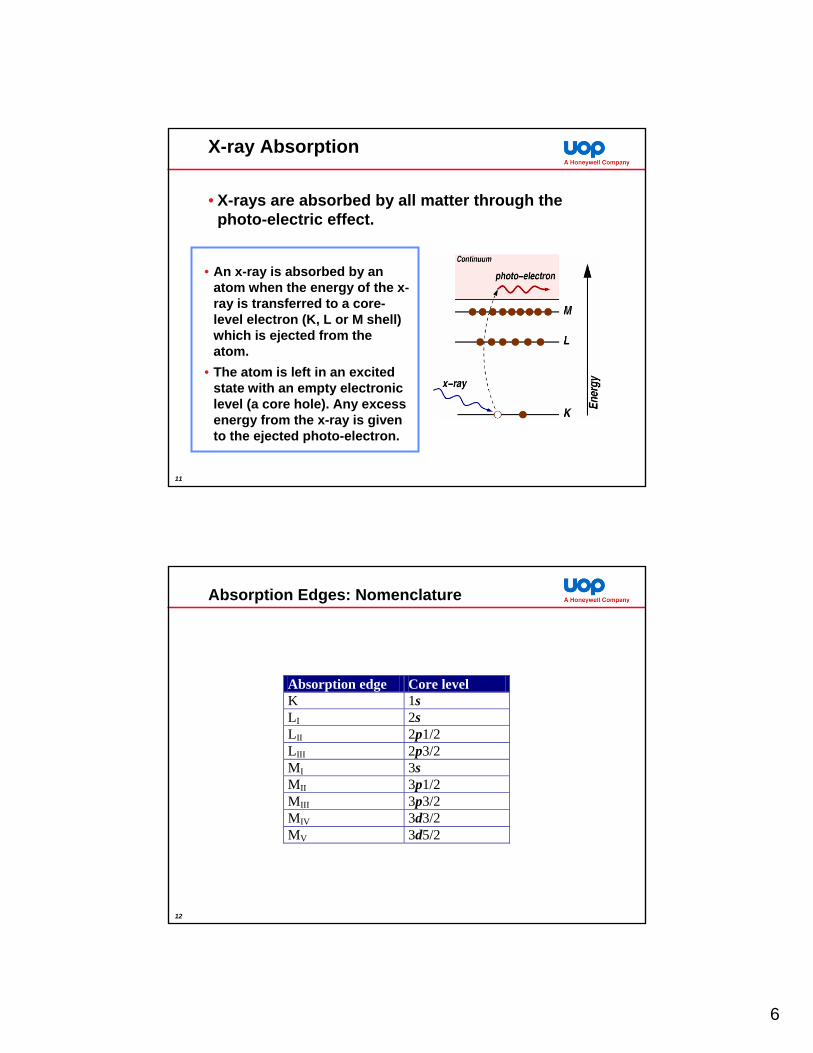
Four O atoms in distorted tetrahedral arrangement (3 short, 1 long)[ReO4] is anchored to the alumina surface through Re-O-Al linkage.
EXAFS: Structure Determination
0 2 4 60.0
0.5
1.0
1.5
|χ(R
)⋅k2 |(Å
−3)
R(Å)
B
Fit
Data
Implied structure of in situdried calcined catalyst
1.72 Å
1.72 Å
1.72 Å
2.09 Å3.04 Å
Implied structure of in situdried calcined catalyst
1.72 Å
1.72 Å
1.72 Å
2.09 Å3.04 Å
• Heterogeneous catalyst: rhenium oxide dispersed on a high surface area alumina support: what is the structure of the rhenium oxide species?
6
11
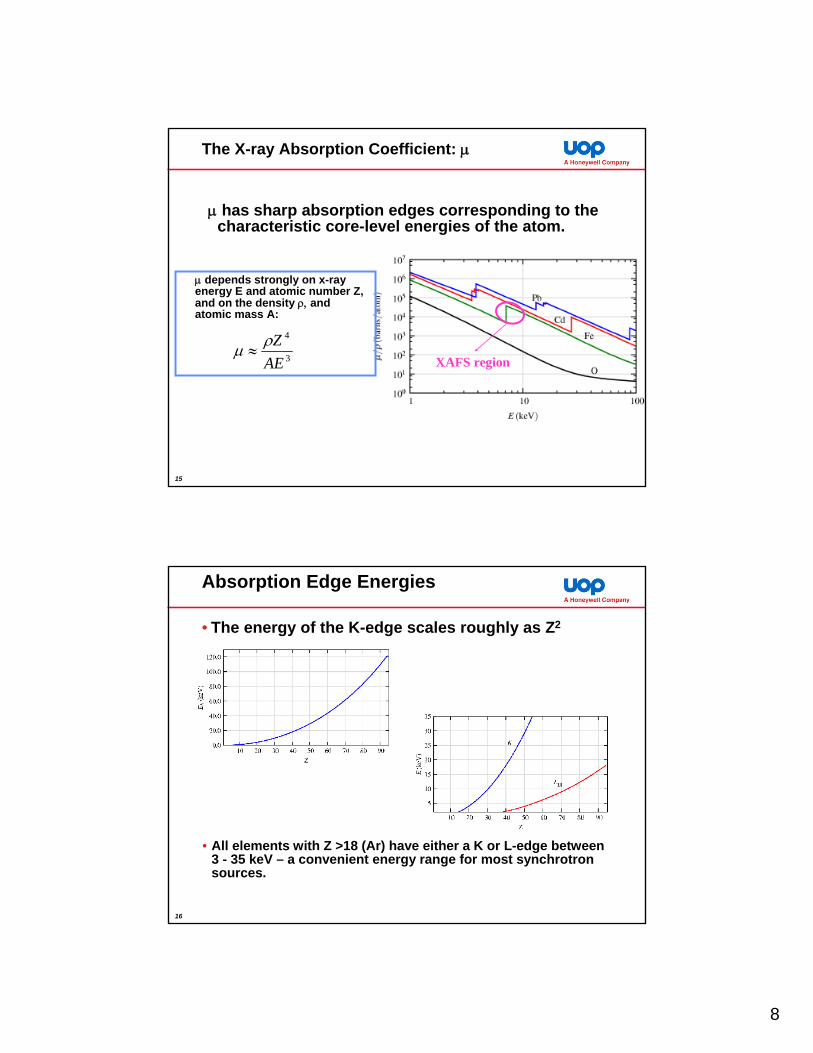
X-ray Absorption
• X-rays are absorbed by all matter through the photo-electric effect.
• An x-ray is absorbed by an atom when the energy of the x-ray is transferred to a core-level electron (K, L or M shell) which is ejected from the atom.
• The atom is left in an excited state with an empty electronic level (a core hole). Any excess energy from the x-ray is given to the ejected photo-electron.
12
Absorption Edges: Nomenclature
Absorption edge Core level K 1s LI 2s LII 2p1/2
LIII 2p3/2 MI 3s MII 3p1/2
MIII 3p3/2 MIV 3d3/2 MV 3d5/2

7
13
X-ray Fluorescence
• When x-rays are absorbed via photo-electric effect, the excited core-hole will relax back to a ground state of the atom. A higher level core electron drops into core hole and a fluorescent x-ray (or Auger electron) is emitted.
X-ray Fluorescence: An x-ray with energy equal to the difference in core-levels is emitted.
XRF occurs at discrete energies that are characteristic of the absorbing atom, and can be used to identify the absorbing atom.
14
The X-ray Absorption Coefficient: μ
• Intensity of x-ray beam passing through a material of thickness x is given by the absorption coefficient μ:
It = I0e-μx
x
I0 It
Where I0 is the x-ray intensity impinging on the material and It is the intensity transmitted through the material.
8
15
The X-ray Absorption Coefficient: μ
μ has sharp absorption edges corresponding to the characteristic core-level energies of the atom.
3
4
AEZρμ ≈
μ depends strongly on x-ray energy E and atomic number Z, and on the density ρ, and atomic mass A:
XAFS region
16
Absorption Edge Energies
• The energy of the K-edge scales roughly as Z2
• All elements with Z >18 (Ar) have either a K or L-edge between 3 - 35 keV – a convenient energy range for most synchrotron sources.

9
17
17
**
*
RgDsMtHsBhSgDbRfLrRaFr
RnAtPoBiPbTlHgAuPtIrOsReWTaHfLuBaCs
XeITeSbSnInCdAgPdRhRuTcMoNbZrYSrRb
KrBrSeAsGeGaZnCuNiCoFeMnCrVTiScCaK
ArClSPSiAlMgNa
NeFONCBBeLi
HeH
**
*
NoMdFmEsCfBkCmAmPuNpUPaThAc
YbTmErHoDyTbGdEuSmPmNdPrCeLa
XAS Accessible ElementsK-edge EXAFS
L3-edge EXAFS
L3/K-edge EXAFS
All elements with Z>18 (Ar) have a K or L-edge in the range 3-35 keV
18
X-ray Absorption Spectroscopy• XAS measures the energy dependence of the x-ray absorption
coefficient μ(E) above the absorption edge of a particular element. μ(E) is measured in one of two ways:
- Transmission: the absorption is measured by detecting the transmitted x-ray flux through the sample:
I = I0e-μ(E)x
μ(E)x = ln(I/I0)
- Fluorescence: the refilling of the deep core hole is detected. Usually the fluorescent x-ray is measured:
μ(E) ∝ If/I0

10
19
XAFS vs. XRD
Incidentx-rays, I0
Transmittedx-rays, It
Sample
Diffracted x-rays
X-ray DiffractionFixed Incident Energy
X-ray AbsorptionIncident Energy Varied
Abso
rban
ce
X-ray Photon Energy
It=I0e-μx
Scattered x-rays
x
Long range order
Short range order
20
XAFS in Practice
• We are interested in the energy dependent oscillations μ(E) as these tell us something about the neighboring atoms, so we define EXAFS as:
)()()()(
00
0
EEEE
μμμχ
Δ−
=
• The “bare atom” background μ0(E) is subtracted from the spectrum, and divided by the “edge step” Δu0(E) to give the EXAFS oscillations normalized to one absorption event:
11
21
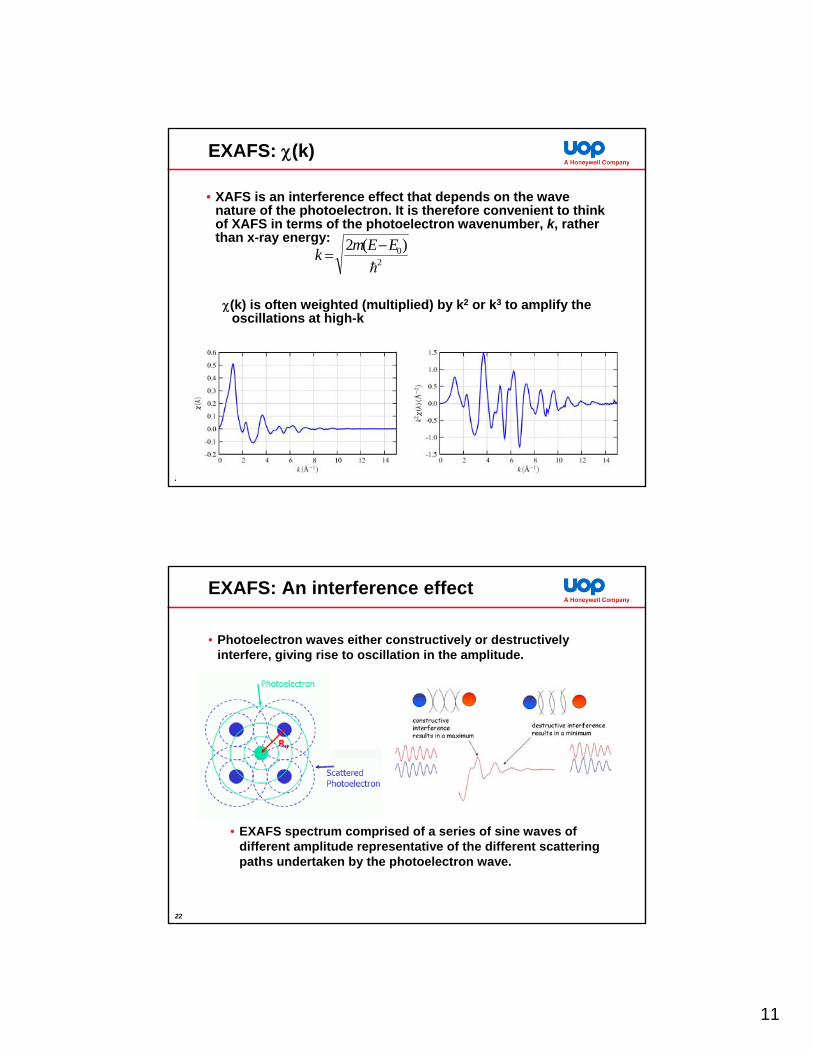
EXAFS: χ(k)
• XAFS is an interference effect that depends on the wave nature of the photoelectron. It is therefore convenient to thinkof XAFS in terms of the photoelectron wavenumber, k, rather than x-ray energy:
20)(2 EEmk −
=
χ(k) is often weighted (multiplied) by k2 or k3 to amplify the oscillations at high-k
22
EXAFS: An interference effect
• Photoelectron waves either constructively or destructively interfere, giving rise to oscillation in the amplitude.
• EXAFS spectrum comprised of a series of sine waves of different amplitude representative of the different scattering paths undertaken by the photoelectron wave.

12
23
The EXAFS Equation
• To determine the structure surrounding the absorbing atom we fit the experimental EXAFS data using the EXAFS equation:
• Where f(k) and δ(k) are photo-electron scattering properties of the neighboring atom.
• If we know these values then we can determine:- R distance to neighboring atoms- N coordination number of neighboring atoms- σ2 mean-square disorder of the neighbor distance
• The scattering amplitude f(k) and the phase-shift δ(k) depend on the atomic number Z of the scattering atom, so this allows us to determine the neighboring element.
24
XAFS
• Elementally specific: information around each element in multi-element catalyst can be determined separately.
• X-ray absorption is a bulk technique - but if the element of interest if highly dispersed then majority of atoms are surface atoms.
• Local order only: due to inelastic mean free path XAFS only probes local order (5-6 Å).
• All elements (except hydrogen).• Sensitivity: bulk compounds to sub ppm.• All phases can be studied: solids - both crystalline and
amorphous, liquids and gases.• EXAFS is a photon-in / photon-out spectroscopy so data can be
collected under extreme conditions.• Spatial information - with specialized experiments.
13
25
EXAFS Measurement
26
Important Considerations
• Monochromatic x-rays: need x-rays with small energy spread ΔE ~1 eV at 10 keV
• Linear Detectors: the XAFS signal is small (χ(k) ~10-2 of total signal), so lots of photons needed and detectors that are linear in x-ray intensity
• Well-aligned Beam: the x-ray beam hitting the detectors should be the same as that hitting the sample
• Homogeneous Sample: uniform and of appropriate thickness, free of pinholes
• Counting Statistics: good μ(E) data should have a noise level of ~10-3, so need to collect at least ~106 photons

14
27
Elements of an XAFS Experiment
X-ray source
Beam line
X-ray detectors
Sample
28
X-ray Source: Synchrotron
• Electrons at near relativistic energies are confined to an orbit by a series of magnets. As electrons are deflected through a magnetic field they give off electromagnetic radiation.
• Synchrotron light:- Tunable- High Intensity - Collimated- Polarized- Time structure
15
29
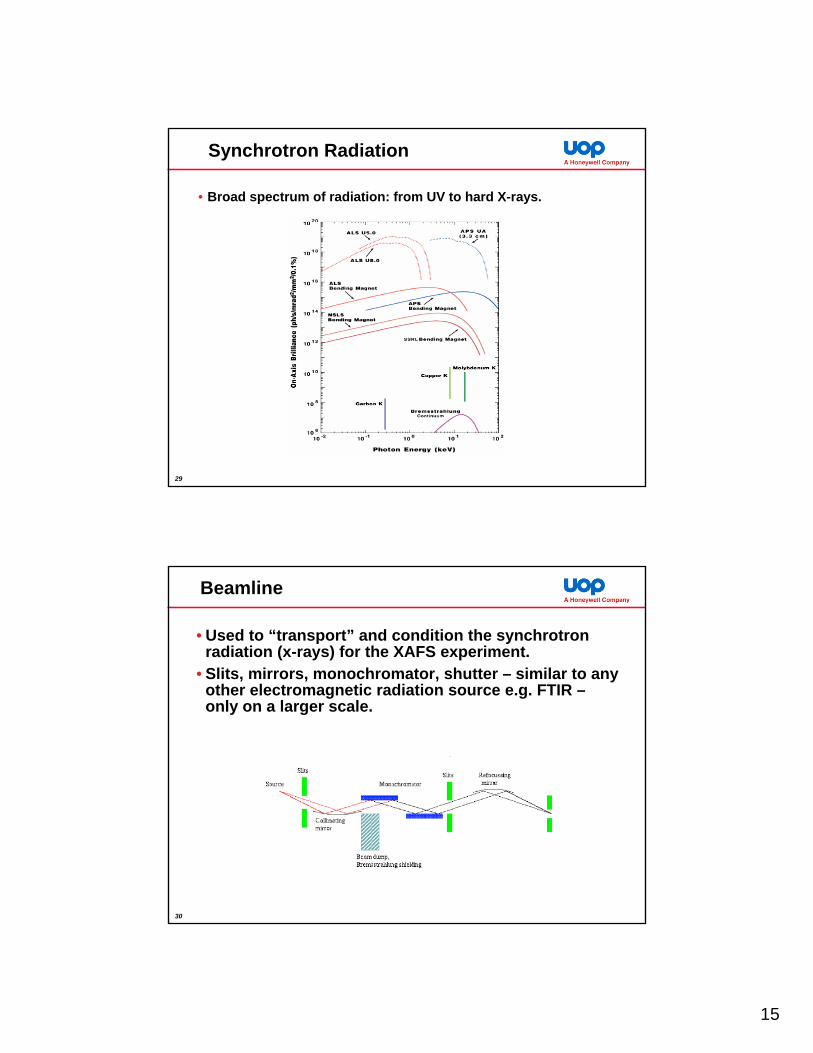
Synchrotron Radiation
• Broad spectrum of radiation: from UV to hard X-rays.
30
Beamline
• Used to “transport” and condition the synchrotron radiation (x-rays) for the XAFS experiment.
• Slits, mirrors, monochromator, shutter – similar to any other electromagnetic radiation source e.g. FTIR –only on a larger scale.

16
31
X-ray Mirrors
• Glancing incidence needed for reflectivity in x-ray energy range.• Ultra-smooth surfaces needed (<1nm rms roughness).• Small angles mean mirrors need to be long.• Mirrors used to collimate and focus the beam by bending.• Also used for harmonic rejection.
32
Monochromator
• Used to select energy (wavelength) of interest: For EXAFS need x-rays with small energy spread: ΔE ~1 eV at 10 keV
• Must be able to scan the energy for XAFS.• Must be very stable.
θ
Si double crystal monochromator –energy scanned by rotating θ
• White beam impinges on perfect single crystal of Si of specific orientation.
• Photons that meet the Bragg diffraction condition nλ = 2dhklsin(θ) are diffracted.
• Second crystal simply redirects the beam parallel to incident beam.
Si(111) crystal
17
33
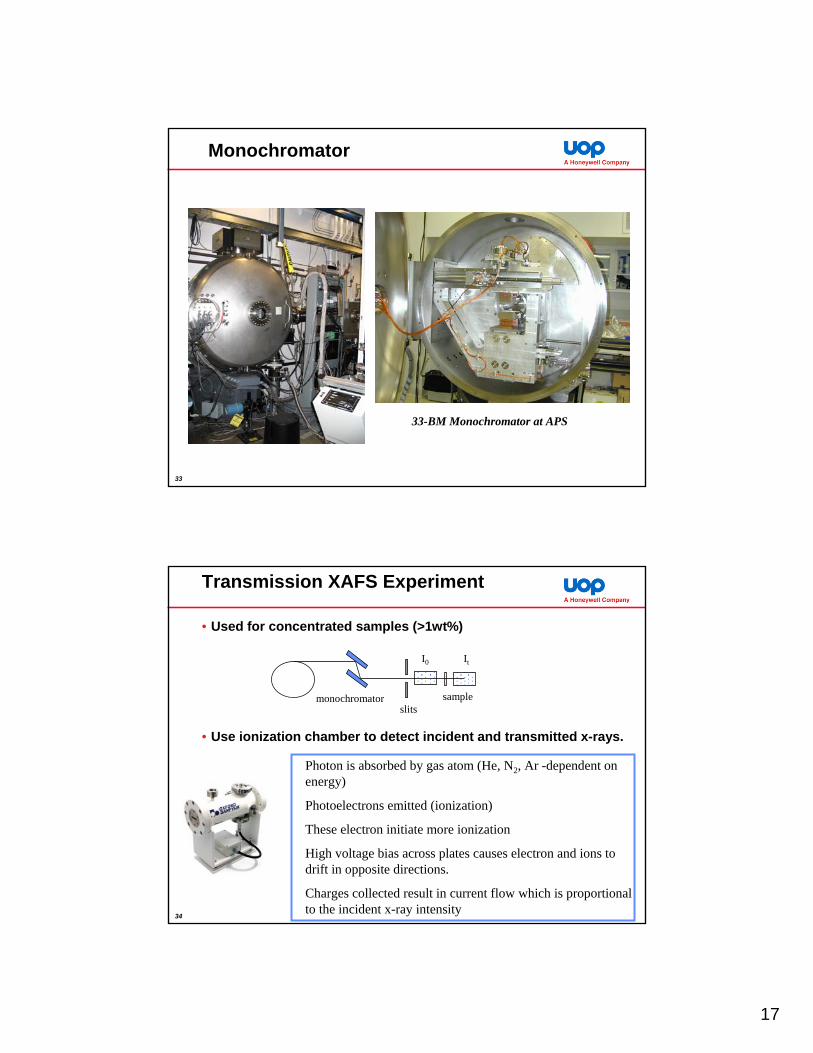
Monochromator
33-BM Monochromator at APS
34
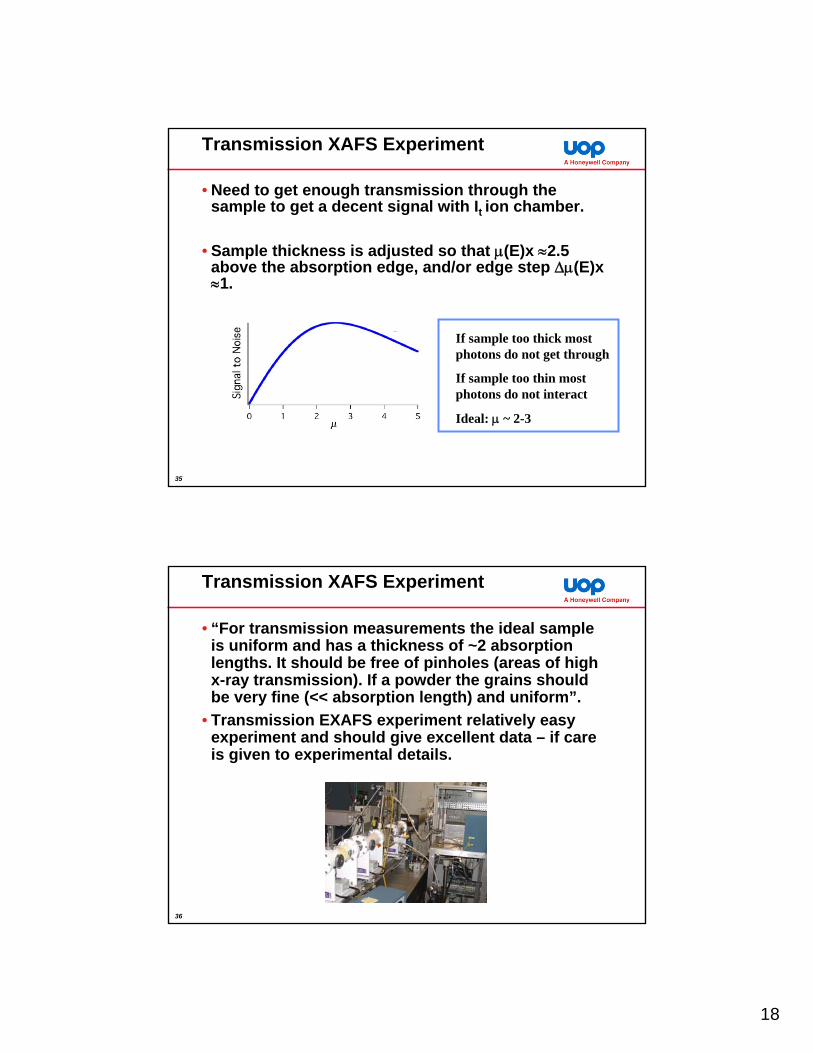
Transmission XAFS Experiment
• Used for concentrated samples (>1wt%)
• Use ionization chamber to detect incident and transmitted x-rays.
I0 It
samplemonochromatorslits
Photon is absorbed by gas atom (He, N2, Ar -dependent on energy)
Photoelectrons emitted (ionization)
These electron initiate more ionization
High voltage bias across plates causes electron and ions to drift in opposite directions.
Charges collected result in current flow which is proportional to the incident x-ray intensity
18
35
Transmission XAFS Experiment
• Need to get enough transmission through the sample to get a decent signal with It ion chamber.
• Sample thickness is adjusted so that μ(E)x ≈2.5 above the absorption edge, and/or edge step Δμ(E)x≈1.
If sample too thick most photons do not get through
If sample too thin most photons do not interact
Ideal: μ ~ 2-3
36
Transmission XAFS Experiment
• “For transmission measurements the ideal sample is uniform and has a thickness of ~2 absorption lengths. It should be free of pinholes (areas of high x-ray transmission). If a powder the grains should be very fine (<< absorption length) and uniform”.
• Transmission EXAFS experiment relatively easy experiment and should give excellent data – if care is given to experimental details.
19
37
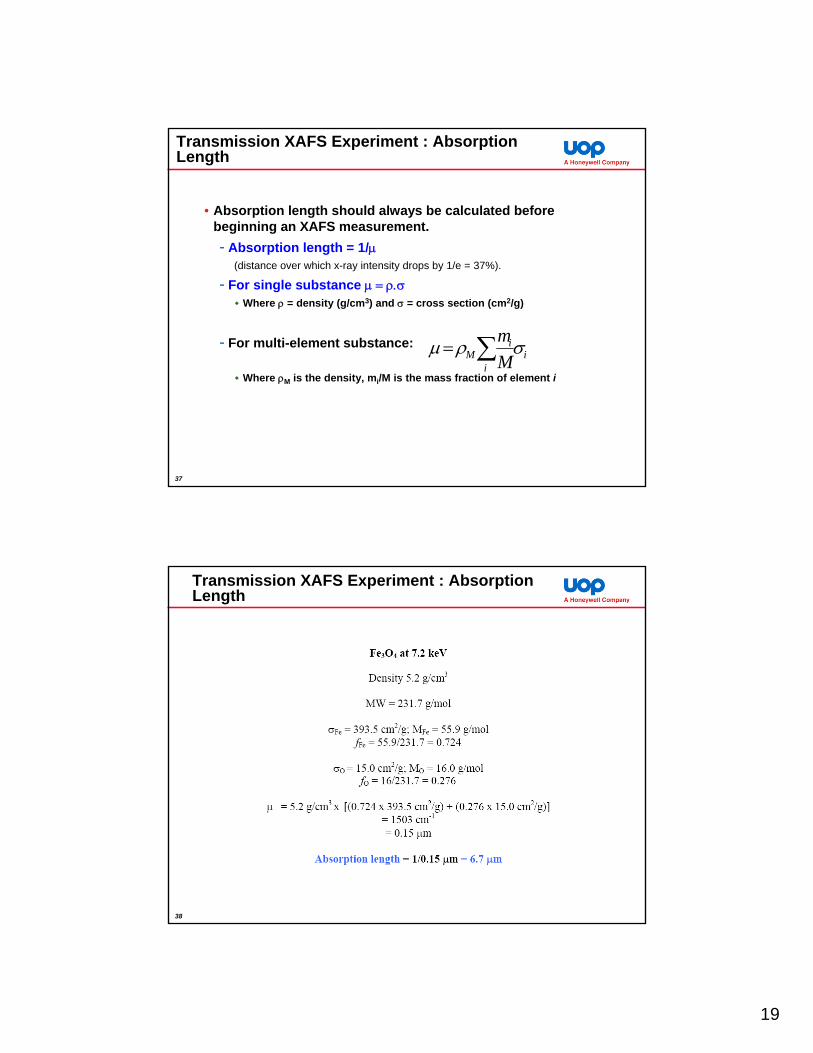
Transmission XAFS Experiment : Absorption Length
• Absorption length should always be calculated before beginning an XAFS measurement.- Absorption length = 1/μ
(distance over which x-ray intensity drops by 1/e = 37%).
- For single substance μ = ρ.σWhere ρ = density (g/cm3) and σ = cross section (cm2/g)
- For multi-element substance:
Where ρM is the density, mi/M is the mass fraction of element i
ii
iM M
mσρμ ∑=
38
Transmission XAFS Experiment : Absorption Length

20
39
Transmission XAFS Experiment
• The x-ray energy is scanned across the absorption edge of the element of interest. The intensity of the incident beam and transmitted beam through the sample are measured.
I0 It
μ(E)xμ(E)x = -ln(I/I0)
40
Fluorescence XAFS Experiment
• For thick samples (no transmission) or for low concentration (down to ppm levels) measuring the x-ray fluorescence is the preferred measurement.
• The x-rays emitted by the sample will include the fluorescence line of interest (e.g. Fe Kα and Fe Kβ) as well as scattered x-rays, and other fluorescence lines (Ca, Ti, and V in this sample).
• In many cases the scatter or other fluorescence lines will dominate the fluorescence spectra.
21
41
Fluorescence XAFS Experiment
• Two main considerations for getting good quality fluorescence measurement:
• Energy discrimination: It may be helpful to either physically or electronically filter the unwanted portions of the fluorescence/scatter spectrum.
• Solid Angle: The fluorescence is emitted isotropically in all directions so collecting as much of the 4π solid angle as possible is good (large detector, close to sample)
42
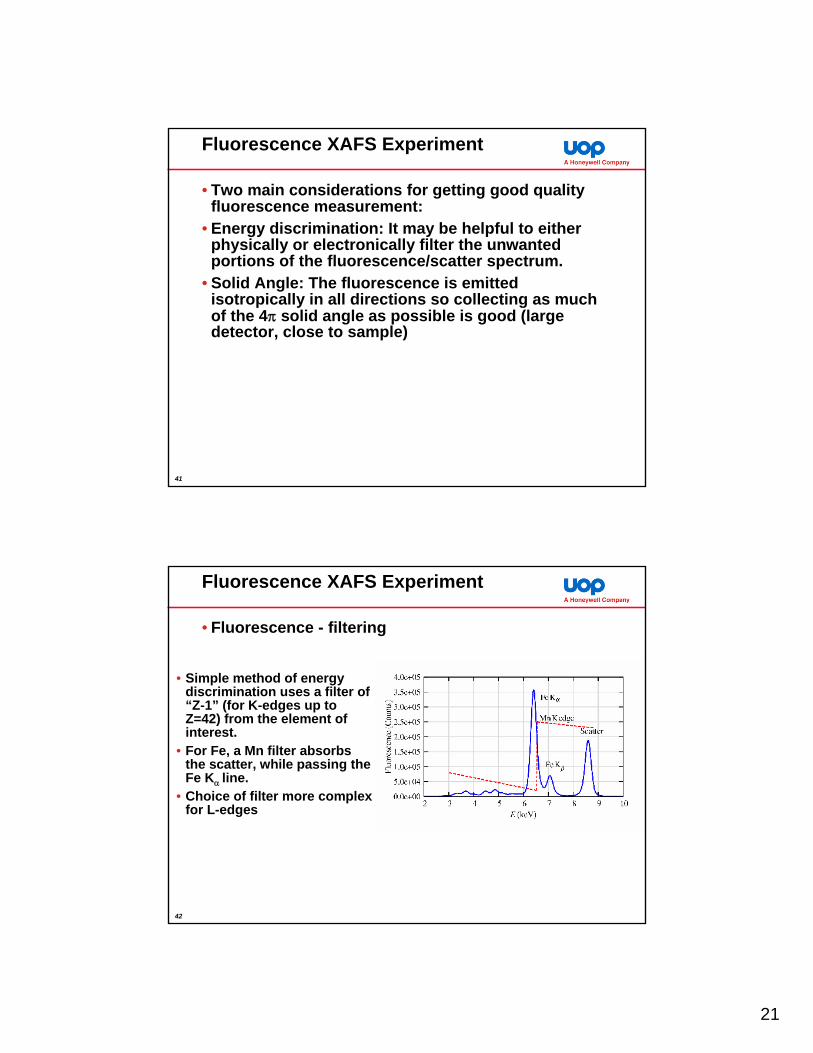
Fluorescence XAFS Experiment
• Fluorescence - filtering
• Simple method of energy discrimination uses a filter of “Z-1” (for K-edges up to Z=42) from the element of interest.
• For Fe, a Mn filter absorbs the scatter, while passing the Fe Kα line.
• Choice of filter more complex for L-edges

22
43
Fluorescence XAFS Experiment
• Typical fluorescence setup with filter using an ion chamber with no energy resolution –but high count rate and linearity, and reasonable solid angle.
• Sample at 45° to the beam to minimize scatter.
• Because the filter absorbs the scattered beam, it can itself re-radiate X-rays.
• Set of Soller slits used to “see” the sample, but absorb most of the re-radiate scatter from the filter.
• Very effective arrangement for FY XAFS.
44
Fluorescence XAFS Experiment: Solid State Detectors
• Alternative is to use a solid state detector with active element of Ge or Si as the x-ray absorber. This uses electronic energy discrimination.
• Typical energy resolution 200-300 eV.• Has advantage of measuring the full x-ray
fluorescence spectrum, so useful for identifying other elements in sample.
• Can be used for XAFS measurements with concentration to 10’s of ppm.
I0
samplemonochromator
slits
fluorescence detector
23
45
Fluorescence XAFS Experiment: Self Absorption
• The fluorescent x-ray has to get out of the sample to be detected and can be attenuated by the sample itself. The self-absorption can severely damp the XAFS – both XANES and XAFS
• Do not record XAFS of bulk reference compounds (foils) in fluorescence if you want to use these data to calibrate intensity of the XAFS signal (S0
2), or to conduct linear combination fitting of XANES spectra.
46
Specialized XAFS Experiments
• XAFS spectra can also be measured using other modes of detection:- Total electron yield- Partial electron yield
• XAFS can also be detected using glancing incident angle to limit penetration into sample (ReflEXAFS).
• XAFS can also be measured making use of the polarization dependence of the x-rays.
24
47
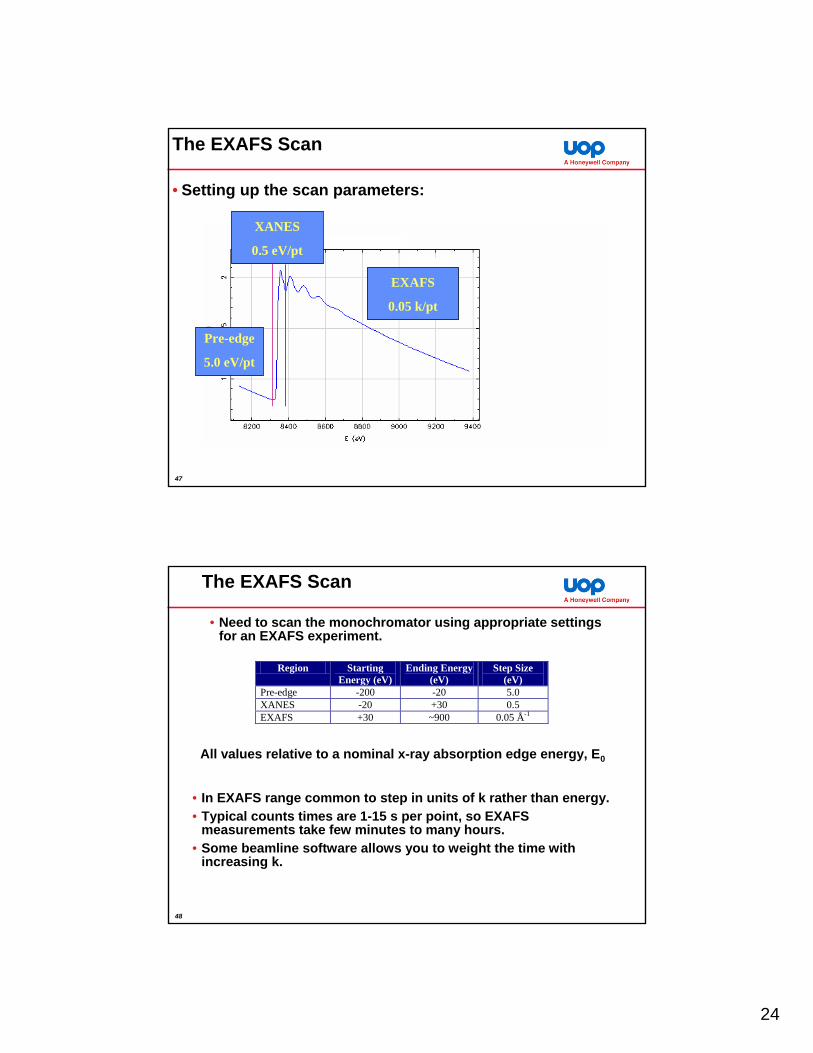
The EXAFS Scan
• Setting up the scan parameters:
Pre-edge
5.0 eV/pt
XANES
0.5 eV/pt
EXAFS
0.05 k/pt
48
The EXAFS Scan
All values relative to a nominal x-ray absorption edge energy, E0
Region Starting Energy (eV)
Ending Energy (eV)
Step Size (eV)
Pre-edge -200 -20 5.0 XANES -20 +30 0.5 EXAFS +30 ~900 0.05 Å-1
• Need to scan the monochromator using appropriate settings for an EXAFS experiment.
• In EXAFS range common to step in units of k rather than energy.• Typical counts times are 1-15 s per point, so EXAFS
measurements take few minutes to many hours.• Some beamline software allows you to weight the time with
increasing k.
25
49
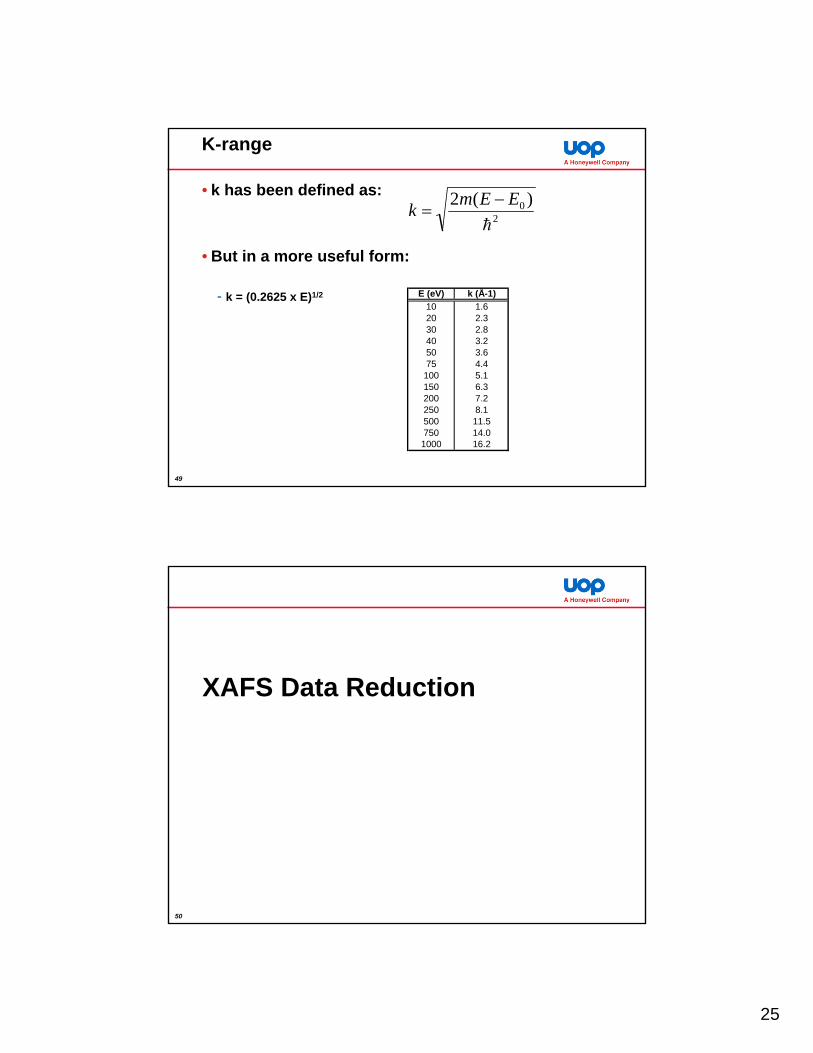
K-range
• k has been defined as:
• But in a more useful form:
- k = (0.2625 x E)1/2
20 )(2 EEmk −
=
E (eV) k (Å-1)10 1.620 2.330 2.840 3.250 3.675 4.4100 5.1150 6.3200 7.2250 8.1500 11.5750 14.01000 16.2
50
XAFS Data Reduction
26
51
Data Reduction: Strategy
• Steps for reducing measured data to χ(k):
1. Convert measured intensities to μ(E)2. Subtract a smooth pre-edge function, to get rid of
instrumental background, and absorption from other edges.
3. Normalize μ(E) to from 0 to 1, so that it represents absorption on a per atom basis.
4. Remove a smooth, post-edge background function to approximate m0(E) to isolate the XAFS, χ.
5. Identify the threshold energy, E0, and convert from E to k space.
6. Weight the XAFS χ(k) and Fourier transform from k to R space.
52
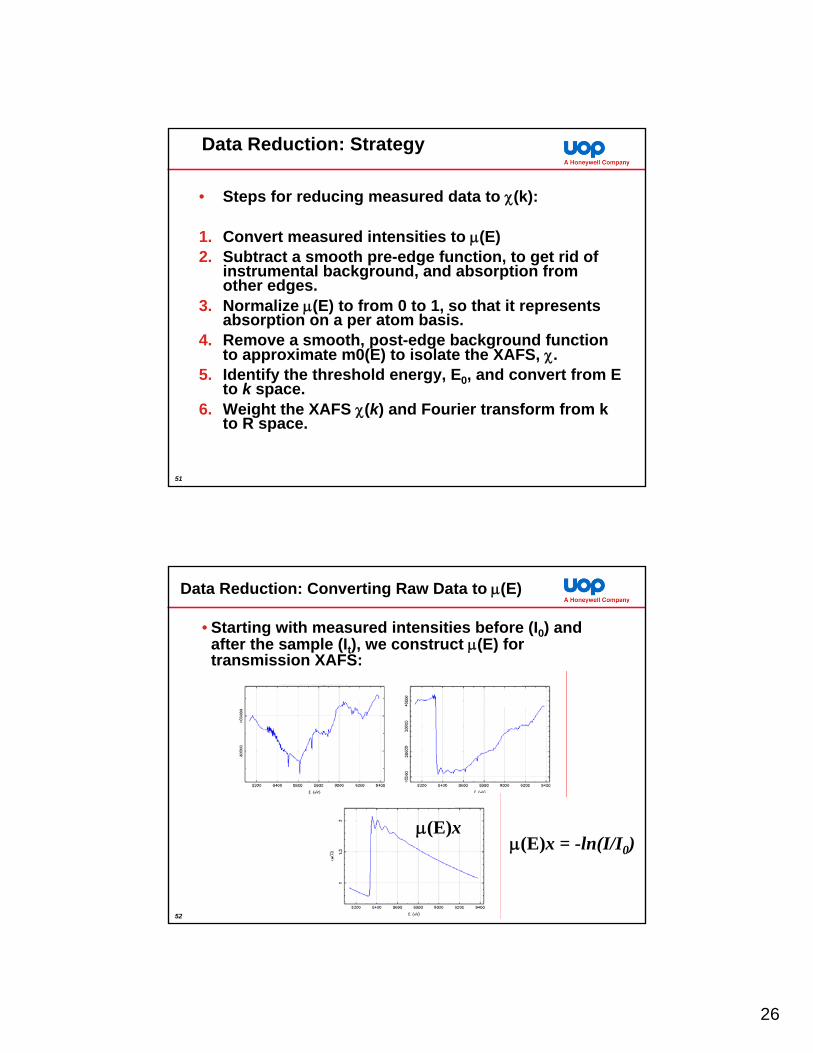
Data Reduction: Converting Raw Data to μ(E)
• Starting with measured intensities before (I0) and after the sample (It), we construct μ(E) for transmission XAFS:
μ(E)xμ(E)x = -ln(I/I0)
27
53
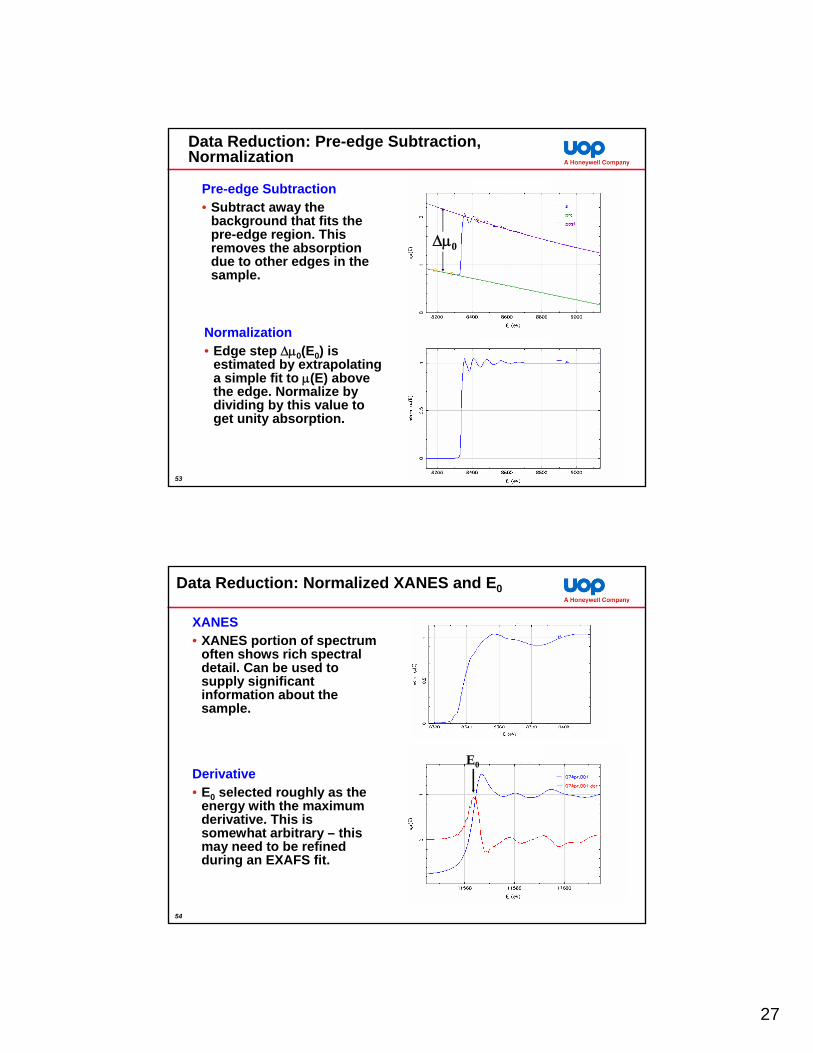
Data Reduction: Pre-edge Subtraction, Normalization
Pre-edge Subtraction• Subtract away the
background that fits the pre-edge region. This removes the absorption due to other edges in the sample.
Normalization• Edge step Δμ0(E0) is
estimated by extrapolating a simple fit to μ(E) above the edge. Normalize by dividing by this value to get unity absorption.
Δμ0
54
Data Reduction: Normalized XANES and E0
XANES• XANES portion of spectrum
often shows rich spectral detail. Can be used to supply significant information about the sample.
Derivative• E0 selected roughly as the
energy with the maximum derivative. This is somewhat arbitrary – this may need to be refined during an EXAFS fit.
E0
28
55
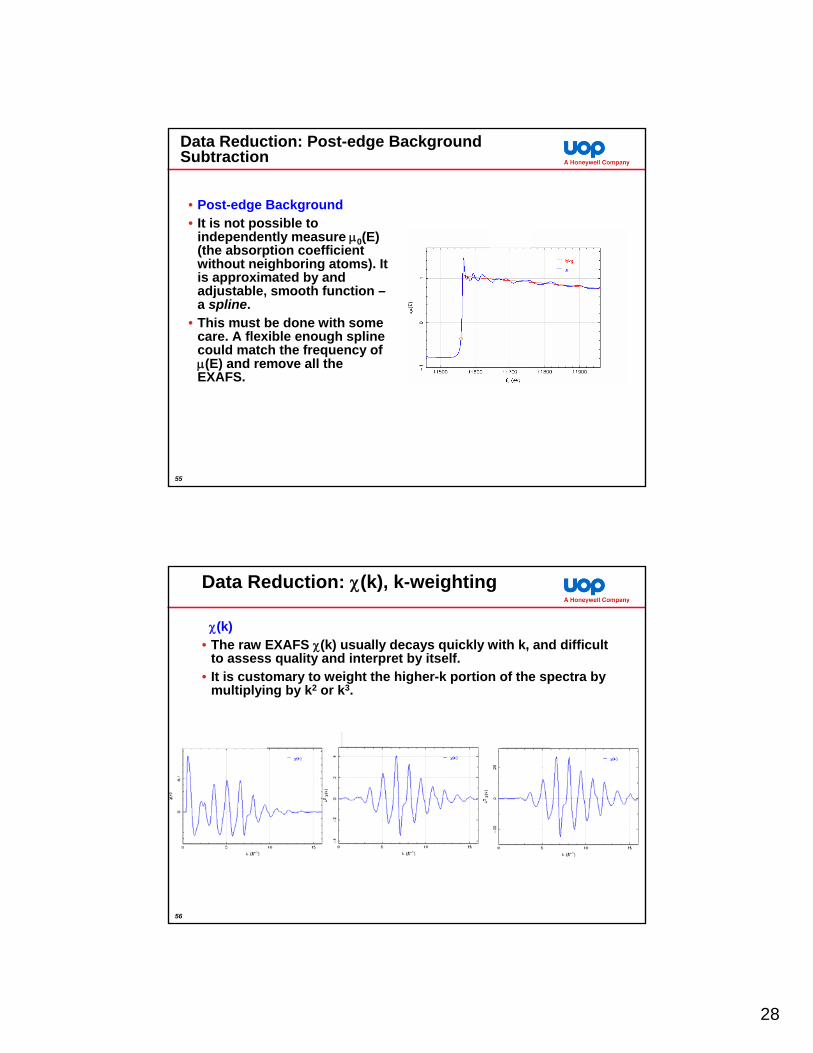
Data Reduction: Post-edge Background Subtraction
• Post-edge Background• It is not possible to
independently measure μ0(E) (the absorption coefficient without neighboring atoms). It is approximated by and adjustable, smooth function –a spline.
• This must be done with some care. A flexible enough splinecould match the frequency of μ(E) and remove all the EXAFS.
56
Data Reduction: χ(k), k-weighting
χ(k)• The raw EXAFS χ(k) usually decays quickly with k, and difficult
to assess quality and interpret by itself.• It is customary to weight the higher-k portion of the spectra by
multiplying by k2 or k3.

29
57
Data reduction: Fourier Transform
• One way to separate the sine waves from one another is to perform a Fourier transform.
• The resulting magnitude of the transform now has peaks representative of the different scattering paths of the photoelectron.
58
EXAFS Analysis: Modeling the Data
• The experimental EXAFS data are now ready for fitting to a structure:
• This is what this course is all about – and you will hear much more about this in the coming week.
• Important point – EXAFS is not a real-space structural technique: a model of the presumed structure is needed to fit the data.
30
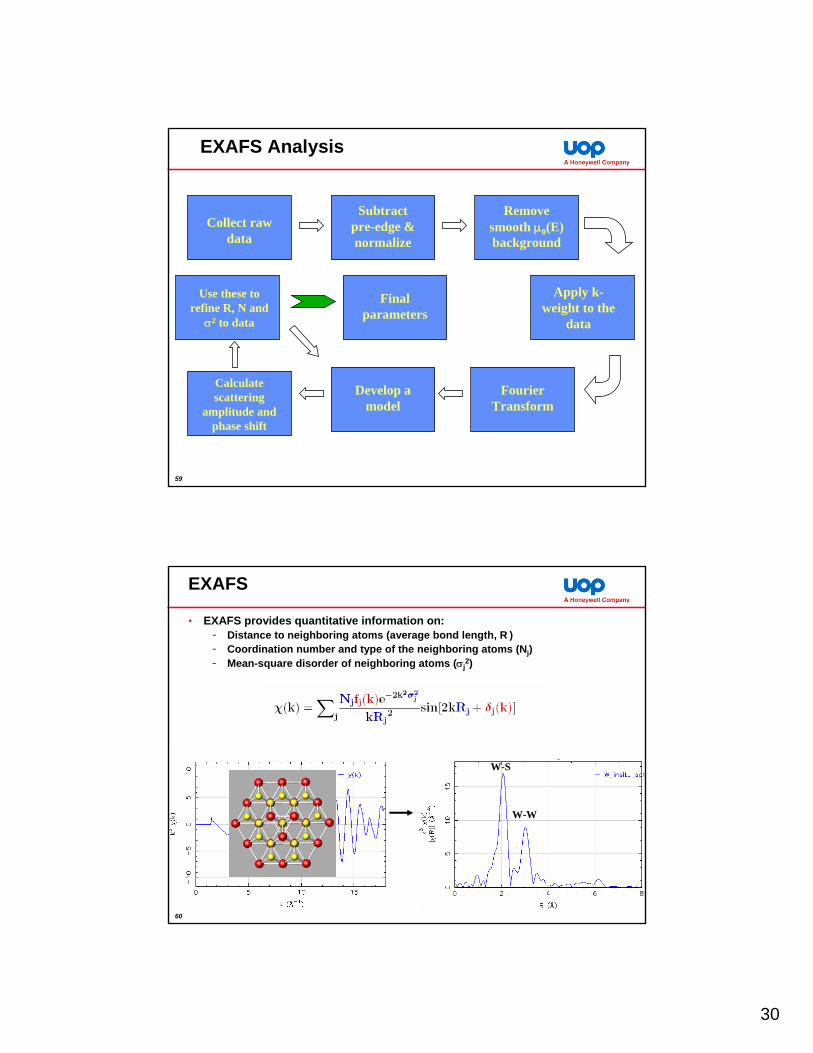
59
EXAFS Analysis
Collect raw data
Subtract pre-edge & normalize
Remove smooth μ0(E) background
Apply k-weight to the
data
Fourier Transform
Develop a model
Calculate scattering
amplitude and phase shift
Use these to refine R, N and
σ2 to data
Final parameters
60
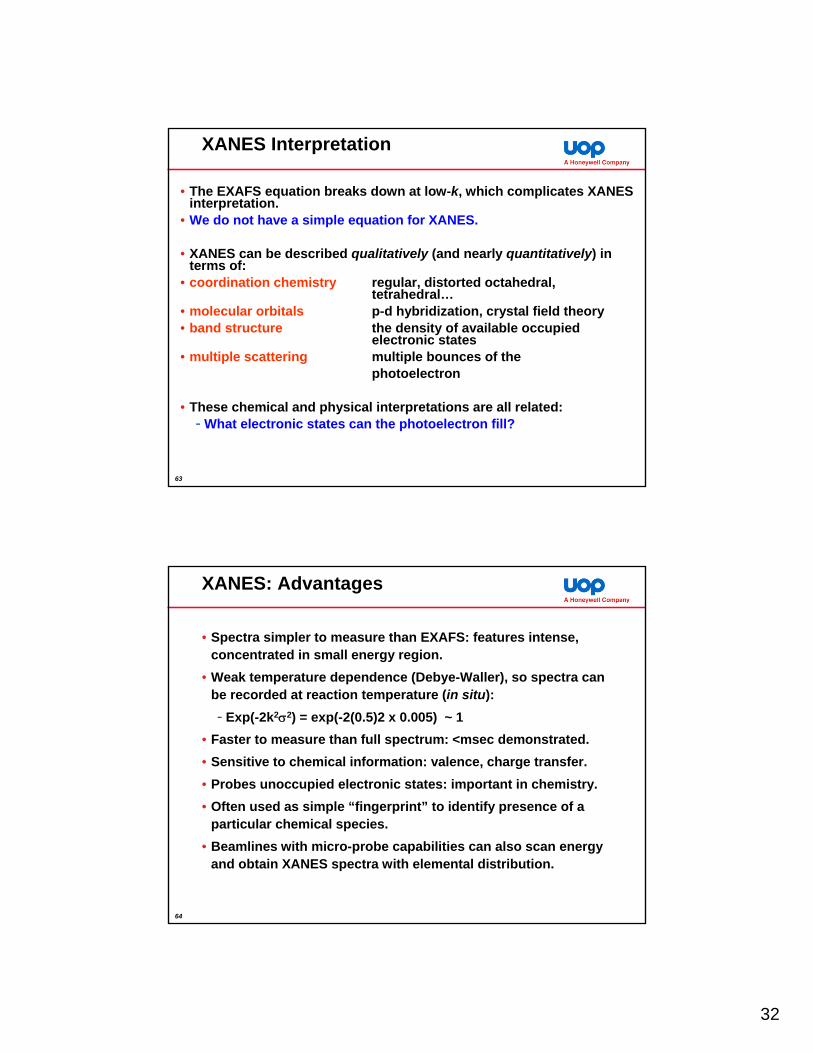
• EXAFS provides quantitative information on:- Distance to neighboring atoms (average bond length, Rj)- Coordination number and type of the neighboring atoms (Nj)- Mean-square disorder of neighboring atoms (σj
2)
EXAFS
W L3 edge of WS2
W-W
W-S

31
61
XANES
62
XANES Transitions
• XANES directly probes the angular momentum of the unoccupied electronic states: these may be bound or unbound, discrete or broad, atomic or molecular.
• Dipole selection rules apply*: Δl = ±1, Δj = ±1, Δs = 0.
• Primary transition will be:
• s → p for K (1s core electron) and L1 (2s core electron initial state) edges
• p → d for L2 (2p½) and L3 (2p3/2) edges
• But…..final state usually not atomic-like and may have mixing (hybridization) with other orbitals. This is often the interesting part of the XANES!
* Some transitions are true quadrupolar transitions. These are usually very weak.
l=0 is s-orbital; l=1 is p-orbital; l=2 is d-orbital
32
63
XANES Interpretation
• The EXAFS equation breaks down at low-k, which complicates XANES interpretation.
• We do not have a simple equation for XANES.
• XANES can be described qualitatively (and nearly quantitatively) in terms of:
• coordination chemistry regular, distorted octahedral, tetrahedral…
• molecular orbitals p-d hybridization, crystal field theory• band structure the density of available occupied
electronic states• multiple scattering multiple bounces of the
photoelectron
• These chemical and physical interpretations are all related:- What electronic states can the photoelectron fill?
64
XANES: Advantages
• Spectra simpler to measure than EXAFS: features intense, concentrated in small energy region.
• Weak temperature dependence (Debye-Waller), so spectra can be recorded at reaction temperature (in situ): - Exp(-2k2σ2) = exp(-2(0.5)2 x 0.005) ~ 1
• Faster to measure than full spectrum: <msec demonstrated. • Sensitive to chemical information: valence, charge transfer.• Probes unoccupied electronic states: important in chemistry.• Often used as simple “fingerprint” to identify presence of a
particular chemical species.• Beamlines with micro-probe capabilities can also scan energy
and obtain XANES spectra with elemental distribution.
33
65
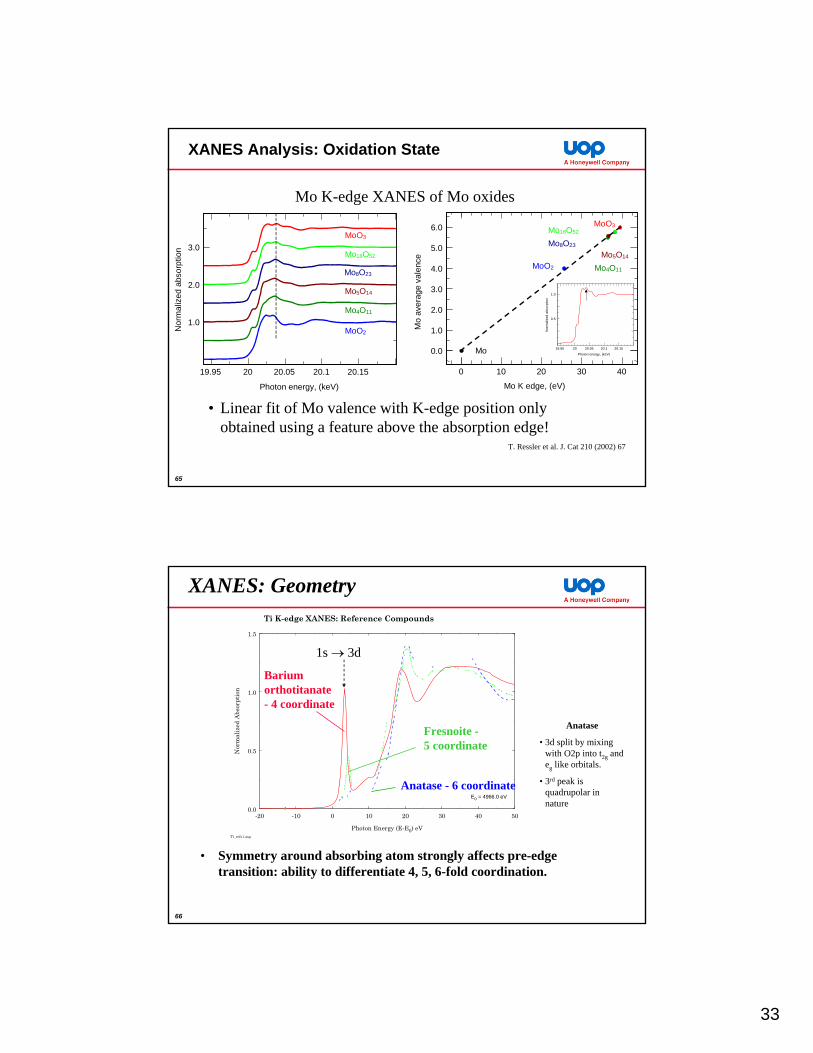
XANES Analysis: Oxidation State
1.0
2.0
3.0
4.0
5.0
6.0
0.0
10 20 30 40 0
Mo
aver
age
vale
nce
Mo K edge, (eV)
MoO2
MoO3
Mo4O11
Mo8O23 Mo18O52
Mo5O14
Mo
0.5
1.0
19.95 20 20.05 20.1 20.15
Nor
mal
ized
abs
orpt
ion
Photon energy, (keV)
1.0
2.0
3.0
19.95 20 20.05 20.1 20.15
Nor
mal
ized
abs
orpt
ion
Photon energy, (keV)
MoO2
MoO3
Mo4O11
Mo8O23
Mo18O52
Mo5O14
Mo K-edge XANES of Mo oxides
• Linear fit of Mo valence with K-edge position only obtained using a feature above the absorption edge!
T. Ressler et al. J. Cat 210 (2002) 67
66
-20 -10 0 10 20 30 40 50
Photon Energy (E-E0) eV
0.0
0.5
1.0
1.5
Nor
mal
ized
Abs
orpt
ion
Ti_refs1.axg
Ti K-edge XANES: Reference Compounds
E0 = 4966.0 eV
Anatase - 6 coordinate
Fresnoite -5 coordinate
Barium orthotitanate - 4 coordinate
1s → 3d
• Symmetry around absorbing atom strongly affects pre-edge transition: ability to differentiate 4, 5, 6-fold coordination.
XANES: Geometry
Anatase
• 3d split by mixing with O2p into t2g and eg like orbitals.
• 3rd peak is quadrupolar in nature
34
67
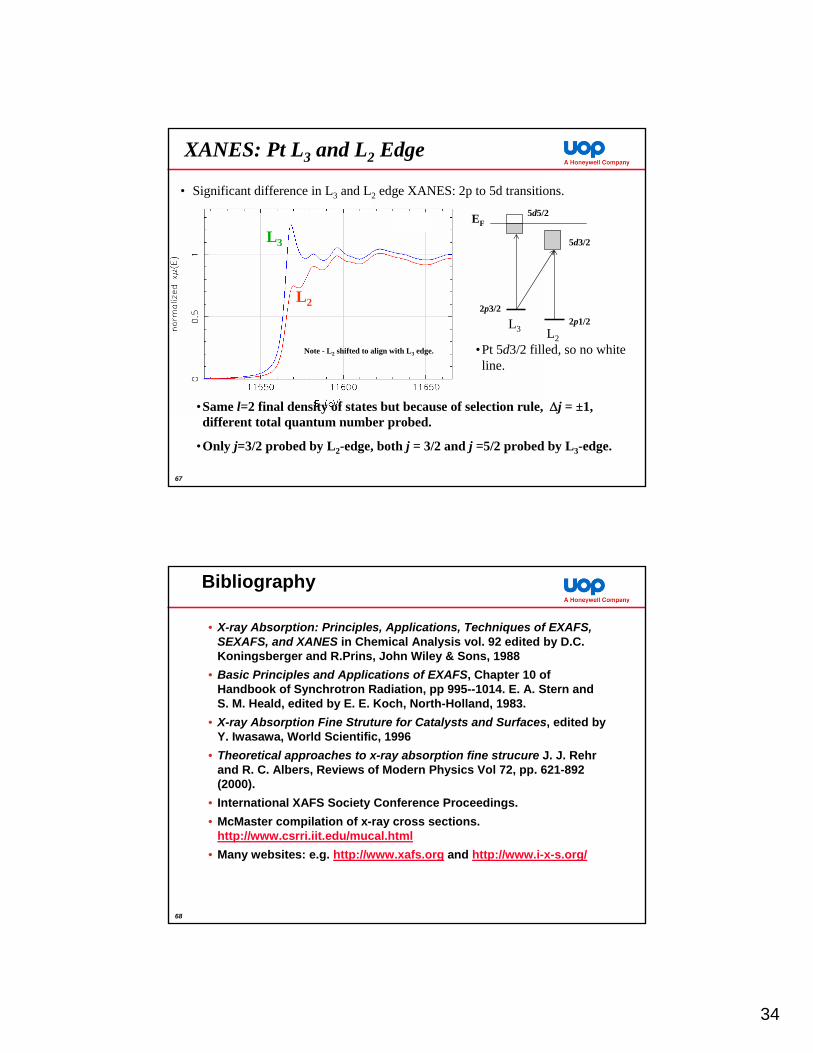
L3
L2
• Significant difference in L3 and L2 edge XANES: 2p to 5d transitions.
•Pt 5d3/2 filled, so no white line.
Note - L2 shifted to align with L3 edge.
EF5d5/2
5d3/2
L3 L2
2p1/22p3/2
•Same l=2 final density of states but because of selection rule, Δj = ±1, different total quantum number probed.
•Only j=3/2 probed by L2-edge, both j = 3/2 and j =5/2 probed by L3-edge.
XANES: Pt L3 and L2 Edge
68
Bibliography
• X-ray Absorption: Principles, Applications, Techniques of EXAFS, SEXAFS, and XANES in Chemical Analysis vol. 92 edited by D.C. Koningsberger and R.Prins, John Wiley & Sons, 1988
• Basic Principles and Applications of EXAFS, Chapter 10 of Handbook of Synchrotron Radiation, pp 995--1014. E. A. Stern and S. M. Heald, edited by E. E. Koch, North-Holland, 1983.
• X-ray Absorption Fine Struture for Catalysts and Surfaces, edited by Y. Iwasawa, World Scientific, 1996
• Theoretical approaches to x-ray absorption fine strucure J. J. Rehr and R. C. Albers, Reviews of Modern Physics Vol 72, pp. 621-892 (2000).
• International XAFS Society Conference Proceedings.• McMaster compilation of x-ray cross sections.
http://www.csrri.iit.edu/mucal.html• Many websites: e.g. http://www.xafs.org and http://www.i-x-s.org/