introduction to water quality modelling
TRANSCRIPT

FEATURE
| JURUTERA August 201212
Introduction toWater Quality Modelling
IN recent years, water pollution control and water qualitymanagement strategies are gaining prominence indeveloped as well as developing countries in the wake ofglobal environmental scenarios such as resource depletion,climate shifts, population pressure and, last but not least,increased public awareness. In spite of all the efforts takenby the research community and governmental agencies,water quality is deteriorating in many areas around theworld.
Access to safe water is a basic human right. According to
water supplies coupled with poor sanitation and hygienecause 3.4 million deaths a year, mostly among children [1].From the development’s perspective, water plays one of
mandatory for maintaining the water quality for sustainableutilisation.
Water quality models have made the job of policy makersand researchers much more reliable and sustainable in recentdecades. Now, it is possible to predict the condition of waterquality based on changes in land use, surge of population,
constraint in water quality assessment and management.It serves the purpose of identifying the pollution sourcesand helps to decipher various complex biogeochemicalprocesses in the water bodies simultaneously, which would
makes sense in the case of water quality models, which arepredictive tools for representing complex physical, chemicaland biological processes. Generally water quality modelscan be of two categories; conceptual and mathematical.Mathematical models are often reliable for simulating thecomplex processes which determine the ultimate fate of thewater bodies, and are also cost effective.
Determining the best model to be used is one of the
on the problem to be addressed and the type of water bodyin question. Nowadays, water quality models are utilised fordiverse types of fresh and salt water bodies such as rivers,lakes, estuaries, creeks, and bays.
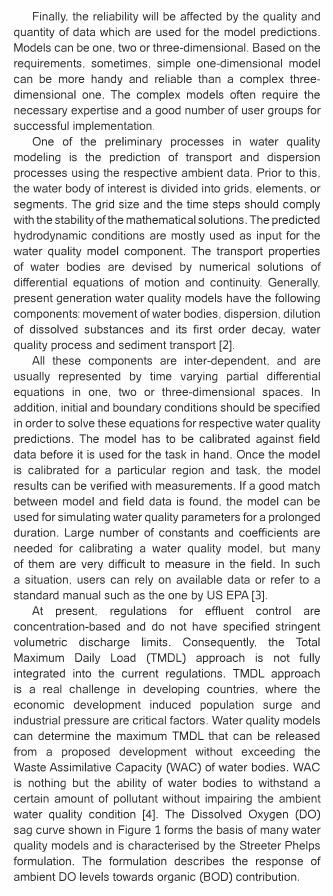
Figure 1: Basic concept of WAC and dissolved oxygen sag curve [5]
FEATURE
August 2012 JURUTERA | 13
Finally, the reliability will be affected by the quality andquantity of data which are used for the model predictions.Models can be one, two or three-dimensional. Based on therequirements, sometimes, simple one-dimensional modelcan be more handy and reliable than a complex three-
necessary expertise and a good number of user groups forsuccessful implementation.
modeling is the prediction of transport and dispersionprocesses using the respective ambient data. Prior to this,the water body of interest is divided into grids, elements, or
hydrodynamic conditions are mostly used as input for the
of water bodies are devised by numerical solutions ofdifferential equations of motion and continuity. Generally,present generation water quality models have the followingcomponents: movement of water bodies, dispersion, dilution
quality process and sediment transport [2].All these components are inter-dependent, and are
usually represented by time varying partial differentialequations in one, two or three-dimensional spaces. In
in order to solve these equations for respective water quality
is calibrated for a particular region and task, the model
used for simulating water quality parameters for a prolonged
needed for calibrating a water quality model, but many
a situation, users can rely on available data or refer to astandard manual such as the one by US EPA [3].
is a real challenge in developing countries, where theeconomic development induced population surge andindustrial pressure are critical factors. Water quality models
from a proposed development without exceeding the
is nothing but the ability of water bodies to withstand acertain amount of pollutant without impairing the ambient
sag curve shown in Figure 1 forms the basis of many waterquality models and is characterised by the Streeter Phelps

FEATURE
| JURUTERA August 201214
these models are supported by US Environmental Protection Agency (US
running the models include ambient water quality, water body hydrogeometry,pollution sources, point and non-point sources, long-term water quality anddischarge data, sediment oxygen demand, and topographic maps or GISsupport. In addition to these datasets, bathymetry, current, wind and tidedata are needed for marine applications.
water quality model that was intended to represent a modernised version
channel is well-mixed vertically and laterally. All the water quality variables
is used as the graphical user interface for this model.WASP helps users in interpreting and predicting water quality responses
to natural phenomena and man-made pollution for various pollution
dynamic compartment-modelling programme for aquatic systems, includingboth the water column and the underlying benthos, and the model can beone, two or three dimensional, depending on the complexity of intended use.
loading and boundary exchange are represented in the model.
has adopted river models more intensively in their respective river basinmanagement programmes, including the Program Pencegahan Pencemarandan Peningkatan Kualiti Air Sungai (DOE) and the Integrated River Basin
were simulated to achieve a Class III denotation of the National Water
followed for other basins throughout the country, namely the Sg. Langat,Sg. Linggi, Sg. Sepetang, Sg. Rajang, Sg. Merbok and Sg. Kuantan basins,
the development of proposed mitigation measures.
are concentration-based and do not prescribe volumetric discharge limits,
designated approval conditions. Water quality modelling in Malaysia has
further as a critical management tool in river basin management.In India, WASP is a suitable model to estimate the WAC of coastal
and industrial areas. Recently, a WASP modelling network for the coastalwaters off Mumbai, one of the major global coastal megacities, has beendeveloped. Hydrodynamic input from MIKE was used in the water quality
(Continued on page 16)

FEATURE
| JURUTERA August 201216
Water quality modelling is a useful tool to effectively tackle water qualityproblems. Facts presented in this article only touch on the most fundamentalaspects of water quality modelling. A deep understanding of water quality
prerequisites towards the development of a representative model. Betterresults will always emerge from a better understanding of the subject.
REFERENCES[1] UNICEF, UNICEF Handbook on Water Quality. New York, United Nations, 2008.
[2] Palmer, M. D. Water quality modeling: a guide to effective practice. Washington, D.C.,World Bank, 2001.
[3] Bowie, G.L., Mills, W.B., Porcella, D.B., Campbell, C.L., Pagenkopf, J.R., Rupp, G.L.,Johnson, K.M., Chan, P.W.H., Gherini, S.A., Chamberlin, C.E. Rates, constants, andkinetics formulations in surface water quality modeling, second ed. US EnvironmentalProtection Agency, Environmental Research Laboratory, Athens, GA. 1985.
[4] Novotny, V. and Krenkel, P. A. (1974). A Waste Assimilative Capacity Model for aShallow, Turbulent Stream. Water Research. 9(2), 233-241. Elsevier.
[5] Davis, M. L. and Cornwell, D. A. (1998). Introduction to Environmental Engineering. (3rded.). New York: McGraw Hill Press.
[6] Chapra S., Pelletier G. and Tao. H. QUAL-2K: a modeling framework for simulating riverand stream water quality: documentation and users manual. Civil and EnvironmentalEngineering Department, Tufts University, Medford 2003.
[7] Ambrose, R. B., Wool, T. A. Martin, J. L. The Water Quality Analysis Simulation Program,WASP5: Model Document and Input Database, US Environmental Protection Agency,Washington, DC 1993.
Fill in the remaining 80 squares with single digits 1-9 such that there is no repeat of the digit in everyRow, Column and Block of nine squares. The number at the top left hand corner of the dotted cageindicates the total for the digits that the cage encompasses.
For tips on solving, visit www.1sudoku.com.my© Twin Tree Publishing
(Solution is on page 39 of this issue.)