introduction to visualization with vtk and...
TRANSCRIPT

Outline Introduction Visualization with ParaView Showcases Resources and further reading
Introduction to Visualization with VTK andParaView
R. Sungkorn and J. Derksen
Department of Chemical and Materials EngineeringUniversity of Alberta
Canada
August 24, 2011 / LBM Workshop

Outline Introduction Visualization with ParaView Showcases Resources and further reading
1 IntroductionSimulation VisualizationVisualization PipelineData StructureData FormatParaView
2 Visualization with ParaViewParaView InterfaceLoading DataView ControlsStructureFiltersSave data and animation
3 Showcases
4 Resources and further reading
Outline Introduction Visualization with ParaView Showcases Resources and further reading
Simulation Visualization
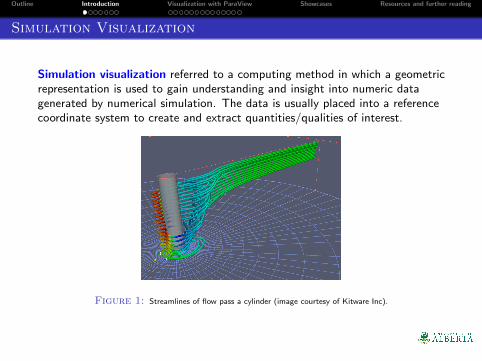
Simulation visualization referred to a computing method in which a geometricrepresentation is used to gain understanding and insight into numeric datagenerated by numerical simulation. The data is usually placed into a referencecoordinate system to create and extract quantities/qualities of interest.
Figure 1: Streamlines of flow pass a cylinder (image courtesy of Kitware Inc).

Outline Introduction Visualization with ParaView Showcases Resources and further reading
Visualization Pipeline
The goal of visualization pipeline is to create geometrically constructedimages from numeric data. The process can be described step-wise as:
Data analysis: preparing data for visualization
Filtering: specifying data portion to be visualized
Mapping: transforming filtered data into geometrical primitive (e.g.points, lines) with attributes (e.g. color, size)
Rendering: generating image from geometric data
Figure 2: Visualization pipeline (image courtesy of www.infovis-wiki.net).

Outline Introduction Visualization with ParaView Showcases Resources and further reading
Data Structure
Data structure is a way of exporting and organizing simulated data. It alsodefines applicability of some visualization techniques (e.g. operations on fielddimensions are not applicable with unstructured mesh).
Types of grids
Structured: nodes arrayed on a one-, two- or three-dimensional hexagonalgrid in which the conectivity between the nodes is implied by dimensions
Figure 3: Uniform, rectlinear and irregular 2D structured grid (image courtesy of AICT, University of Alberta).

Outline Introduction Visualization with ParaView Showcases Resources and further reading
Data Structure
Data structure is a way of exporting and organizing simulated data. It alsodefines applicability of some visualization techniques (e.g. operations on fielddimensions are not applicable with unstructured mesh).
Types of grids
Structured: nodes arrayed on a one-, two- or three-dimensional grid inwhich the conectivity between the nodes is implied by dimensions
Unstructured: nodes exist in space and can be connected together in acertain order of line, triangle, tetrahedral, etc., together they form Cells
Figure 4: Unstructured grids formed by a set points (image courtesy of AICT, University of Alberta).

Outline Introduction Visualization with ParaView Showcases Resources and further reading
Data Structure
Data structure is a way of exporting and organizing simulated data. It alsodefines applicability of some visualization techniques (e.g. operations on fielddimensions are not applicable with unstructured mesh).
Types of data
Point data: data specified ateach grid point
Cell data: data specified per cell
Figure 5: Cell and point data.

Outline Introduction Visualization with ParaView Showcases Resources and further reading
Visualization Toolkit (VTK) Data Format
VTK is an open-source, object-oriented software system for computer graphics,visualization and image processing [VTK User’s Guide, 2006. Kitware, Inc.]. Itprovides variety of data representations such as structured, rectlinear, point setsand polygonal data. An overview of file format used in this workshop is givenbelow:
Figure 6: Example of file created from LBM simulation.
Further information can be found in The VTK Users Guide

Outline Introduction Visualization with ParaView Showcases Resources and further reading
Why ParaView?
Paraview is an open-source, multi-platform application for the visualization
and analysis of scientific data set. It was developed to analyze large data set on
variety of computing resources.
Pros
Freely available (download from www.paraview.org)
Design for visualization of large data (in parallel)
Available in large variety of platforms
Open, flexible and intuitive user interface
Cons
Data file format is not easy to modify (before today)
Frequent upgrades and changes (without fully update online info)
No refresh botton!!!
ParaView User’s Guide (v3.10)

Outline Introduction Visualization with ParaView Showcases Resources and further reading
ParaView Interface
Figure 7: ParaView (version 3.10) user interface.
Outline Introduction Visualization with ParaView Showcases Resources and further reading
Loading Data
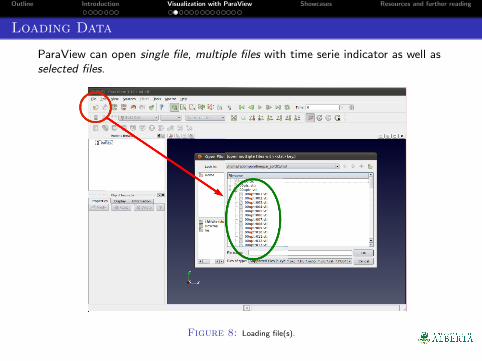
ParaView can open single file, multiple files with time serie indicator as well asselected files.
Figure 8: Loading file(s).

Outline Introduction Visualization with ParaView Showcases Resources and further reading
View Controls
The object in view window can be controlled directly on-screen by themovement of mouse. Additionally, view controls tool can be found on the toolsbar.
Figure 9: View controls.

Outline Introduction Visualization with ParaView Showcases Resources and further reading
Mesh
A mesh consists cells (elements, zones) generated by connecting a set ofvertices (points) together. Cell type and its connection are defined by thetopology of the data.
Figure 10: Cells and vertices.

Outline Introduction Visualization with ParaView Showcases Resources and further reading
Attributes
An attribute can be scalar, vector or tensor defined in the raw data. It definesvalue of a field over the mesh. In the example below, the vertices’ attribute(velocity magnitude) is shown.
Figure 11: Contour plot of velocity fields.

Outline Introduction Visualization with ParaView Showcases Resources and further reading
Pipeline
Navigation of data manipulation in ParaView is shown on the pipeline browser.The pipeline process does not modify the raw data. Instead, it copies andperates on unmodified data. Operations will be carried out only with theselected data set.
Figure 12: Pipeline showing two sets of data.

Outline Introduction Visualization with ParaView Showcases Resources and further reading
Filters
Filters modify data in particular way to deliver the modified data as output.Various filters available in ParaView. They can be found on the tools bar andin the filters menu. Applicability of some filters may depend on data structure.
Figure 13: Filters toolbar and filters menu.

Outline Introduction Visualization with ParaView Showcases Resources and further reading
Contour
A contour plot represents a graphic relation between spatial position (e.g. in xand y) and the quantity of interest. It can be plotted as interpolated color andcurves.
Figure 14: Velocity contour plot of flow pass a circle.
Outline Introduction Visualization with ParaView Showcases Resources and further reading
Color Scale
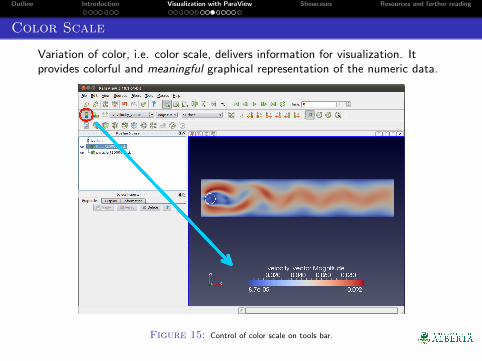
Variation of color, i.e. color scale, delivers information for visualization. Itprovides colorful and meaningful graphical representation of the numeric data.
Figure 15: Control of color scale on tools bar.

Outline Introduction Visualization with ParaView Showcases Resources and further reading
Color Scale Editor
ParaView offers controls of color scale via its editor, i.e. the icon next to thecolor scale on the tools bar.
Figure 16: Controls of color scale editor.

Outline Introduction Visualization with ParaView Showcases Resources and further reading
Vector Fields
Vector glyph can be used to display additional dimension attached to data.The direction and length (or color) of glyphs (arrows) are provided by thevector field.
Figure 17: Velocity vector field.

Outline Introduction Visualization with ParaView Showcases Resources and further reading
Streamlines
A stream line is a line in the tangential direction to the vector field at everypoints along the line. Stream lines show the flow direction that fluid elementwill travel in time.
Figure 18: Stream lines of fluid velocity.

Outline Introduction Visualization with ParaView Showcases Resources and further reading
Vorticity
Vorticity represents the amount of rotation in a fluid. It is defined as the curl ofof the fluid velocity field. In ParaView, vorticity can be obtained directly fromthe filter Compute Derivatives in filter menu.
Figure 19: Vorticity plot of flow pass a circle.
Outline Introduction Visualization with ParaView Showcases Resources and further reading
Save data and animation
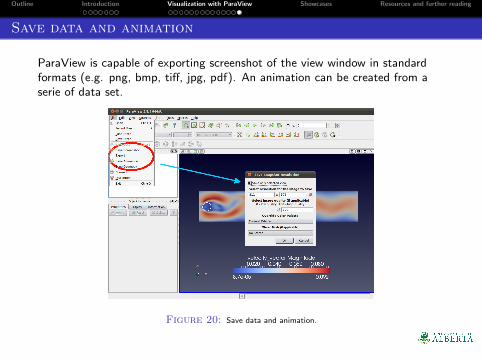
ParaView is capable of exporting screenshot of the view window in standardformats (e.g. png, bmp, tiff, jpg, pdf). An animation can be created from aserie of data set.
Figure 20: Save data and animation.

Outline Introduction Visualization with ParaView Showcases Resources and further reading
Streamlines of flow in a chamber
Figure 21: Streamlines of flow in a chamber. The streamlines are colored by the velocity magnitude

Outline Introduction Visualization with ParaView Showcases Resources and further reading
Simulation of a gas-liquid stirred reactor
Figure 22: Simulation result of a gas-liquid stirred reactor. Bubbles are represented by sphere glyphs andscaled by its diameter. The contour plot shows the liquid velocity contour at the mid-plane between baffles.

Outline Introduction Visualization with ParaView Showcases Resources and further reading
3D animation of a gas-liquid stirred reactor (1)
Figure 23: 3D (anaglyph) animation of bubble dispersion in a gas-liquid stirred reactor from front.

Outline Introduction Visualization with ParaView Showcases Resources and further reading
3D animation of a gas-liquid stirred reactor (2)
Figure 24: 3D (anaglyph) animation of bubble dispersion in a gas-liquid stirred reactor from top.

Outline Introduction Visualization with ParaView Showcases Resources and further reading
Resources and further reading
ParaView website (www.paraview.org)
ParaView user’s guide
AICT, University of Alberta website(http://sciviz.aict.ualberta.ca/index.php?page=intro)
W.J. Shroeder, L.S. Avila, W. Hoffmann, Visualizing with VTK: Atutorial. Kitware. 2000.
Introduction to ParaView by Pittsburgh supercomputer center(http://www.psc.edu/general/software/packages/paraview/tutorial/)
The VTK Users Guide (www.kitware.com)