introduction to the state performance plan (spp)/annual ... · introduction to the state...
TRANSCRIPT
Introduction to the State Performance Plan (SPP)/Annual Performance Report (APR)
General Supervision System:
The systems that are in place to ensure that IDEA Part C requirements are met, e.g., monitoring systems, dispute resolution systems.
The Lead Agency in Tennessee for Part C, Individuals with Disabilities Education Act (IDEA) is the State Department ofEducation (DOE). Tennessee's Early Intervention System (TEIS) is administered through the Division of Special Populations,out of the Early Childhood IDEA Programs (ECIP) unit.
Early Intervention Service (EIS) programs are defined as the nine TEIS-Point of Entry Offices (TEIS-POEs). Staff in theseoffices are State employees. Each POE has a District Administrator who reports directly to the state’s Part C Coordinator whohas oversight for the operation of the POE office. State personnel in these offices are responsible for referrals into the systemthrough exit from the system: 1) Part C eligibility determination and 2) all service coordination activities which include IFSPdevelopment, oversight of service delivery, and transition. TEIS-POEs utilize the TEIS Operations and Policy Manuals asresources for daily operations. Performances in the TEIS-POEs are measured through Specific Measurable AchievableRealistic Timely (SMART) Job plans; built upon responsibilities for federal compliance and child results.
In Tennessee the child’s official educational record is housed in a real-time, web-based data system. Tennessee EarlyIntervention Data System (TEIDS) contains the demographics; evaluation/eligibility information; Individualized FamilyService Plan (IFSP), including the transition plan; contact logs; service logs for delivered services; and an accounts payablesection for reimbursement of delivered services.
Monitoring activities are conducted through the following three avenues:
Annual Monitoring: Tennessee’s data management system enables the Lead Agency to track through desk audits theexistence of noncompliance and the verification for the correction of child level noncompliance. Full fiscal year censusdata from TEIDS are utilized annually for the monitoring of federal compliance Indicators 1, 7, and 8C. Compliance withIndicator 8A is maintained through a TEIDS validation. Compliance with Indicator 8B is addressed through quarterlydata sharing at the state level between Part C and Part B, 619 preschool. Compliance monitoring and the issuing ofwritten findings, when warranted, occur during September-October for the previous fiscal year.
1.
Dispute Resolution: Findings of noncompliance may be issued as an outcome of one of the three dispute resolutionprocesses (i.e., administrative complaint, mediation, due process). Identifying noncompliance and issuing a writtenfinding may occur at any time during the year.
2.
Focused Monitoring Activities: Activities may be either planned or conducted as needed. Planned focused monitoringactivities typically arise from possible IDEA or operational issues identified from Early Childhood IDEA Programsleadership which need further investigation. If warranted, focused monitoring is initiated when a particular concern isexpressed by someone outside of TEIS. Focused monitoring activities may occur at any time during the year.
3.
A written finding of noncompliance can be issued to an EIS program through any of the monitoring activities described above.When this occurs the Early Childhood IDEA Programs (ECIP) issues a letter of finding along with supporting data and aCorrective Action Plan (CAP) template.The Lead Agency utilizes direction from the federal Office of Special Education Program's (OSEP) 09-02 Memorandum andOSEP’s (9-8-08) Frequently Asked Questions (FAQS) Regarding Identification and Correction of Noncompliance and Reportingon Correction in the State Performance Plan/ Annual Performance Report when determining correction of noncompliance.When correction has been achieved, ECIP issues a letter confirming correction to the POE. The Lead Agency adheres to theOSEP's definition for timely correction – as soon as possible, but not more than one year from the date the finding was issued.The 09-02 Memorandum identifies a “two-prong approach” when determining correction. The Lead agency uses the followingsteps when determining correction as part of its system of general supervision:
Child-level correction (prong 1). When child-level noncompliance is discovered (e.g., a child has yet to receive an IFSPservice [Indicator 1], have a meeting [Indicators 7 or 8C], or any other child-level compliance issue), the child’s TEIDSidentification number is recorded within the TEIS-POE’s initial CAP template prepared by the Part C MonitoringCoordinator. Immediate attention and correction to any child-level noncompliance is expected. The Part C MonitoringCoordinator verifies correction by reviewing each child’s record where noncompliance was identified.
1.
Correct implementation of regulatory requirements (prong 2). A subsequent review of data is made relative to the findingin order for the Part C Monitoring Coordinator to verify that the TEIS-POE is correctly implementing the specificregulatory requirements. This entails a review of monthly, census data in TEIDS until 100% compliance is achieved.
2.
Pre-finding correction. The Office of Special Education Programs (OSEP) allows for the correction of noncompliancediscovered prior to the issuance of a written letter of finding. If an incident occurs, and when appropriate, the LeadAgency does not issue a finding. Pre-finding correction occurs through a verification of subsequent monthly, census data
3.
FFY 2013 Part C State Performance Plan (SPP)/Annual Performance Report (APR)
4/15/2015 Page 1 of 36
in TEIDS demonstrating 100% compliance and the correction of any previous child-level noncompliance prior to theissuance of a written finding.Completion of Corrective Action Plans (CAPs). The Lead Agency additionally utilizes a Corrective Action Plan as part ofits system of general supervision. The CAP provides the vehicle for the EIS program to identify systemic issues impactingnoncompliance addressing those issues through the development and implementation of a plan of correction. As part ofthe CAP development, the POE conducts a Root Cause Analysis (RCA) related to system issues across all children whichled to the noncompliance. Based on the results of the RCA, corrective action steps are developed which includeinformation regarding timelines and the identification of who is responsible for each action step. The Part C MonitoringCoordinator provides technical assistance to the POE for the development of the CAP. The CAP template becomes amonthly reporting and communication tool between the POE and the Part C Monitoring Coordinator. It is used todocument progress status until corrective actions/ measures have been implemented. The Lead Agency uses this thirdstep in the correction process to ensure EIS program leadership have identified and addressed local systemic issueswhich impact both POE status and state-level compliance.
4.
The Lead Agency also has a mechanism for improvement planning based on annual letters of determination issued to EISprograms (TEIS-POEs). Since spring 2013, program determinations algorithms have included both compliance and resultsindicator data. A rubric is used to calculate determinations: Meets Requirements, Needs Assistance, Needs Intervention, andNeeds Substantial Intervention. The Program Monitor provides technical assistance to any POE falling outside of "MeetsRequirements" for the development of an improvement plan.
Working with the Department of Education’s (DOE) legal office, the Lead Agency has processes in place to track, investigate,and resolve disputes filed on behalf of infants and toddlers in TEIS. Part C State Regulations have adopted Part B proceduresand timelines for processing all disputes filed. With support from the Part C Coordinator, TEIS-POEs are encouraged to resolveconcerns locally through the IFSP process. Administrative complaints filed are investigated and resolved by ECIP personnelwith guidance from DOE legal personnel. Requests for mediation and due process are handled by DOE legal personnel,working with the ECIP Executive Director and Part C Coordinator. Data regarding disputes are reported annually to the federalOffice of Special Education (OSEP) through the EDFacts Metadata and Process system (EMAPS).
Technical Assistance System:
The mechanisms that the State has in place to ensure the timely delivery of high quality, evidenced based technical assistance and support toearly intervention service (EIS) programs.
The Lead Agency’s technical assistance efforts are led by the Early Childhood IDEA Programs (ECIP) Quality ImprovementManager and staff. The Quality Improvement Team utilizes a professional development calendar that outlines all requiredtraining for TEIS-Point of Entry Offices (TEIS-POEs) staff, including:
Annual conference to provide training and support to TEIS-POE staff, topics selected based on needs assessment andmonitoring dataAnnual trainings on Early Childhood Outcomes (ECO), TEIS Operations Manual, and Routines-Based Interview (RBI)Annual specialty training for POE staff with topics chosen based on needs assessment and monitoring dataBi-Annual training for TEIS-POE staff responsible for utilizing the Battelle Development Inventory-2nd Edition (BDI-2) forPart C eligibility determination
In addition to the professional development calendar, the following training/technical assistance activities are provided by theQuality Improvement Team:
New Hire Training Packet used by TEIS-POE Leadership, with the support of the Quality Improvement Team, to provideonboarding training to all new hiresOnline resources available to TEIS-POE Leadership, called “Debriefs” on the following topics:
Early Childhood OutcomesTEIS Operations ManualRoutines Based Interview - Functional Goal DevelopmentTransition (Steps to Success and TEIS Transition [C to B])Targeted Case Management (TCM)Family-Centered Early Intervention Services
The Quality Improvement Team is currently developing the following new training/technical assistance resources forTEIS-POE staff:
Online BDI-2 training for all new hires, which is an addition to the one specifically for the staff (DevelopmentalSpecialists) who will be completing developmental evaluations, Spring 2015Peer newsletter for TEIS staff, which is developed by TEIS staff with support from the Quality Improvement Team, to
FFY 2013 Part C State Performance Plan (SPP)/Annual Performance Report (APR)
4/15/2015 Page 2 of 36
provide advice “from the field,” Summer 2015
The Quality Improvement Team is responsible for the development and dissemination of a monthly newsletter to EIRAs(service providers), vendors (service providers), TEIS-POEs, and others. The newsletter contains updates from the EarlyChildhood IDEA Programs central office and provides information about upcoming meetings or training.
Professional Development System:
The mechanisms the State has in place to ensure that service providers are effectively providing services that improve results for infantsand toddlers with disabilities and their families.
The Lead Agency’s professional development system is led by the ECIP Quality Improvement Manager and staff. The QualityImprovement Team is responsible for providing training, support, and technical assistance to ensure staff at Early InterventionResource Agencies (EIRAs) who provide developmental therapy services complete professional development activitiesrequired by their contracts. These activities, outlined below, are designed to support early interventionists (EIs) in providingevidence-based quality services to infants and toddlers and their families receiving early intervention services through TEIS.
Annual Building Best Practices Conference for EIRA staff. Content is developed by a committee consisting of both TEISstaff and EIRA representatives and is based on latest research in the field of early interventionOnline Professional Educational and Enrichment Resources (PEER) activities for EIRA staff to learn best practicetechniques within the field of early interventionOnline trainings, topics as follows:
Family-Centered Early InterventionGuidelines for Tennessee’s data management system Service Log entries
Contract requirement of 42 hours of training per full time equivalent (FTE) early interventionists (EIs). Training time ispro-rated for staff less than full time.EIRA Directors are required to observe one home visit per quarter for each EI working within their agency. Theobservation is documented on a TEIS developed questionnaire and entered into an online system (Survey Monkey). EIRA Directors are required to review EI staff Service Log entries monthly.
Stakeholder Involvement:
The mechanism for soliciting broad stakeholder input on targets in the SPP, including revisions to targets.
Tennessee's State Interagency Coordinating Council (SICC) is the primary stakeholder group for Tennessee's Early InterventionSystem (TEIS). The SICC was actively engaged in reviewing, considering, and providing input for Annual Performance Report(APR) result indicator targets.
Early Childhood IDEA Programs (ECIP) staff conducted a trend analysis of APR results indicators for the federal fiscal yearperiod of 2006-07 through 2013-14. This trend analysis included Tennessee’s targets and data with a comparison to nationalaverages, including national highs and lows. Indicator data were presented in a PowerPoint presentation. Trend data wereshared with ECIP Leadership who developed recommended FFY 2013-14 through 2018-19 targets for each results indicator.Target recommendations were presented to the SICC membership during the July 2014 meeting. SICC members and visitorsat the SICC meeting (i.e., TEIS Early Childhood IDEA Programs (ECIP) staff, TEIS District Administrators and other staff; EarlyIntervention Resource Agency (EIRA) representatives (service providers); and TEIS vendors (service providers) activelyparticipated in a discussion about targets for each results indicator. Both verbal and written feedback were collected. ECIP staffreviewed and considered all meeting feedback. Some recommended targets were modified based on stakeholder feedback. Inother cases stakeholder feedback confirmed proposed targets that ECIP staff had recommended.
At the Jan. 21, 2015 SICC meeting the full APR was reviewed. Targets for specific APR results indicators were revisited andadditional feedback gathered from both membership and visitors. All results indicator targets were finalized and approved bythe SICC membership for FFY 2013-14 through 2018-19. See attached for a signed copy of the Annual Report Certification ofthe Interagency Coordinating Council under Part C of the Individuals with Disabilities Education Act (IDEA).
Additionally, stakeholder input was sought relative to the development of the State Systemic Improvement Plan (SSIP), APRIndicator 11. Detailed information on stakeholder input associated with the SSIP will be submitted to OSEP, April 1, 2015.
Reporting to the Public:
How and where the State reported to the public on the FFY 2012 performance of each EIS Program or Provider located in the State on thetargets in the SPP/APR as soon as practicable, but no later than 120 days following the State’s submission of its FFY 2012 APR, as requiredby 34 CFR §300.602(b)(1)(i)(A); and a description of where, on its Web site, a complete copy of the State’s SPP, including any revision if the
FFY 2013 Part C State Performance Plan (SPP)/Annual Performance Report (APR)
4/15/2015 Page 3 of 36
State has revised the SPP that it submitted with its FFY 2012 APR in 2014, is available.
Federal report requirements for the performance of each Early Intervention Service (EIS) program (TEIS-POEs) against thestate’s State Performance Plan (SPP)/ Annual Performance Report (APR) targets are completed and posted on the State’swebsite no later than 120 day following the State’s submission of the Annual Performance Report, Feb. 2, 2015. This report isentitled, Report to the Public. The State’s APR will also be posted at the same location after the close of the federal period ofclarification. An email will be sent to SICC membership, TEIS stakeholders, and the Tennessee's Part C Federal OSEP contactinforming them of the postings and the website link. The FFY 2012-13 Report to the Public and Annual Performance Reportare currently available on the state’s website under “Reports” at http://tennessee.gov/education/early_learning/TEIS_reports.shtml.
FFY 2013 Part C State Performance Plan (SPP)/Annual Performance Report (APR)
4/15/2015 Page 4 of 36

Indicator 1: Timely provision of services
Baseline Data: 2005
Monitoring Priority: Early Intervention Services In Natural Environments
Compliance indicator: Percent of infants and toddlers with IFSPs who receive the early intervention services on their IFSPs in a timely manner.
(20 U.S.C. 1416(a)(3)(A) and 1442)
Historical Data
FFY 2005 2006 2007 2008 2009 2010 2011 2012
Target 100% 100% 100% 100% 100% 100% 100%
Data 90.96% 94.98% 89.05% 91.95% 97.26% 97.50% 98.38% 97.81%
Key: Gray – Data Prior to Baseline Yellow – Baseline
FFY 2013 - FFY 2018 Targets
FFY 2013 2014 2015 2016 2017 2018
Target 100% 100% 100% 100% 100% 100%
FFY 2013 SPP/APR Data
Prepopulated Data
Source Date Description Data Overwrite Data
SY 2013-14 ChildCount/Educational Environment
Data Groups9/24/2014 Total number of infants and toddlers with IFSPs 4,127 5,252
Explanation of Alternate Data
Data prepopulated into GRADS 360 were the State's Federal 618, December 1, 2013 Child Count Data. Child count datarepresent a point-in-time data collection and are not inclusive of every child who received Individualized Family Service Plan(IFSP) services in FFY 2013-14. The prepopulated data figure was overwritten to account for all children who received IFSPsservice beginning July 1, 2013 through June 30, 2014.
FFY 2013 SPP/APR Data
Number of infants and toddlers with IFSPswho receive the early intervention services
on their IFSPs in a timely manner
Total number of infants and toddlers withIFSPs
FFY 2012Data*
FFY 2013Target*
FFY 2013Data
4,714 5252 97.81% 100% 97.22%
Number of documented delays attributable to exceptional family circumstances (this number will be added to the Number of infants andtoddlers with IFSPs who receive their early intervention services on their IFSPs in a timely manner)
392
What is the source of the data provided for this indicator?
State monitoring
FFY 2013 Part C State Performance Plan (SPP)/Annual Performance Report (APR)
4/15/2015 Page 5 of 36

State database
Provide the time period in which the data were collected (e.g., September through December, fourth quarter, selectionfrom the full reporting period).
Federal Fiscal Year (FFY) 2013-14 data were reported: July 1, 2013 through Jun. 30, 2014.
Describe how the data accurately reflect data for infants and toddlers with IFSPs for the full reporting period.
Data account for the timely receipt of all services for a child rather than individual services. For example, if a child had threenew services initiated on an IFSP and any one of the three were delivered untimely, the child had untimely service delivery.Tennessee defines "timely services" as no longer than 30 days from the date of parent consent on the IFSP for a service.
Data from the Tennessee Early Intervention Data System (TEIDS) included full census data for all Part C eligible infants andtoddlers across all IFSP types (i.e., initial, six-month, annual, review change).
Annual data were pulled by the nine Tennessee Early Intervention System-Point of Entry (TEIS-POE) Data Managers andwere reviewed by TEIS-POE Leadership prior to submission to the Early Childhood IDEA Programs (ECIP) Part C MonitoringCoordinator. POE data reports accounted for reasons of untimely service delivery (i.e., family or system). A subsequent reviewof data was completed by ECIP monitoring staff in order to verify reasons for untimely service delivery.
Delays due to exceptional family circumstances documented in the child's record were included in both the numerator and thedenominator when calculating percentage of compliance of timely IFSP service delivery as follows:
Total # of Infants/
Toddlers with IFSPs
# of Infants/ Toddlers
with Timely Services
# of Infants/ Toddlerswith Untimely Services
Due to Exceptional
Family Circumstances
Total # of Infants/Toddlers with Timely
Service Delivery
5,252 4,714 392 5,106
Provide additional information about this indicator (optional)
All nine EIS programs (i.e., TEIS-POEs) were monitored. Three findings of noncompliance were issued in FFY 2014-15(monitoring cycle, FFY 2013-14) relative to Indicator 1. The other six programs corrected noncompliance prior to the issuanceof a written finding through pre-finding correction.
There were no findings of noncompliance issued for this indicator during FFY 2013-14 (monitoring cycle, FFY 2012-13).
The process for identification and correction of identified noncompliance is detailed in the Annual Performance Report (APR)Introduction under the section entitled, General Supervision System.
Actions required in FFY 2012 response table
None
Responses to actions required in FFY 2012 response table, not including correction of findings
Correction of Findings of Noncompliance Identified in FFY 2012
FFY 2013 Part C State Performance Plan (SPP)/Annual Performance Report (APR)
4/15/2015 Page 6 of 36

Findings of Noncompliance IdentifiedFindings of Noncompliance Verified
as Corrected Within One YearFindings of Noncompliance
Subsequently CorrectedFindings Not Yet Verified as Corrected
0
FFY 2013 Part C State Performance Plan (SPP)/Annual Performance Report (APR)
4/15/2015 Page 7 of 36
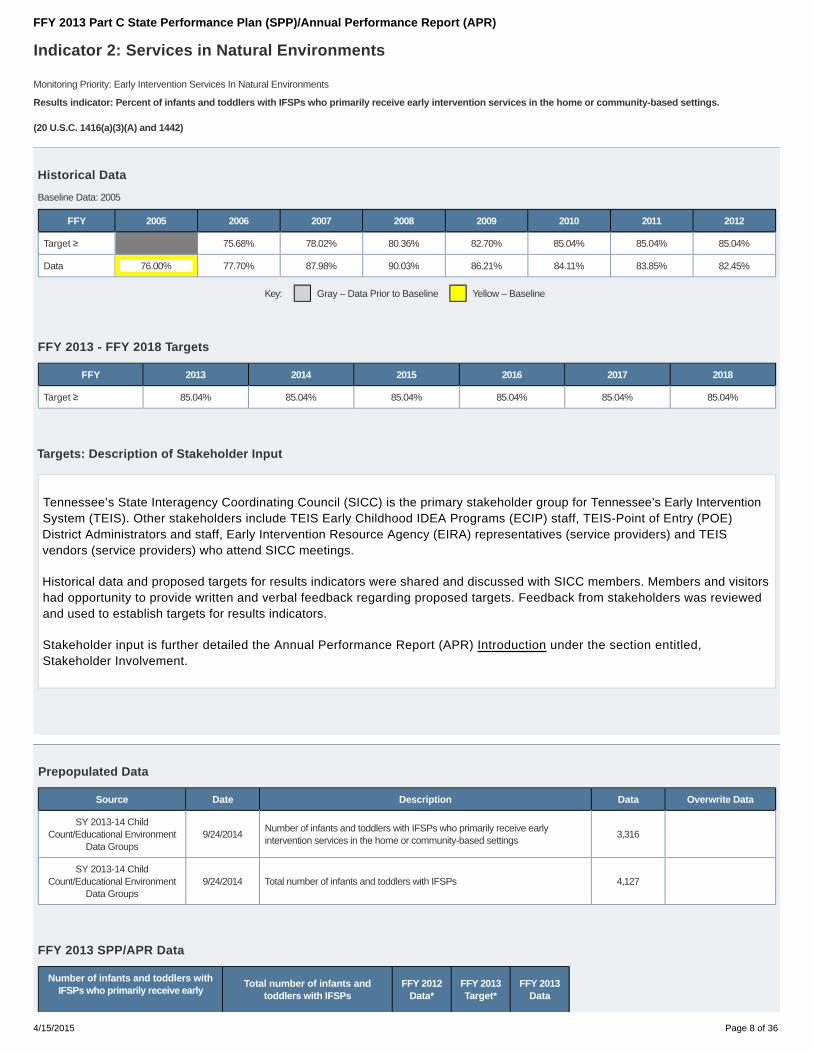
Indicator 2: Services in Natural Environments
Baseline Data: 2005
Monitoring Priority: Early Intervention Services In Natural Environments
Results indicator: Percent of infants and toddlers with IFSPs who primarily receive early intervention services in the home or community-based settings.
(20 U.S.C. 1416(a)(3)(A) and 1442)
Historical Data
FFY 2005 2006 2007 2008 2009 2010 2011 2012
Target ≥ 75.68% 78.02% 80.36% 82.70% 85.04% 85.04% 85.04%
Data 76.00% 77.70% 87.98% 90.03% 86.21% 84.11% 83.85% 82.45%
Key: Gray – Data Prior to Baseline Yellow – Baseline
FFY 2013 - FFY 2018 Targets
FFY 2013 2014 2015 2016 2017 2018
Target ≥ 85.04% 85.04% 85.04% 85.04% 85.04% 85.04%
Targets: Description of Stakeholder Input
Tennessee’s State Interagency Coordinating Council (SICC) is the primary stakeholder group for Tennessee’s Early InterventionSystem (TEIS). Other stakeholders include TEIS Early Childhood IDEA Programs (ECIP) staff, TEIS-Point of Entry (POE)District Administrators and staff, Early Intervention Resource Agency (EIRA) representatives (service providers) and TEISvendors (service providers) who attend SICC meetings.
Historical data and proposed targets for results indicators were shared and discussed with SICC members. Members and visitorshad opportunity to provide written and verbal feedback regarding proposed targets. Feedback from stakeholders was reviewedand used to establish targets for results indicators.
Stakeholder input is further detailed the Annual Performance Report (APR) Introduction under the section entitled,Stakeholder Involvement.
Prepopulated Data
Source Date Description Data Overwrite Data
SY 2013-14 ChildCount/Educational Environment
Data Groups9/24/2014
Number of infants and toddlers with IFSPs who primarily receive earlyintervention services in the home or community-based settings
3,316
SY 2013-14 ChildCount/Educational Environment
Data Groups9/24/2014 Total number of infants and toddlers with IFSPs 4,127
FFY 2013 SPP/APR Data
Number of infants and toddlers withIFSPs who primarily receive early
Total number of infants andtoddlers with IFSPs
FFY 2012Data*
FFY 2013Target*
FFY 2013Data
FFY 2013 Part C State Performance Plan (SPP)/Annual Performance Report (APR)
4/15/2015 Page 8 of 36
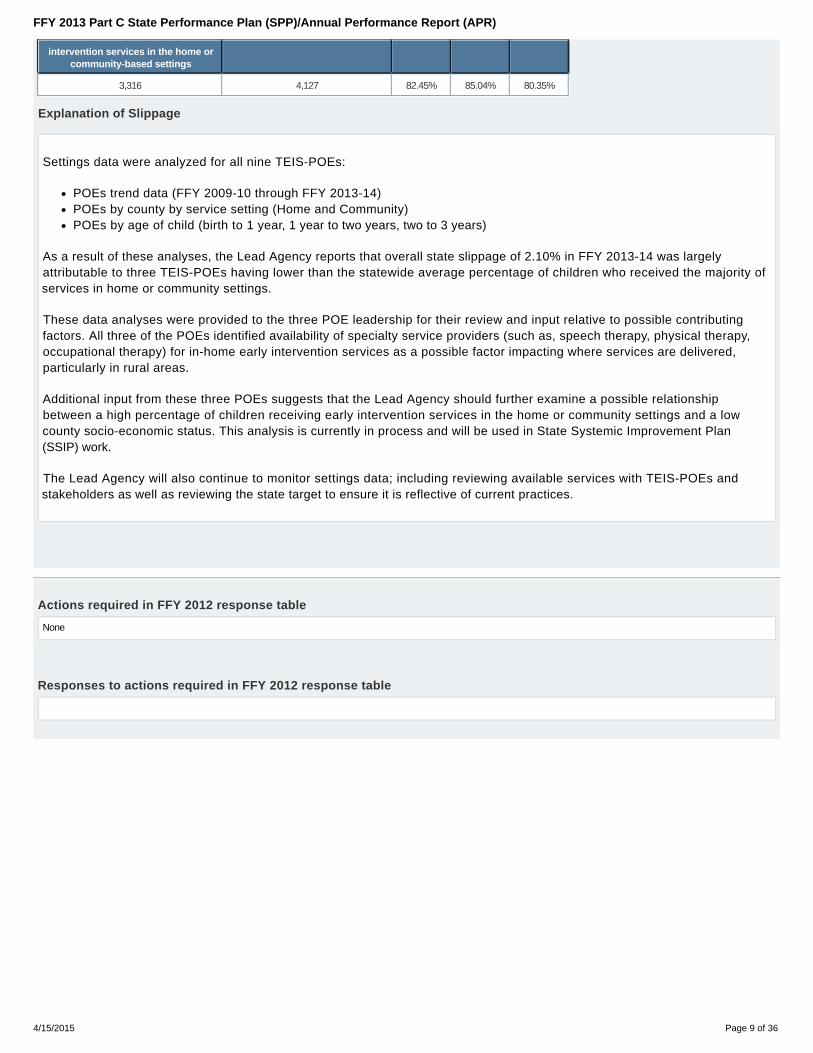
intervention services in the home orcommunity-based settings
3,316 4,127 82.45% 85.04% 80.35%
Explanation of Slippage
Settings data were analyzed for all nine TEIS-POEs:
POEs trend data (FFY 2009-10 through FFY 2013-14)POEs by county by service setting (Home and Community)POEs by age of child (birth to 1 year, 1 year to two years, two to 3 years)
As a result of these analyses, the Lead Agency reports that overall state slippage of 2.10% in FFY 2013-14 was largelyattributable to three TEIS-POEs having lower than the statewide average percentage of children who received the majority ofservices in home or community settings.
These data analyses were provided to the three POE leadership for their review and input relative to possible contributingfactors. All three of the POEs identified availability of specialty service providers (such as, speech therapy, physical therapy,occupational therapy) for in-home early intervention services as a possible factor impacting where services are delivered,particularly in rural areas.
Additional input from these three POEs suggests that the Lead Agency should further examine a possible relationshipbetween a high percentage of children receiving early intervention services in the home or community settings and a lowcounty socio-economic status. This analysis is currently in process and will be used in State Systemic Improvement Plan(SSIP) work.
The Lead Agency will also continue to monitor settings data; including reviewing available services with TEIS-POEs andstakeholders as well as reviewing the state target to ensure it is reflective of current practices.
Actions required in FFY 2012 response table
None
Responses to actions required in FFY 2012 response table
FFY 2013 Part C State Performance Plan (SPP)/Annual Performance Report (APR)
4/15/2015 Page 9 of 36
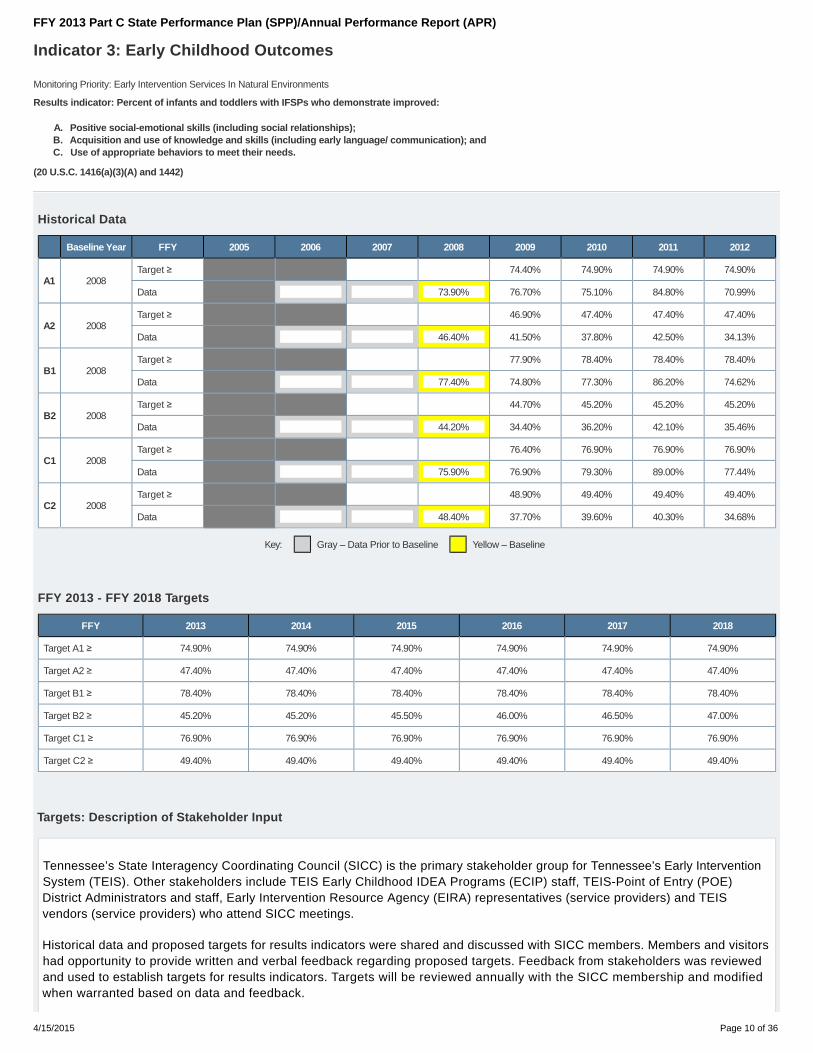
Indicator 3: Early Childhood Outcomes
Monitoring Priority: Early Intervention Services In Natural Environments
Results indicator: Percent of infants and toddlers with IFSPs who demonstrate improved:
Positive social-emotional skills (including social relationships);A.Acquisition and use of knowledge and skills (including early language/ communication); andB.Use of appropriate behaviors to meet their needs.C.
(20 U.S.C. 1416(a)(3)(A) and 1442)
Historical Data
Baseline Year FFY 2005 2006 2007 2008 2009 2010 2011 2012
A1 2008Target ≥ 74.40% 74.90% 74.90% 74.90%
Data 73.90% 76.70% 75.10% 84.80% 70.99%
A2 2008Target ≥ 46.90% 47.40% 47.40% 47.40%
Data 46.40% 41.50% 37.80% 42.50% 34.13%
B1 2008Target ≥ 77.90% 78.40% 78.40% 78.40%
Data 77.40% 74.80% 77.30% 86.20% 74.62%
B2 2008Target ≥ 44.70% 45.20% 45.20% 45.20%
Data 44.20% 34.40% 36.20% 42.10% 35.46%
C1 2008Target ≥ 76.40% 76.90% 76.90% 76.90%
Data 75.90% 76.90% 79.30% 89.00% 77.44%
C2 2008Target ≥ 48.90% 49.40% 49.40% 49.40%
Data 48.40% 37.70% 39.60% 40.30% 34.68%
Key: Gray – Data Prior to Baseline Yellow – Baseline
FFY 2013 - FFY 2018 Targets
FFY 2013 2014 2015 2016 2017 2018
Target A1 ≥ 74.90% 74.90% 74.90% 74.90% 74.90% 74.90%
Target A2 ≥ 47.40% 47.40% 47.40% 47.40% 47.40% 47.40%
Target B1 ≥ 78.40% 78.40% 78.40% 78.40% 78.40% 78.40%
Target B2 ≥ 45.20% 45.20% 45.50% 46.00% 46.50% 47.00%
Target C1 ≥ 76.90% 76.90% 76.90% 76.90% 76.90% 76.90%
Target C2 ≥ 49.40% 49.40% 49.40% 49.40% 49.40% 49.40%
Targets: Description of Stakeholder Input
Tennessee’s State Interagency Coordinating Council (SICC) is the primary stakeholder group for Tennessee’s Early InterventionSystem (TEIS). Other stakeholders include TEIS Early Childhood IDEA Programs (ECIP) staff, TEIS-Point of Entry (POE)District Administrators and staff, Early Intervention Resource Agency (EIRA) representatives (service providers) and TEISvendors (service providers) who attend SICC meetings.
Historical data and proposed targets for results indicators were shared and discussed with SICC members. Members and visitorshad opportunity to provide written and verbal feedback regarding proposed targets. Feedback from stakeholders was reviewedand used to establish targets for results indicators. Targets will be reviewed annually with the SICC membership and modifiedwhen warranted based on data and feedback.
FFY 2013 Part C State Performance Plan (SPP)/Annual Performance Report (APR)
4/15/2015 Page 10 of 36
Stakeholder input is further detailed the Annual Performance Report (APR) Introduction under the section entitled,Stakeholder Involvement.
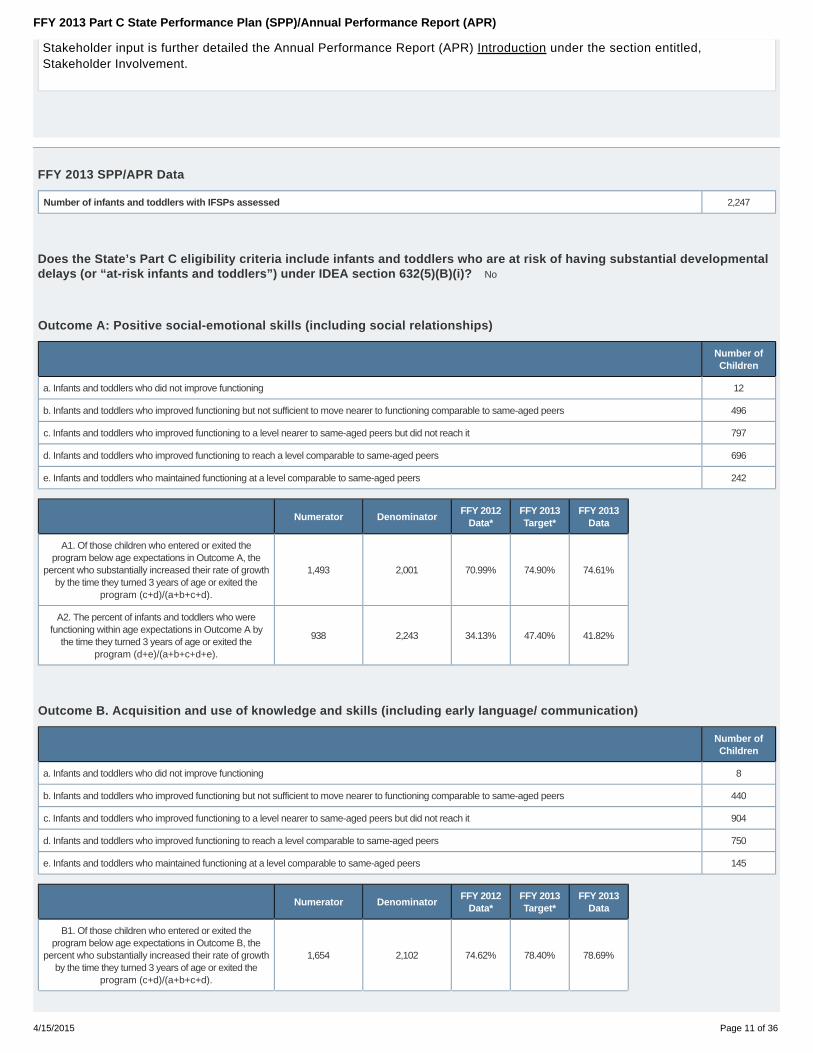
FFY 2013 SPP/APR Data
Number of infants and toddlers with IFSPs assessed 2,247
Does the State’s Part C eligibility criteria include infants and toddlers who are at risk of having substantial developmentaldelays (or “at-risk infants and toddlers”) under IDEA section 632(5)(B)(i)? No
Outcome A: Positive social-emotional skills (including social relationships)
Number ofChildren
a. Infants and toddlers who did not improve functioning 12
b. Infants and toddlers who improved functioning but not sufficient to move nearer to functioning comparable to same-aged peers 496
c. Infants and toddlers who improved functioning to a level nearer to same-aged peers but did not reach it 797
d. Infants and toddlers who improved functioning to reach a level comparable to same-aged peers 696
e. Infants and toddlers who maintained functioning at a level comparable to same-aged peers 242
Numerator DenominatorFFY 2012
Data*FFY 2013Target*
FFY 2013Data
A1. Of those children who entered or exited theprogram below age expectations in Outcome A, the
percent who substantially increased their rate of growthby the time they turned 3 years of age or exited the
program (c+d)/(a+b+c+d).
1,493 2,001 70.99% 74.90% 74.61%
A2. The percent of infants and toddlers who werefunctioning within age expectations in Outcome A by
the time they turned 3 years of age or exited theprogram (d+e)/(a+b+c+d+e).
938 2,243 34.13% 47.40% 41.82%
Outcome B. Acquisition and use of knowledge and skills (including early language/ communication)
Number ofChildren
a. Infants and toddlers who did not improve functioning 8
b. Infants and toddlers who improved functioning but not sufficient to move nearer to functioning comparable to same-aged peers 440
c. Infants and toddlers who improved functioning to a level nearer to same-aged peers but did not reach it 904
d. Infants and toddlers who improved functioning to reach a level comparable to same-aged peers 750
e. Infants and toddlers who maintained functioning at a level comparable to same-aged peers 145
Numerator DenominatorFFY 2012
Data*FFY 2013Target*
FFY 2013Data
B1. Of those children who entered or exited theprogram below age expectations in Outcome B, the
percent who substantially increased their rate of growthby the time they turned 3 years of age or exited the
program (c+d)/(a+b+c+d).
1,654 2,102 74.62% 78.40% 78.69%
FFY 2013 Part C State Performance Plan (SPP)/Annual Performance Report (APR)
4/15/2015 Page 11 of 36
Numerator DenominatorFFY 2012
Data*FFY 2013Target*
FFY 2013Data
B2. The percent of infants and toddlers who werefunctioning within age expectations in Outcome B by
the time they turned 3 years of age or exited theprogram (d+e)/(a+b+c+d+e).
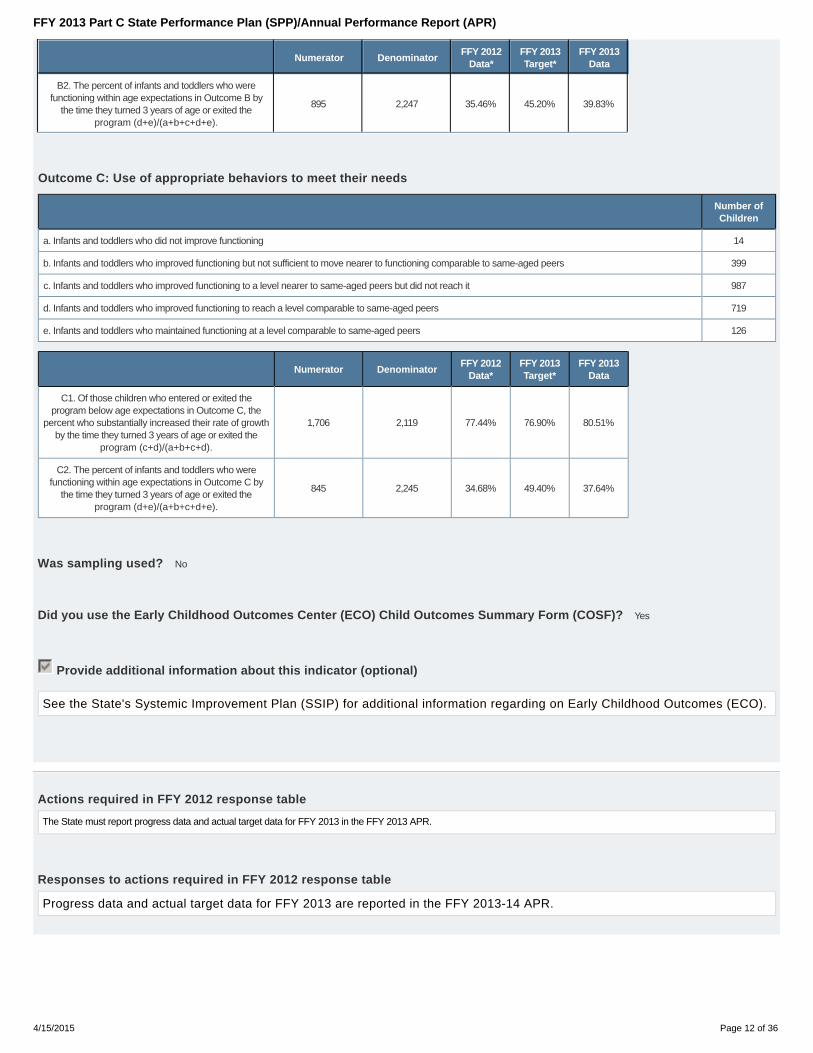
895 2,247 35.46% 45.20% 39.83%
Outcome C: Use of appropriate behaviors to meet their needs
Number ofChildren
a. Infants and toddlers who did not improve functioning 14
b. Infants and toddlers who improved functioning but not sufficient to move nearer to functioning comparable to same-aged peers 399
c. Infants and toddlers who improved functioning to a level nearer to same-aged peers but did not reach it 987
d. Infants and toddlers who improved functioning to reach a level comparable to same-aged peers 719
e. Infants and toddlers who maintained functioning at a level comparable to same-aged peers 126
Numerator DenominatorFFY 2012
Data*FFY 2013Target*
FFY 2013Data
C1. Of those children who entered or exited theprogram below age expectations in Outcome C, the
percent who substantially increased their rate of growthby the time they turned 3 years of age or exited the
program (c+d)/(a+b+c+d).
1,706 2,119 77.44% 76.90% 80.51%
C2. The percent of infants and toddlers who werefunctioning within age expectations in Outcome C by
the time they turned 3 years of age or exited theprogram (d+e)/(a+b+c+d+e).
845 2,245 34.68% 49.40% 37.64%
Was sampling used? No
Did you use the Early Childhood Outcomes Center (ECO) Child Outcomes Summary Form (COSF)? Yes
Provide additional information about this indicator (optional)
See the State's Systemic Improvement Plan (SSIP) for additional information regarding on Early Childhood Outcomes (ECO).
Actions required in FFY 2012 response table
The State must report progress data and actual target data for FFY 2013 in the FFY 2013 APR.
Responses to actions required in FFY 2012 response table
Progress data and actual target data for FFY 2013 are reported in the FFY 2013-14 APR.
FFY 2013 Part C State Performance Plan (SPP)/Annual Performance Report (APR)
4/15/2015 Page 12 of 36
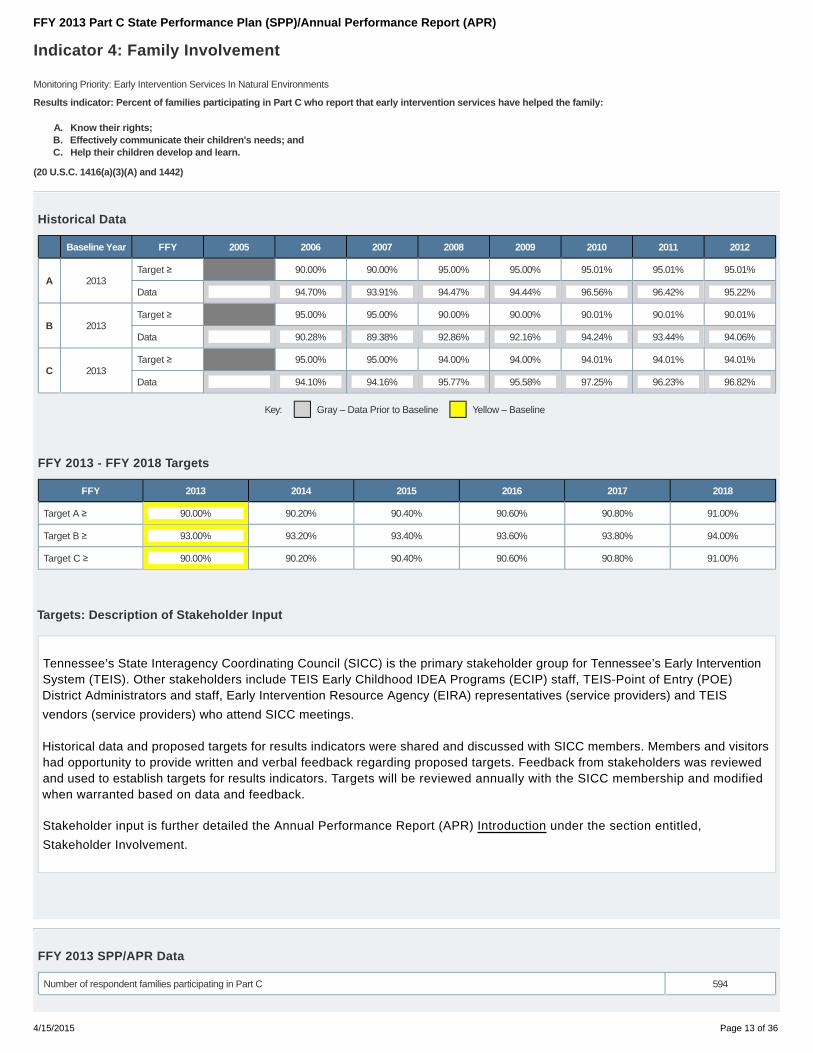
Indicator 4: Family Involvement
Monitoring Priority: Early Intervention Services In Natural Environments
Results indicator: Percent of families participating in Part C who report that early intervention services have helped the family:
Know their rights;A.Effectively communicate their children's needs; andB.Help their children develop and learn.C.
(20 U.S.C. 1416(a)(3)(A) and 1442)
Historical Data
Baseline Year FFY 2005 2006 2007 2008 2009 2010 2011 2012
A 2013Target ≥ 90.00% 90.00% 95.00% 95.00% 95.01% 95.01% 95.01%
Data 94.70% 93.91% 94.47% 94.44% 96.56% 96.42% 95.22%
B 2013Target ≥ 95.00% 95.00% 90.00% 90.00% 90.01% 90.01% 90.01%
Data 90.28% 89.38% 92.86% 92.16% 94.24% 93.44% 94.06%
C 2013Target ≥ 95.00% 95.00% 94.00% 94.00% 94.01% 94.01% 94.01%
Data 94.10% 94.16% 95.77% 95.58% 97.25% 96.23% 96.82%
Key: Gray – Data Prior to Baseline Yellow – Baseline
FFY 2013 - FFY 2018 Targets
FFY 2013 2014 2015 2016 2017 2018
Target A ≥ 90.00% 90.20% 90.40% 90.60% 90.80% 91.00%
Target B ≥ 93.00% 93.20% 93.40% 93.60% 93.80% 94.00%
Target C ≥ 90.00% 90.20% 90.40% 90.60% 90.80% 91.00%
Targets: Description of Stakeholder Input
Tennessee’s State Interagency Coordinating Council (SICC) is the primary stakeholder group for Tennessee’s Early InterventionSystem (TEIS). Other stakeholders include TEIS Early Childhood IDEA Programs (ECIP) staff, TEIS-Point of Entry (POE)District Administrators and staff, Early Intervention Resource Agency (EIRA) representatives (service providers) and TEIS
vendors (service providers) who attend SICC meetings.
Historical data and proposed targets for results indicators were shared and discussed with SICC members. Members and visitorshad opportunity to provide written and verbal feedback regarding proposed targets. Feedback from stakeholders was reviewedand used to establish targets for results indicators. Targets will be reviewed annually with the SICC membership and modifiedwhen warranted based on data and feedback.
Stakeholder input is further detailed the Annual Performance Report (APR) Introduction under the section entitled,
Stakeholder Involvement.
FFY 2013 SPP/APR Data
Number of respondent families participating in Part C 594
FFY 2013 Part C State Performance Plan (SPP)/Annual Performance Report (APR)
4/15/2015 Page 13 of 36

A1. Number of respondent families participating in Part C who report that early intervention services have helped the family know their rights 448
A2. Number of responses to the question of whether early intervention services have helped the family know their rights 594
B1. Number of respondent families participating in Part C who report that early intervention services have helped the family effectively communicatetheir children's needs
466
B2. Number of responses to the question of whether early intervention services have helped the family effectively communicate their children's needs 594
C1. Number of respondent families participating in Part C who report that early intervention services have helped the family help their children developand learn
443
C2. Number of responses to the question of whether early intervention services have helped the family help their children develop and learn 594
FFY 2012Data*
FFY 2013Target*
FFY 2013Data
A. Percent of families participating in Part C who report that early intervention services havehelped the family know their rights
95.22% 90.00% 75.42%
B. Percent of families participating in Part C who report that early intervention services havehelped the family effectively communicate their children's needs
94.06% 93.00% 78.45%
C. Percent of families participating in Part C who report that early intervention services havehelped the family help their children develop and learn
96.82% 90.00% 74.58%
Explanation of A Slippage
Slippage in FFY 2013-14 was attributable a change in the survey instrument from a revised version of the National Center forSpecial Education Accountability and Monitoring (NCSEAM) Survey to Section B, Early Childhood Outcomes (ECO) FamilyOutcomes Survey-Revised (FOS-R). The FOS-R is a more robust instrument which asks families multiple questions to answereach of the three sub-indicators. ECO recommended methodology for calculation was utilized; families who met the criteriafor each indicator had a mean value of 4.0 or greater on associated items for each sub-indicator. See attached copy of theECO FOS-R survey.
The survey methodology in FFY 2013-14 continued as a point-in-time distribution to all families of Part C eligible infants andtoddlers with active IFSPs who have been in TEIS for a minimum of six months. Beginning FFY 2014-15 the Lead Agencyimplemented a new, year-round distribution method with surveys hand-delivered to families by service coordinators at everysix-month and annual IFSP meeting. Families have the option of completing either a paper or online version of the survey.
Targets were revised beginning FFY 2013-14 through FFY 2018-19 based on implementation of the new, more robust surveyinstrument (ECO FOS-R) as well as a review of the first six months of data from FFY 2014-15 in which the new distributionmethod was utilized.
Explanation of B Slippage
Slippage in FFY 2013-14 was attributable a change in the survey instrument from a revised version of the National Center forSpecial Education Accountability and Monitoring (NCSEAM) Survey to Section B, Early Childhood Outcomes (ECO) FamilyOutcomes Survey-Revised (FOS-R). The FOS-R is a more robust instrument which asks families multiple questions to answereach of the three sub-indicators. ECO recommended methodology for calculation was utilized; families who met the criteriafor each indicator had a mean value of 4.0 or greater on associated items for each sub-indicator. See attached copy of theECO FOS-R survey.
The survey methodology in FFY 2013-14 continued as a point-in-time distribution to all families of Part C eligible infants andtoddlers with active IFSPs who have been in TEIS for a minimum of six months. Beginning FFY 2014-15 the Lead Agencyimplemented a new, year-round distribution method with surveys hand-delivered to families by service coordinators at everysix-month and annual IFSP meeting. Families have the option of completing either a paper or online version of the survey.
Targets were revised beginning FFY 2013-14 through FFY 2018-19 based on implementation of the new, more robust surveyinstrument (ECO FOS-R) as well as a review of the first six months of data from FFY 2014-15 in which the new distributionmethod was utilized.
Explanation of C Slippage
FFY 2013 Part C State Performance Plan (SPP)/Annual Performance Report (APR)
4/15/2015 Page 14 of 36

Slippage in FFY 2013-14 was attributable a change in the survey instrument from a revised version of the National Center forSpecial Education Accountability and Monitoring (NCSEAM) Survey to Section B, Early Childhood Outcomes (ECO) FamilyOutcomes Survey-Revised (FOS-R). The FOS-R is a more robust instrument which asks families multiple questions to answereach of the three sub-indicators. ECO recommended methodology for calculation was utilized; families who met the criteriafor each indicator had a mean value of 4.0 or greater on associated items for each sub-indicator. See attached copy of theECO FOS-R survey.
The survey methodology in FFY 2013-14 continued as a point-in-time distribution to all families of Part C eligible infants andtoddlers with active IFSPs who have been in TEIS for a minimum of six months. Beginning FFY 2014-15 the Lead Agencyimplemented a new, year-round distribution method with surveys hand-delivered to families by service coordinators at everysix-month and annual IFSP meeting. Families have the option of completing either a paper or online version of the survey.
Targets were revised beginning FFY 2013-14 through FFY 2018-19 based on implementation of the new, more robust surveyinstrument (ECO FOS-R) as well as a review of the first six months of data from FFY 2014-15 in which the new distributionmethod was utilized.
Describe how the State has ensured that any response data are valid and reliable, including how the data represent thedemographics of the State.
The Lead Agency administers a census-based survey. All families of Part C eligible infants and toddlers with active IFSPs whohave been in TEIS for a minimum of six months were identified for the survey and contact was attempted to administer thesurvey. Point in time family contact information was pulled March 18, 2013. Contact information (i.e., emails, mailingaddresses) was pulled from the Tennessee Early Intervention Data System (TEIDS). Two options to complete the survey wereprovided: online and hard paper copy sent through the mail. Both options included English and Spanish formats.
All families with known email addresses were sent an email inviting them to complete the online survey. Three reminderemails were sent. Paper surveys were mailed to families not yet responding to the online survey and to those without emailaddresses. The online option was available throughout the entire administration period, April through June 2014. A check forduplicates (paper and online) ensured only one response per family was included in the final analysis. In FFY 2013-14,surveys were disseminated to 2,443 families with 594 (24.3%) providing useable responses.
Due to the smaller numbers of potential respondents and actual responses by minority race/ethnicities (American Indian,Asian, Black, Hawaiian/Pacific Islander, Hispanic, and Multiple Races) these groups were combined and compared to with themajority race/ethnicity (White). Despite conducting a census-based survey, the response rate of the combined minoritypopulation was relatively low at 17.0% in contrast to the response rate of 27.5% for the majority population. The level ofagreement for White respondents was slightly higher for sub-indicators A (know your rights) and B (communicating your child’sneeds) while combined minority population scored C (helping your child develop and learn) higher.
Levels of confidence were run to compare results of the White and the combined minority population. Across sub-indicators A,B, C White respondents had margins of error (at 95% confidence level) ranging from 3.1 – 3.4, compared with margins of errorfor the combined minority population from 6.75 – 7.11. A smaller margin of error translates to higher confidence in the data.TEIS anticipates that implementing a year-round survey will increase overall response rate as well as response rate forminority respondents.
Slippage in FFY 2013-14 was not unexpected due the change to a more rigorous survey instrument. Beginning FFY 2014-15the Section B, ECO FOS-R survey is administered year-round with surveys hand-delivered to families by service coordinators at
every six-month and annual IFSP meeting. The link to the online survey is continually available for families.
Was sampling used? No
Was a collection tool used? Yes
Is it a new or revised collection tool? Yes
Yes, the data accurately represent the demographics of the State
No, the data does not accurately represent the demographics of the State
FFY 2013 Part C State Performance Plan (SPP)/Annual Performance Report (APR)
4/15/2015 Page 15 of 36

Submitted collection tool: TEIS Family Survey
Actions required in FFY 2012 response table
In the FFY 2013 APR, the State must report whether its FFY 2013 data are from a group representative of the population, and, if not, the actions the State is taking to address thisissue.
Responses to actions required in FFY 2012 response table, not including correction of findings
The Lead Agency conducted a census-based family survey in FFY2013-14. All families of Part C eligible infants and toddlersin Tennessee with active IFSPs during FFY 2013-14 who had been in the Part C system a minimum of six months wereeligible and contact was attempted to include them in the survey. Point in time family contact information was pulled onMarch 19, 2014 and provided to East Tennessee State University (ETSU), a third party vendor, for administration of the survey.
As in previous years the response rate, particularly the response rate of minorities, was relatively low. In an effort to improveresponse rate, The Lead Agency moved to a census-based year-round survey in FFY 2014-15. The year-round survey allowsparents to complete the survey at any time throughout the year. At each annual and six-month review, the parents areprovided a hard copy with an online link and encouraged to complete the survey. Both online and paper surveys are receiveddirectly by ETSU. This change in survey administration has provided preliminary evidence of an increase in response rates.Preliminary data for the first six months of FFY 2014-15 show an increase in the average number of monthly respondents at arate that is 50% over FFY 2013-14. Although actual respondent race/ethnicity data are not yet available for FFY 2014-15, it isanticipated that response rates will increase across all races/ethnicities.
FFY 2013 Part C State Performance Plan (SPP)/Annual Performance Report (APR)
4/15/2015 Page 16 of 36
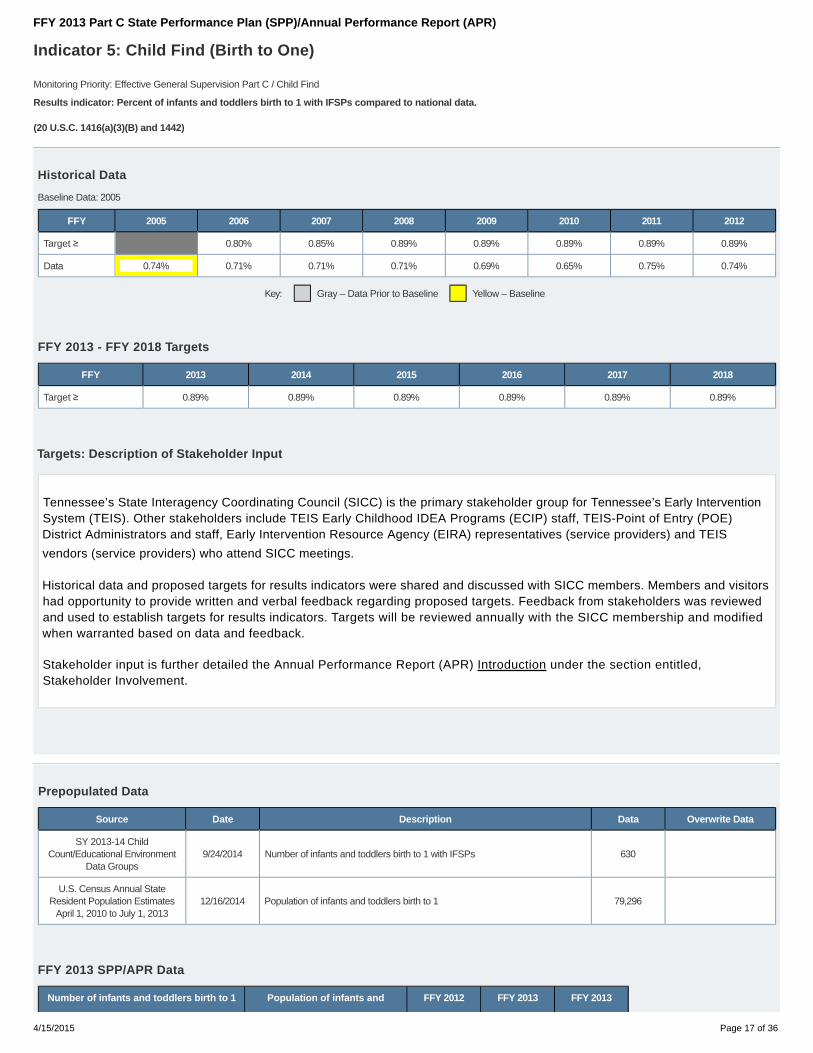
Indicator 5: Child Find (Birth to One)
Baseline Data: 2005
Monitoring Priority: Effective General Supervision Part C / Child Find
Results indicator: Percent of infants and toddlers birth to 1 with IFSPs compared to national data.
(20 U.S.C. 1416(a)(3)(B) and 1442)
Historical Data
FFY 2005 2006 2007 2008 2009 2010 2011 2012
Target ≥ 0.80% 0.85% 0.89% 0.89% 0.89% 0.89% 0.89%
Data 0.74% 0.71% 0.71% 0.71% 0.69% 0.65% 0.75% 0.74%
Key: Gray – Data Prior to Baseline Yellow – Baseline
FFY 2013 - FFY 2018 Targets
FFY 2013 2014 2015 2016 2017 2018
Target ≥ 0.89% 0.89% 0.89% 0.89% 0.89% 0.89%
Targets: Description of Stakeholder Input
Tennessee’s State Interagency Coordinating Council (SICC) is the primary stakeholder group for Tennessee’s Early InterventionSystem (TEIS). Other stakeholders include TEIS Early Childhood IDEA Programs (ECIP) staff, TEIS-Point of Entry (POE)District Administrators and staff, Early Intervention Resource Agency (EIRA) representatives (service providers) and TEIS
vendors (service providers) who attend SICC meetings.
Historical data and proposed targets for results indicators were shared and discussed with SICC members. Members and visitorshad opportunity to provide written and verbal feedback regarding proposed targets. Feedback from stakeholders was reviewedand used to establish targets for results indicators. Targets will be reviewed annually with the SICC membership and modifiedwhen warranted based on data and feedback.
Stakeholder input is further detailed the Annual Performance Report (APR) Introduction under the section entitled,Stakeholder Involvement.
Prepopulated Data
Source Date Description Data Overwrite Data
SY 2013-14 ChildCount/Educational Environment
Data Groups9/24/2014 Number of infants and toddlers birth to 1 with IFSPs 630
U.S. Census Annual StateResident Population Estimates
April 1, 2010 to July 1, 201312/16/2014 Population of infants and toddlers birth to 1 79,296
FFY 2013 SPP/APR Data
Number of infants and toddlers birth to 1 Population of infants and FFY 2012 FFY 2013 FFY 2013
FFY 2013 Part C State Performance Plan (SPP)/Annual Performance Report (APR)
4/15/2015 Page 17 of 36
with IFSPs toddlers birth to 1 Data* Target* Data
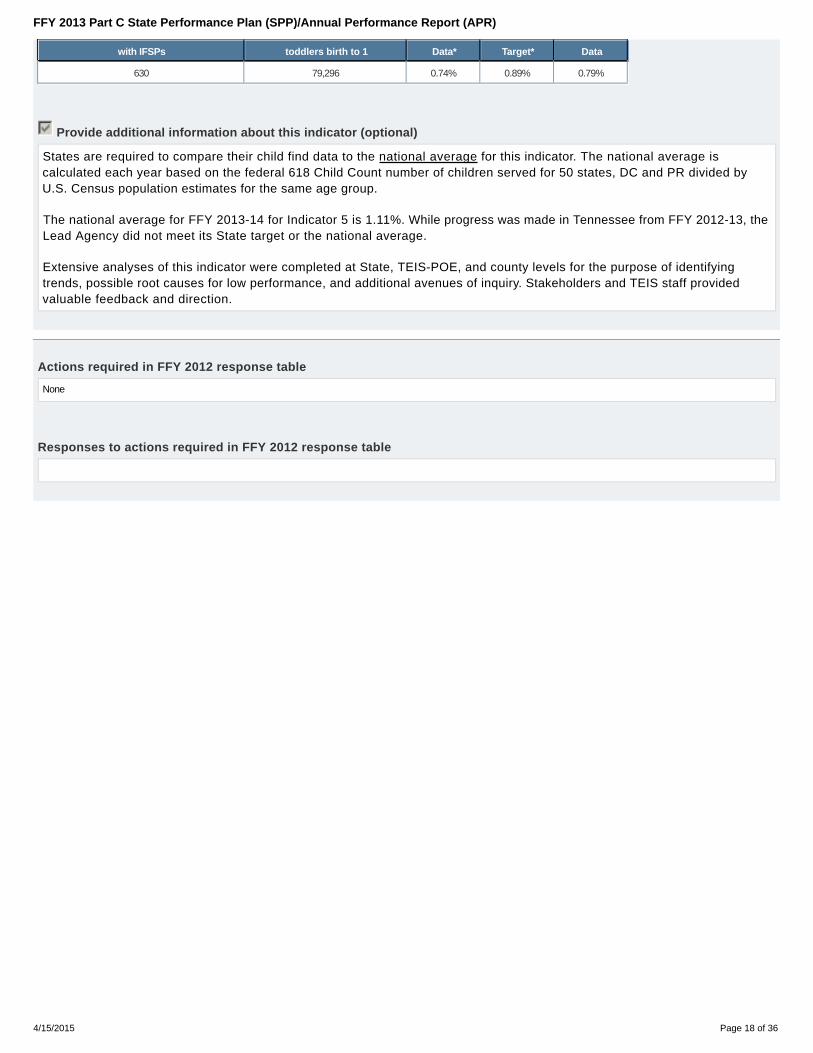
630 79,296 0.74% 0.89% 0.79%
Provide additional information about this indicator (optional)
States are required to compare their child find data to the national average for this indicator. The national average iscalculated each year based on the federal 618 Child Count number of children served for 50 states, DC and PR divided byU.S. Census population estimates for the same age group.
The national average for FFY 2013-14 for Indicator 5 is 1.11%. While progress was made in Tennessee from FFY 2012-13, theLead Agency did not meet its State target or the national average.
Extensive analyses of this indicator were completed at State, TEIS-POE, and county levels for the purpose of identifyingtrends, possible root causes for low performance, and additional avenues of inquiry. Stakeholders and TEIS staff providedvaluable feedback and direction.
Actions required in FFY 2012 response table
None
Responses to actions required in FFY 2012 response table
FFY 2013 Part C State Performance Plan (SPP)/Annual Performance Report (APR)
4/15/2015 Page 18 of 36

Indicator 6: Child Find (Birth to Three)
Baseline Data: 2005
Monitoring Priority: Effective General Supervision Part C / Child Find
Results indicator: Percent of infants and toddlers birth to 3 with IFSPs compared to national data.
(20 U.S.C. 1416(a)(3)(B) and 1442)
Historical Data
FFY 2005 2006 2007 2008 2009 2010 2011 2012
Target ≥ 2.00% 2.07% 2.24% 2.37% 2.37% 2.37% 2.37%
Data 1.80% 1.68% 1.80% 1.72% 1.65% 1.67% 1.68% 1.66%
Key: Gray – Data Prior to Baseline Yellow – Baseline
FFY 2013 - FFY 2018 Targets
FFY 2013 2014 2015 2016 2017 2018
Target ≥ 2.37% 2.37% 2.37% 2.37% 2.37% 2.37%
Targets: Description of Stakeholder Input
Tennessee’s State Interagency Coordinating Council (SICC) is the primary stakeholder group for Tennessee’s Early InterventionSystem (TEIS). Other stakeholders include TEIS Early Childhood IDEA Programs (ECIP) staff, TEIS-Point of Entry (POE)District Administrators and staff, Early Intervention Resource Agency (EIRA) representatives (service providers) and TEIS
vendors (service providers) who attend SICC meetings.
Historical data and proposed targets for results indicators were shared and discussed with SICC members. Members and visitorshad opportunity to provide written and verbal feedback regarding proposed targets. Feedback from stakeholders was reviewedand used to establish targets for results indicators. Targets will be reviewed annually with the SICC membership and modifiedwhen warranted based on data and feedback.
Stakeholder input is further detailed the Annual Performance Report (APR) Introduction under the section entitled,Stakeholder Involvement.
Prepopulated Data
Source Date Description Data Overwrite Data
SY 2013-14 ChildCount/Educational Environment
Data Groups9/24/2014 Number of infants and toddlers birth to 3 with IFSPs 4,127
U.S. Census Annual StateResident Population Estimates
April 1, 2010 to July 1, 201312/16/2014 Population of infants and toddlers birth to 3 238,186
FFY 2013 SPP/APR DataNumber of infants and toddlers birth
to 3 with IFSPsPopulation of infants and toddlers
birth to 3FFY 2012
Data*FFY 2013Target*
FFY 2013Data
FFY 2013 Part C State Performance Plan (SPP)/Annual Performance Report (APR)
4/15/2015 Page 19 of 36
Number of infants and toddlers birthto 3 with IFSPs
Population of infants and toddlersbirth to 3
FFY 2012Data*
FFY 2013Target*
FFY 2013Data
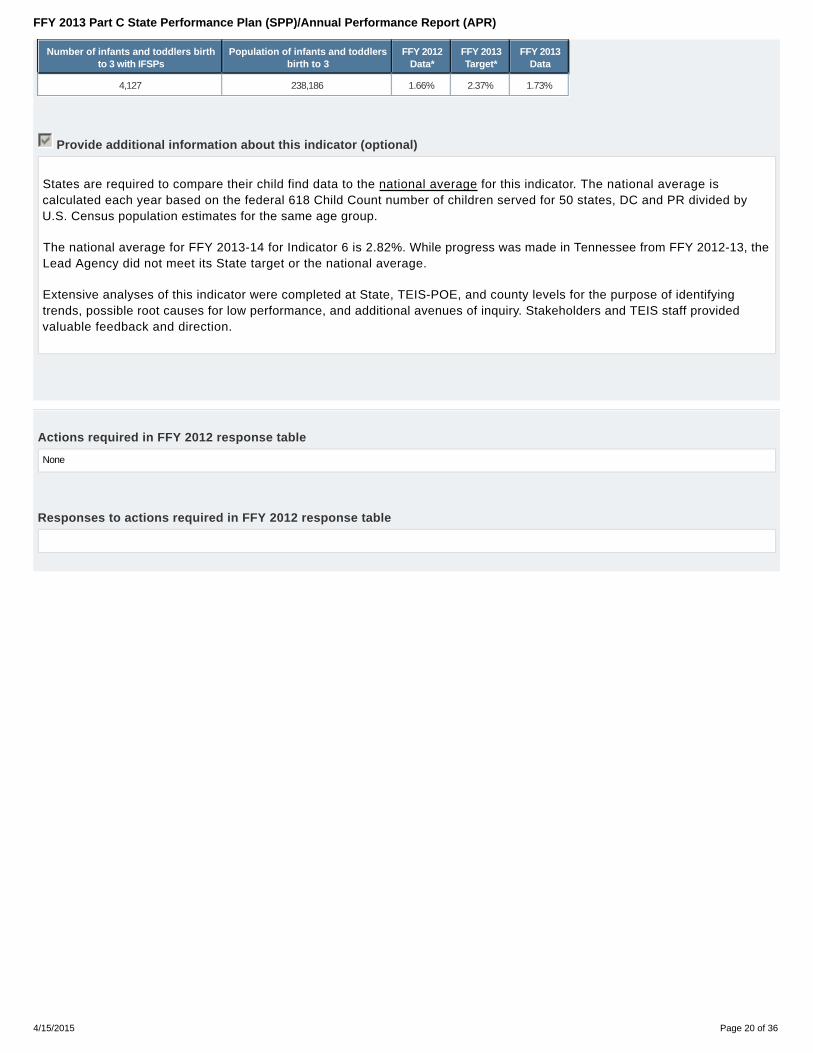
4,127 238,186 1.66% 2.37% 1.73%
Provide additional information about this indicator (optional)
States are required to compare their child find data to the national average for this indicator. The national average iscalculated each year based on the federal 618 Child Count number of children served for 50 states, DC and PR divided byU.S. Census population estimates for the same age group.
The national average for FFY 2013-14 for Indicator 6 is 2.82%. While progress was made in Tennessee from FFY 2012-13, theLead Agency did not meet its State target or the national average.
Extensive analyses of this indicator were completed at State, TEIS-POE, and county levels for the purpose of identifyingtrends, possible root causes for low performance, and additional avenues of inquiry. Stakeholders and TEIS staff providedvaluable feedback and direction.
Actions required in FFY 2012 response table
None
Responses to actions required in FFY 2012 response table
FFY 2013 Part C State Performance Plan (SPP)/Annual Performance Report (APR)
4/15/2015 Page 20 of 36

Indicator 7: 45-day timeline
Baseline Data: 2005
Monitoring Priority: Effective General Supervision Part C / Child Find
Compliance indicator: Percent of eligible infants and toddlers with IFSPs for whom an initial evaluation and initial assessment and an initial IFSP meeting wereconducted within Part C’s 45-day timeline.
(20 U.S.C. 1416(a)(3)(B) and 1442)
Historical Data
FFY 2005 2006 2007 2008 2009 2010 2011 2012
Target 100% 100% 100% 100% 100% 100% 100%
Data 86.00% 90.02% 84.61% 92.44% 91.73% 96.29% 98.30% 98.40%
Key: Gray – Data Prior to Baseline Yellow – Baseline
FFY 2013 - FFY 2018 Targets
FFY 2013 2014 2015 2016 2017 2018
Target 100% 100% 100% 100% 100% 100%
FFY 2013 SPP/APR Data
Number of eligible infants and toddlerswith IFSPs for whom an initial evaluation
and assessment and an initial IFSP meetingwas conducted within Part C’s 45-day
timeline
Number of eligible infants and toddlersevaluated and assessed for whom an initial
IFSP meeting was required to beconducted
FFY 2012Data*
FFY 2013Target*
FFY 2013Data
3,212 3,623 98.40% 100% 95.11%
Number of documented delays attributable to exceptional family circumstances (this number will be added to the Number of eligible infants andtoddlers with IFSPs for whom an initial evaluation and assessment and an initial IFSP meeting was conducted within Part C's 45-day timeline)
234
Explanation of Slippage
All nine EIS programs (i.e., TEIS-POEs) were monitored during FFY 2013-14. Two findings of noncompliance were issuedrelative to Indicator 7 during FFY 2014-15 (monitoring cycle, FFY 2013-14). The other seven programs correctednoncompliance prior to the issuance of a written finding through pre-finding correction.
The Lead Agency reports that slippage in FFY 2013-14 was largely attributable to one program that experienced a decreaseof 13.44% from FFY 2012-13. Focused monitoring results revealed procedural issues leading up to initial IndividualizedFamily Service Plan (IFSP) development. Monitoring activities included a review of children's records in Tennessee EarlyIntervention Data System (TEIDS) and an on-site review of hard file documentation. Focused monitoring activities culminatedduring the timeframe for annual monitoring.
There were no findings of noncompliance issued for this indicator during FFY 2013-14 (monitoring cycle, FFY 2012-13).
The process for identification and correction of identified noncompliance is detailed in the Annual Performance Report (APR)Introduction under the section entitled, General Supervision System.
FFY 2013 Part C State Performance Plan (SPP)/Annual Performance Report (APR)
4/15/2015 Page 21 of 36

What is the source of the data provided for this indicator?
State monitoring
State database
Provide the time period in which the data were collected (e.g., September through December, fourth quarter, selectionfrom the full reporting period).
Federal Fiscal Year (FFY) 2013-14 data were reported: July 1, 2013 through Jun. 30, 2014.
Describe how the data accurately reflect data for infants and toddlers with IFSPs for the full reporting period.
Full census data were used to determine the percent of Part C eligible infants and toddlers who had eligibility determinationand initial IFSP development within 45 days of referral into Tennessee's Early Intervention System (TEIS).
Annual data were pulled by the nine Tennessee Early Intervention System Point of Entry (TEIS-POE) Data Managers andwere reviewed by TEIS-POE Leadership prior to submission to the Early Childhood IDEA Programs (ECIP) Part C MonitoringCoordinator. POE data reports accounted for reasons of untimely initial IFSP development (i.e., family or system). Asubsequent review of data was completed by the ECIP monitoring staff in order to verify reasons for untimely initial IFSPdevelopment.
Delays due to exceptional family circumstances documented in the child's record were included in both the numerator and thedenominator when calculating percentage of compliance of timely IFSP development as follows:
Total # of EligibleInfants/ Toddlerswith Initial IFSPDevelopment
# of Eligible Infants/Toddlers with TimelyInitial IFSPDevelopment
# of Eligible Infants/ Toddlers withUntimely Initial IFSPDevelopment Due to ExceptionalFamily Circumstances
Total # of Eligible Infants/ Toddlers withTimely Initial IFSPDevelopment
3,623 3,212 234 3,446
Actions required in FFY 2012 response table
None
Responses to actions required in FFY 2012 response table, not including correction of findings
Correction of Findings of Noncompliance Identified in FFY 2012
Findings of Noncompliance IdentifiedFindings of Noncompliance Verified
as Corrected Within One YearFindings of Noncompliance
Subsequently CorrectedFindings Not Yet Verified as Corrected
0
FFY 2013 Part C State Performance Plan (SPP)/Annual Performance Report (APR)
4/15/2015 Page 22 of 36
Indicator 8A: Early Childhood Transition
Baseline Data: 2005
Monitoring Priority: Effective General Supervision Part C / Effective Transition
Compliance indicator: The percentage of toddlers with disabilities exiting Part C with timely transition planning for whom the Lead Agency has:
Developed an IFSP with transition steps and services at least 90 days, and at the discretion of all parties, not more than nine months, prior to the toddler’sthird birthday;
A.
Notified (consistent with any opt-out policy adopted by the State) the SEA and the LEA where the toddler resides at least 90 days prior to the toddler’s thirdbirthday for toddlers potentially eligible for Part B preschool services; and
B.
Conducted the transition conference held with the approval of the family at least 90 days, and at the discretion of all parties, not more than nine months,prior to the toddler’s third birthday for toddlers potentially eligible for Part B preschool services.
C.
(20 U.S.C. 1416(a)(3)(B) and 1442)
Historical Data
FFY 2005 2006 2007 2008 2009 2010 2011 2012
Target 100% 100% 100% 100% 100% 100% 100%
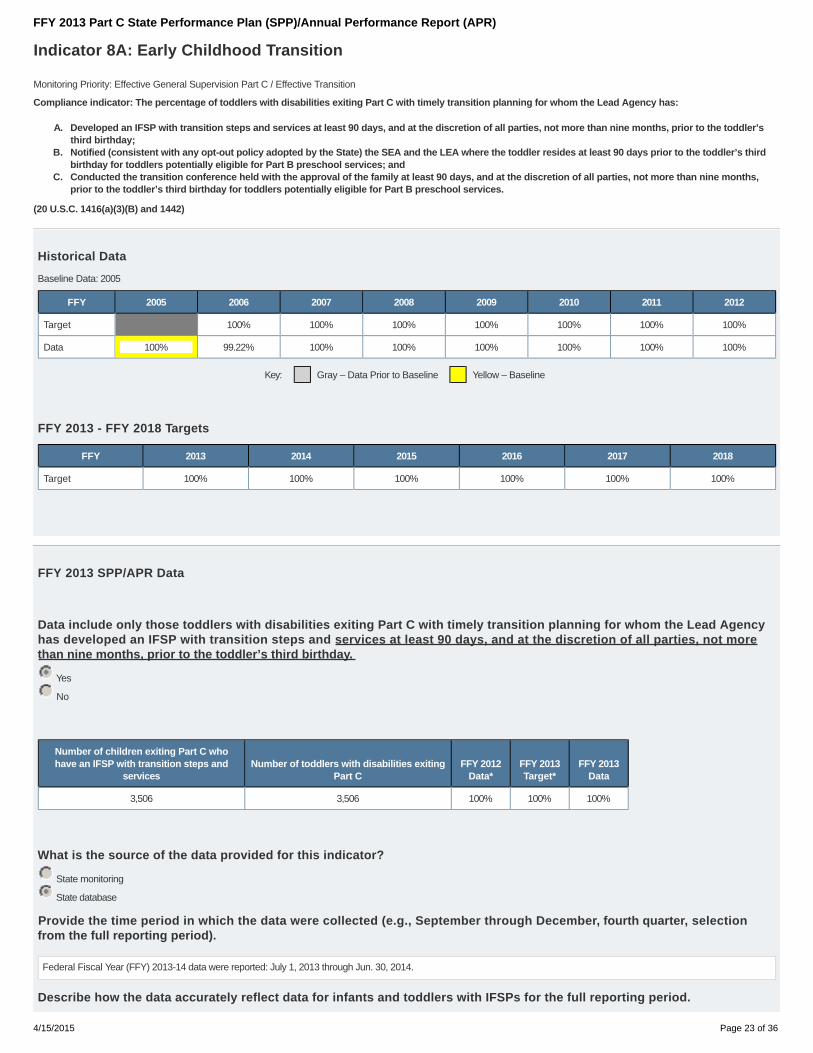
Data 100% 99.22% 100% 100% 100% 100% 100% 100%
Key: Gray – Data Prior to Baseline Yellow – Baseline
FFY 2013 - FFY 2018 Targets
FFY 2013 2014 2015 2016 2017 2018
Target 100% 100% 100% 100% 100% 100%
FFY 2013 SPP/APR Data
Data include only those toddlers with disabilities exiting Part C with timely transition planning for whom the Lead Agencyhas developed an IFSP with transition steps and services at least 90 days, and at the discretion of all parties, not morethan nine months, prior to the toddler’s third birthday.
Yes
No
Number of children exiting Part C whohave an IFSP with transition steps and
servicesNumber of toddlers with disabilities exiting
Part CFFY 2012
Data*FFY 2013Target*
FFY 2013Data
3,506 3,506 100% 100% 100%
What is the source of the data provided for this indicator?
State monitoring
State database
Provide the time period in which the data were collected (e.g., September through December, fourth quarter, selectionfrom the full reporting period).
Federal Fiscal Year (FFY) 2013-14 data were reported: July 1, 2013 through Jun. 30, 2014.
Describe how the data accurately reflect data for infants and toddlers with IFSPs for the full reporting period.
FFY 2013 Part C State Performance Plan (SPP)/Annual Performance Report (APR)
4/15/2015 Page 23 of 36

The Tennessee Early Intervention Data System (TEIDS) contains a validation that assures all Initial Individualized ServicePlans (IFSPs) are developed with a transition outcome/goal, including steps and services. This transition outcome/goal mustbe in place before an Initial IFSP can be saved as final in the child's educational record. The transition goal is reviewed andupdated as needed at subsequent IFSP meetings including the formal transition planning conference.
Actions required in FFY 2012 response table
None
Responses to actions required in FFY 2012 response table, not including correction of findings
Correction of Findings of Noncompliance Identified in FFY 2012
Findings of Noncompliance IdentifiedFindings of Noncompliance Verified
as Corrected Within One YearFindings of Noncompliance
Subsequently CorrectedFindings Not Yet Verified as Corrected
0
FFY 2013 Part C State Performance Plan (SPP)/Annual Performance Report (APR)
4/15/2015 Page 24 of 36
Indicator 8B: Early Childhood Transition
Baseline Data: 2005
Monitoring Priority: Effective General Supervision Part C / Effective Transition
Compliance indicator: The percentage of toddlers with disabilities exiting Part C with timely transition planning for whom the Lead Agency has:
Developed an IFSP with transition steps and services at least 90 days, and at the discretion of all parties, not more than nine months, prior to the toddler’sthird birthday;
A.
Notified (consistent with any opt-out policy adopted by the State) the SEA and the LEA where the toddler resides at least 90 days prior to the toddler’s thirdbirthday for toddlers potentially eligible for Part B preschool services; and
B.
Conducted the transition conference held with the approval of the family at least 90 days, and at the discretion of all parties, not more than nine months,prior to the toddler’s third birthday for toddlers potentially eligible for Part B preschool services.
C.
(20 U.S.C. 1416(a)(3)(B) and 1442)
Historical Data
FFY 2005 2006 2007 2008 2009 2010 2011 2012
Target 100% 100% 100% 100% 100% 100% 100%
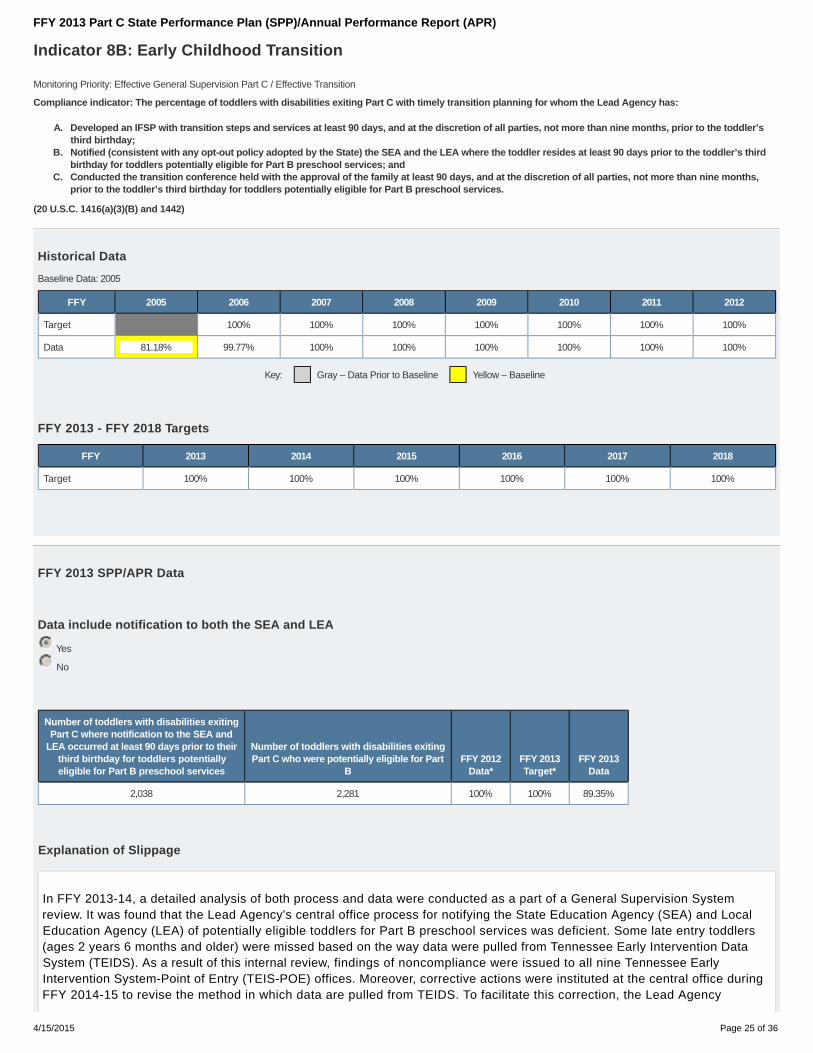
Data 81.18% 99.77% 100% 100% 100% 100% 100% 100%
Key: Gray – Data Prior to Baseline Yellow – Baseline
FFY 2013 - FFY 2018 Targets
FFY 2013 2014 2015 2016 2017 2018
Target 100% 100% 100% 100% 100% 100%
FFY 2013 SPP/APR Data
Data include notification to both the SEA and LEA
Yes
No
Number of toddlers with disabilities exitingPart C where notification to the SEA and
LEA occurred at least 90 days prior to theirthird birthday for toddlers potentiallyeligible for Part B preschool services
Number of toddlers with disabilities exitingPart C who were potentially eligible for Part
BFFY 2012
Data*FFY 2013Target*
FFY 2013Data
2,038 2,281 100% 100% 89.35%
Explanation of Slippage
In FFY 2013-14, a detailed analysis of both process and data were conducted as a part of a General Supervision Systemreview. It was found that the Lead Agency's central office process for notifying the State Education Agency (SEA) and LocalEducation Agency (LEA) of potentially eligible toddlers for Part B preschool services was deficient. Some late entry toddlers(ages 2 years 6 months and older) were missed based on the way data were pulled from Tennessee Early Intervention DataSystem (TEIDS). As a result of this internal review, findings of noncompliance were issued to all nine Tennessee EarlyIntervention System-Point of Entry (TEIS-POE) offices. Moreover, corrective actions were instituted at the central office duringFFY 2014-15 to revise the method in which data are pulled from TEIDS. To facilitate this correction, the Lead Agency
FFY 2013 Part C State Performance Plan (SPP)/Annual Performance Report (APR)
4/15/2015 Page 25 of 36
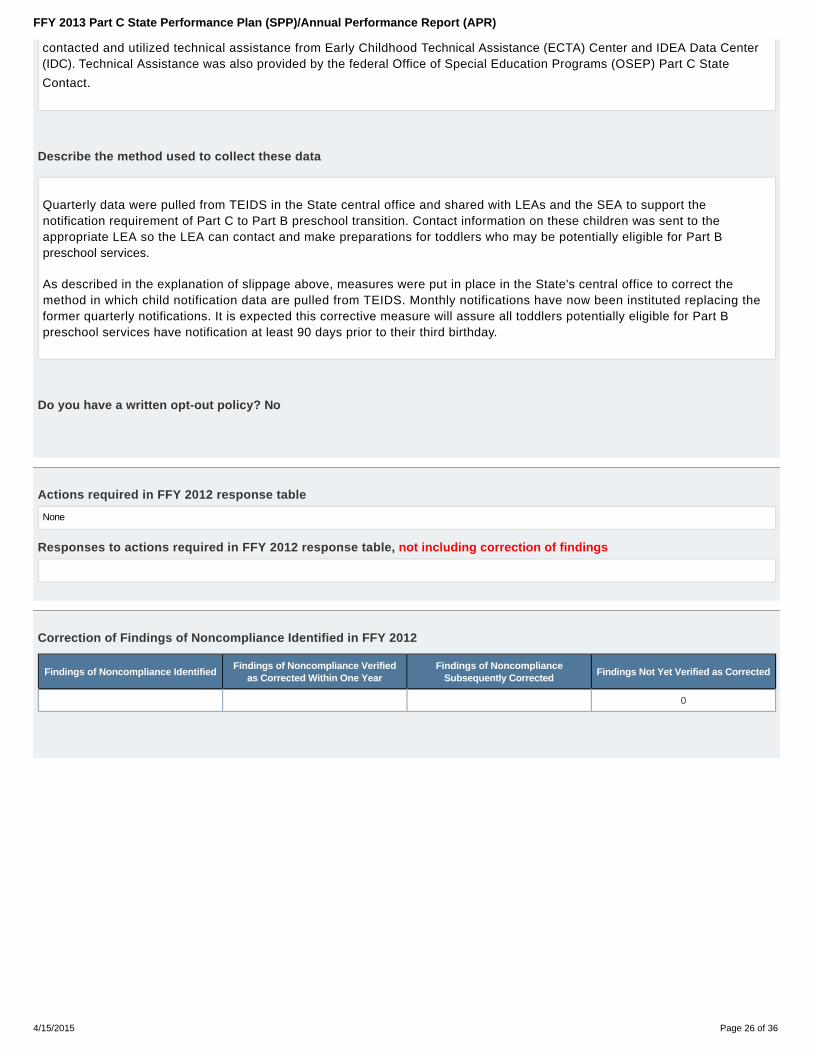
contacted and utilized technical assistance from Early Childhood Technical Assistance (ECTA) Center and IDEA Data Center(IDC). Technical Assistance was also provided by the federal Office of Special Education Programs (OSEP) Part C State
Contact.
Describe the method used to collect these data
Quarterly data were pulled from TEIDS in the State central office and shared with LEAs and the SEA to support thenotification requirement of Part C to Part B preschool transition. Contact information on these children was sent to theappropriate LEA so the LEA can contact and make preparations for toddlers who may be potentially eligible for Part Bpreschool services.
As described in the explanation of slippage above, measures were put in place in the State's central office to correct themethod in which child notification data are pulled from TEIDS. Monthly notifications have now been instituted replacing theformer quarterly notifications. It is expected this corrective measure will assure all toddlers potentially eligible for Part Bpreschool services have notification at least 90 days prior to their third birthday.
Do you have a written opt-out policy? No
Actions required in FFY 2012 response table
None
Responses to actions required in FFY 2012 response table, not including correction of findings
Correction of Findings of Noncompliance Identified in FFY 2012
Findings of Noncompliance IdentifiedFindings of Noncompliance Verified
as Corrected Within One YearFindings of Noncompliance
Subsequently CorrectedFindings Not Yet Verified as Corrected
0
FFY 2013 Part C State Performance Plan (SPP)/Annual Performance Report (APR)
4/15/2015 Page 26 of 36
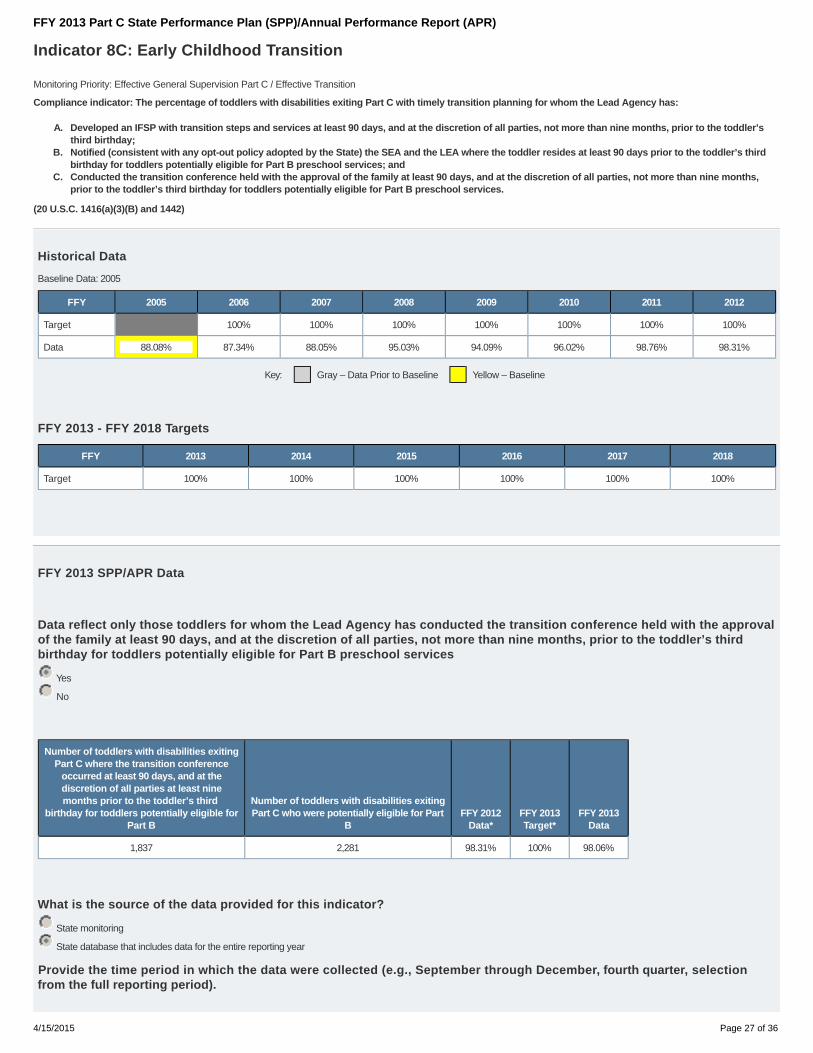
Indicator 8C: Early Childhood Transition
Baseline Data: 2005
Monitoring Priority: Effective General Supervision Part C / Effective Transition
Compliance indicator: The percentage of toddlers with disabilities exiting Part C with timely transition planning for whom the Lead Agency has:
Developed an IFSP with transition steps and services at least 90 days, and at the discretion of all parties, not more than nine months, prior to the toddler’sthird birthday;
A.
Notified (consistent with any opt-out policy adopted by the State) the SEA and the LEA where the toddler resides at least 90 days prior to the toddler’s thirdbirthday for toddlers potentially eligible for Part B preschool services; and
B.
Conducted the transition conference held with the approval of the family at least 90 days, and at the discretion of all parties, not more than nine months,prior to the toddler’s third birthday for toddlers potentially eligible for Part B preschool services.
C.
(20 U.S.C. 1416(a)(3)(B) and 1442)
Historical Data
FFY 2005 2006 2007 2008 2009 2010 2011 2012
Target 100% 100% 100% 100% 100% 100% 100%
Data 88.08% 87.34% 88.05% 95.03% 94.09% 96.02% 98.76% 98.31%
Key: Gray – Data Prior to Baseline Yellow – Baseline
FFY 2013 - FFY 2018 Targets
FFY 2013 2014 2015 2016 2017 2018
Target 100% 100% 100% 100% 100% 100%
FFY 2013 SPP/APR Data
Data reflect only those toddlers for whom the Lead Agency has conducted the transition conference held with the approvalof the family at least 90 days, and at the discretion of all parties, not more than nine months, prior to the toddler’s thirdbirthday for toddlers potentially eligible for Part B preschool services
Yes
No
Number of toddlers with disabilities exitingPart C where the transition conference
occurred at least 90 days, and at thediscretion of all parties at least ninemonths prior to the toddler’s third
birthday for toddlers potentially eligible forPart B
Number of toddlers with disabilities exitingPart C who were potentially eligible for Part
BFFY 2012
Data*FFY 2013Target*
FFY 2013Data
1,837 2,281 98.31% 100% 98.06%
What is the source of the data provided for this indicator?
State monitoring
State database that includes data for the entire reporting year
Provide the time period in which the data were collected (e.g., September through December, fourth quarter, selectionfrom the full reporting period).
FFY 2013 Part C State Performance Plan (SPP)/Annual Performance Report (APR)
4/15/2015 Page 27 of 36

Federal Fiscal Year (FFY) 2013-14 data were reported: July 1, 2013 through Jun. 30, 2014.
Describe how the data accurately reflect data for infants and toddlers with IFSPs for the full reporting period.
Yearly data were compiled by the nine Tennessee Early Intervention System-Point of Entry (TEIS-POE) Data Managers andwere reviewed by TEIS-POE Leadership prior to submission to the Early Childhood IDEA Programs (ECIP) Part C MonitoringCoordinator. POE data reports accounted for reasons of untimely LEA transition planning conferences (i.e., family or system).A subsequent review of data was completed by the ECIP monitoring staff in order to verify reasons for untimely servicedelivery.
Delays due to exceptional family circumstances documented in the child's record were included in both the numerator and thedenominator when calculating percentage of compliance of timely IFSP service delivery as follows:
Total # of ToddlersExiting Part CPotentially Eligiblefor Part B PreschoolServices
# Parents WhoRefused aTransitionPlanningConference
# of Toddlers withLEA TransitionPlanningConferences
# of Timely LEATransitionPlanningConferences
# of Toddlers withUntimely LEA TransitionPlanning ConferencesDue to ExceptionalFamily Circumstances
Total # of Infants/Toddlers with TimelyLEA TransitionPlanning Conferences
2,281 272 2009 1837 133 1970
Provide additional information about this indicator (optional)
All nine EIS programs (i.e., TEIS-POEs) were monitored during FFY 2013-14. One finding of noncompliance was issued inFFY 2014-15 relative to Indicator 8C. One program demonstrated 100% compliance for the federal fiscal year. The otherseven programs corrected noncompliance through a subsequent full census data prior to the issuance of a written findingthrough pre-finding correction.
There were no findings of noncompliance issued for this Indicator during FFY 2013-14 [monitoring cycle, FFY 2012-13).
The process for identification and correction of identified noncompliance is in detailed the Annual Performance Report (APR)Introduction under the section entitled, General Supervision System.
Actions required in FFY 2012 response table
None
Responses to actions required in FFY 2012 response table, not including correction of findings
FFY 2013 Part C State Performance Plan (SPP)/Annual Performance Report (APR)
4/15/2015 Page 28 of 36
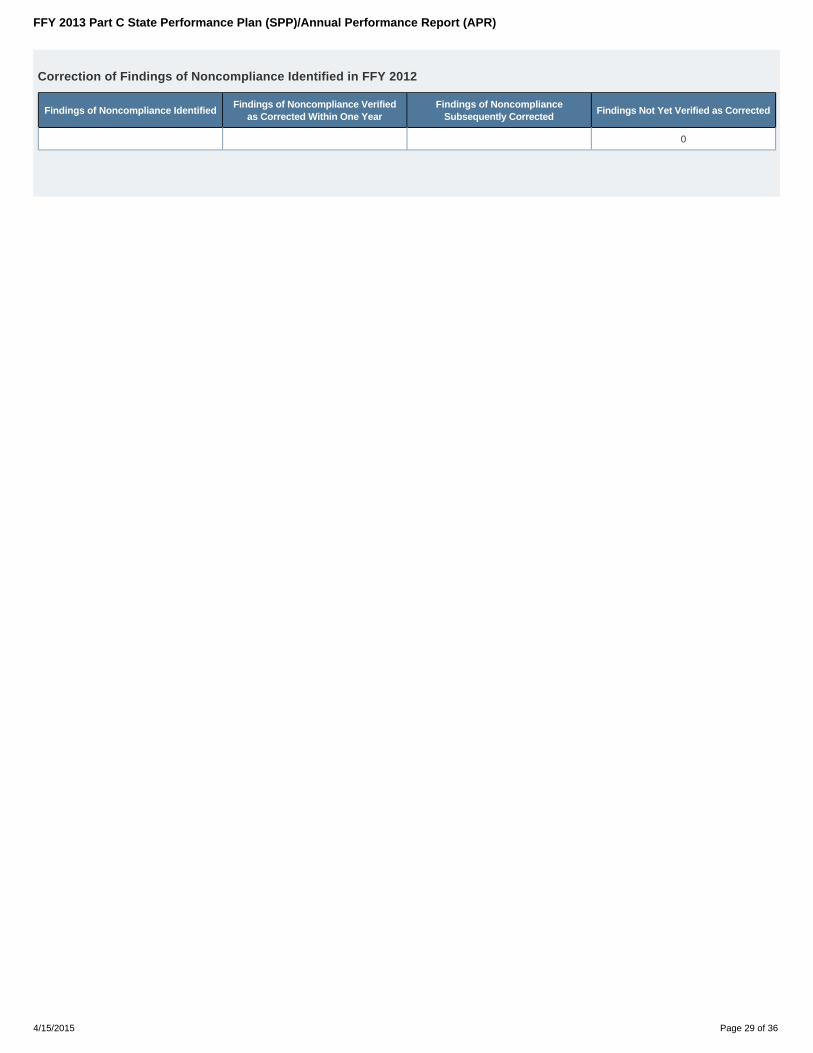
Correction of Findings of Noncompliance Identified in FFY 2012
Findings of Noncompliance IdentifiedFindings of Noncompliance Verified
as Corrected Within One YearFindings of Noncompliance
Subsequently CorrectedFindings Not Yet Verified as Corrected
0
FFY 2013 Part C State Performance Plan (SPP)/Annual Performance Report (APR)
4/15/2015 Page 29 of 36

Indicator 9: Resolution Sessions
Baseline Data:
Monitoring Priority: Effective General Supervision Part C / General Supervision
Results indicator: Percent of hearing requests that went to resolution sessions that were resolved through resolution session settlement agreements (applicable ifPart B due process procedures are adopted).
(20 U.S.C. 1416(a)(3)(B) and 1442)
Historical Data
FFY 2005 2006 2007 2008 2009 2010 2011 2012
Target ≥
Data
Key: Gray – Data Prior to Baseline Yellow – Baseline
FFY 2013 - FFY 2018 Targets
FFY 2013 2014 2015 2016 2017 2018
Target ≥
Targets: Description of Stakeholder Input
There were no resolution sessions held for FFY 2013-14. States are not required to establish baseline or targets if the numberof resolution sessions is less than 10. Information regarding status of Indicator 9: Resolution Sessions was shared with the StateInteragency Coordinating Council (SICC) membership, January 2015.
Prepopulated Data
Source Date Description Data Overwrite Data
EMAPS IDEA Part B DisputeResolution Survey; Section C:
Due Process Complaints11/12/2013 3.1 Number of resolution sessions 0
EMAPS IDEA Part B DisputeResolution Survey; Section C:
Due Process Complaints11/12/2013 3.1(a) Number resolution sessions resolved through settlement agreements 0
FFY 2013 SPP/APR Data
3.1 Number of resolution sessions3.1(a) Number resolution sessions
resolved through settlementagreements
FFY 2012Data*
FFY 2013 Target*FFY 2013
Data
0 0
Actions required in FFY 2012 response table
None
FFY 2013 Part C State Performance Plan (SPP)/Annual Performance Report (APR)
4/15/2015 Page 30 of 36

Responses to actions required in FFY 2012 response table
FFY 2013 Part C State Performance Plan (SPP)/Annual Performance Report (APR)
4/15/2015 Page 31 of 36

Indicator 10: Mediation
Baseline Data: 2005
Monitoring Priority: Effective General Supervision Part C / General Supervision
Results indicator: Percent of mediations held that resulted in mediation agreements.
(20 U.S.C. 1416(a)(3)(B) and 1442)
Historical Data
FFY 2005 2006 2007 2008 2009 2010 2011 2012
Target ≥
Data 50.00% 100% 100% 100%
Key: Gray – Data Prior to Baseline Yellow – Baseline
FFY 2013 - FFY 2018 Targets
FFY 2013 2014 2015 2016 2017 2018
Target ≥
Targets: Description of Stakeholder Input
There were no requests for mediation during FFY 2013-14. States are not required to establish baseline or targets if thenumber of mediations is less than 10. Information regarding status of Indicator 10: Meditations were shared with the StateInteragency Coordinating Council (SICC) membership, January 2015.
Prepopulated Data
Source Date Description Data Overwrite Data
EMAPS IDEA Part B DisputeResolution Survey; Section B:
Mediation Requests11/5/2014 2.1.a.i Mediations agreements related to due process complaints 0
EMAPS IDEA Part B DisputeResolution Survey; Section B:
Mediation Requests11/5/2014 2.1.b.i Mediations agreements not related to due process complaints 0
EMAPS IDEA Part B DisputeResolution Survey; Section B:
Mediation Requests11/5/2014 2.1 Mediations held 0
FFY 2013 SPP/APR Data2.1.a.i Mediations
agreements related to dueprocess complaints
2.1.b.i Mediationsagreements not related todue process complaints
2.1 Mediations heldFFY 2012
Data*FFY 2013Target*
FFY 2013Data
0 0 0 100%
Actions required in FFY 2012 response table
FFY 2013 Part C State Performance Plan (SPP)/Annual Performance Report (APR)
4/15/2015 Page 32 of 36

None
Responses to actions required in FFY 2012 response table
FFY 2013 Part C State Performance Plan (SPP)/Annual Performance Report (APR)
4/15/2015 Page 33 of 36

Indicator 11: State Systemic Improvement Plan
Monitoring Priority: General Supervision
Results indicator: The State’s SPP/APR includes a State Systemic Improvement Plan (SSIP) that meets the requirements set forth for this indicator.
Baseline Data
FFY 2013
Data 39.83%
FFY 2014 - FFY 2018 Targets
FFY 2014 2015 2016 2017 2018
Target 45.20% 45.50% 46.00% 46.50% 47.00%
Description of Measure
Targets: Description of Stakeholder Input
Data Analysis
A description of how the State identified and analyzed key data, including data from SPP/APR indicators, 618 data collections, and other available data as applicable, to: (1) select theState-identified Measurable Result(s) for Infants and Toddlers with Disabilities and their Families, and (2) identify root causes contributing to low performance. The description mustinclude information about how the data were disaggregated by multiple variables (e.g., EIS program and/or EIS provider, geographic region, race/ethnicity, socioeconomic status,gender, etc.) As part of its data analysis, the State should also consider compliance data and whether those data present potential barriers to improvement. In addition, if the Stateidentifies any concerns about the quality of the data, the description must include how the State will address these concerns. Finally, if additional data are needed, the descriptionshould include the methods and timelines to collect and analyze the additional data.
Analysis of State Infrastructure to Support Improvement and Build Capacity
A description of how the State analyzed the capacity of its current infrastructure to support improvement and build capacity in EIS programs and/or EIS providers to implement, scaleup, and sustain the use of evidence-based practices to improve results for infants and toddlers with disabilities and their families. State systems that make up its infrastructureinclude, at a minimum: governance, fiscal, quality standards, professional development, data, technical assistance, and accountability/monitoring. The description must includecurrent strengths of the systems, the extent the systems are coordinated, and areas for improvement of functioning within and across the systems. The State must also identify currentState-level improvement plans and other early learning initiatives, such as Race to the Top-Early Learning Challenge and the Home Visiting program and describe the extent thatthese new initiatives are aligned, and how they are, or could be, integrated with, the SSIP. Finally, the State should identify representatives (e.g., offices, agencies, positions,individuals, and other stakeholders) that were involved in developing Phase I of the SSIP and that will be involved in developing and implementing Phase II of the SSIP.
State-identified Measurable Result(s) for Infants and Toddlers with Disabilities and Their Families
FFY 2013 Part C State Performance Plan (SPP)/Annual Performance Report (APR)
4/15/2015 Page 34 of 36

A statement of the result(s) the State intends to achieve through the implementation of the SSIP. The State-identified Measurable Result(s) for Infants and Toddlers with Disabilitiesand their Families must be aligned to an SPP/APR indicator or a component of an SPP/APR indicator. The State-identified Measurable Result(s) for Infants and Toddlers withDisabilities and their Families must be clearly based on the Data and State Infrastructure Analyses and must be a child- or family-level outcome in contrast to a process outcome.The State may select a single result (e.g., increase the rate of growth in infants and toddlers demonstrating positive social-emotional skills) or a cluster of related results (e.g.,increase the percentage reported under child outcome B under Indicator 3 of the SPP/APR (knowledge and skills) and increase the percentage trend reported for families underIndicator 4 (helping their child develop and learn)).
Statement
Description
Selection of Coherent Improvement Strategies
An explanation of how the improvement strategies were selected, and why they are sound, logical and aligned, and will lead to a measurable improvement in the State-identifiedMeasurable Result(s) for Infants and Toddlers with Disabilities and their Families. The improvement strategies should include the strategies, identified through the Data and StateInfrastructure Analyses, that are needed to improve the State infrastructure and to support EIS program and/or EIS provider implementation of evidence-based practices to improvethe State-identified result(s) for infants and toddlers with disabilities and their families. The State must describe how implementation of the improvement strategies will addressidentified root causes for low performance and ultimately build EIS program and/or EIS provider capacity to achieve the State-identified Measurable Result(s) for Infants and Toddlerswith Disabilities and their Families.
Theory of Action
A graphic illustration that shows the rationale of how implementing the coherent set of improvement strategies selected will increase the State’s capacity to lead meaningful changein EIS programs and/or EIS providers, and achieve improvement in the State-identified Measurable Result(s) for Infants and Toddlers with Disabilities and their Families.
Submitted Theory of Action: TN Part C Theory of Action
Illustration
Provide a description of the provided graphic illustration (optional)
FFY 2013 Part C State Performance Plan (SPP)/Annual Performance Report (APR)
4/15/2015 Page 35 of 36

Certify and Submit your SPP/APR
This indicator is not applicable.
FFY 2013 Part C State Performance Plan (SPP)/Annual Performance Report (APR)
4/15/2015 Page 36 of 36