introduction to the sampling theorempropagation.ece.gatech.edu/ee3614_vt/files/lecture8.pdfecpe 3614...
TRANSCRIPT

1
Copyright Gregory D. Durgin 2000VIRGINIA POLYTECHNIC INSTITUTEAND STATE UNIVERSITY
TechVirginia
1 8 7 2
ECPE 3614 Introduction to Communication Systems
Introduction to the Sampling Theorem
ECPE 3614Lecture 8
Instructor: Gregory D. Durgin
Copyright Gregory D. Durgin 2000VIRGINIA POLYTECHNIC INSTITUTEAND STATE UNIVERSITY
TechVirginia
1 8 7 2
ECPE 3614 Introduction to Communications Systems
L82
Outline of Lecture
§Review of Time Replication and Frequency Sampling§Duality Result for Time Sampling and
Frequency Replication§Aliasing and the Nyquist Rate§Example 1: Impulsive Sampling§Example 2: Non-Impulsive Sampling§Conclusions

2
Copyright Gregory D. Durgin 2000VIRGINIA POLYTECHNIC INSTITUTEAND STATE UNIVERSITY
TechVirginia
1 8 7 2
ECPE 3614 Introduction to Communications Systems
L83
Review: Homework #3, Problems 1 and 2.
In this problem, a gated exponential function is shifted and copied in time to produce a periodic function, y(t).
Copyright Gregory D. Durgin 2000VIRGINIA POLYTECHNIC INSTITUTEAND STATE UNIVERSITY
TechVirginia
1 8 7 2
ECPE 3614 Introduction to Communications Systems
L84
Replication in Time to Make a Periodic Function
-5 0 50
0.1
0.2
0.3
0.4
0.5
0.6
0.7
0.8
0.9
1
t (seconds)
sign
al
Exponential
-5 0 50
0.2
0.4
0.6
0.8
1
1.2
1.4
t (seconds)
sign
al
Exponential Sawtooth

3
Copyright Gregory D. Durgin 2000VIRGINIA POLYTECHNIC INSTITUTEAND STATE UNIVERSITY
TechVirginia
1 8 7 2
ECPE 3614 Introduction to Communications Systems
L85
Fourier Transform Pairs
-5 0 50
0.1
0.2
0.3
0.4
0.5
0.6
0.7
0.8
0.9
1
t (seconds)
sign
al
Exponential
-8 -6 -4 -2 0 2 4 6 80
2
4
6
8
10
12
14
f (Hz)
spec
trum
Fourier Transform of Exponential
Copyright Gregory D. Durgin 2000VIRGINIA POLYTECHNIC INSTITUTEAND STATE UNIVERSITY
TechVirginia
1 8 7 2
ECPE 3614 Introduction to Communications Systems
L86
Fourier Transform Pairs
-5 0 50
0.2
0.4
0.6
0.8
1
1.2
1.4
t (seconds)
sign
al
Exponential Sawtooth
-8 -6 -4 -2 0 2 4 6 80
10
20
30
40
50
60
70
f (Hz)
spec
trum
Fourier Transform of Exponential Sawtooth

4
Copyright Gregory D. Durgin 2000VIRGINIA POLYTECHNIC INSTITUTEAND STATE UNIVERSITY
TechVirginia
1 8 7 2
ECPE 3614 Introduction to Communications Systems
L87
Replication Problem
s(t) Replicator( )h t
A Replicator can be modeled as a linear time-invariant (LTI) system that takes an input, s(t) and turns it into a periodic function y(t).
Copyright Gregory D. Durgin 2000VIRGINIA POLYTECHNIC INSTITUTEAND STATE UNIVERSITY
TechVirginia
1 8 7 2
ECPE 3614 Introduction to Communications Systems
L88
The Operation of Replication
Since the Replicator is an LTI system, it has an impulse response, h(t). The impulse response is just an impulse train of period T:
Thus, we can write

5
Copyright Gregory D. Durgin 2000VIRGINIA POLYTECHNIC INSTITUTEAND STATE UNIVERSITY
TechVirginia
1 8 7 2
ECPE 3614 Introduction to Communications Systems
L89
Show that the Convolution of s(t) and h(t) is y(t):
Is the act of replication a realistic filter? No, because h(t) is not causal. However, it is a powerful way to think about the act of replication both in the time domain and…
Copyright Gregory D. Durgin 2000VIRGINIA POLYTECHNIC INSTITUTEAND STATE UNIVERSITY
TechVirginia
1 8 7 2
ECPE 3614 Introduction to Communications Systems
L810
… In the Frequency Domain
In the frequency domain, a convolution becomes a :
The Fourier Transform of an impulse train is an impulse train:
multiplication
impulse train

6
Copyright Gregory D. Durgin 2000VIRGINIA POLYTECHNIC INSTITUTEAND STATE UNIVERSITY
TechVirginia
1 8 7 2
ECPE 3614 Introduction to Communications Systems
L811
Multiplication By an Impulse Train Samples the Spectrum
-8 -6 -4 -2 0 2 4 6 80
10
20
30
40
50
60
70
f (Hz)
spec
trum
Fourier Transform of Exponential Sawtooth
-8 -6 -4 -2 0 2 4 6 80
2
4
6
8
10
12
14
f (Hz)
spec
trum
Fourier Transform of Exponential
Copyright Gregory D. Durgin 2000VIRGINIA POLYTECHNIC INSTITUTEAND STATE UNIVERSITY
TechVirginia
1 8 7 2
ECPE 3614 Introduction to Communications Systems
L812
Summary of Time Replication
t
Replication = Convolution by an Impulse Traint
t
y t( )
7
Copyright Gregory D. Durgin 2000VIRGINIA POLYTECHNIC INSTITUTEAND STATE UNIVERSITY
TechVirginia
1 8 7 2
ECPE 3614 Introduction to Communications Systems
L813
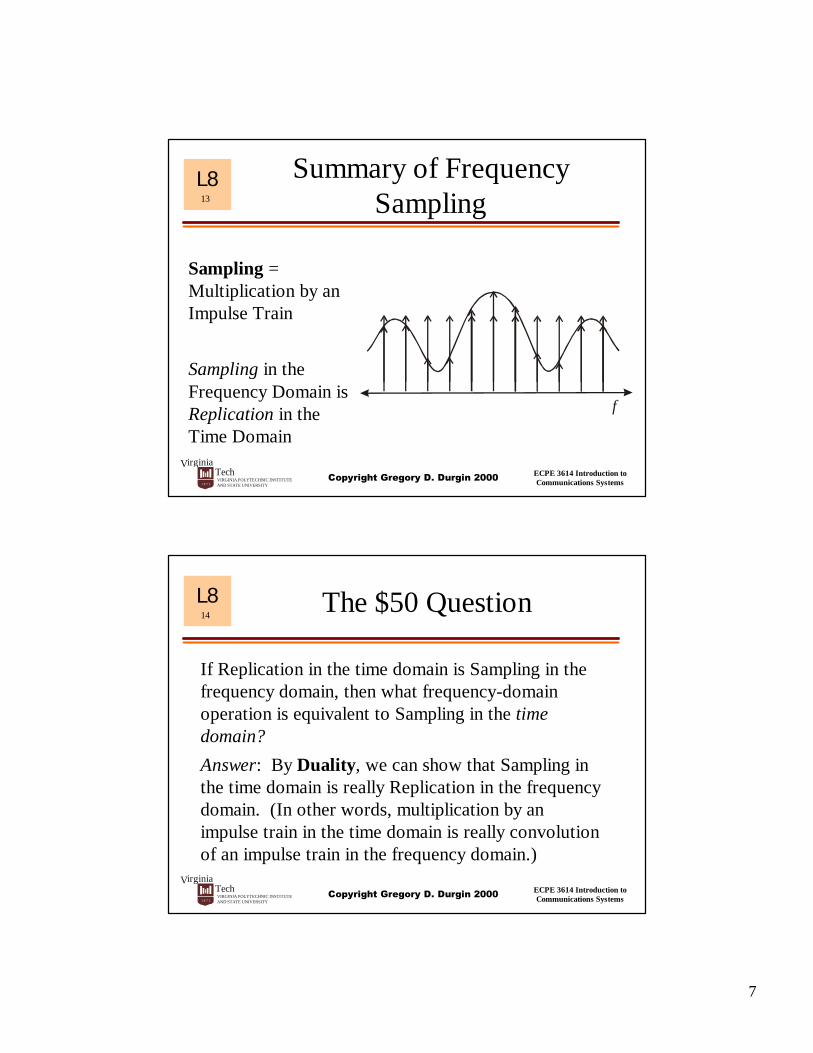
Summary of Frequency Sampling
f
Sampling = Multiplication by an Impulse Train
Sampling in the Frequency Domain is Replication in the Time Domain
Copyright Gregory D. Durgin 2000VIRGINIA POLYTECHNIC INSTITUTEAND STATE UNIVERSITY
TechVirginia
1 8 7 2
ECPE 3614 Introduction to Communications Systems
L814
The $50 Question
If Replication in the time domain is Sampling in the frequency domain, then what frequency-domain operation is equivalent to Sampling in the time domain? Answer: By Duality, we can show that Sampling in the time domain is really Replication in the frequency domain. (In other words, multiplication by an impulse train in the time domain is really convolution of an impulse train in the frequency domain.)

8
Copyright Gregory D. Durgin 2000VIRGINIA POLYTECHNIC INSTITUTEAND STATE UNIVERSITY
TechVirginia
1 8 7 2
ECPE 3614 Introduction to Communications Systems
L815
Time Domain Sampling
t
y nT( ) T
t
y t( )
f
Y( ) f
f
In the Frequency Domain…
In the Time Domain…
Copyright Gregory D. Durgin 2000VIRGINIA POLYTECHNIC INSTITUTEAND STATE UNIVERSITY
TechVirginia
1 8 7 2
ECPE 3614 Introduction to Communications Systems
L816
Recovering the Original Baseband Signal
y t( ) y t( )
LPFSampler
t tt
y nT( ) T

9
Copyright Gregory D. Durgin 2000VIRGINIA POLYTECHNIC INSTITUTEAND STATE UNIVERSITY
TechVirginia
1 8 7 2
ECPE 3614 Introduction to Communications Systems
L817
Recovering the Original Baseband Signal
f
f
Y( ) f
H ( )LP f 2B
f
Sample Signal:
Ideal Low-Pass Filter:
Original Signal:
Copyright Gregory D. Durgin 2000VIRGINIA POLYTECHNIC INSTITUTEAND STATE UNIVERSITY
TechVirginia
1 8 7 2
ECPE 3614 Introduction to Communications Systems
L818
Mathematical Representation of the Recovery Operation

10
Copyright Gregory D. Durgin 2000VIRGINIA POLYTECHNIC INSTITUTEAND STATE UNIVERSITY
TechVirginia
1 8 7 2
ECPE 3614 Introduction to Communications Systems
L819
Lot’s of Math – Yuck!
We can simplify this equation by performing several operations. The end result on the next page is one of the most famous equations of all time.
Copyright Gregory D. Durgin 2000VIRGINIA POLYTECHNIC INSTITUTEAND STATE UNIVERSITY
TechVirginia
1 8 7 2
ECPE 3614 Introduction to Communications Systems
L820
Shannon’s Sampling Theorem
Shannon’s sampling theorem for band-limited signals:
Published by Claude Shannon in 1948 in his famous paper “The Mathematical Theory of Communications”. This equation is the main reason why our technology is becoming more and more digital.

11
Copyright Gregory D. Durgin 2000VIRGINIA POLYTECHNIC INSTITUTEAND STATE UNIVERSITY
TechVirginia
1 8 7 2
ECPE 3614 Introduction to Communications Systems
L821
How Can the Sampled Signal Contain ALL This Information?
t
y t( )
t
y nT( )
In sampling, it would seem as though we have thrown away an infinite amount of information by representing a continuous function segment with a finite number of data points. But this is really the case, provided that a certain criterion is meet…
Copyright Gregory D. Durgin 2000VIRGINIA POLYTECHNIC INSTITUTEAND STATE UNIVERSITY
TechVirginia
1 8 7 2
ECPE 3614 Introduction to Communications Systems
L822
Effects of Sampling Interval Size on Spectral Replication
t
y nT( ) T
f
R 1/TS=
The Sampling Period, T, is the spacing between samples in the time domain. The Sampling Rate, RS, is the spacing between replicas in the frequency domain.

12
Copyright Gregory D. Durgin 2000VIRGINIA POLYTECHNIC INSTITUTEAND STATE UNIVERSITY
TechVirginia
1 8 7 2
ECPE 3614 Introduction to Communications Systems
L823
Effects of Sampling Interval Size on Spectral Replication
Decreasing the Sampling Period, T, will increase the Sampling Rate, RS, and the spacing between replicas in the frequency domain.
t
y nT( )T
f
R 1/TS=
Copyright Gregory D. Durgin 2000VIRGINIA POLYTECHNIC INSTITUTEAND STATE UNIVERSITY
TechVirginia
1 8 7 2
ECPE 3614 Introduction to Communications Systems
L824
Decreasing Sampling Rate(Increasing Sampling Period)
Does anyone anticipate a problem for small sampling rates?
For small values of RS (large values of T), the spectral replicas begin to overlap. If RS becomes too small, then the replicas overlap and it becomes impossible to filter out the exact copy of the original signal. This effect is called aliasing.

13
Copyright Gregory D. Durgin 2000VIRGINIA POLYTECHNIC INSTITUTEAND STATE UNIVERSITY
TechVirginia
1 8 7 2
ECPE 3614 Introduction to Communications Systems
L825
Aliasing (Imperfect Sampling)
f
R 1/TS=
If the sampling rate is not large enough, then the spectral replicas overlap. Notice that passing the sampled signal through a band-pass filter does not recover the original signal. Aliasing causes the loss of information.
Copyright Gregory D. Durgin 2000VIRGINIA POLYTECHNIC INSTITUTEAND STATE UNIVERSITY
TechVirginia
1 8 7 2
ECPE 3614 Introduction to Communications Systems
L826
The Nyquist Rate
f
R 1/TS=
The absolute minimum rate that a band-limited signal may be sampled without losing information to aliasing is the Nyquist rate. The Nyquist rate is equal twice the bandwidth of a baseband signal, 2fm (or simply W if you are measuring total width).
f
fm
W

14
Copyright Gregory D. Durgin 2000VIRGINIA POLYTECHNIC INSTITUTEAND STATE UNIVERSITY
TechVirginia
1 8 7 2
ECPE 3614 Introduction to Communications Systems
L827
Matlab Simulation Procedure
§Generate a Random Band-Limited Signal§Sample the Band-Limited Signal in the time
domain with an impulse train§Pass the sampled signal through an Ideal Low-
Pass Filter (ILPF)§Compare the original signal with the recovered
signal.§Repeat the exercise for decreasing sampling
periods, T.
Copyright Gregory D. Durgin 2000VIRGINIA POLYTECHNIC INSTITUTEAND STATE UNIVERSITY
TechVirginia
1 8 7 2
ECPE 3614 Introduction to Communications Systems
L828
-5 -4 -3 -2 -1 0 1 2 3 4 5-0.04
-0.02
0
0.02
0.04
0.06
time, s
x(t)
Input Signal
-15 -10 -5 0 5 10 150
0.5
1
1.5
2
frequency, f
|X(f)
|
Cas
e 1

15
Copyright Gregory D. Durgin 2000VIRGINIA POLYTECHNIC INSTITUTEAND STATE UNIVERSITY
TechVirginia
1 8 7 2
ECPE 3614 Introduction to Communications Systems
L829
-5 -4 -3 -2 -1 0 1 2 3 4 50
0.2
0.4
0.6
0.8
1
time, s
Σ δ(
t-nT)
Impulse Train
-15 -10 -5 0 5 10 150
10
20
30
40
50
60
70
frequency, f
1/T
Σ δ(
t-n/T
)
Cas
e 1
Copyright Gregory D. Durgin 2000VIRGINIA POLYTECHNIC INSTITUTEAND STATE UNIVERSITY
TechVirginia
1 8 7 2
ECPE 3614 Introduction to Communications Systems
L830
-5 -4 -3 -2 -1 0 1 2 3 4 5-0.04
-0.02
0
0.02
0.04
0.06
time, s
x(nT
)
Sampled x(t) for T=0.156s
-15 -10 -5 0 5 10 150
0.1
0.2
0.3
0.4
0.5
frequency, f
|Xs(
f)|
Cas
e 1

16
Copyright Gregory D. Durgin 2000VIRGINIA POLYTECHNIC INSTITUTEAND STATE UNIVERSITY
TechVirginia
1 8 7 2
ECPE 3614 Introduction to Communications Systems
L831
-5 -4 -3 -2 -1 0 1 2 3 4 5-0.04
-0.02
0
0.02
0.04
0.06
time, s
xn(t)
Sampled x(t) through ILPF
Recovered x(t)Original x(t)
-15 -10 -5 0 5 10 150
0.5
1
1.5
2
frequency, f
|Xn(
f)|
Cas
e 1
Copyright Gregory D. Durgin 2000VIRGINIA POLYTECHNIC INSTITUTEAND STATE UNIVERSITY
TechVirginia
1 8 7 2
ECPE 3614 Introduction to Communications Systems
L832
-5 -4 -3 -2 -1 0 1 2 3 4 5-0.03
-0.02
-0.01
0
0.01
0.02
0.03
time, s
x(t)
Input Signal
-15 -10 -5 0 5 10 150
0.2
0.4
0.6
0.8
1
frequency, f
|X(f)
|
Cas
e 2

17
Copyright Gregory D. Durgin 2000VIRGINIA POLYTECHNIC INSTITUTEAND STATE UNIVERSITY
TechVirginia
1 8 7 2
ECPE 3614 Introduction to Communications Systems
L833
-5 -4 -3 -2 -1 0 1 2 3 4 50
0.2
0.4
0.6
0.8
1
time, s
Σ δ(
t-nT)
Impulse Train
-15 -10 -5 0 5 10 150
5
10
15
20
25
30
35
frequency, f
1/T
Σ δ(
t-n/T
)
Cas
e 2
Copyright Gregory D. Durgin 2000VIRGINIA POLYTECHNIC INSTITUTEAND STATE UNIVERSITY
TechVirginia
1 8 7 2
ECPE 3614 Introduction to Communications Systems
L834
-5 -4 -3 -2 -1 0 1 2 3 4 5-0.03
-0.02
-0.01
0
0.01
0.02
time, s
x(nT
)
Sampled x(t) for T=0.313s
-15 -10 -5 0 5 10 150
0.02
0.04
0.06
0.08
0.1
0.12
frequency, f
|Xs(
f)|
Cas
e 2
18
Copyright Gregory D. Durgin 2000VIRGINIA POLYTECHNIC INSTITUTEAND STATE UNIVERSITY
TechVirginia
1 8 7 2
ECPE 3614 Introduction to Communications Systems
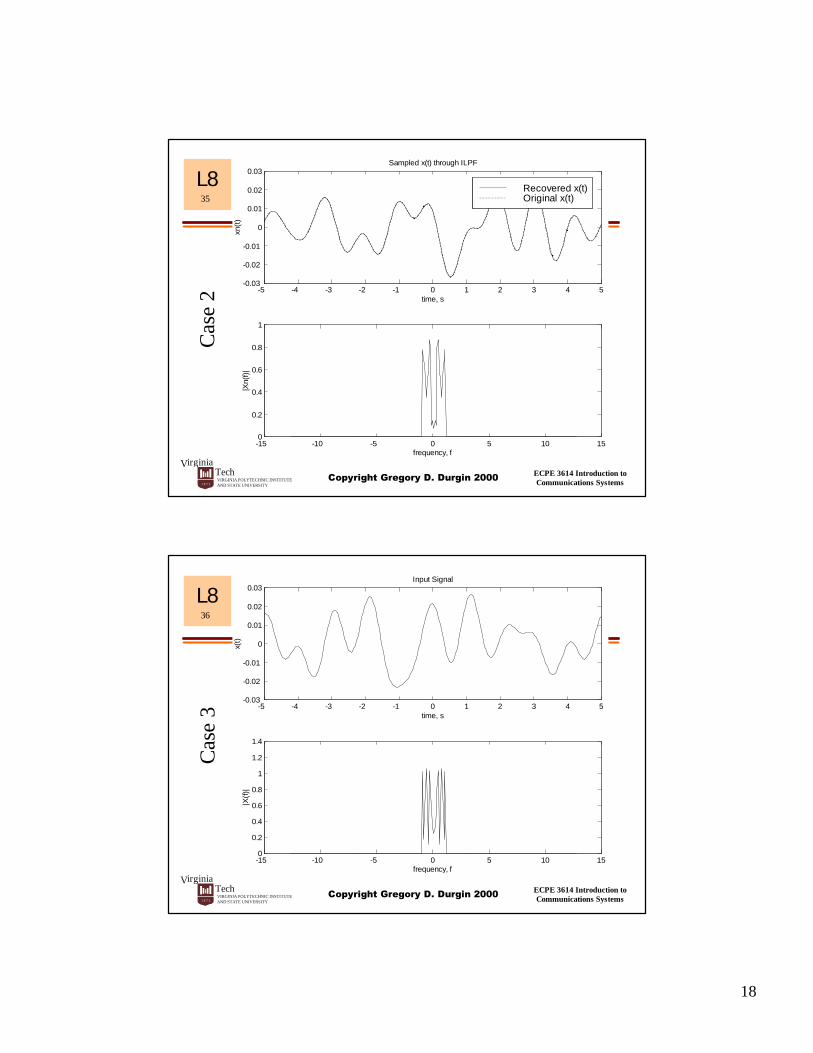
L835
-5 -4 -3 -2 -1 0 1 2 3 4 5-0.03
-0.02
-0.01
0
0.01
0.02
0.03
time, s
xn(t)
Sampled x(t) through ILPF
Recovered x(t)Original x(t)
-15 -10 -5 0 5 10 150
0.2
0.4
0.6
0.8
1
frequency, f
|Xn(
f)|
Cas
e 2
Copyright Gregory D. Durgin 2000VIRGINIA POLYTECHNIC INSTITUTEAND STATE UNIVERSITY
TechVirginia
1 8 7 2
ECPE 3614 Introduction to Communications Systems
L836
-5 -4 -3 -2 -1 0 1 2 3 4 5-0.03
-0.02
-0.01
0
0.01
0.02
0.03
time, s
x(t)
Input Signal
-15 -10 -5 0 5 10 150
0.2
0.4
0.6
0.8
1
1.2
1.4
frequency, f
|X(f)
|
Cas
e 3
19
Copyright Gregory D. Durgin 2000VIRGINIA POLYTECHNIC INSTITUTEAND STATE UNIVERSITY
TechVirginia
1 8 7 2
ECPE 3614 Introduction to Communications Systems
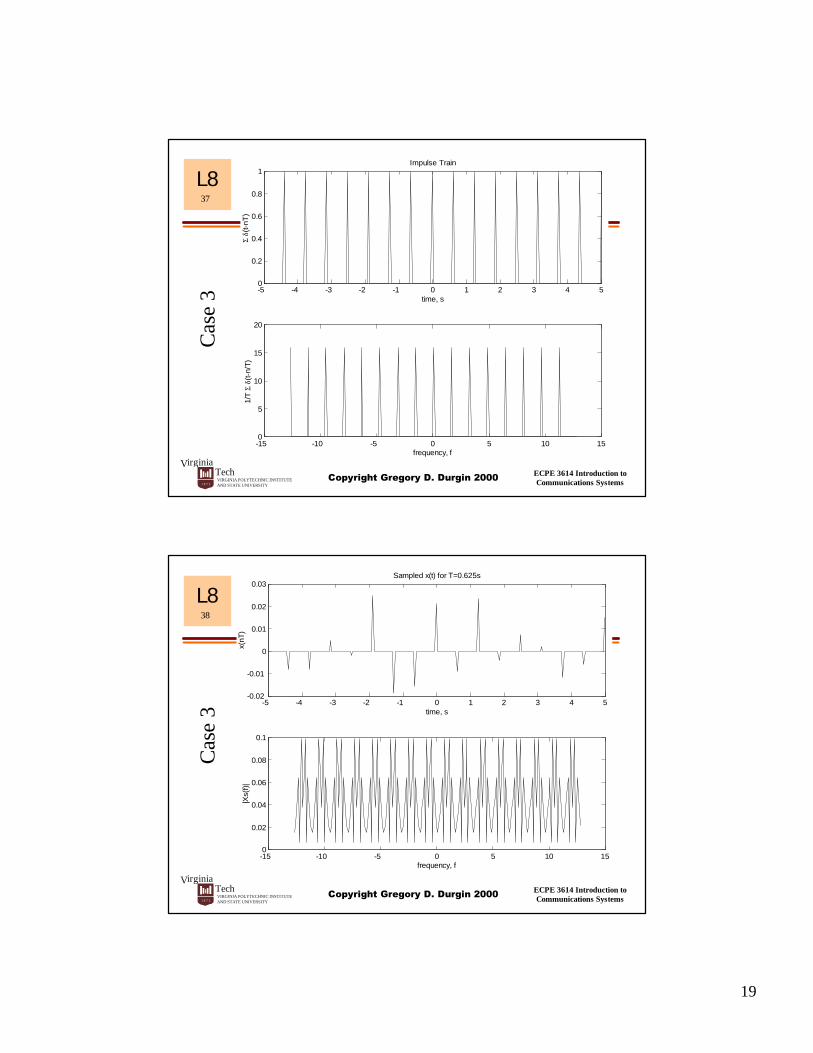
L837
-5 -4 -3 -2 -1 0 1 2 3 4 50
0.2
0.4
0.6
0.8
1
time, s
Σ δ(
t-nT)
Impulse Train
-15 -10 -5 0 5 10 150
5
10
15
20
frequency, f
1/T
Σ δ(
t-n/T
)
Cas
e 3
Copyright Gregory D. Durgin 2000VIRGINIA POLYTECHNIC INSTITUTEAND STATE UNIVERSITY
TechVirginia
1 8 7 2
ECPE 3614 Introduction to Communications Systems
L838
-5 -4 -3 -2 -1 0 1 2 3 4 5-0.02
-0.01
0
0.01
0.02
0.03
time, s
x(nT
)
Sampled x(t) for T=0.625s
-15 -10 -5 0 5 10 150
0.02
0.04
0.06
0.08
0.1
frequency, f
|Xs(
f)|
Cas
e 3

20
Copyright Gregory D. Durgin 2000VIRGINIA POLYTECHNIC INSTITUTEAND STATE UNIVERSITY
TechVirginia
1 8 7 2
ECPE 3614 Introduction to Communications Systems
L839
-5 -4 -3 -2 -1 0 1 2 3 4 5-0.04
-0.02
0
0.02
0.04
0.06
time, s
xn(t)
Sampled x(t) through ILPF
Recovered x(t)Original x(t)
-15 -10 -5 0 5 10 150
0.5
1
1.5
2
frequency, f
|Xn(
f)|
Cas
e 3
Copyright Gregory D. Durgin 2000VIRGINIA POLYTECHNIC INSTITUTEAND STATE UNIVERSITY
TechVirginia
1 8 7 2
ECPE 3614 Introduction to Communications Systems
L840
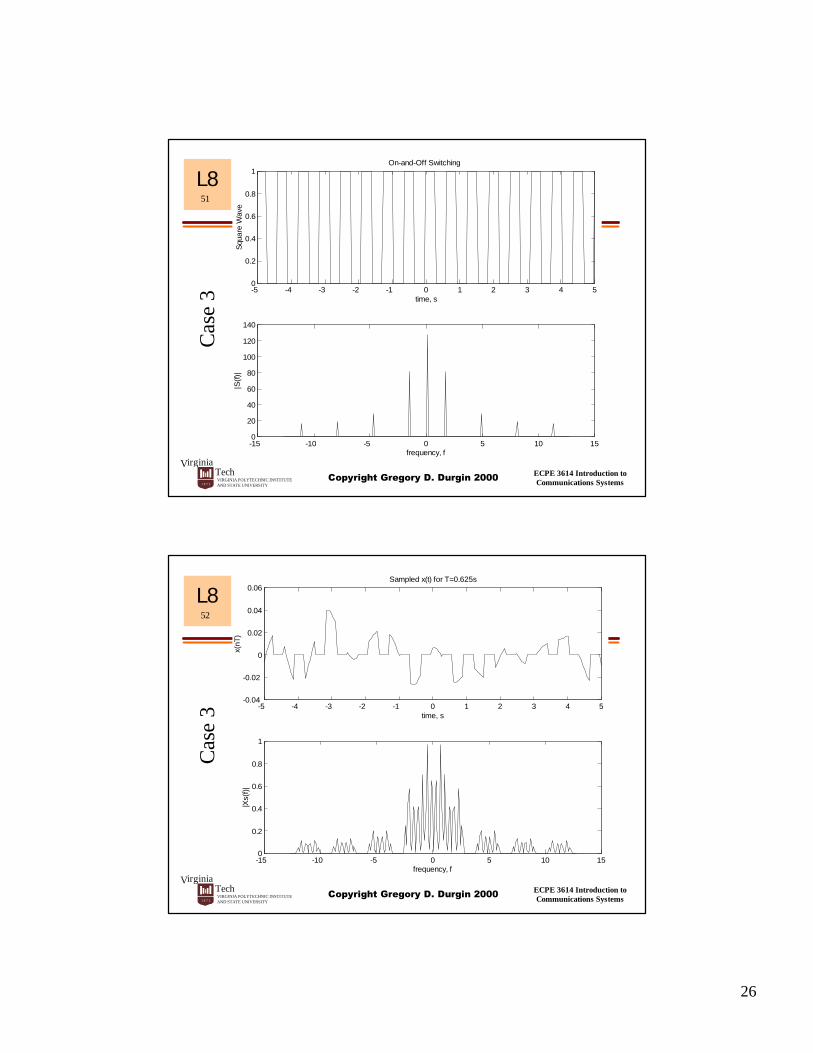
Non-Impulsive Sampling
§Any periodic waveform may be used to sample a band-limited function in the time domain – not just an impulse train.§A periodic waveform in the time domain produces
a non-uniform impulse train in the frequency domain.§Sampling in the time-domain with a non-
impulsive periodic waveform is equivalent to non-uniform replication in the frequency domain.

21
Copyright Gregory D. Durgin 2000VIRGINIA POLYTECHNIC INSTITUTEAND STATE UNIVERSITY
TechVirginia
1 8 7 2
ECPE 3614 Introduction to Communications Systems
L841
Matlab Simulation Procedure
§Generate a Random Band-Limited Signal§Sample the Band-Limited Signal in the time
domain with periodic rectangular pulses§Pass the sampled signal through an Ideal Low-
Pass Filter (ILPF)§Compare the original signal with the recovered
signal.§Repeat the exercise for decreasing sampling
periods, T.
Copyright Gregory D. Durgin 2000VIRGINIA POLYTECHNIC INSTITUTEAND STATE UNIVERSITY
TechVirginia
1 8 7 2
ECPE 3614 Introduction to Communications Systems
L842
-5 -4 -3 -2 -1 0 1 2 3 4 5-0.06
-0.04
-0.02
0
0.02
0.04
time, s
x(t)
Input Signal
-15 -10 -5 0 5 10 150
0.5
1
1.5
2
2.5
frequency, f
|X(f)
|
Cas
e 1

22
Copyright Gregory D. Durgin 2000VIRGINIA POLYTECHNIC INSTITUTEAND STATE UNIVERSITY
TechVirginia
1 8 7 2
ECPE 3614 Introduction to Communications Systems
L843
Cas
e 1 -5 -4 -3 -2 -1 0 1 2 3 4 5
0
0.2
0.4
0.6
0.8
1
time, s
Squa
re W
ave
On-and-Off Switching
-15 -10 -5 0 5 10 150
20
40
60
80
100
120
140
frequency, f
|S(f)
|
Copyright Gregory D. Durgin 2000VIRGINIA POLYTECHNIC INSTITUTEAND STATE UNIVERSITY
TechVirginia
1 8 7 2
ECPE 3614 Introduction to Communications Systems
L844
Cas
e 1 -5 -4 -3 -2 -1 0 1 2 3 4 5
-0.06
-0.04
-0.02
0
0.02
0.04
time, s
x(nT
)
Sampled x(t) for T=0.156s
-15 -10 -5 0 5 10 150
0.2
0.4
0.6
0.8
1
1.2
1.4
frequency, f
|Xs(
f)|

23
Copyright Gregory D. Durgin 2000VIRGINIA POLYTECHNIC INSTITUTEAND STATE UNIVERSITY
TechVirginia
1 8 7 2
ECPE 3614 Introduction to Communications Systems
L845
Cas
e 1 -5 -4 -3 -2 -1 0 1 2 3 4 5
-0.06
-0.04
-0.02
0
0.02
0.04
time, s
xn(t)
Sampled x(t) through ILPF
Recovered x(t)Original x(t)
-15 -10 -5 0 5 10 150
1
2
3
4
5
frequency, f
|Xn(
f)|
Copyright Gregory D. Durgin 2000VIRGINIA POLYTECHNIC INSTITUTEAND STATE UNIVERSITY
TechVirginia
1 8 7 2
ECPE 3614 Introduction to Communications Systems
L846
Cas
e 2 -5 -4 -3 -2 -1 0 1 2 3 4 5
-0.03
-0.02
-0.01
0
0.01
0.02
0.03
0.04
time, s
x(t)
Input Signal
-15 -10 -5 0 5 10 150
0.2
0.4
0.6
0.8
1
1.2
1.4
frequency, f
|X(f)
|

24
Copyright Gregory D. Durgin 2000VIRGINIA POLYTECHNIC INSTITUTEAND STATE UNIVERSITY
TechVirginia
1 8 7 2
ECPE 3614 Introduction to Communications Systems
L847
Cas
e 2 -5 -4 -3 -2 -1 0 1 2 3 4 5
0
0.2
0.4
0.6
0.8
1
time, s
Squa
re W
ave
On-and-Off Switching
-15 -10 -5 0 5 10 150
20
40
60
80
100
120
140
frequency, f
|S(f)
|
Copyright Gregory D. Durgin 2000VIRGINIA POLYTECHNIC INSTITUTEAND STATE UNIVERSITY
TechVirginia
1 8 7 2
ECPE 3614 Introduction to Communications Systems
L848
Cas
e 2 -5 -4 -3 -2 -1 0 1 2 3 4 5
-0.03
-0.02
-0.01
0
0.01
0.02
0.03
0.04
time, s
x(nT
)
Sampled x(t) for T=0.313s
-15 -10 -5 0 5 10 150
0.1
0.2
0.3
0.4
0.5
0.6
0.7
frequency, f
|Xs(
f)|

25
Copyright Gregory D. Durgin 2000VIRGINIA POLYTECHNIC INSTITUTEAND STATE UNIVERSITY
TechVirginia
1 8 7 2
ECPE 3614 Introduction to Communications Systems
L849
Cas
e 2 -5 -4 -3 -2 -1 0 1 2 3 4 5
-0.03
-0.02
-0.01
0
0.01
0.02
0.03
0.04
time, s
xn(t)
Sampled x(t) through ILPF
Recovered x(t)Original x(t)
-15 -10 -5 0 5 10 150
1
2
3
4
5
6
frequency, f
|Xn(
f)|
Copyright Gregory D. Durgin 2000VIRGINIA POLYTECHNIC INSTITUTEAND STATE UNIVERSITY
TechVirginia
1 8 7 2
ECPE 3614 Introduction to Communications Systems
L850
Cas
e 3 -5 -4 -3 -2 -1 0 1 2 3 4 5
-0.04
-0.02
0
0.02
0.04
0.06
time, s
x(t)
Input Signal
-15 -10 -5 0 5 10 150
0.5
1
1.5
2
frequency, f
|X(f)
|
26
Copyright Gregory D. Durgin 2000VIRGINIA POLYTECHNIC INSTITUTEAND STATE UNIVERSITY
TechVirginia
1 8 7 2
ECPE 3614 Introduction to Communications Systems
L851
Cas
e 3 -5 -4 -3 -2 -1 0 1 2 3 4 5
0
0.2
0.4
0.6
0.8
1
time, s
Squa
re W
ave
On-and-Off Switching
-15 -10 -5 0 5 10 150
20
40
60
80
100
120
140
frequency, f
|S(f)
|
Copyright Gregory D. Durgin 2000VIRGINIA POLYTECHNIC INSTITUTEAND STATE UNIVERSITY
TechVirginia
1 8 7 2
ECPE 3614 Introduction to Communications Systems
L852
Cas
e 3 -5 -4 -3 -2 -1 0 1 2 3 4 5
-0.04
-0.02
0
0.02
0.04
0.06
time, s
x(nT
)
Sampled x(t) for T=0.625s
-15 -10 -5 0 5 10 150
0.2
0.4
0.6
0.8
1
frequency, f
|Xs(
f)|
27
Copyright Gregory D. Durgin 2000VIRGINIA POLYTECHNIC INSTITUTEAND STATE UNIVERSITY
TechVirginia
1 8 7 2
ECPE 3614 Introduction to Communications Systems
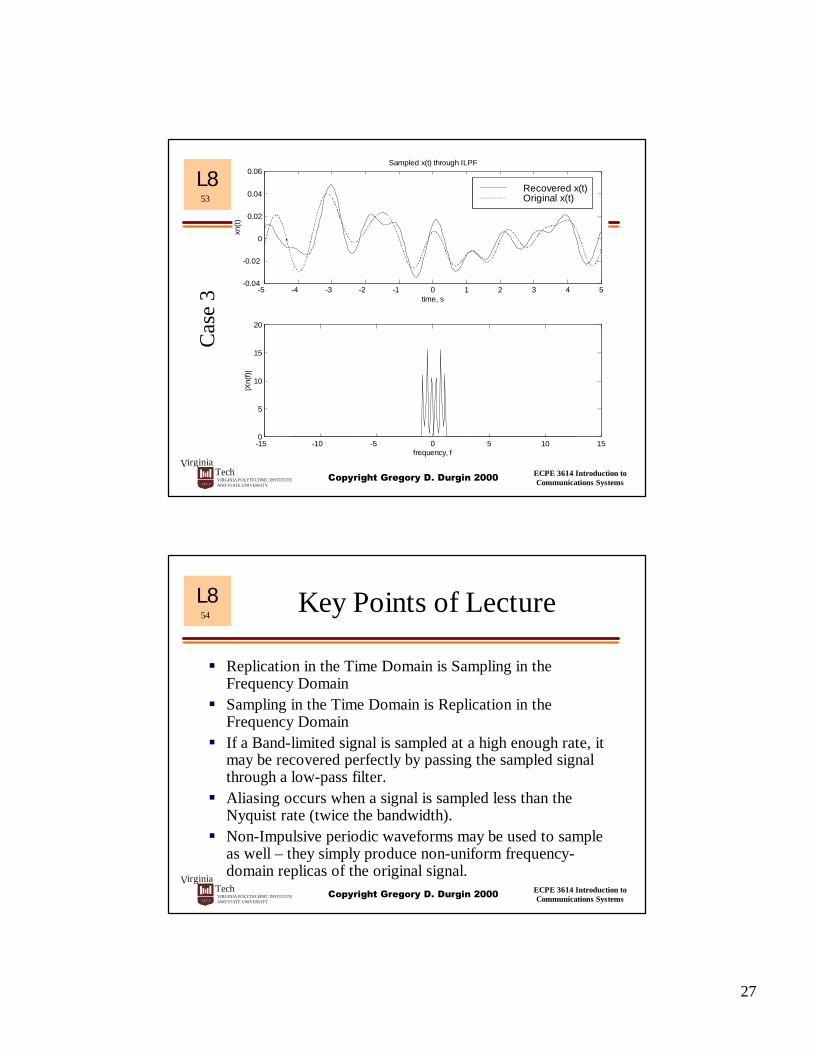
L853
Cas
e 3 -5 -4 -3 -2 -1 0 1 2 3 4 5
-0.04
-0.02
0
0.02
0.04
0.06
time, s
xn(t)
Sampled x(t) through ILPF
Recovered x(t)Original x(t)
-15 -10 -5 0 5 10 150
5
10
15
20
frequency, f
|Xn(
f)|
Copyright Gregory D. Durgin 2000VIRGINIA POLYTECHNIC INSTITUTEAND STATE UNIVERSITY
TechVirginia
1 8 7 2
ECPE 3614 Introduction to Communications Systems
L854
Key Points of Lecture
§Replication in the Time Domain is Sampling in the Frequency Domain
§ Sampling in the Time Domain is Replication in the Frequency Domain
§ If a Band-limited signal is sampled at a high enough rate, it may be recovered perfectly by passing the sampled signal through a low-pass filter.
§Aliasing occurs when a signal is sampled less than the Nyquist rate (twice the bandwidth).
§Non-Impulsive periodic waveforms may be used to sample as well – they simply produce non-uniform frequency-domain replicas of the original signal.