introduction to the ibm problem determination tools
TRANSCRIPT

ibm.com/redbooks
Introduction to theIBM ProblemDetermination Tools
Larry KahmAnand Sundaram
Overview of the Problem Determination Tools offering
Introduction to Fault Analyzer, File Manager, Debug Tool
Hints and tips for using the tools
Front cover


Introduction to the IBM Problem Determination Tools
April 2002
International Technical Support Organization
SG24-6296-00
© Copyright International Business Machines Corporation 2002. All rights reserved.Note to U.S Government Users – Documentation related to restricted rights – Use, duplication or disclosure is subject torestrictions set forth in GSA ADP Schedule Contract with IBM Corp.
First Edition (April 2002)
This edition applies to IBM Fault Analyzer for OS/390, Version 1 Release 1(PTF UQ54113), IBM File Manager for OS/390, Version 1 Release 1, and IBM Debug Tool, Version 1 Release 2.
Comments may be addressed to:IBM Corporation, International Technical Support OrganizationDept. 1WLB Building 80-E2650 Harry RoadSan Jose, California 95120-6099
When you send information to IBM, you grant IBM a non-exclusive right to use or distribute the information in any way it believes appropriate without incurring any obligation to you.
Take Note! Before using this information and the product it supports, be sure to read the general information in “Special notices” on page 219.
Contents
Preface . . . . . . . . . . . . . . . . . . . . . . . . . . . . . . . . . . . . . . . . . . . . . . . . . . . . . . . ixThe team that wrote this redbook. . . . . . . . . . . . . . . . . . . . . . . . . . . . . . . . . . . . ixSpecial notice . . . . . . . . . . . . . . . . . . . . . . . . . . . . . . . . . . . . . . . . . . . . . . . . . . . xiIBM trademarks . . . . . . . . . . . . . . . . . . . . . . . . . . . . . . . . . . . . . . . . . . . . . . . . . xiComments welcome. . . . . . . . . . . . . . . . . . . . . . . . . . . . . . . . . . . . . . . . . . . . . . xi
Part 1. IBM Problem Determination Tools . . . . . . . . . . . . . . . . . . . . . . . . . . . . . . . . . . . . 1
Chapter 1. Overview of the Problem Determination Tools . . . . . . . . . . . . . 31.1 Products used during the making of this redbook . . . . . . . . . . . . . . . . . 41.2 IBM Fault Analyzer . . . . . . . . . . . . . . . . . . . . . . . . . . . . . . . . . . . . . . . . 4
1.2.1 Fault history file . . . . . . . . . . . . . . . . . . . . . . . . . . . . . . . . . . . . . . . . . . 51.2.2 Supported languages . . . . . . . . . . . . . . . . . . . . . . . . . . . . . . . . . . . . . 51.2.3 Product requirements . . . . . . . . . . . . . . . . . . . . . . . . . . . . . . . . . . . . . 61.2.4 User exits . . . . . . . . . . . . . . . . . . . . . . . . . . . . . . . . . . . . . . . . . . . . . . 61.2.5 Latest software update . . . . . . . . . . . . . . . . . . . . . . . . . . . . . . . . . . . . 6
1.3 IBM File Manager . . . . . . . . . . . . . . . . . . . . . . . . . . . . . . . . . . . . . . . . . 71.3.1 Templates . . . . . . . . . . . . . . . . . . . . . . . . . . . . . . . . . . . . . . . . . . . . . . 81.3.2 REXX functions . . . . . . . . . . . . . . . . . . . . . . . . . . . . . . . . . . . . . . . . . . 91.3.3 Enhanced batch processing . . . . . . . . . . . . . . . . . . . . . . . . . . . . . . . . 91.3.4 Latest software update . . . . . . . . . . . . . . . . . . . . . . . . . . . . . . . . . . . . 9
1.4 IBM Debug Tool . . . . . . . . . . . . . . . . . . . . . . . . . . . . . . . . . . . . . . . . . 111.4.1 Full-screen debugging. . . . . . . . . . . . . . . . . . . . . . . . . . . . . . . . . . . . 111.4.2 Debugging tasks . . . . . . . . . . . . . . . . . . . . . . . . . . . . . . . . . . . . . . . . 131.4.3 Recently available features . . . . . . . . . . . . . . . . . . . . . . . . . . . . . . . . 131.4.4 Latest software update . . . . . . . . . . . . . . . . . . . . . . . . . . . . . . . . . . . 14
1.5 Summary . . . . . . . . . . . . . . . . . . . . . . . . . . . . . . . . . . . . . . . . . . . . . . 14
Chapter 2. Introduction to Fault Analyzer . . . . . . . . . . . . . . . . . . . . . . . . . . 152.1 Start by validating your software levels. . . . . . . . . . . . . . . . . . . . . . . . 16
2.1.1 PTF information. . . . . . . . . . . . . . . . . . . . . . . . . . . . . . . . . . . . . . . . . 162.2 How Fault Analyzer works . . . . . . . . . . . . . . . . . . . . . . . . . . . . . . . . . 17
2.2.1 The fault history file . . . . . . . . . . . . . . . . . . . . . . . . . . . . . . . . . . . . . . 182.2.2 Supported application environments. . . . . . . . . . . . . . . . . . . . . . . . . 182.2.3 A summary of real-time analysis . . . . . . . . . . . . . . . . . . . . . . . . . . . . 18
2.3 Preparing your programs for Fault Analyzer . . . . . . . . . . . . . . . . . . . . 192.3.1 Compiler options . . . . . . . . . . . . . . . . . . . . . . . . . . . . . . . . . . . . . . . . 192.3.2 What is a side file . . . . . . . . . . . . . . . . . . . . . . . . . . . . . . . . . . . . . . . 202.3.3 How to create a side file . . . . . . . . . . . . . . . . . . . . . . . . . . . . . . . . . . 20
© Copyright IBM Corp. 2002 iii

2.4 Using Fault Analyzer to re-analyze an abend . . . . . . . . . . . . . . . . . . . 222.4.1 Interactive re-analysis . . . . . . . . . . . . . . . . . . . . . . . . . . . . . . . . . . . . 222.4.2 Batch re-analysis. . . . . . . . . . . . . . . . . . . . . . . . . . . . . . . . . . . . . . . . 252.4.3 Specifying listings to Fault Analyzer for re-analysis . . . . . . . . . . . . . 26
2.5 How to set up and customize Fault Analyzer . . . . . . . . . . . . . . . . . . . 272.5.1 Invocation exits . . . . . . . . . . . . . . . . . . . . . . . . . . . . . . . . . . . . . . . . . 272.5.2 CICS set-up. . . . . . . . . . . . . . . . . . . . . . . . . . . . . . . . . . . . . . . . . . . . 272.5.3 Batch set-up . . . . . . . . . . . . . . . . . . . . . . . . . . . . . . . . . . . . . . . . . . . 282.5.4 User exits . . . . . . . . . . . . . . . . . . . . . . . . . . . . . . . . . . . . . . . . . . . . . 28
2.6 Options available to customize Fault Analyzer . . . . . . . . . . . . . . . . . . 292.6.1 How to specify these options . . . . . . . . . . . . . . . . . . . . . . . . . . . . . . 302.6.2 Order of precedence . . . . . . . . . . . . . . . . . . . . . . . . . . . . . . . . . . . . . 312.6.3 User options file . . . . . . . . . . . . . . . . . . . . . . . . . . . . . . . . . . . . . . . . 31
2.7 Hints and tips . . . . . . . . . . . . . . . . . . . . . . . . . . . . . . . . . . . . . . . . . . . 322.7.1 Systems programmer notes . . . . . . . . . . . . . . . . . . . . . . . . . . . . . . . 322.7.2 Look out for your PF keys . . . . . . . . . . . . . . . . . . . . . . . . . . . . . . . . . 332.7.3 Place abends in different fault history files . . . . . . . . . . . . . . . . . . . . 342.7.4 Send an e-mail when a program abends . . . . . . . . . . . . . . . . . . . . . 36
2.8 Product updates . . . . . . . . . . . . . . . . . . . . . . . . . . . . . . . . . . . . . . . . . 372.8.1 Changes in this PTF . . . . . . . . . . . . . . . . . . . . . . . . . . . . . . . . . . . . . 38
Chapter 3. Introduction to File Manager . . . . . . . . . . . . . . . . . . . . . . . . . . . 393.1 Start by validating your software levels. . . . . . . . . . . . . . . . . . . . . . . . 40
3.1.1 PTF information. . . . . . . . . . . . . . . . . . . . . . . . . . . . . . . . . . . . . . . . . 403.2 Useful examples of how to use File Manager . . . . . . . . . . . . . . . . . . . 41
3.2.1 Conventions used . . . . . . . . . . . . . . . . . . . . . . . . . . . . . . . . . . . . . . . 413.2.2 How to perform a global find and replace in a PDS . . . . . . . . . . . . . 423.2.3 How to create one VSAM file using another as a model. . . . . . . . . . 463.2.4 How to initialize a VSAM file with low-value records. . . . . . . . . . . . . 483.2.5 How to split a single file into constituent record types. . . . . . . . . . . . 51
3.3 Useful batch utilities . . . . . . . . . . . . . . . . . . . . . . . . . . . . . . . . . . . . . . 553.3.1 Replace a string in a specific location in a file. . . . . . . . . . . . . . . . . . 553.3.2 Copy selected variably blocked records to another file . . . . . . . . . . . 563.3.3 Search for a string in all members of a PDS . . . . . . . . . . . . . . . . . . . 58
3.4 Template processing . . . . . . . . . . . . . . . . . . . . . . . . . . . . . . . . . . . . . 613.4.1 It really does remember the copybook . . . . . . . . . . . . . . . . . . . . . . . 623.4.2 How to process COPY REPLACING statements . . . . . . . . . . . . . . . 633.4.3 How to build a template for multi-record file layouts . . . . . . . . . . . . . 65
3.5 Hints and tips . . . . . . . . . . . . . . . . . . . . . . . . . . . . . . . . . . . . . . . . . . . 663.5.1 Systems programmer notes . . . . . . . . . . . . . . . . . . . . . . . . . . . . . . . 663.5.2 Look out for your PF keys . . . . . . . . . . . . . . . . . . . . . . . . . . . . . . . . . 683.5.3 How to quickly locate a record in Browse . . . . . . . . . . . . . . . . . . . . . 683.5.4 What to do when a copybook fails to compile . . . . . . . . . . . . . . . . . . 70
iv Introduction to the IBM Problem Determination Tools

3.5.5 Record structure defined in source application program. . . . . . . . . . 713.5.6 Watch out for that bad disposition . . . . . . . . . . . . . . . . . . . . . . . . . . . 71
3.6 Product updates . . . . . . . . . . . . . . . . . . . . . . . . . . . . . . . . . . . . . . . . . 72
Chapter 4. Introduction to Debug Tool . . . . . . . . . . . . . . . . . . . . . . . . . . . . 754.1 Start by validating your software levels. . . . . . . . . . . . . . . . . . . . . . . . 76
4.1.1 APAR information . . . . . . . . . . . . . . . . . . . . . . . . . . . . . . . . . . . . . . . 764.2 What you need to prepare your application program. . . . . . . . . . . . . . 77
4.2.1 A description of the TEST compile option . . . . . . . . . . . . . . . . . . . . . 784.2.2 Additional compiler option information . . . . . . . . . . . . . . . . . . . . . . . 794.2.3 Required output files . . . . . . . . . . . . . . . . . . . . . . . . . . . . . . . . . . . . . 794.2.4 Link-edit options . . . . . . . . . . . . . . . . . . . . . . . . . . . . . . . . . . . . . . . . 804.2.5 Sample batch compile job . . . . . . . . . . . . . . . . . . . . . . . . . . . . . . . . . 814.2.6 Summary. . . . . . . . . . . . . . . . . . . . . . . . . . . . . . . . . . . . . . . . . . . . . . 82
4.3 What it takes to debug your application program . . . . . . . . . . . . . . . . 834.3.1 A description of the TEST runtime option . . . . . . . . . . . . . . . . . . . . . 834.3.2 How to determine your site’s runtime options . . . . . . . . . . . . . . . . . . 844.3.3 What else is required . . . . . . . . . . . . . . . . . . . . . . . . . . . . . . . . . . . . 854.3.4 Debug Tool's supporting files . . . . . . . . . . . . . . . . . . . . . . . . . . . . . . 864.3.5 Batch invocation . . . . . . . . . . . . . . . . . . . . . . . . . . . . . . . . . . . . . . . . 864.3.6 DB2 application program considerations . . . . . . . . . . . . . . . . . . . . . 874.3.7 CICS application program considerations. . . . . . . . . . . . . . . . . . . . . 88
4.4 The primary interface for Debug Tool . . . . . . . . . . . . . . . . . . . . . . . . . 904.4.1 Review of screen areas. . . . . . . . . . . . . . . . . . . . . . . . . . . . . . . . . . . 904.4.2 Descriptions of frequently used commands . . . . . . . . . . . . . . . . . . . 91
4.5 New features of Debug Tool . . . . . . . . . . . . . . . . . . . . . . . . . . . . . . . . 944.5.1 Dynamic Debug. . . . . . . . . . . . . . . . . . . . . . . . . . . . . . . . . . . . . . . . . 954.5.2 Separate Debug File . . . . . . . . . . . . . . . . . . . . . . . . . . . . . . . . . . . . . 954.5.3 Advantages . . . . . . . . . . . . . . . . . . . . . . . . . . . . . . . . . . . . . . . . . . . . 964.5.4 How this helps application programmers . . . . . . . . . . . . . . . . . . . . . 96
4.6 Hints and tips . . . . . . . . . . . . . . . . . . . . . . . . . . . . . . . . . . . . . . . . . . . 964.6.1 Systems programmer notes . . . . . . . . . . . . . . . . . . . . . . . . . . . . . . . 964.6.2 Customer concerns . . . . . . . . . . . . . . . . . . . . . . . . . . . . . . . . . . . . . . 974.6.3 How to point to a debug file or listing . . . . . . . . . . . . . . . . . . . . . . . . 984.6.4 Recording how many times each source line runs . . . . . . . . . . . . . . 99
Chapter 5. Implementing the tools in your environment . . . . . . . . . . . . . 1015.1 Fault Analyzer components . . . . . . . . . . . . . . . . . . . . . . . . . . . . . . . 102
5.1.1 Listings . . . . . . . . . . . . . . . . . . . . . . . . . . . . . . . . . . . . . . . . . . . . . . 1025.1.2 Side files . . . . . . . . . . . . . . . . . . . . . . . . . . . . . . . . . . . . . . . . . . . . . 1035.1.3 Output file size comparison. . . . . . . . . . . . . . . . . . . . . . . . . . . . . . . 1045.1.4 Steps toward implementation . . . . . . . . . . . . . . . . . . . . . . . . . . . . . 1045.1.5 Summary. . . . . . . . . . . . . . . . . . . . . . . . . . . . . . . . . . . . . . . . . . . . . 108
Contents v

5.2 File Manager components . . . . . . . . . . . . . . . . . . . . . . . . . . . . . . . . 1085.2.1 Templates . . . . . . . . . . . . . . . . . . . . . . . . . . . . . . . . . . . . . . . . . . . . 1095.2.2 File associations . . . . . . . . . . . . . . . . . . . . . . . . . . . . . . . . . . . . . . . 1095.2.3 Steps toward implementation . . . . . . . . . . . . . . . . . . . . . . . . . . . . . 1095.2.4 Summary. . . . . . . . . . . . . . . . . . . . . . . . . . . . . . . . . . . . . . . . . . . . . 111
5.3 Debug Tool components . . . . . . . . . . . . . . . . . . . . . . . . . . . . . . . . . 1125.3.1 Load modules . . . . . . . . . . . . . . . . . . . . . . . . . . . . . . . . . . . . . . . . . 1125.3.2 Listings . . . . . . . . . . . . . . . . . . . . . . . . . . . . . . . . . . . . . . . . . . . . . . 1125.3.3 Side files . . . . . . . . . . . . . . . . . . . . . . . . . . . . . . . . . . . . . . . . . . . . . 1135.3.4 Steps toward implementation . . . . . . . . . . . . . . . . . . . . . . . . . . . . . 113
5.4 Common ground. . . . . . . . . . . . . . . . . . . . . . . . . . . . . . . . . . . . . . . . 115
Part 2. Scenarios using the Problem Determination Tools . . . . . . . . . . . . . . . . . . . . 117
Chapter 6. Introduction to the scenarios . . . . . . . . . . . . . . . . . . . . . . . . . 1196.1 Scenarios overview . . . . . . . . . . . . . . . . . . . . . . . . . . . . . . . . . . . . . 120
6.1.1 Overview of the programs . . . . . . . . . . . . . . . . . . . . . . . . . . . . . . . . 1206.1.2 The application program environment. . . . . . . . . . . . . . . . . . . . . . . 122
6.2 Install the application software . . . . . . . . . . . . . . . . . . . . . . . . . . . . . 1236.2.1 Install the demo files . . . . . . . . . . . . . . . . . . . . . . . . . . . . . . . . . . . . 1236.2.2 Copy the demo files to your user ID . . . . . . . . . . . . . . . . . . . . . . . . 1236.2.3 Set up the applications . . . . . . . . . . . . . . . . . . . . . . . . . . . . . . . . . . 124
6.3 About the system configuration . . . . . . . . . . . . . . . . . . . . . . . . . . . . 1256.3.1 S/390 software prerequisites. . . . . . . . . . . . . . . . . . . . . . . . . . . . . . 1266.3.2 About the CICS configuration . . . . . . . . . . . . . . . . . . . . . . . . . . . . . 1266.3.3 About the DB2 configuration . . . . . . . . . . . . . . . . . . . . . . . . . . . . . . 127
6.4 Validate the installation . . . . . . . . . . . . . . . . . . . . . . . . . . . . . . . . . . 1276.4.1 Getting started. . . . . . . . . . . . . . . . . . . . . . . . . . . . . . . . . . . . . . . . . 1276.4.2 Starting the Trader application in CICS. . . . . . . . . . . . . . . . . . . . . . 1286.4.3 Running the Trader application in batch . . . . . . . . . . . . . . . . . . . . . 128
6.5 Summary . . . . . . . . . . . . . . . . . . . . . . . . . . . . . . . . . . . . . . . . . . . . . 129
Chapter 7. Scenario 1: Using Fault Analyzer and File Manager . . . . . . . 1317.1 Set up the components. . . . . . . . . . . . . . . . . . . . . . . . . . . . . . . . . . . 132
7.1.1 CICS components . . . . . . . . . . . . . . . . . . . . . . . . . . . . . . . . . . . . . . 1327.1.2 Program products . . . . . . . . . . . . . . . . . . . . . . . . . . . . . . . . . . . . . . 132
7.2 Walkthrough of the CICS Trader application . . . . . . . . . . . . . . . . . . . 1337.2.1 Log on to the application . . . . . . . . . . . . . . . . . . . . . . . . . . . . . . . . . 1347.2.2 Obtaining quotes . . . . . . . . . . . . . . . . . . . . . . . . . . . . . . . . . . . . . . . 1367.2.3 Buying shares . . . . . . . . . . . . . . . . . . . . . . . . . . . . . . . . . . . . . . . . . 1367.2.4 Selling shares . . . . . . . . . . . . . . . . . . . . . . . . . . . . . . . . . . . . . . . . . 137
7.3 Tracking an abend in the application . . . . . . . . . . . . . . . . . . . . . . . . 1387.3.1 Viewing the abend in Fault Analyzer . . . . . . . . . . . . . . . . . . . . . . . . 1397.3.2 Initiating interactive re-analysis for the abend. . . . . . . . . . . . . . . . . 141
vi Introduction to the IBM Problem Determination Tools

7.3.3 Using File Manager to correct a problem with data. . . . . . . . . . . . . 1467.3.4 Running the application after the fix . . . . . . . . . . . . . . . . . . . . . . . . 150
7.4 Summary of Scenario 1 . . . . . . . . . . . . . . . . . . . . . . . . . . . . . . . . . . 151
Chapter 8. Scenario 2: Using Debug Tool . . . . . . . . . . . . . . . . . . . . . . . . . 1538.1 Set up the components. . . . . . . . . . . . . . . . . . . . . . . . . . . . . . . . . . . 154
8.1.1 Batch components . . . . . . . . . . . . . . . . . . . . . . . . . . . . . . . . . . . . . 1548.1.2 Program products . . . . . . . . . . . . . . . . . . . . . . . . . . . . . . . . . . . . . . 154
8.2 Walkthrough of the batch Trader application . . . . . . . . . . . . . . . . . . 1558.2.1 The Trader batch job. . . . . . . . . . . . . . . . . . . . . . . . . . . . . . . . . . . . 1558.2.2 The Transaction file. . . . . . . . . . . . . . . . . . . . . . . . . . . . . . . . . . . . . 1568.2.3 Listing shares . . . . . . . . . . . . . . . . . . . . . . . . . . . . . . . . . . . . . . . . . 1578.2.4 Buying shares . . . . . . . . . . . . . . . . . . . . . . . . . . . . . . . . . . . . . . . . . 1578.2.5 Selling shares . . . . . . . . . . . . . . . . . . . . . . . . . . . . . . . . . . . . . . . . . 158
8.3 Tracking a problem with the application . . . . . . . . . . . . . . . . . . . . . . 1588.3.1 Using Debug Tool in batch mode to try to find the error . . . . . . . . . 1608.3.2 Using Debug Tool in foreground to pin-point the solution . . . . . . . . 1638.3.3 Executing the batch application after the fix . . . . . . . . . . . . . . . . . . 169
8.4 Summary of Scenario 2 . . . . . . . . . . . . . . . . . . . . . . . . . . . . . . . . . . 170
Chapter 9. Scenario 3: Using File Manager/DB2 and Debug Tool . . . . . 1719.1 Set up the components. . . . . . . . . . . . . . . . . . . . . . . . . . . . . . . . . . . 172
9.1.1 CICS and DB2 components . . . . . . . . . . . . . . . . . . . . . . . . . . . . . . 1729.1.2 Program products . . . . . . . . . . . . . . . . . . . . . . . . . . . . . . . . . . . . . . 172
9.2 Walkthrough of the Trader application . . . . . . . . . . . . . . . . . . . . . . . 1739.3 Tracking a problem in the application . . . . . . . . . . . . . . . . . . . . . . . . 174
9.3.1 Recreating the error . . . . . . . . . . . . . . . . . . . . . . . . . . . . . . . . . . . . 1749.3.2 Viewing the data in File Manager/DB2 . . . . . . . . . . . . . . . . . . . . . . 1769.3.3 Using Debug Tool to identify the logic problem. . . . . . . . . . . . . . . . 1799.3.4 Using File Manager/DB2 to correct the data . . . . . . . . . . . . . . . . . . 185
9.4 Summary of Scenario 3 . . . . . . . . . . . . . . . . . . . . . . . . . . . . . . . . . . 187
Part 3. Appendixes . . . . . . . . . . . . . . . . . . . . . . . . . . . . . . . . . . . . . . . . . . . . . . . . . . . . 189
Appendix A. Problem determination tools supporting information . . . . 191Fault Analyzer Notification user exit . . . . . . . . . . . . . . . . . . . . . . . . . . . . 192File Manager ISPF panel modifications . . . . . . . . . . . . . . . . . . . . . . . . . . 198File Manager batch job to process multi-record file . . . . . . . . . . . . . . . . . 199Language Environment runtime options report . . . . . . . . . . . . . . . . . . . . 201Convert multiple sequential files to members of a PDS . . . . . . . . . . . . . . 203Components of the Trader application . . . . . . . . . . . . . . . . . . . . . . . . . . . 205
Appendix B. Fault Analyzer fault history file conversion . . . . . . . . . . . . 207Background . . . . . . . . . . . . . . . . . . . . . . . . . . . . . . . . . . . . . . . . . . . . . . . . . . 208
Contents vii

Old and new do not mix . . . . . . . . . . . . . . . . . . . . . . . . . . . . . . . . . . . . . . 208Perform the conversion . . . . . . . . . . . . . . . . . . . . . . . . . . . . . . . . . . . . . . . . . 210
Conversion batch job . . . . . . . . . . . . . . . . . . . . . . . . . . . . . . . . . . . . . . . . 210Batch report output . . . . . . . . . . . . . . . . . . . . . . . . . . . . . . . . . . . . . . . . . . 211Data set comparison . . . . . . . . . . . . . . . . . . . . . . . . . . . . . . . . . . . . . . . . . 212Results after the conversion . . . . . . . . . . . . . . . . . . . . . . . . . . . . . . . . . . . 213
Appendix C. Additional material . . . . . . . . . . . . . . . . . . . . . . . . . . . . . . . . 215Locating the Web material . . . . . . . . . . . . . . . . . . . . . . . . . . . . . . . . . . . . . . . 215Using the Web material . . . . . . . . . . . . . . . . . . . . . . . . . . . . . . . . . . . . . . . . . 215
System requirements for downloading the Web material . . . . . . . . . . . . . 216How to use the Web material . . . . . . . . . . . . . . . . . . . . . . . . . . . . . . . . . . 216
Related publications . . . . . . . . . . . . . . . . . . . . . . . . . . . . . . . . . . . . . . . . . . 217IBM Redbooks . . . . . . . . . . . . . . . . . . . . . . . . . . . . . . . . . . . . . . . . . . . . . . . . 217
Other resources . . . . . . . . . . . . . . . . . . . . . . . . . . . . . . . . . . . . . . . . . . . . 217Referenced Web sites . . . . . . . . . . . . . . . . . . . . . . . . . . . . . . . . . . . . . . . . . . 218How to get IBM Redbooks . . . . . . . . . . . . . . . . . . . . . . . . . . . . . . . . . . . . . . . 218
IBM Redbooks collections. . . . . . . . . . . . . . . . . . . . . . . . . . . . . . . . . . . . . 218
Special notices . . . . . . . . . . . . . . . . . . . . . . . . . . . . . . . . . . . . . . . . . . . . . . . 219
Index . . . . . . . . . . . . . . . . . . . . . . . . . . . . . . . . . . . . . . . . . . . . . . . . . . . . . . . 221
viii Introduction to the IBM Problem Determination Tools

Preface
This IBM Redbook describes the IBM Problem Determination Tools and includes scenarios that show how to use the tools to recognize, locate, and fix errors in application programs.
Part 1, “IBM Problem Determination Tools” describes the three program products that make up the suite: IBM Fault Analyzer, IBM File Manager, and IBM Debug Tool. It also discusses how you can implement these products at your site.
Part 2, “Scenarios using the Problem Determination Tools” walks you through detailed scenarios that demonstrate how the tools can be used in a practical day-to-day manner.
Part 3, “Appendixes” contains code samples, reports and listings, and examples that are too large to include in the chapters.
The team that wrote this redbookThis redbook was produced by a team of specialists from around the world working at the International Technical Support Organization, San Jose Center.
Larry Kahm is President of Heliotropic Systems, Inc., an IBM Business Partner located in Fort Lee, New Jersey, which provides systems analysis and design solutions for Fortune 500 companies. He has fifteen years experience evaluating and deploying mainframe productivity tools and advocating their use. His areas of expertise include application change management (methodology and software solutions), application development technical support, and ISPF dialog development. This is his first redbook.
Anand Sundaram is a software engineer at IBM Global Services Ltd., Bangalore, India. He is currently working on projects on the S/390 platform for IBM, Gaithersburg. He has five years experience working on S/390 and ES/9000 platforms. His areas of expertise include application programming in CICS, COBOL, PL/I, DB2, VSAM, and REXX.
Thanks to the following people for their technical contributions to this project:
Francisco Anaya, IBM Silicon Valley Laboratory, San Jose, California
Rick Arellanes, IBM Silicon Valley Laboratory, San Jose, California
© Copyright IBM Corp. 2002 ix

Deborah Cottingham, International Technical Support Organization, San Jose Center
Tyrone Dalais, Australian Programming Centre, IBM Global Services Australia
Graham Hannington, Australian Programming Centre, IBM Global Services Australia
Lars Hultin, IBM Silicon Valley Laboratory, San Jose, California
Genevieve Inman, IBM Silicon Valley Laboratory, San Jose, California
Jeff A. Jones, IBM, Mount Laurel, New Jersey
David King, IBM Silicon Valley Laboratory, San Jose, California
John Leake, IBM Silicon Valley Laboratory, San Jose, California
Jennie Mao, IBM Silicon Valley Laboratory, San Jose, California
Jim McIntosh, IBM Silicon Valley Laboratory, San Jose, California
Jean Nardi, IBM Silicon Valley Laboratory, San Jose, California
Anthony (Tony) Piner, IBM Hursley, United Kingdom
Patricia Ramirez, IBM Silicon Valley Laboratory, San Jose, California
Harrison Scofield, IBM Silicon Valley Laboratory, San Jose, California
Ira Sheftman, IBM Silicon Valley Laboratory, San Jose, California
Thomas Soriano, IBM Silicon Valley Laboratory, San Jose, California
Al Tortorice, IBM Raleigh, Raleigh, North Carolina
Grant Sutherland, Australian Programming Centre, IBM Global Services Australia
Rod Turner, Australian Programming Centre, IBM Global Services Australia
Jose Vargas, IBM Silicon Valley Laboratory, San Jose, California
Marty Shelton and David Tran, IBM Silicon Valley Laboratory, San Jose, California
x Introduction to the IBM Problem Determination Tools

Joe DeCarloEmma JacobsYvonne LyonInternational Technical Support Organization, San Jose Center
Special noticeThis publication is intended to help traditional application programmers, who develop and maintain mainframe-based COBOL application programs, in their everyday work. It is also intended to help systems programmers by providing hints and tips regarding the Problem Determination Tool’s post-installation tasks. The information in this publication is not intended as the specification of any programming interfaces that are provided by IBM Fault Analyzer for OS/390, Version 1 Release 1(PTF UQ54113); IBM File Manager for OS/390, Version 1 Release 1; and IBM Debug Tool, Version 1 Release 2.
See the PUBLICATIONS section of the IBM Programming Announcement for IBM Fault Analyzer for OS/390, Version 1 Release 1(PTF UQ54113); IBM File Manager for OS/390, Version 1 Release 1; and IBM Debug Tool, Version 1 Release 2, for more information about what publications are considered to be product documentation.
IBM trademarksThe following terms are trademarks of the International Business Machines Corporation in the United States and/or other countries:
Comments welcomeYour comments are important to us!
We want our IBM Redbooks to be as helpful as possible. Send us your comments about this or other Redbooks in one of the following ways:
e (logo)® IBM ®CICS®DB2®ES/9000®IMS™Language Environment®MVS™
Redbooks Logo™ OS/390®S/390®SecureWay®SP™System/390®WebSphere®z/OS™
Preface xi

� Use the online Contact us review redbook form found at:
ibm.com/redbooks
� Send your comments in an Internet note to:
� Mail your comments to the address on page ii.
xii Introduction to the IBM Problem Determination Tools

Part 1 IBM Problem Determination Tools
In part one we introduce the three IBM Problem Determination Tools:
� IBM Fault Analyzer� IBM File Manager� IBM Debug Tool
We begin with an overview of the products. For each product, we describe the software levels that are needed to use it effectively, and some of the post-installation tasks. Each chapter contains a review of key features and functions. We end this part with a chapter that discusses how these products can be implemented in your environment.
Part 1
© Copyright IBM Corp. 2002 1

2 Introduction to the IBM Problem Determination Tools
Chapter 1. Overview of the Problem Determination Tools
This redbook describes the IBM Problem Determination Tools and includes scenarios that show how to use the tools to recognize, locate, and fix problems with application programs.
The following products comprise the Problem Determination Tools:
� IBM Fault Analyzer� IBM File Manager� IBM Debug Tool
By using these tools, an application programmer can more quickly and easily identify and resolve problems that occur in batch and CICS application programs.
There are many features within this suite of tools that can help you perform day-to-day tasks. You can enhance your application development skills by learning how these tools work and by using them effectively.
1
© Copyright IBM Corp. 2002 3

1.1 Products used during the making of this redbookWe wrote this redbook in the summer of 2001. During our residency we worked with following versions and releases of the Problem Determination Tools:
� IBM Fault Analyzer for OS/390, Version 1 Release 1(PTF UQ54113)� IBM File Manager for OS/390, Version 1 Release 1� IBM Debug Tool, Version 1 Release 2
The code and examples presented in these chapters will work with these releases, and should (with very little modification) work with future releases of these products.
Towards the end of our residency, two products were updated and we worked with them briefly.
� IBM Fault Analyzer for OS/390, Version 1 Release 1 (PTF UQ55392)� IBM File Manager for z/OS and OS/390, Version 2 Release 1
We include examples of these updates where appropriate.
Because of the lead time between our work and the publication date, even newer releases or versions of these products may be available. We invite you to review the Web sites listed in the Bibliography for the latest available product information.
1.2 IBM Fault AnalyzerIBM Fault Analyzer helps you as a typical application programmer to find the cause of abends in application programs. You can use it for problem determination while developing application programs or while they are in production.
While Fault Analyzer is designed to support the efforts of application programmers, systems programmers can use their talents to customize the product for optimal use at each site.
Specific system exits are required to allow Fault Analyzer to intercept abends when they occur. We describe these exits in detail in Chapter 2, “Introduction to Fault Analyzer” on page 15.
The key features of Fault Analyzer are:
� Diagnostics and problem determination� Easy to understand expansion of messages and error codes� Management of application program abends
4 Introduction to the IBM Problem Determination Tools
� Elimination of the need to recompile application programs or to change JCL� Support for real-time, interactive, and batch modes of operation
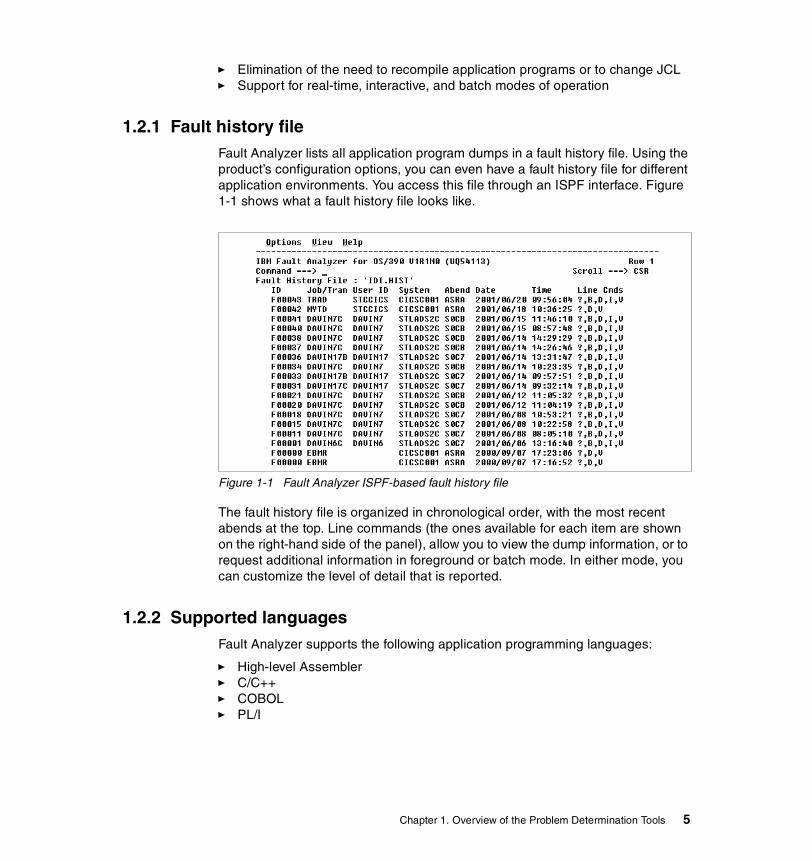
1.2.1 Fault history fileFault Analyzer lists all application program dumps in a fault history file. Using the product’s configuration options, you can even have a fault history file for different application environments. You access this file through an ISPF interface. Figure 1-1 shows what a fault history file looks like.
Figure 1-1 Fault Analyzer ISPF-based fault history file
The fault history file is organized in chronological order, with the most recent abends at the top. Line commands (the ones available for each item are shown on the right-hand side of the panel), allow you to view the dump information, or to request additional information in foreground or batch mode. In either mode, you can customize the level of detail that is reported.
1.2.2 Supported languagesFault Analyzer supports the following application programming languages:
� High-level Assembler� C/C++� COBOL� PL/I
Chapter 1. Overview of the Problem Determination Tools 5

1.2.3 Product requirementsTo provide a detailed look at the cause of an abend, including the actual source statement in error and the values of the variables at the time of an abend, Fault Analyzer requires one of two forms of output from the compilation of an application program.
ListingThis is the standard output file from a compile (or the ADATA file from a High Level Assembler program).
Side fileThis is a highly condensed form of the compiler listing, produced by a Fault Analyzer utility after a compile.
In 2.3.3, “How to create a side file” on page 20, we show you how to create a side file. We provide you with further insights into their usefulness in “Implementing the tools in your environment” on page 101.
1.2.4 User exitsFault Analyzer provides you with entry points to user exits, which can be written to perform a variety of tasks when application program errors occur. These user exits include the ability to:
� Reformat a dump to include site-specific information� Send users messages about the abending job� Suppress duplicate dumps and record the number of instances
We provide you with samples of two REXX user exits for you to use as is, or to modify for your needs.
1.2.5 Latest software updateTwo updates are available for Fault Analyzer: One is an update for Version 1; the other is a new version of the product.
Version 1 updateThe latest Program Temporary Fix (PTF) for Fault Analyzer, UQ55392, provides the following changes to the product.
� Improved the performance of the fault history file
This is accomplished by changing the structure of the file from a VSAM KSDS file to a partitioned data set (PDS) or PDS/E.
6 Introduction to the IBM Problem Determination Tools
� The introduction of a batch utility program for fault history file management
This utility provides batch list, delete, and import capabilities for the PDS or PDS/E files.
Note: The updated user’s guide, including the documentation that describes the utility program, is supplied with the PTF.
Appendix B, “Fault Analyzer fault history file conversion” on page 207, describes our experiences after this PTF was implemented.
Version 2 Release 1
The most recent version of Fault Analyzer contains several product updates, which includes the ones introduced in the last PTF for Version 1, and offers the following new features:
� CICS system abend support, including:
– Trace table analysis– Last 3270 screen analysis– CICS domain control block mapping
� MQ Series support, including:
– Analysis of abends when calling MQ Series Application Programming Interfaces (APIs)
– Display of COBOL or PL/I source code that led to the abend
� Improved security, including:
– Additional subsystem security options– Rules-based security administrator options
1.3 IBM File ManagerIBM File Manager provides powerful functions for you, an application programmer, to use. However, even operations support personnel or systems programmers will find it useful. The product’s utilities gives you the ability to:
� Browse, edit, copy, and print:
– QSAM data sets– VSAM data sets– PDS members
� Work with data formatted according to record structure, arranged into fields.
� Edit entire files, regardless of size.
� Work with files containing multiple record structures.
Chapter 1. Overview of the Problem Determination Tools 7

� Use flexible criteria to select records.
� Find and change data within particular fields.
� Identify records that do not match a recognized structure, or that contain invalid values.
� Create data with fields initialized according to flexible patterns.
� Automate tasks in batch jobs, using File Manager functions and REXX procedures.
File Manager uses a standard ISPF interface, as depicted in Figure 1-2.
Figure 1-2 File Manager ISPF main menu
Two key features of File Manager enable you to perform advanced or very detailed data manipulation:
� Templates� REXX functions
1.3.1 TemplatesFile Manager uses templates to provide a logical view of your data. To enable File Manager to determine the record structure of a file, supply a copybook containing COBOL data description entries. File Manager interprets each Level-01 group item in the copybook as a record structure, and each elementary item as a field.
8 Introduction to the IBM Problem Determination Tools

After File Manager creates a template, you can add selection criteria and other formatting information. You use templates to map the data in your application files for a concise view of the contents. This includes the ability to view multi-record files, even if these files are defined by more than one copybook.
You can save templates (to eliminate the need to recreate them each time you browse or edit a file) and use them with different File Manager utilities.
1.3.2 REXX functionsFile Manager’s external REXX functions allow you to manipulate data in the foreground, even while using templates. This gives you the opportunity to selectively work with just the records you want to. In addition to all of the functions available in REXX, File Manager has several product-specific functions, which include:
� FLD, allows you to refer to a field from the current input record.� NCONTAIN, lets you check for the existence of numeric values in a field.� TALLY, lets you total a field and report the value.
You can develop REXX procedures to take the place of repetitive, manual functions and then save these routines to a common data set.
1.3.3 Enhanced batch processingAll of the File Manager functions are available as primary commands in batch mode. You can easily enhance File Manager with your own procedures written in REXX. This could allow you to potentially reduce the number of COBOL application programs that perform utility functions, such as extracting certain record types from a file.
We describe how to use templates and provide sample REXX routines that you can use as is, or modify for your use, in Chapter 3, “Introduction to File Manager” on page 39.
1.3.4 Latest software updateThe most recent version of File Manager contains several product updates, and offers support for manipulating DB2 data and IMS data.
� Version 2 of File Manager includes the following elements in one package:
– File Manager for z/OS and OS/390 (the base product), for working with z/OS or OS/390 data sets (QSAM data sets, VSAM data sets and PDS members).
– File Manager/DB2 Feature, for working with DB2 data.
Chapter 1. Overview of the Problem Determination Tools 9

– File Manager/IMS Feature, for working with IMS data.
� In addition to the existing support for COBOL copybooks, you can now create templates based on record structures defined in PL/I DECLARE statements.
� If your copybooks use COBOL COPY compiler-directing statements or PL/I %INCLUDE directives to include other members that do not exist in the same PDS as the copybook, you can now specify up to ten data sets where these other members are stored.
File Manager/DB2 FeatureThis new feature extends the capabilities of File Manager to work with DB2 data.
� All of the standard File Manager functions are available, specifically designed for manipulating DB2:
– Browse– Edit– Print– Copy
� You get to select the DB2 subsystem you want to work with.
� You can list DB2 objects in the system catalog.
� You have the ability to export and import DB2 tables and views.
� You can generate JCL and utility control statements for the following utilities:
– Copy– Load– Rebuild– Reorg– Runstats
� You have the ability to prototype SQL SELECT statements using basic or advanced support.
� You can perform statement analysis using the EXPLAIN facility.
File Manager/IMS FeatureThis new feature extends the capabilities of File Manager to work with IMS data.
You can use File Manager/IMS to:
� Browse, edit, or print data in an IMS database� Extract from, or load data into an IMS database
10 Introduction to the IBM Problem Determination Tools

For many tasks, you can use the File Manager/IMS features called templates and views. These allow you to define a logical view of a data set based on a COBOL or PL/I copybook. Associating a view with a data set lets you define which fields and records you want to work with, how the fields are displayed, and which segments are displayed.
1.4 IBM Debug ToolIBM Debug Tool is an interactive source-level debugging tool. It helps you examine, monitor, and control the execution of application programs written in C/C++, COBOL, PL/I, or Java (when each is compiled with the appropriate IBM compiler) on a z/OS, OS/390, or VM system. Debug Tool supports debugging of application programs in various subsystems including CICS, IMS, and DB2.
Debug Tool requires you to compile your application program with the TEST compile option and, depending on the execution environment, link-edit the appropriate object modules. You use the TEST runtime option to execute your application program, which starts the Debug Tool session. We describe these options in detail in Chapter 4, “Introduction to Debug Tool” on page 75.
Because you have the ability to directly manipulate variables in storage during a debugging session, a variety of different logic paths can be tested within a short period of time. You can spend more time drilling down into the complex aspects of your application programs for greater understanding.
1.4.1 Full-screen debuggingDebug Tool runs in a wide variety of different environments; as such, it uses an ISPF-like interface. When it is invoked, it takes over the full screen to provide you with a means of isolating logic errors. A typical Debug Tool session is shown in Figure 1-3.
Chapter 1. Overview of the Problem Determination Tools 11

Figure 1-3 Debug Tool full-screen session
The full-screen interface is divided into three windows:
Monitor window This window displays the status of items you choose to monitor, such as variables, registers, programs, the execution environment, and Debug Tool settings. For example, you can use this window to watch the contents of variables change during application program execution.
Source window This window displays the application program source, with the current statement (i.e., the one about to be executed) highlighted. In the prefix area at the left of this window, you can enter commands to set, display, and remove breakpoints.
Log window This window records and displays your interactions with Debug Tool and, optionally, shows program output. This window contains the same information as the Log file.
The available PF keys are displayed at the bottom of the screen. These provide a basic set of screen manipulation and debugging commands. You can customize the screen display and these keys to suit your testing and development needs.
12 Introduction to the IBM Problem Determination Tools
1.4.2 Debugging tasksYou can set breakpoints in your application program, monitor variables for changes, and watch for specified exceptions and conditions during your application program’s execution. For example, you can cause an application program to halt when a specific variable or location in storage is changed. You can set, change, and remove breakpoints as you go through the application program.
To focus on a problem area, you can step line-by-line through the execution of an application program. For example, when an application program stops for a breakpoint, you can carefully examine each line that follows. Single-step debugging, along with the ability to set dynamic breakpoints, allows you to monitor, interrupt, and continue through the flow of the application program to identify errors easily.
Debug Tool lets you count how many times a statement or verb has been processed in an application program. This allows you to verify the coverage of your application logic.
1.4.3 Recently available featuresDebug Tool was recently enhanced to allow you to create the smallest possible load module, while still retaining the ability to debug an application program. In conjunction with enhancements to the COBOL compiler and to the Language Environment runtime, you can compile an application program and retain a separate side file.
These features are called:
� Dynamic Debug� Separate Debug File
Dynamic DebugThe Dynamic Debug feature allows you to debug COBOL for OS/390 & VM programs compiled without debug hooks. Debug hooks are added into the object for the programs when you specify the TEST compiler option with any of its sub-options (excluding NONE). Debug hooks increase the size of the object and can decrease performance. Dynamic Debug allows you to create smaller objects by removing the need for compiled-in debug hooks.
Chapter 1. Overview of the Problem Determination Tools 13

Separate Debug FileA new sub-option to the TEST compiler option allows the symbolic debug tables to be moved out of the object and into a separate file or data set. This allows you to generate load modules that are smaller in size, while retaining the ability to use all of the features of Debug Tool.
1.4.4 Latest software updateThe following PTFs, specifically for Debug Tool, provide updates to the Dynamic Debug feature and the Separate Debug File feature:
� For OS/390 V2R6 and above:
– UQ54286, UQ54287, and UQ54288 (or newer)
Because of the wide variety of environments in which Debug Tool runs, and the number of programming languages it supports, we provide systems programmers with a concise table of Authorized Program Analysis Reports (APARs) in 4.1.1, “APAR information” on page 76.
1.5 SummaryThe Problem Determination Tools have powerful functions and features. Organizations that chose to use them gain the ability to improve the overall health of their application portfolios.
We have outlined the basic features and functions of the Problem Determination Tools:
� Fault Analyzer� File Manager� Debug Tool
In the remaining chapters of this part, we delve into more detail about each of these products. We include a chapter that describes how you can implement these tools in your environment.
In Part 2, “Scenarios using the Problem Determination Tools” on page 117, we demonstrate to application programmers that the skills they gain using these tools to isolate problems has a key benefit. Namely, as they get better at recognizing the causes of common errors, they also become more aware of the actions needed to reduce the introduction of new ones.
14 Introduction to the IBM Problem Determination Tools

Chapter 2. Introduction to Fault Analyzer
Fault Analyzer is designed to help you determine the cause of abend in an application program. You do not have to read through application or system dumps, because the product has the ability to isolate the exact instruction that caused the error.
We start this chapter with a description of the software levels that are required to use Fault Analyzer. We take a detailed look at how application programmers can use the product. We continue by presenting a review of information that systems programmers need to know to customize Fault Analyzer for their site. We briefly review the creation and use of user exits, and present some useful information that was discovered during our research. We conclude with a review of recent product updates.
2
© Copyright IBM Corp. 2002 15
2.1 Start by validating your software levelsTo effectively use Fault Analyzer, you must have the appropriate levels of software installed on your system. The Program Temporary Fix (PTF) we have listed should be reviewed to ensure that is appropriate for your operating environment.
2.1.1 PTF informationThe following PTF information should be used as a guide by systems programmers responsible for installing and maintaining Fault Analyzer.
May 2001 PTFThe most recent PTF installed on the system we used was:
� UQ54113
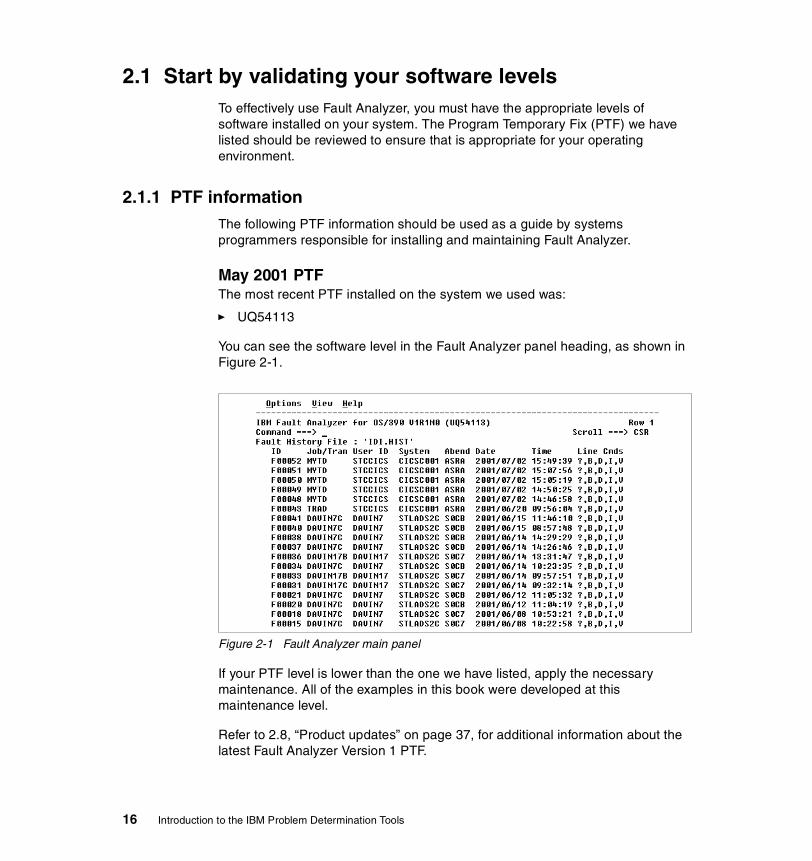
You can see the software level in the Fault Analyzer panel heading, as shown in Figure 2-1.
Figure 2-1 Fault Analyzer main panel
If your PTF level is lower than the one we have listed, apply the necessary maintenance. All of the examples in this book were developed at this maintenance level.
Refer to 2.8, “Product updates” on page 37, for additional information about the latest Fault Analyzer Version 1 PTF.
16 Introduction to the IBM Problem Determination Tools

2.2 How Fault Analyzer worksAfter Fault Analyzer is installed, it is invoked whenever an application program abends. Fault Analyzer tracks both batch applications and CICS applications.
Figure 2-2 summarizes how Fault Analyzer works.
Figure 2-2 How Fault Analyzer works
When an application program abends, the appropriate system exit obtains information and invokes Fault Analyzer. Depending on the system options that have been established, Fault Analyzer takes the information that is obtained, analyzes it, processes it, and writes it to the fault history file.
One of Fault Analyzer’s powerful features is its ability to use the application program’s compiler listing to identify the source statement of the line that caused the abend. Another feature that benefits you, a typical application programmer, is its ability to make use of IBM’s vast library of error messages and abend codes.
Note: IBM Fault Analyzer for z/OS and OS/390 Version 2 Release 1 has been generally available since August 2001. As such, the panel heading and PTF level will be different.
MVS abendprocessing
User application
SYSMDUMP
Fault analysisreport
Fault history
SYSLOG
Abend
Fault Analyzer
Chapter 2. Introduction to Fault Analyzer 17
2.2.1 The fault history fileFault Analyzer records a summary of an abend in a fault history file. The Fault Analyzer panel in Figure 2-1 on page 16 provides access to the fault history file and displays the following information:
� Fault ID� Job name or transaction ID that experienced the abend� User ID that submitted the job� System on which the abend occurred� Type of abend� Date and time of abend
The history file also shows you the line commands (displayed alphabetically) that are available to process each entry in the list.
2.2.2 Supported application environmentsFault Analyzer supports applications running under OS/390 (and with Version 2, z/OS) in the following application environments:
� Assembler, C/C++, COBOL, PL/I� Language Environment (LE)� UNIX System Services� CICS, DB2, IMS
2.2.3 A summary of real-time analysisReal-time analysis processing is performed when an application program abends and when none of the Fault Analyzer options are set to exclude it. A report is generated at the time and is recorded in the fault history file. Included in this report is a minidump of virtual storage at the time of the abend. This report is also written to the IDIREPRT DD of the abending job’s step.
Note: There is no need to explicitly code an IDIREPRT DD statement in your JCL; this output file is dynamically allocated to SYSOUT=*.
If Fault Analyzer performs a successful analysis, it will suppress the dump from being written to any of the standard dump output statements. However, if there is no compiler listing or side file available for use by the analysis process, the dump will be written.
Real-time analysis reportThe real-time analysis report has the following details:
� A synopsis of the abend, which contains a brief description of the abend.
18 Introduction to the IBM Problem Determination Tools

� The program that encountered the abend and the offset at which it abended.
� The source statement in the program that experienced the abend, if the compiler listing or side file was available at the time of analysis.
� An event summary, listing the events in the job until the point of failure. The last event listed is the point of failure.
� The working storage area of the programs involved.
� The screen buffer, for abends in CICS transactions.
2.3 Preparing your programs for Fault AnalyzerFault Analyzer will always provide the analysis of an abend. However, your application program must be compiled with specific compiler options for Fault Analyzer to display the source statement that caused the error.
Fault Analyzer uses the compiler listing to analyze the cause of abend, list the statement that caused the abend, and list the data values in the working-storage section.
2.3.1 Compiler optionsThe compiler options required for COBOL for OS/390 & VM application programs, for Fault Analyzer to analyze the abends are:
� LIST� MAP� SOURCE� XREF
For details of the options required for other compilers, refer to the IBM Fault Analyzer for OS/390 User’s Guide, SC27-0904.
The only reason to recompile an application program for use by Fault Analyzer is if you did not use one of this options when the application program was originally compiled.
To speed up the actual analysis, Fault Analyzer uses a side file. This is a streamlined extract of the compiler listing that is much smaller in size. It contains only the pertinent information Fault Analyzer needs to perform the fault analysis.
Note: Fault Analyzer requires that the listings be saved as members in a PDS or PDS/E.
Chapter 2. Introduction to Fault Analyzer 19
2.3.2 What is a side fileWhen Fault Analyzer attempts to analyze an abend, it looks for source line information. There is a predefined search path that it follows to do this.
First, it looks for a side file in the data set specified by the IDILANGX option. If one is not found, Fault Analyzer looks for a compiler listing in the data set specified by the IDILCOB option. If one is found, a side file is generated; if not, there will be no source line information — although the dump analysis continues.
When you create a side file, you can take advantage of the following benefits:
� Reduced processing time
If a side file is available, Fault Analyzer does not have to generate one dynamically from the compiler listing.
� Decreased storage space
Side files are much smaller than compiler listings.
2.3.3 How to create a side fileThe program, IDILANGX, creates a side file from a compiler listing.
There are two ways to create a side file:
� Create a side file in the batch COBOL compile job.� Invoke a stand-along batch job to process an existing compiler listing.
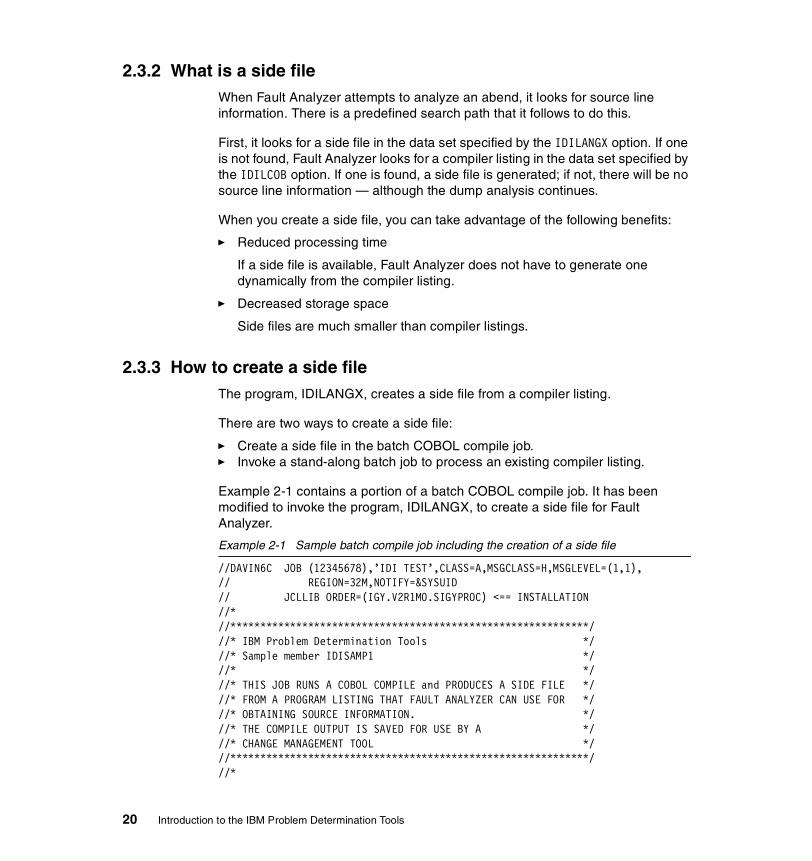
Example 2-1 contains a portion of a batch COBOL compile job. It has been modified to invoke the program, IDILANGX, to create a side file for Fault Analyzer.
Example 2-1 Sample batch compile job including the creation of a side file
//DAVIN6C JOB (12345678),’IDI TEST’,CLASS=A,MSGCLASS=H,MSGLEVEL=(1,1),// REGION=32M,NOTIFY=&SYSUID// JCLLIB ORDER=(IGY.V2R1M0.SIGYPROC) <== INSTALLATION//*//************************************************************///* IBM Problem Determination Tools *///* Sample member IDISAMP1 *///* *///* THIS JOB RUNS A COBOL COMPILE and PRODUCES A SIDE FILE *///* FROM A PROGRAM LISTING THAT FAULT ANALYZER CAN USE FOR *///* OBTAINING SOURCE INFORMATION. *///* THE COMPILE OUTPUT IS SAVED FOR USE BY A *///* CHANGE MANAGEMENT TOOL *///************************************************************///*
20 Introduction to the IBM Problem Determination Tools

// SET PRGNAME=’IDISCBL1’//*//CBLRUN EXEC IGYWC,PARM.COBOL=’LIST,MAP,SOURCE,XREF’//COBOL.SYSIN DD DSN=Your.source.library(&PRGNAME),DISP=SHR//*//* COBOL listing retained as seq file for change management tool//*//COBOL.SYSPRINT DD DSN=&&COBLIST,// DISP=(,PASS),SPACE=(TRK,(10,5),RLSE),// RECFM=FBA,LRECL=133,BLKSIZE=0//*//* Listing is copied to temporary PDS for use by IDILANGX//*//IEBGENR1 EXEC PGM=IEBGENER//SYSUT1 DD DISP=(OLD,PASS),DSN=&&COBLIST//SYSUT2 DD DSN=&&IDILIST(&PRGNAME),// DISP=(,PASS),SPACE=(TRK,(10,5,5),RLSE),// RECFM=FBA,LRECL=133,BLKSIZE=0//SYSPRINT DD SYSOUT=*//SYSIN DD DUMMY//*//* Create this program’s “side file” member//*//IDILANGX EXEC PGM=IDILANGX,// PARM=’&PRGNAME (COBOL ERROR OFT IDILANGX FAULT’//STEPLIB DD DISP=SHR,DSN=IDI.SIDIMOD1//LISTING DD DISP=OLD,DSN=&&IDILIST//IDILANGX DD DISP=SHR,DSN=group.level.IDI.IDILANGX//SYSUDUMP DD SYSOUT=*//*//* Output COBOL listing to appropriate change management format//*//IEBGENR2 EXEC PGM=IEBGENER//SYSUT1 DD DISP=OLD,DSN=&&COBLIST//SYSUT2 DD DISP=SHR,DSN=your.change.mgmt.LISTING//SYSPRINT DD SYSOUT=*//SYSIN DD DUMMY/*
What is happening in this jobThe first step, CBLRUN, invokes the site’s COBOL compile procedure. The output (the compiler listing) is directed to a temporary, sequential data set.
The second step, IEBGENR1, copies the sequential file to a member of a temporary PDS. The IDILANGX program only processes members; it cannot process sequential files.
Chapter 2. Introduction to Fault Analyzer 21

The third step, IDILANGX, converts the compiler listing into a side file. The parameters passed to this processor include the name of the program, the language of the compiler, and the DD name of the output file. The other parameters (ERROR, OFT, and FAULT) are required.
The fourth step, IEBGENR2, copies the listing back to the format that was previously expected by the site’s change management system.
Chapter 5, “Implementing the tools in your environment” on page 101, contains some models for how you can set up options for your site.
2.4 Using Fault Analyzer to re-analyze an abendRe-analysis is the act of repeating the analysis of the abend to obtain more information than was originally reported at the time of abend.
Two instances in which you would want to re-analyze an abend, include:
� You want the source statement that caused the abend to be listed, because it was not listed in the real-time analysis report.
� You want more details in the report than what was provided during real-time analysis.
There are two ways in which you can initiate re-analysis:
� Interactive re-analysis, which is done online in your ISPF session� Batch re-analysis, which is submitted as a batch job
We discuss aspects of each of these methods.
2.4.1 Interactive re-analysisInteractive re-analysis is initiated via the ISPF interface of the fault history file. While the analysis is performed, your ISPF session remains locked.
Note: The side file dataset must be allocated RCFM=VB, LRECL=>1562.
Note: You can specify the side file or compiler listing location before re-analysis is done. Refer to 2.4.3, “Specifying listings to Fault Analyzer for re-analysis” on page 26.
22 Introduction to the IBM Problem Determination Tools
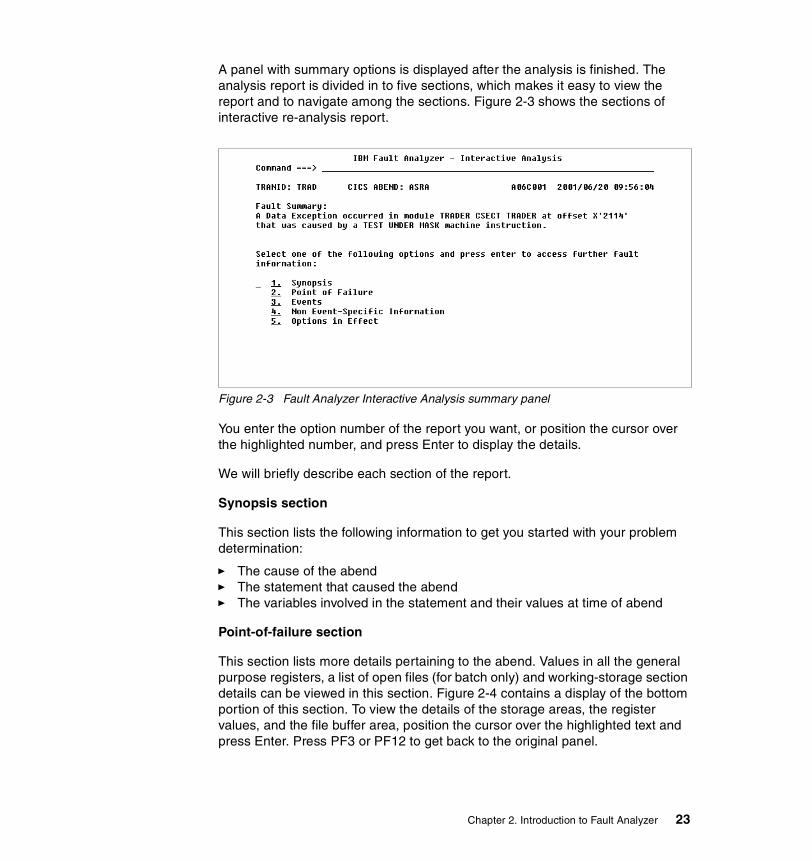
A panel with summary options is displayed after the analysis is finished. The analysis report is divided in to five sections, which makes it easy to view the report and to navigate among the sections. Figure 2-3 shows the sections of interactive re-analysis report.
Figure 2-3 Fault Analyzer Interactive Analysis summary panel
You enter the option number of the report you want, or position the cursor over the highlighted number, and press Enter to display the details.
We will briefly describe each section of the report.
Synopsis section
This section lists the following information to get you started with your problem determination:
� The cause of the abend� The statement that caused the abend� The variables involved in the statement and their values at time of abend
Point-of-failure section
This section lists more details pertaining to the abend. Values in all the general purpose registers, a list of open files (for batch only) and working-storage section details can be viewed in this section. Figure 2-4 contains a display of the bottom portion of this section. To view the details of the storage areas, the register values, and the file buffer area, position the cursor over the highlighted text and press Enter. Press PF3 or PF12 to get back to the original panel.
Chapter 2. Introduction to Fault Analyzer 23
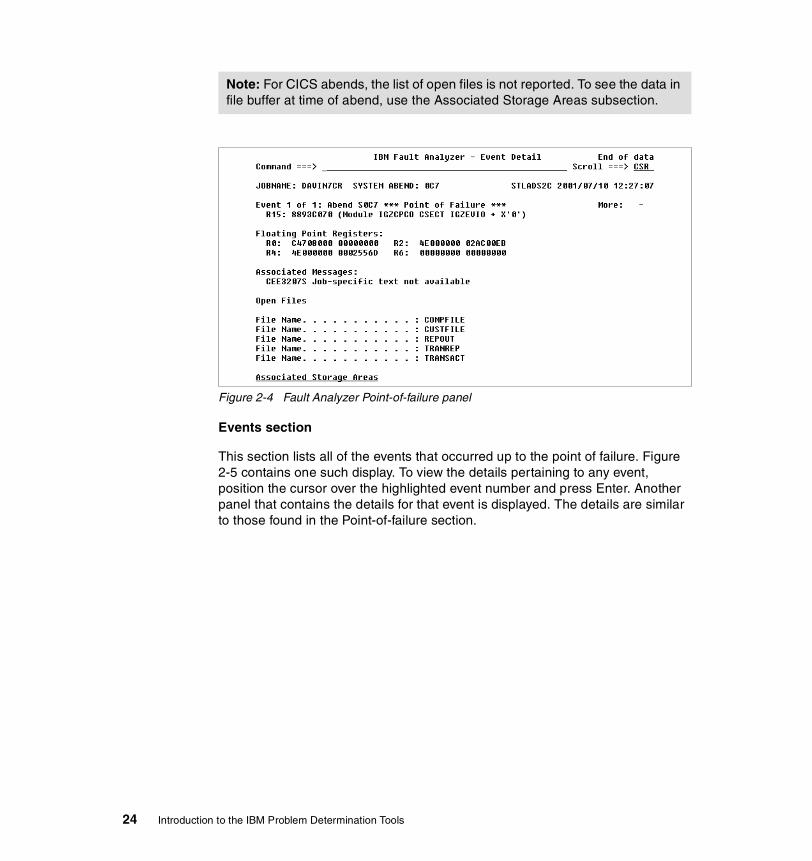
Figure 2-4 Fault Analyzer Point-of-failure panel
Events section
This section lists all of the events that occurred up to the point of failure. Figure 2-5 contains one such display. To view the details pertaining to any event, position the cursor over the highlighted event number and press Enter. Another panel that contains the details for that event is displayed. The details are similar to those found in the Point-of-failure section.
Note: For CICS abends, the list of open files is not reported. To see the data in file buffer at time of abend, use the Associated Storage Areas subsection.
24 Introduction to the IBM Problem Determination Tools

Figure 2-5 Fault Analyzer Event List panel
Non-Event specific information section
This section pertains specifically to CICS abends. This section has the screen buffer area of the application program.You can view the data that was entered by a user in the application screen at the time of abend. It also has CICS trace details.
Options-in-effect section
This section lists the Fault Analyzer system and user options-in-effect at the time of the abend.
2.4.2 Batch re-analysisBatch re-analysis produces the same results as an interactive re-analysis, except that it does not lock your ISPF session. You submit a batch job to perform a re-analysis and the report is written to SYSPRINT DD statement of the job.
The batch re-analysis report has exactly the same format as the real-time analysis report.
You specify the location of a compiler listing or side file in the same way that you do for interactive re-analysis.
You can perform a batch re-analysis even for CICS application program abends.
Chapter 2. Introduction to Fault Analyzer 25

2.4.3 Specifying listings to Fault Analyzer for re-analysisOne reason to perform a re-analysis (either batch or interactive) is because the compiler listing or side file for the abending program was not available at the time of the abend. The compiler listing or side file can be made available to Fault Analyzer during re-analysis to provide the source line instructions.
You specify the dataset containing the compiler listing or the side file via the Fault Analyzer DATASETS option. We will create a sample, shown in Example 2-2. The side file library is identified by the IDILANGX sub-option. The compiler listing library is identified by the IDILCOB sub-option.
Example 2-2 Portion of IDIOPTS member
DATASETS(IDILANGX(DAVIN7.FA.SIDEFILE) IDILCOB(DAVIN7.FA.LISTINGS))
We will save this as a member, IDIOPTS, in the dataset, DAVIN7.WORK.JCL.
In the file history panel, select the Options pull-down menu.
Select Change Interactive Options or Change Batch Options.
Enter the data set and member name in the last two fields on the panel. Figure 2-6 shows what a completed Interactive Options panel looks like.
Press PF3 to being the re-analysis.
Figure 2-6 Fault Analyzer Interactive options panel
26 Introduction to the IBM Problem Determination Tools

2.5 How to set up and customize Fault AnalyzerThis section is written for systems programmers (and any application programmers who want to know a lot more about Fault Analyzer than their peers) to provide some guidance regarding how to set up and customize Fault Analyzer.
2.5.1 Invocation exitsFor Fault Analyzer to analyze an abend, it must be set up to be invoked through the appropriate abend processing exit. Fault Analyzer is provided with three exits, one for CICS abend processing and two for batch abend processing.
The exits are:
� CICS global user exit, IDIXCX52 or IDIXCX53� MVS pre-dump exit, IDIXDCAP� Language Environment abnormal termination exit, IDIXCEE
2.5.2 CICS set-upFor Fault Analyzer to capture application program abends in a CICS region, it must be enabled in each region. To do this, add program IDIPLT to the CICS start-up Program Load Table (PLT). This program enables either the IDIXCX52 or IDIXCX53 exit, depending on the version of CICS, as an XPCABND global user exit during CICS start-up.
Fault Analyzer has another option to control the abend analysis of CICS transactions. To enable this control facility, a transaction must be defined that is associated with the program IDIXFA.
For example, if the transaction is defined as IDCN, the following commands can be issued:
IDCN INSTALL Enables CICS transaction abend analysis.
IDCN UNINSTALL Disables CICS transaction abend analysis.
IDCN Displays the current status of the Fault Analyzer exit.
Note: You cannot use a sequential dataset for the IDIOPTS file.
Chapter 2. Introduction to Fault Analyzer 27

2.5.3 Batch set-upFault Analyzer requires a dump capture exit to be installed to analyze the abend. It can be invoked via MVS pre-dump IDIXDCAP exit or through the LE abnormal termination IDIXCEE exit.
IDIXDCAP exit
This exit can be used for both LE and non-LE batch application programs. For Fault Analyzer to analyze an abend via this exit, a SYSMDUMP, SYSUDUMP, or SYSABEND DD statement must be code in the job step.
There is a sample job which includes IDIXDCAP in the IEAVTABX installation exit list.
IDIXCEE exit
This exit is only applicable to LE batch application programs. There is no requirement for coding a SYSMDUMP DD statement in the JCL for Fault Analyzer to analyze abends.
There is a sample job which will add IDIXCEE to the CEEEXTAN CSECT for Language Environment for OS/390.
2.5.4 User exitsThere are six user exit entry points in Fault Analyzer where user exits can get control during Fault Analyzer’s processing. The user exits can be written in REXX, Assembler, or a high-level language. These provide you with greater control and flexibility in terms of Fault Analyzer’s operation.
All user exits are normally passed two data structures. The first is a common environment structure. The second is specific to the function being called.
Those functions are found in each of the following user exits:
� Analysis control� Compiler listing read� Batch report tailoring� Message and abend code explanation� End processing
Note: Fault Analyzer comes with a usermod, IDIUTAB, that eliminates the need to code a SYSMDUMP, SYSUDUMP, or SYSABEND DD statement in the JCL.
28 Introduction to the IBM Problem Determination Tools

� Notification
How you use these user exits is entirely up to your site’s requirements, as well as your imagination. We describe two examples in 2.7, “Hints and tips” on page 32.
For more specific information about these exits, refer to IBM Fault Analyzer for OS/390 User’s Guide, SC27-0904.
2.6 Options available to customize Fault AnalyzerTable 2-1 lists, in summary form, all of the options that control how Fault Analyzer functions. For more details about these options, refer to IBM Fault Analyzer for OS/390 User’s Guide, SC27-0904.
Table 2-1 Options for Fault Analyzer
Option Sub-options Product default Description
DATASETS IDIHISTIDICACHEIDIBOOKSIDIDOCIDIADATAIDILCIDILCOBIDILCOBOIDILANGXIDIEXEC
IDI.HISTIDI.CACHEIDI.SIDIBOOKIDI.SIDDOC1
Specifies the file names and data set names that are dynamically allocated by Fault Analyzer
DETAIL MEDIUMSHORTLONG
MEDIUM Specifies the level of details to be included in the fault analysis report
DUMPDSN dump data setRECONNECT
Specifies the dump data set name against which fault analysis is performed
EXCLUDE TYPECICSABENDCLASSNAMESYSABENDTRANIDUSERID
Specifies which types of jobs are to be excluded from fault analysis
Chapter 2. Introduction to Fault Analyzer 29

2.6.1 How to specify these optionsYou can specify these options in three places:
� The IDICNF00 member of SYS1.PARMLIB
EXITS CONTROLLISTINGREPORTMSGXPLENDNOTIFY
Specifies the types and names of user exits to be invoked during Fault Analyzer execution
FAULTID Specifies the fault ID to be used during batch re-analysis
INCLUDE TYPECICSABENDCLASSNAMESYSABENDTRANIDUSERID
Specifies which types of jobs are to be included in fault analysis
LANGUAGE ENUJPN
ENU Specifies the national language ID which is used to select the appropriate language-dependant messages
MAXFAULTNUMBER 9999 to 65535 9999 Specifies the maximum number to be assigned to a fault ID before wrapping
MAXMINIDUMPPAGES (no stated range or limit)
64 Specifies the maximum number of 4K pages to be written to the fault history file for each entry
QUIET Specifies no warning or informational messages should be written to the system console
RETAINDUMP AUTOALLNODUP
AUTO Specifies to Fault Analyzer whether to retain the dump or not
Option Sub-options Product default Description
30 Introduction to the IBM Problem Determination Tools

� The user options file specified on the IDIOPTS DD statement� As parameters in a batch re-analysis job
2.6.2 Order of precedenceOptions are set or changed in the following ways:
� Product defaults provided by Fault Analyzer
� Installation-wide defaults specified in the IDICNF00 parmlib member
These defaults override the product defaults
� Options located via the user options module, IDICNFUM
If found, these options replace the installation-wide defaults in the IDICNF00 parmlib member.
� Options specified in a user options file through the IDIOPTS DDname
These options override both the product and the installation defaults.
� Options specified in the JCL EXEC statement PARM field when performing batch re-analysis.
These options override product and installation defaults, and the options specified in the user options file.
As you can see, Fault Analyzer offers a tremendous amount of flexibility to enable you to obtain critical information when and where you need it.
2.6.3 User options fileApplication programmers can specify Fault Analyzer options in a batch job via the IDIOPTS DD. Example 2-3 employs a user options file to override the installation-wide defaults.
In this example, the options are specified as in-stream data. However, they can also be specified in a data set. Here, we modify the following settings:
� DETAIL, where we specify the LONG sub-option.
Note: To use IDICNF00, you must allow universal read access to all of the data sets in the parmlib concatenation. If your site does not permit this, you must install the user options module, IDICNFUM.
Fault Analyzer comes with a sample batch job to help you with this.
Chapter 2. Introduction to Fault Analyzer 31
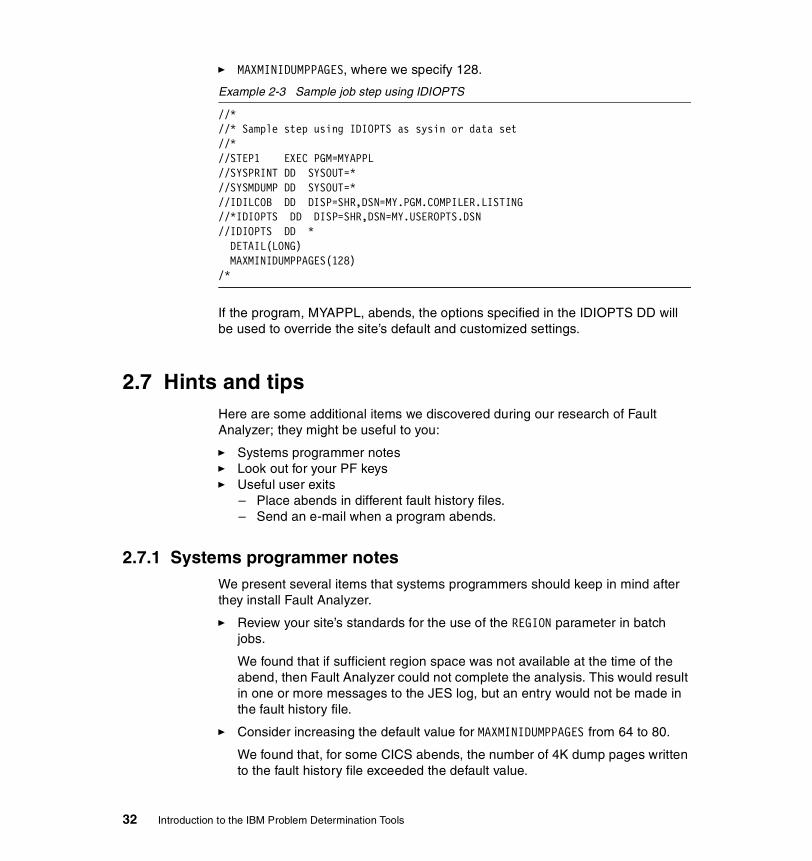
� MAXMINIDUMPPAGES, where we specify 128.
Example 2-3 Sample job step using IDIOPTS
//* //* Sample step using IDIOPTS as sysin or data set //* //STEP1 EXEC PGM=MYAPPL //SYSPRINT DD SYSOUT=* //SYSMDUMP DD SYSOUT=* //IDILCOB DD DISP=SHR,DSN=MY.PGM.COMPILER.LISTING //*IDIOPTS DD DISP=SHR,DSN=MY.USEROPTS.DSN //IDIOPTS DD * DETAIL(LONG) MAXMINIDUMPPAGES(128) /*
If the program, MYAPPL, abends, the options specified in the IDIOPTS DD will be used to override the site’s default and customized settings.
2.7 Hints and tipsHere are some additional items we discovered during our research of Fault Analyzer; they might be useful to you:
� Systems programmer notes� Look out for your PF keys� Useful user exits
– Place abends in different fault history files.– Send an e-mail when a program abends.
2.7.1 Systems programmer notesWe present several items that systems programmers should keep in mind after they install Fault Analyzer.
� Review your site’s standards for the use of the REGION parameter in batch jobs.
We found that if sufficient region space was not available at the time of the abend, then Fault Analyzer could not complete the analysis. This would result in one or more messages to the JES log, but an entry would not be made in the fault history file.
� Consider increasing the default value for MAXMINIDUMPPAGES from 64 to 80.
We found that, for some CICS abends, the number of 4K dump pages written to the fault history file exceeded the default value.
32 Introduction to the IBM Problem Determination Tools

� Pay particular attention to the versions and releases of IBM software you have installed at your site. Make certain that the softcopy messages and codes, provided with Fault Analyzer, are appropriate for the levels of software you use.
� Consider specifying RETAINDUMP(AUTO,NODUP) to suppress duplicate fault entries, thereby making it easy to maintain fault history files.
2.7.2 Look out for your PF keysApplication programmers should take note: There are two panels in the product that (at the time of writing) present you with a dilemma, if you have your PF keys turned on.
We found that the Interactive Options and the Batch Options panels, which are displayed when you initiate re-analysis, are a little short. As you can see in Figure 2-7, it is impossible to specify a value for the Member Name of the Options data set, because it is hidden by the PF key values.
Figure 2-7 Fault Analyzer Interactive options panel with PF keys displayed
No command line is available, so you can not turn off the PF key display on this panel. Fortunately, you can clearly see that you need to use PF12 to issue CANCEL to delay the start of the analysis (and turn off your PF key display).
Chapter 2. Introduction to Fault Analyzer 33

2.7.3 Place abends in different fault history filesYour site may have requirements that dictate that all production abends must be sent to one dump repository, while all test abends must be sent to another. This kind of differentiation, and more, is available with Fault Analyzer when you take advantage of the flexibility built into the user exits.
Example 2-4 is a REXX exec that uses the Fault Analyzer Analysis Control user exit to determine where a fault entry will be directed.
Example 2-4 Analysis control user exit - REXX exec
/* Rexx *//**********************************************************************//* Exec: SendIt2 *//* Function: Send an abend to the appropriate FA fault history file...*//* History: 06/15/2001 - LMK - Created *//**********************************************************************//* *//* This exit can optionally be used with IBM Fault Analyzer for *//* OS/390 to direct the output of batch abends to an appropriate *//* fault history file. *//* *//* On entry, two stems are provided: *//* - ENV *//* - CTL *//* Both of these data areas are described in the User’s Guide. *//* *//* To use this exit, the name of the EXEC (in this example, *//* SENDIT2 is used, but this can be any name) must be specified *//* in an EXITS option as follows: *//* *//* EXITS(CONTROL(REXX((SENDIT2))) *//* *//* For the exit to be invoked by Fault Analyzer, it must be made *//* available via the IDIEXEC DDname: *//* *//* IDIEXEC(IDI.REXX) *//* */
Note: Our recommendation for new users (even though we know it uses up valuable screen real estate) is to turn on the function key display, until you get used to the product. To do that, use either one of the following commands:
� FKA ON� PFSHOW ON
34 Introduction to the IBM Problem Determination Tools

/**********************************************************************/ If Env.Job_Type <> ‘B’ Then Exit /* Only process batch jobs this way */ file_llq = ‘IDI.HIST’ /* Change to match site standards */ ASysUser = Strip(Env.User_ID) Select When ASysUser = ‘PRODOPC’ Then /* Production OPC ID */ Ctl.IDIHist = ‘PROD.SYSTEM.’file_llq When ASysUser = ‘TST1OPC’ Then /* Test OPC ID */ Ctl.IDIHist = ‘TST1.DEVSYS.’file_llq When ASysUser = ‘UAT1OPC’ Then Do /* UAT OPC ID */ Select When Env.Job_Class = ‘S’ Then Ctl.IDIHist = ‘TST1.UATJOBS.’file_llq When Env.Job_Class = ‘T’ Then Ctl.IDIHist = ‘TST1.UATJOBT.’file_llq Otherwise Ctl.IDIHist = ‘TST1.UATSYS.’file_llq End End When Left(ASysUser,5) = ‘DAVIN’ Then /* SysProg user ID */ Ctl.IDIHist = ASysUser’.’file_llq /* We each have 1 */ Otherwise Nop /* Send to default IDI.HIST, found in IDICNF00 */ End Exit
This REXX exec is identified to Fault Analyzer via the EXITS option in the IDICFN00 member of SYS1.PARMLIB, as follows:
EXITS(CONTROL(REXX((SENDIT2)))
What is happening in this user exitA test is performed on the value of the JOB_TYPE to process only batch abends, all others are not processed by this exit. However, they may be processed by other user exits.
The USER_ID variable is interrogated to determine who submitted the batch job. Production OPC jobs are sent to the production history file, while Test OPC jobs are sent to the test history file. UAT OPC jobs are further distinguished by the value of the JOB_CLASS variable.
All batch jobs submitted by the systems programmers (whose TSO user IDs all begin with the letters, DAVIN) are sent to individual fault history files.
Chapter 2. Introduction to Fault Analyzer 35
Every other abend that does not fall into one of these categories is sent to a default fault history file.
2.7.4 Send an e-mail when a program abendsEven with a variety of systems operations products (from IBM and third-party providers), some sites may want to have an additional form of notification mechanism built into their failure detection procedures.
The Fault Analyzer Notification user exit permits a file to be sent via SMTP to a valid e-mail ID. With this in mind, we crafted such a user exit. The complete text appears in Appendix A, “Fault Analyzer Notification user exit” on page 192.
A summary of the processing follows:
� Variables from the system and from Fault Analyzer are established, including the application ID.
� The body (i.e., the contents) of the e-mail message is formulated.
� A contact list is allocated, the contents are read, the file is freed.
� A search is performed to find a contact name that matches the program’s application ID.
� The message is built and SMTP is invoked to send it.
� A note is written to the system log indicating the status of the process.
Figure 2-8 depicts a sample e-mail produced by this exit during our testing.
Restriction: The ability to use SMTP in the Notification user exit became available after applying PTF UQ55392. See 2.8, “Product updates” on page 37 for additional information.
36 Introduction to the IBM Problem Determination Tools

Figure 2-8 E-mail received from the Fault Analyzer Notification user exit
2.8 Product updatesThe latest PTF for Fault Analyzer Version 1 Release 1 is:
� UQ55392
This was released in July 2001.
After you apply this PTF, the software level in the Fault Analyzer main panel heading changes, as shown in Figure 2-9.
Chapter 2. Introduction to Fault Analyzer 37

Figure 2-9 Fault Analyzer main panel after applying latest PTF
2.8.1 Changes in this PTFAside from the cosmetic panel change, there is a major change to the core processing of the product. The fault history file must be converted from a VSAM KSDS file to either a PDS or a PDS/E. According to the text in the PTF, this is to improve the performance of the fault history file. It also provides the ability to manipulate the individual fault entries.
The conversion, and subsequent maintenance, are provided by a new utility called IDIUTIL.
We were able to use this utility to convert our fault history file. Refer to Appendix A, “Fault Analyzer fault history file conversion” on page 207 for our experiences.
We did not have sufficient time during our residency to use the other utility functions.
38 Introduction to the IBM Problem Determination Tools

Chapter 3. Introduction to File Manager
This chapter provides several examples of how IBM File Manager can be used in a practical manner.
For a complete discussion of the functions and features of the product, we suggest that you spend some time reading IBM File Manager for OS/390 User’s Guide and Reference, SC27-0815, or IBM File Manager for z/OS and OS/390 User’s Guide and Reference, SC27-1315 (depending on the product version you use). The chapter describing the creation and use of templates deserves particular attention.
We start this chapter with a description of the software levels that are required to use File Manager. Then, rather than reiterate the contents of the user’s guide, we take a detailed look at how the product can actually be used. We continue by presenting examples of utility functions that you can use or modify for your needs. We briefly review the creation and use of templates, and present some useful information that was discovered during our research. We conclude with a review of recent product updates.
3
© Copyright IBM Corp. 2002 39

3.1 Start by validating your software levelsTo effectively use File Manager, you must have the appropriate levels of software installed on your system. The Program Temporary Fix (PTF) we have listed should be reviewed to ensure that is appropriate for your operating environment.
3.1.1 PTF informationThe following PTF information should be used as a guide by systems programmers responsible for installing and maintaining File Manager.
June 2001 PTFThe most recent PTF installed on the system we used was:
� UQ55090
You can validate this by starting a File Manager session in ISPF. Type VER on the command line and review the message that is displayed. The panel should match the one in Figure 3-1.
Figure 3-1 File Manager VER command output
If your PTF level is lower than the one we have listed, apply the necessary maintenance. All of the examples in this book were developed at this maintenance level.
40 Introduction to the IBM Problem Determination Tools

3.2 Useful examples of how to use File ManagerThis section includes the following examples:
� How to perform a global find and replace in a PDS.� How to create one VSAM file using another as a model.� How to initialize a VSAM file with low-value records.� How to split a single file into constituent record types.
An alternative method of performing the function is provided in some of these examples.
3.2.1 Conventions usedThe examples of batch jobs and reports in this chapter adhere to the following conventions:
About the batch jobsIn all of the File Manager batch examples, presented in this and other chapters, we include STEPLIB references to the File Manager load library and to the COBOL compiler load library. This is done for accuracy and completeness.
An explicit reference to the File Manager load library is required only if File Manager is not installed in LINKLIST. An explicit reference to the COBOL compiler load library is required only if the COBOL compiler is not installed in LINKLIST, and when copybooks are processed into templates.
If File Manager and the COBOL compiler are installed in LINKLIST at your site, your systems programmer should modify the ISPF skeleton, FMNFTEXC. You may either comment or remove the STEPLIB statement.
Note: IBM File Manager for z/OS and OS/390 Version 2 Release 1 has been generally available since August 2001. As such, the output of the VER command will be different.
Refer to 3.6, “Product updates” on page 72 for a discussion of some of the new features and functions
Chapter 3. Introduction to File Manager 41

About the report outputIn all of the File Manager report output examples, presented in this and other chapters, we remove the title page and all pages not pertinent to the example. This is done for brevity.
3.2.2 How to perform a global find and replace in a PDSFile Manager’s Find/Change Utility (Option 3.6) allows you to search for or change a string in a partitioned data set (PDS), a VSAM data set, or a sequential file. However, each change requires a separate pass through the data set. This is because the utility does not let you execute more than one change at a time, unless you use a REXX procedure.
We decided to use the File Manager function DSC (Data Set Copy), along with some simple REXX code, to perform a very selective global find and replace.
ScenarioAs a Production Support Specialist, you need to help an application developer set up a portion of their job stream for a User Acceptance Test (UAT).
You need to take the production job card members (not the procedures) that were created for production, and convert them to UAT standards. The changes, depicted in Table 3-1, need to be made.
Table 3-1 Modifications to make in selected members of a PDS
Note: Any jobs that invoke the program FTP must be copied, but must not be changed. These jobs contain the string XMIT2 in the accounting information parameter of the JOB card. To ensure that no transmissions occur, the program name in the procedure will be changed to from FTP to IEFBR14. (How to make this change is not covered as part of this scenario.)
How to set up the batch jobWe decided to pre-allocate a separate output file for the changed members. The Job Control Language (JCL) for the batch job is displayed in Example 3-1.
Field From To
OPC user ID ZOPCPRD ZUATUSR
MSGCLASS S J
Symbolic MODEP=’P’ MODEP=’U’
Member name Don’t copy if it ends in “T”
42 Introduction to the IBM Problem Determination Tools

Example 3-1
//*//* FILE MANAGER BATCH: SEARCH FOR STRING//*//STEP01 EXEC PGM=FILEMGR//STEPLIB DD DSN=FMN.SFMNMOD1,DISP=SHR//* DD DSN=IGY.SIGYCOMP,DISP=SHR//SYSPRINT DD SYSOUT=*//FMNTSPRT DD SYSOUT=*//SYSTERM DD SYSOUT=*//DDIN DD DISP=SHR,DSN=DAVIN6.SVLSAMP.JCL//DDOUT DD DISP=SHR,[email protected]//SYSIN DD *$$FILEM DSC INPUT=DDIN,MEMBER=*,$$FILEM OUTPUT=DDOUT,REPLACE=YES,$$FILEM PROC=*IF LEFT(INREC,3) <> ‘//*’ THEN DO SELECT WHEN CO(INREC,’ JOB ‘) & , CO(INREC,’XMIT2’) THEN DO PRINT(‘MEMBER NOT CHANGED BECAUSE IT IS FTP’,’CHAR’) EXIT END WHEN CO(INREC,’ PROC ‘) THEN DO PRINT(‘MEMBER NOT COPIED BECAUSE IT IS A PROC’,’CHAR’) EXIT ‘STOP IMMEDIATE’ END WHEN RIGHT(STRIP(SUBSTR(INREC,3,8)),1) = ‘T’ THEN DO PRINT(‘MEMBER NOT COPIED BECAUSE IT IS FOR TEST’,’CHAR’) EXIT ‘STOP IMMEDIATE’ END OTHERWISE DO OUTREC = CHANGE(INREC,’ZOPCPRD’,’ZUATUSR’) OUTREC = CHANGE(OUTREC,’MSGCLASS=S’,’MSGCLASS=J’) OUTREC = CHANGE(OUTREC,”MODE=’P’”,”MODE=’U’”) WRITE() END ENDEND/+/*
Chapter 3. Introduction to File Manager 43

What is happening in this stepThe file, DDIN, is the input file that contains all of the members, which consist of production and test jobs and procedures. (We hope this is not something an application programmer would do in the real world, but it will suffice for this example.) The default output file has the DD name DDOUT.
The File Manager program keyword DSC is used to invoke the Data Set Copy function. The input and output files are identified, and the keyword PROC is used to indicate that an in-stream REXX routine is being supplied.
The File Manager control cards indicate that all of the members should be selected, and that if any already exist in the output file, they should be replaced. This allows us to run this sample repeatedly.
The first line of the REXX routine selects only non-comment lines for processing.
Then, three conditions are applied to the input record:
1. It is searched to see if it contains the strings, JOB and XMIT2. If it does, the member is copied but is not changed
2. It is searched to see if it contains the string, PROC. If it does, the member is not copied.
3. It is parsed to determine if the last character of the job name is the letter, T. If it is, the member is not copied
Otherwise, the appropriate changes are made to the JCL and are written to the output file.
Let us review the report outputThe key portion of the batch job’s output report is displayed in Example 3-2.
Note: Each page in the report starts with the title, “IBM File Manager for OS/390.”
This report has been edited (represented by facing sets of slashes) to fit within the confines of this section.
Example 3-2 Report of global find and replace
IBM File Manager for OS/390$$FILEM DSC INPUT=DDIN,MEMBER=*,$$FILEM OUTPUT=DDOUT,REPLACE=YES,$$FILEM PROC=*Member SVLD011P - Copied12 record(s) copied: 0 truncated: 0 fields truncated MEMBER NOT COPIED BECAUSE IT IS FOR TESTMember SVLD011T - Copied0 record(s) copied: 0 truncated: 0 fields truncated
44 Introduction to the IBM Problem Determination Tools

Member SVLD012P - Copied12 record(s) copied: 0 truncated: 0 fields truncated MEMBER NOT COPIED BECAUSE IT IS FOR TESTMember SVLD012T - Copied0 record(s) copied: 0 truncated: 0 fields truncatedMember SVLD021P - Copied11 record(s) copied: 0 truncated: 0 fields truncated MEMBER NOT COPIED BECAUSE IT IS FOR TESTMember SVLD021T - Copied0 record(s) copied: 0 truncated: 0 fields truncated//\\\\// MEMBER NOT COPIED BECAUSE IT IS A PROCMember SVLD104 - Copied0 record(s) copied: 0 truncated: 0 fields truncatedMember SVLD104C - Copied16 record(s) copied: 0 truncated: 0 fields truncatedMember SVLD104D - Copied16 record(s) copied: 0 truncated: 0 fields truncated MEMBER NOT CHANGED BECAUSE IT IS FTPMember SVLD104E - Copied16 record(s) copied: 0 truncated: 0 fields truncated37 member(s) copied: 0 member(s) replaced: 0 member(s) error
The first page contains a copy of the input commands. This is followed by a series of status messages that indicate the processing performed during the copy.
The DSC function writes any of the PRINT statements from the REXX routine before it writes its own statistics. These contain the name of the member and the action taken (copied or replaced), followed by the number of records copied.
We found that when the number of records is zero (0), the member is not copied, despite what the action indicates.
File Manager external REXX functions used in this routineA brief explanation of each of the File Manager external REXX functions that were used in this routine follows:
DSCCopies data from one file to another. The file can be any of the File Manager supported structures (VSAM, QSAM, or PDS).
COIf the string being searched for is contained in the input record, then CONTAIN returns 1. Otherwise, CONTAIN returns 0.
Chapter 3. Introduction to File Manager 45
PRINTPrints the string in a specified format to the output report.
WRITEWrites a record to the specified data sets. If the WRITE function is successful, it returns a value of 0. If the WRITE function is unsuccessful, it raises the REXX syntax error condition.
EXITIn REXX, you can use the EXIT instruction to leave a procedure. You can optionally specify a character string as a parameter on the EXIT instruction. This character string is returned to the caller of the procedure.
STOP IMMEDIATEThe character string STOP IMMEDIATE tells File Manager to terminate the current function without writing the current record to the primary output data set. When used with DSC, the member is not copied.
3.2.3 How to create one VSAM file using another as a modelWhen modifications to your application require you to create a new file, or when a testing effort requires a clean copy, you can model it based on an existing file that has common attributes.
In this example, we use File Manager to create one VSAM file by using another as a model:
1. Access File Manager in your ISPF session.
2. Go to Catalog Services (Option 3.4) and list the VSAM files for your application.
3. Select a file that has attributes which resemble those of the file you want to create.
4. Type LIST in the line commands area or select the Process pull-down and select LIST.
The VSAM Entry Detail panel is displayed with information for the current file.
5. Press PF3 to return to the Data set list panel.
Note: If you are going to use the pull-down menus, your cursor must be on the same line as the data set name. You can either scroll the list until the file you want to work with is the first one displayed, or position your cursor and press PF6 (PROCESS) to display the process pull-down.
46 Introduction to the IBM Problem Determination Tools

6. Type DEFINE in the line commands area or select the Process pull-down and select DEFINE.
The VSAM Define panel is displayed, as depicted in Figure 3-2.
Figure 3-2 VSAM Define panel with model file’s attributes displayed
7. Change the data set name as well as the data and the index names to the new file’s name by typing over the existing information.
8. Modify any of the other file attributes that are needed.
9. Press Enter to define your new VSAM file.
Important: You need to press a scroll key (PF7 or PF8) to remove the message that is displayed. Do not press the Enter key. If you do, you will receive an error message about duplicate catalog entries.
Note: At this site, if we did not erase the value in the Catalog ID field, we could not locate the file without explicitly pointing to the catalog and the volume. Have your systems programmer validate the rules at your site with your storage management group during a post-installation review.
If you need to, modify panel FMNPSCKD to set this field to null. A completed example of this is shown in Appendix A, “File Manager ISPF panel modifications” on page 198.
Chapter 3. Introduction to File Manager 47

Let us review this exampleIn this example, we created a new VSAM file with attributes based on an existing VSAM file.
Note the following characteristics of this utility:
� All of this processing is performed in the foreground.
There is no option to perform the file allocation in batch.
– This utility does not create batch JCL; nor does it create IDCAMS control cards.
� There is no DELETE associated with the DEFINE process.
If the new VSAM file you want to create already exists, you will receive an error message after you press Enter.
3.2.4 How to initialize a VSAM file with low-value recordsWhen you create a VSAM file for a CICS application, you usually need to initialize it with a low-value record. You probably create a control card (or sequential file) containing binary zeros that matches the record length of the file, so that you can REPRO the record into the new file.
In this example, we use File Manager to perform that process; one that does not depend on different control cards for each file size.
To start, you need an empty VSAM file. You can use the method described previously or IDCAMS control cards.
1. Access File Manager in your ISPF session.2. Go to Data Create Utility (Option 3.1).3. Enter the name of the new VSAM file.4. Indicate the number of Records to be created.5. Specify a Fillchar of x’00’ (binary zeros).
6. Select the Disposition of Old.7. Select the Copybook, or template of None.8. Select the option for Batch execution.
When you are finished, your panel should resemble the one in Figure 3-3.
Tip: Do not make the mistake of selecting a Fillchar of BIN, thinking it creates binary zeros — you will get binary data.
48 Introduction to the IBM Problem Determination Tools

Figure 3-3 Data Create Utility panel to load VSAM file with binary zeros
9. Press Enter.
The JCL for the batch job is displayed. It should resemble the code in Example 3-3.
Example 3-3 Batch step to create low values record in VSAM file using DSG
//FILEMAN EXEC PGM=FILEMGR //STEPLIB DD DSN=FMN.SFMNMOD1,DISP=SHR //* DD DSN=IGY.SIGYCOMP,DISP=SHR //SYSPRINT DD SYSOUT=* //FMNTSPRT DD SYSOUT=* //SYSTERM DD SYSOUT=* //SYSIN DD * $$FILEM DSG DSNOUT=DAVIN6.VSAM.LO.VALUE, $$FILEM FILLCHAR=x’00’, $$FILEM DISP=OLD, $$FILEM NLRECS=1
10.Submit the batch job.
Save a copy of this JCL. In, “Modify the JCL for generic use” on page 51, we show you how it can be applied to every VSAM file you’ll ever need to initialize.
What is happening in this stepNo additional data sets are needed for this batch job, aside from the standard File Manager load library.
Chapter 3. Introduction to File Manager 49

The File Manager program keyword DSG is used to invoke the Data Set Generate function. The output file is identified, along with the keywords, to indicate how the file should be loaded.
The fill character is specified as a hexadecimal zero and the number of logical records is specified as one.
Let us review the report outputThe key portion of the batch job’s output report is displayed in Example 3-4.
Note: Each page in the report starts with the title, “IBM File Manager for OS/390.”
Example 3-4 Report of DSG low value record creation
IBM File Manager for OS/390$$FILEM DSG DSNOUT=DAVIN6.VSAM.LO.VALUE,$$FILEM FILLCHAR=x’00’,$$FILEM DISP=OLD,$$FILEM NLRECS=11 record(s) written
The first page contains a copy of the input commands. This is followed by a message that states that the requested number of records were written to the output file.
File Manager functions used in this routineA brief explanation of the File Manager function used in this routine follows.
DSGInitializes VSAM data sets, sequential data sets, and PDS members.
You specify the output data set name, the disposition, the number of logical records, and the fill character.
To fill each byte of each record with data, specify one of the following:
char To write a character, such as 0, in each byteX’cc’ To write a binary character, such as X’04’, in each byteAN To write alphanumeric characters (A to Z and 0 to 9)BIN To write binary characters (X'00' to X'FF')RAND To write random binary characters (X'00' to X'FF')
The default is a blank.
50 Introduction to the IBM Problem Determination Tools
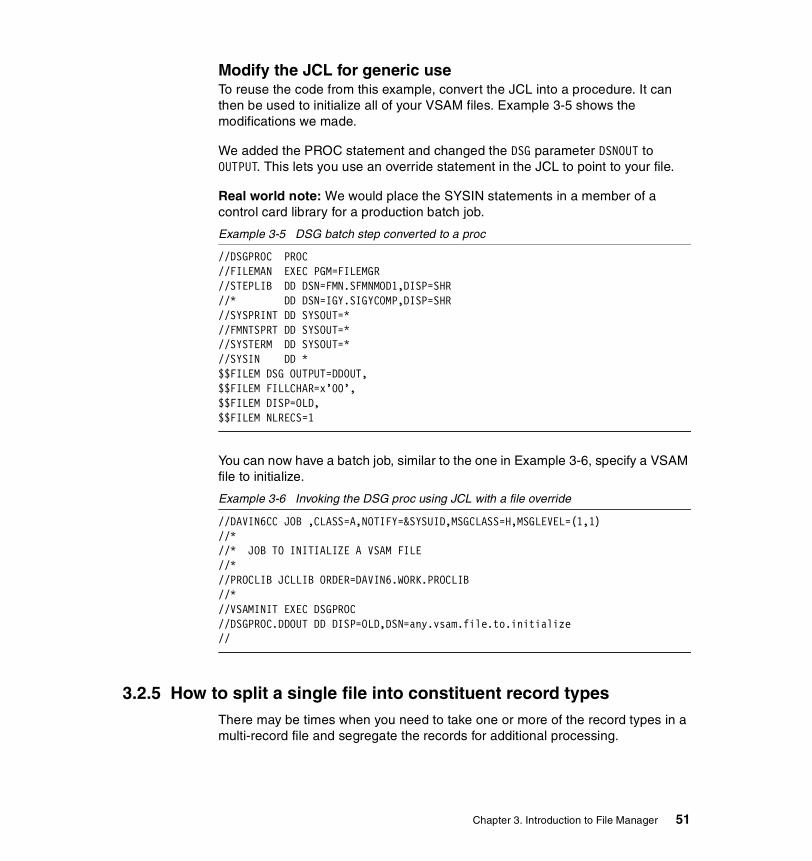
Modify the JCL for generic useTo reuse the code from this example, convert the JCL into a procedure. It can then be used to initialize all of your VSAM files. Example 3-5 shows the modifications we made.
We added the PROC statement and changed the DSG parameter DSNOUT to OUTPUT. This lets you use an override statement in the JCL to point to your file.
Real world note: We would place the SYSIN statements in a member of a control card library for a production batch job.
Example 3-5 DSG batch step converted to a proc
//DSGPROC PROC//FILEMAN EXEC PGM=FILEMGR //STEPLIB DD DSN=FMN.SFMNMOD1,DISP=SHR //* DD DSN=IGY.SIGYCOMP,DISP=SHR //SYSPRINT DD SYSOUT=* //FMNTSPRT DD SYSOUT=* //SYSTERM DD SYSOUT=* //SYSIN DD * $$FILEM DSG OUTPUT=DDOUT,$$FILEM FILLCHAR=x’00’, $$FILEM DISP=OLD, $$FILEM NLRECS=1
You can now have a batch job, similar to the one in Example 3-6, specify a VSAM file to initialize.
Example 3-6 Invoking the DSG proc using JCL with a file override
//DAVIN6CC JOB ,CLASS=A,NOTIFY=&SYSUID,MSGCLASS=H,MSGLEVEL=(1,1) //* //* JOB TO INITIALIZE A VSAM FILE//*//PROCLIB JCLLIB ORDER=DAVIN6.WORK.PROCLIB//* //VSAMINIT EXEC DSGPROC //DSGPROC.DDOUT DD DISP=OLD,DSN=any.vsam.file.to.initialize //
3.2.5 How to split a single file into constituent record typesThere may be times when you need to take one or more of the record types in a multi-record file and segregate the records for additional processing.
Chapter 3. Introduction to File Manager 51

In this example, a batch job takes a file and splits it into three record types. All other record types are placed in a default output file.
The File Manager step of the batch job, shown in Example 3-7, uses an in-stream REXX routine to process the records. The complete batch job is shown in Appendix A, “File Manager batch job to process multi-record file” on page 199.
Example 3-7 Batch step to split a file into multiple parts using DSC
//FM EXEC PGM=FILEMGR//STEPLIB DD DSN=FMN.SFMNMOD1,DISP=SHR //* DD DSN=IGY.SIGYCOMP,DISP=SHR //SYSPRINT DD SYSOUT=*//RECORDS DD DISP=SHR,DSN=DEMOS.PDPAK.SAMPLES(SAMPFIL1)//REC01 DD DISP=OLD,DSN=DAVIN6.SPLIT.REC01//REC02 DD DISP=OLD,DSN=DAVIN6.SPLIT.REC02//REC03 DD DISP=OLD,DSN=DAVIN6.SPLIT.REC03//EXTRA DD DISP=OLD,DSN=DAVIN6.SPLIT.EXTRA//SYSIN DD *$$FILEM DSC INPUT=RECORDS,$$FILEM OUTPUT=EXTRA,$$FILEM PROC=*DDNAME = ‘REC’ || FLD(1,2)IF NCO(FLD(1,2),1,2,3) THEN DO WRITE(DDNAME) EXIT ‘DROP’END/+/*
What is happening in this stepThe file, RECORDS, is the input file that contains multiple record types. The default output file has the DD name EXTRA. Each of the record types we are interested in go into REC01, REC02, and REC03.
The File Manager program keyword DSC is used to invoke the Data Set Copy function. The input and output files are identified, and the keyword PROC=* is used to indicate that an in-stream REXX routine is being supplied.
The first line of the routine sets a variable, DDNAME, to the value of RECxx, where xx matches the two-byte value in the record (using the FLD function) starting in position 1 for a length of 2.
The second line of the routine checks for the numeric contents of the same portion of the record, to see if it matches 1, 2, or 3.
52 Introduction to the IBM Problem Determination Tools

If it does, the third line of the routine writes out the records to the corresponding DDNAME and the fourth line prevents the records from being written to the default file (EXTRA).
The result is that all type 01 records end up in REC01, type 02 records go to REC02, type 03 records go to REC03, and all other record types go to the file EXTRA.
Let us review the report outputThe key portion of the batch job’s output report is displayed in Example 3-8.
Note: Each page in the report starts with the title, “IBM File Manager for OS/390.”
Example 3-8 Report of DSC multiple record split
IBM File Manager for OS/390DSC WRITE summary report------------------------------------------------------------------------------Total records written to REC01 = 20Total records written to REC02 = 20Total records written to REC03 = 15IBM File Manager for OS/39067 record(s) read12 record(s) copied: 0 truncated: 0 fields truncated
The first page contains the output of the record split operation (a copy). Notice that you do not have to do any extra programming to obtain the number of records sent to each file; File Manager does that automatically.
The second page contains the total number of records processed. In this case, 12 records did not meet any of the selection criteria, and were written to the default file (EXTRA).
File Manager external REXX functions used in this routineA brief explanation of each of the File Manager external REXX functions that were used in this routine follows.
FLDReturns the value of a field from the current input record (INREC), starting at start_column, of length number of bytes, interpreted according to the specified type:
B If the field is binary. If you specify B for type, length must be 2, 4, or 8.
C If the field contains characters.
Chapter 3. Introduction to File Manager 53

P If the field is packed decimal. If you specify P for type, length must be between 1 and 16.
Z If the field is zoned decimal. If you specify Z for type, length must be between 1 and 32 or, if the field contains a separate sign character, between 1 and 33.
The default value for type is C.
NCOIf the numeric value of any of the match arguments is equal to the numeric value of number, then NCONTAIN returns 1. Otherwise, NCONTAIN returns 0.
WRITEWrites a record to the specified data sets. If the WRITE function is successful, it returns a value of 0. If the WRITE function is unsuccessful, it raises the REXX syntax error condition.
EXITIn REXX, you can use the EXIT instruction to leave a procedure. You can optionally specify a character string as a parameter on the EXIT instruction. This character string is returned to the caller of the procedure.
DROPThe character string DROP tells File Manager to not write the current record to the primary output data set.
Compare this with another product
The code to perform a similar extract of records, using IBM’s DFSORT, is shown in Example 3-9.
Example 3-9 Batch step to split a file into multiple parts using DFSORT
//SORT EXEC PGM=SORT//SYSOUT DD SYSOUT=*//SORTIN DD DISP=SHR,DSN=DEMOS.PDPAK.SAMPLES(SAMPFIL1)//REC01 DD DISP=OLD,DSN=DAVIN6.SORT.REC01//REC02 DD DISP=OLD,DSN=DAVIN6.SORT.REC02//REC03 DD DISP=OLD,DSN=DAVIN6.SORT.REC03//EXTRA DD DISP=OLD,DSN=DAVIN6.SORT.EXTRA//SYSIN DD *SORT FIELDS=(1,2,CH,A)OUTFIL FNAMES=REC01,INCLUDE=(1,2,CH,EQ,C’01’)OUTFIL FNAMES=REC02,INCLUDE=(1,2,CH,EQ,C’02’)OUTFIL FNAMES=REC03,INCLUDE=(1,2,CH,EQ,C’03’)OUTFIL FNAMES=EXTRA,SAVE/*
54 Introduction to the IBM Problem Determination Tools

3.3 Useful batch utilitiesFor readers interested in comparing various functions among similar program products, we offer this section of useful utilities. We have examples of batch jobs that perform the following functions:
� Replace a string in a specific location in a file.� Copy selected variably-blocked records to another file.� Search for a string in all members of a PDS.
3.3.1 Replace a string in a specific location in a fileIf you need to unconditionally replace a string in one location of a file, you can use this utility.
The code to perform this function with File Manager is shown in Example 3-10.
Example 3-10 File Manager string replace batch step
//*//* FILE MANAGER BATCH: REPLACE A STRING IN A SPECIFIC LOCATION//*//STEP01 EXEC PGM=FILEMGR//STEPLIB DD DSN=FMN.SFMNMOD1,DISP=SHR //* DD DSN=IGY.SIGYCOMP,DISP=SHR //SYSPRINT DD SYSOUT=*//FMNTSPRT DD SYSOUT=*//SYSTERM DD SYSOUT=*//DDIO DD DISP=OLD,DSN=YOUR.FILE.TO.EDIT//SYSIN DD *$$FILEM DSU INPUT=DDIO,$$FILEM PROC=*OUTREC=OVERLAY(‘VALUE’,INREC,11)/+
What is happening in this stepThe File Manager program keyword DSU invokes the Data Set Update utility, which is only available in batch.
The utility reads records sequentially from the input file. When File Manager processes them, it uses two built-in REXX variables, INREC and OUTREC to refer to the input and output records.
In this case, we use a standard REXX function, OVERLAY, to indicate a string should be placed at a specific location. This is assigned to the output record that is written to the file.
Chapter 3. Introduction to File Manager 55

Note: In this example, DDIO refers to an input/output file. It is not a reference to a proprietary file type of the Compuware Corporation.
A portion of the resulting report is shown in Example 3-11.
Example 3-11 Output from string replace batch job
IBM File Manager for OS/390$$FILEM DSU DSNIN=DAVIN6.FILE.TO.EDIT,$$FILEM PROC=*13 record(s) read13 record(s) updated
Compare this with another product
The code to perform a similar change, using Compuware’s File-AID/MVS, is shown in Example 3-12.
Example 3-12 File-AID string replace batch step
//*//* FILE-AID BATCH: REPLACE A STRING IN A SPECIFIC LOCATION//*//STEP01 EXEC PGM=FILEAID//SYSLIST DD SYSOUT=*//SYSTOTAL DD SYSOUT=*//DD01 DD DISP=OLD,DSN=YOUR.FILE.TO.EDIT//SYSIN DD *$$DD01 UPDATE REPL=(11,C’VALUE’)//
3.3.2 Copy selected variably blocked records to another fileIf you need to copy selected records from a production file to a test file, you can use this utility. This differs from Example 3-9 because there are multiple criteria and there is only one output file. This example also demonstrates how File Manager processes new file allocation and variable blocked records.
The code to perform this function with File Manager is shown in Example 3-13.
Example 3-13 File Manager copy selected variably blocked records batch step
//*//* FILE MANAGER BATCH: COPY SELECTED VB RECORDS TO TEST//*//STEP01 EXEC PGM=FILEMGR//STEPLIB DD DISP=SHR,DSN=FMN.SFMNMOD1//* DD DISP=SHR,DSN=IGY.SIGYCOMP
56 Introduction to the IBM Problem Determination Tools

//SYSPRINT DD SYSOUT=*//FMNTSPRT DD SYSOUT=*//SYSTERM DD SYSOUT=*//DDIN DD DISP=SHR,DSN=EXISTING.PROD.SEQFILE//DDOUT DD DISP=(,CATLG),DSN=YOUR.TEST.COPY.SEQFILE,// UNIT=SYSALLDA,// SPACE=(CYL,(5,20),RLSE)//* NOTE: DCB INFO IS COPIED AUTOMATICALLY//SYSIN DD *$$FILEM DSC INPUT=DDIN,$$FILEM OUTPUT=DDOUT,$$FILEM PROC=*IF CO(FLD(14,1),1,2,A,B,C,D,G,H,I,K,L,Y,’FF’X) THEN EXITELSE EXIT ‘DROP’/+
What is happening in this stepThe file, DDIN, contains all of the production records. Even though it is not depicted in the JCL, this is a variably blocked file.
The DDOUT statement describes the new file that is allocated to contain the records we want.
The File Manager program keyword DSC is used to invoke the Data Set Copy function. The input and output files are identified, and the keyword PROC is used to indicate that an in-stream REXX routine is being supplied.
The first line of the routine checks the contents of the record (using the function FLD), starting in position 14 for a length of 1, to see if it matches one of the listed values.
If it does, the second line of the routine writes out the records to the default output file (DDOUT). Otherwise, the fourth line third line ignores the records.
Two items to note:
� The Data Control Block (DCB) information for the new file, DDOUT, is copied from the input file.
� There is no need to account for the Record Descriptor Word (RDW). You start the field reference from position 1.
Chapter 3. Introduction to File Manager 57
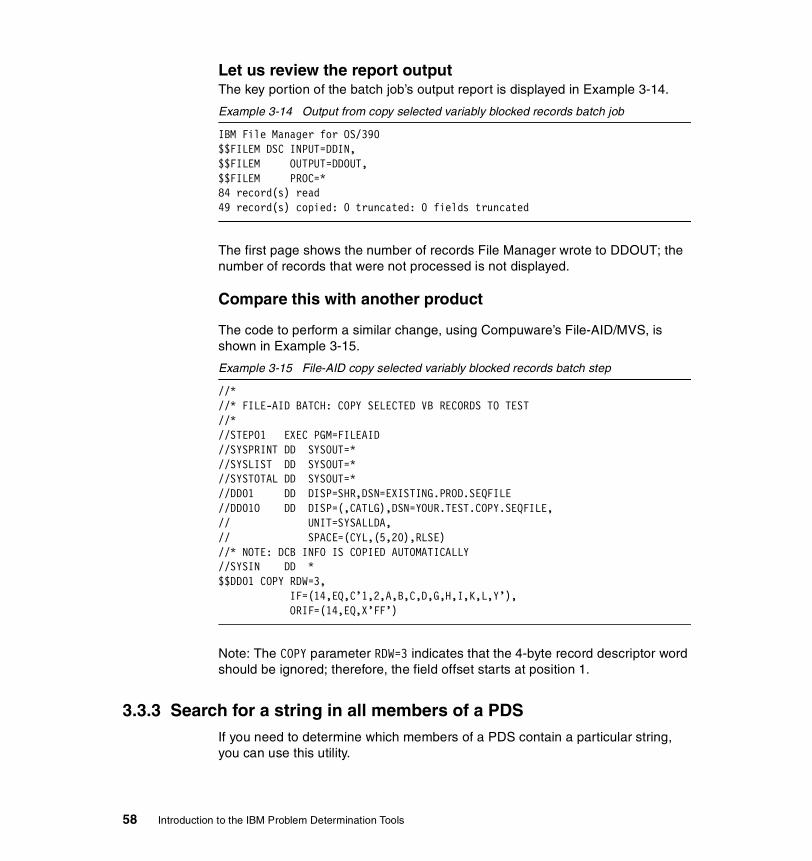
Let us review the report outputThe key portion of the batch job’s output report is displayed in Example 3-14.
Example 3-14 Output from copy selected variably blocked records batch job
IBM File Manager for OS/390$$FILEM DSC INPUT=DDIN,$$FILEM OUTPUT=DDOUT,$$FILEM PROC=*84 record(s) read49 record(s) copied: 0 truncated: 0 fields truncated
The first page shows the number of records File Manager wrote to DDOUT; the number of records that were not processed is not displayed.
Compare this with another product
The code to perform a similar change, using Compuware’s File-AID/MVS, is shown in Example 3-15.
Example 3-15 File-AID copy selected variably blocked records batch step
//*//* FILE-AID BATCH: COPY SELECTED VB RECORDS TO TEST//*//STEP01 EXEC PGM=FILEAID//SYSPRINT DD SYSOUT=*//SYSLIST DD SYSOUT=*//SYSTOTAL DD SYSOUT=*//DD01 DD DISP=SHR,DSN=EXISTING.PROD.SEQFILE//DD01O DD DISP=(,CATLG),DSN=YOUR.TEST.COPY.SEQFILE,// UNIT=SYSALLDA,// SPACE=(CYL,(5,20),RLSE)//* NOTE: DCB INFO IS COPIED AUTOMATICALLY//SYSIN DD *$$DD01 COPY RDW=3, IF=(14,EQ,C’1,2,A,B,C,D,G,H,I,K,L,Y’), ORIF=(14,EQ,X’FF’)
Note: The COPY parameter RDW=3 indicates that the 4-byte record descriptor word should be ignored; therefore, the field offset starts at position 1.
3.3.3 Search for a string in all members of a PDSIf you need to determine which members of a PDS contain a particular string, you can use this utility.
58 Introduction to the IBM Problem Determination Tools

The code to perform this function with File Manager is shown in Example 3-16.
Example 3-16 File Manager string find in a PDS batch step
//*//* FILE MANAGER BATCH: SEARCH FOR STRING//*//STEP01 EXEC PGM=FILEMGR//STEPLIB DD DSN=FMN.SFMNMOD1,DISP=SHR //* DD DSN=IGY.SIGYCOMP,DISP=SHR //SYSPRINT DD SYSOUT=*//FMNTSPRT DD SYSOUT=*//SYSTERM DD SYSOUT=*//DDIN DD DISP=SHR,DSN=YOUR.CHANGE.MGMT.UAT.JCLLIB//SYSIN DD *$$FILEM FCH INPUT=DDIN,MEMBER=*, $$FILEM PROC=* IF CO(INREC,’UNIT=CART’) | , CO(INREC,’UNIT=TAPE’) THEN EXIT ELSE EXIT ‘DROP’ /+
What is happening in this stepThe File Manager utility FCH is used to invoke the Find/Change function.
The file, DDIN (the default input file for the FCH function), is the PDS you want to search.
The first two lines check for one of two strings.
The fifth line ignores any records that do not contain the strings.
Let us review the report outputThe key portion of the batch job’s output report is displayed in Example 3-17.
Example 3-17 Output from string find in a PDS batch job
IBM File Manager for OS/390$$FILEM FCH INPUT=DDIN,MEMBER=*,$$FILEM PROC=*IBM File Manager for OS/390Record-# Find/Change Listing DSN:DAVIN6.WORK.JCL
FABSERCH ---------- STRING(S) FOUND ----------
12s IF=(1,0,C’UNIT=CART’),
Chapter 3. Introduction to File Manager 59

13s ORIF=(1,0,C’UNIT=TAPE’)
FMBSERCH ---------- STRING(S) FOUND ----------
14s IF CO(INREC,’UNIT=CART’) | , 15s CO(INREC,’UNIT=TAPE’) THEN DO
IECD01 ---------- STRING(S) FOUND ----------
833s // DISP=(,CATLG,DELETE),UNIT=CART,EXPDT=99000, 862s // DISP=(,CATLG,DELETE),UNIT=CART,EXPDT=99000,
ISBSERCH ---------- STRING(S) FOUND ----------
9s SRCHFOR ‘UNIT=CART’ 10s SRCHFOR ‘UNIT=TAPE’
TESTME ----------- member in use -----------
------- Find/Change summary section ------------------ Records found: 8 Records processed: 2744 Members w/recs: 5 Members wo/recs: 42
------- Find/Change statement section ----------------
IF CO(INREC,’UNIT=CART’) | , CO(INREC,’UNIT=TAPE’) THEN EXIT ELSE EXIT ‘DROP’
Each of the members in which either one of the strings was found is listed. The lines on which the strings were found are displayed.
Notice that our test file is still in use; no search was performed on this member (otherwise, the string would have been found there, as well).
The summary statistics appear at the end of the report, along with a display of the search commands.
Compare this with other productsThe code to perform this search, using Compuware’s File-AID/MVS, is shown in Example 3-18.
60 Introduction to the IBM Problem Determination Tools

Example 3-18 File-AID string find in a PDS batch step
//*//* FILE-AID BATCH: SEARCH FOR STRING//*//STEP01 EXEC PGM=FILEAID,PARM=’TSO’//SYSUDUMP DD SYSOUT=*//SYSPRINT DD SYSOUT=*//SYSLIST DD SYSOUT=*//SYSTOTAL DD SYSOUT=*//DD01 DD DISP=SHR,DSN=YOUR.CHANGE.MGMT.UAT.JCLLIB//SYSIN DD *$$DD01 LIST MEMBERS=ALL,F=JCL, IF=(1,0,C’UNIT=CART’), ORIF=(1,0,C’UNIT=TAPE’)//
The code to perform this search using ISPF SuperC is shown in Example 3-19.
Example 3-19 ISPF SuperC string find in a PDS batch step
//*//* ISPF SUPERC BATCH: SEARCH FOR STRING//*//STEP01 EXEC PGM=ISRSUPC,// PARM=(SRCHCMP,’ANYC’)//NEWDD DD DISP=SHR,DSN=YOUR.CHANGE.MGMT.UAT.JCLLIB//OUTDD DD SYSOUT=*//SYSIN DD *SRCHFOR ‘UNIT=CART’SRCHFOR ‘UNIT=TAPE’/*
3.4 Template processingTemplates provide the power to obtain different views of your data by using the structure defined in a copybook to present the data in a file.
This section includes the following examples:
� It really does remember the copybook.� How to process COPY REPLACING statements.� How to build a template for multi-record file layouts.
Chapter 3. Introduction to File Manager 61

3.4.1 It really does remember the copybookThe Processing Options section appears on most of the File Manager panels. In Figure 3-4, it is shown in the lower, left-hand portion of the Data Set Edit panel.
Figure 3-4 Processing Options section on File Manager Data Set Edit panel
Whenever you use a copybook (or a template) to process a data set, and select Above as a value for Processing Options, FIle Manager saves the relation information in a member of your ISPF profile.
That information can be used at a later time. For example, you know you want to edit a data set, but you do not recall the name of the copybook. If you select Previous, you can leave the Copybook Data set name and Member fields blank. File Manager will supply them, based on the retained profile information.
Please note: If the member is no longer in the data set, or if the data set no longer exists, you will receive one of two messages:
� No matching member name� Data set not found
Even with this drawback, this is still a useful feature for development efforts.
Note: The tutorial in the IBM File Manager for OS/390 User’s Guide and Reference, SC27-0815, contains the best explanation of the creation of a template from a copybook.
62 Introduction to the IBM Problem Determination Tools

Systems programmers should review 3.5.1, “Systems programmer notes” on page 66, to see some of the complications that may arise from this feature.
3.4.2 How to process COPY REPLACING statementsFor application programs that contain the construct shown in Example 3-20, File Manager has a new feature (introduced with PTF UQ54579) that enables processing COPY REPLACING statements.
Example 3-20 Source code with a COPY REPLACING statement
01 CANCEL-IN-RECORD. COPY COPYSMP1 REPLACING ==:CUSTIO:== BY == CANCEL-IN ==.
In this example, we use File Manager to create a template with the substituted values.
1. Review the source statements in your application program to ascertain the value of the pseudo-text and the string that should be substituted.
2. Access File Manager in your ISPF session.
3. Go to Templates (Option 7).
The Template Workbench panel is displayed.
4. Enter the copybook data set name and member.
5. Enter the template data set name and member.
6. Select the Options pull-down.
7. Type 1 to adjust your File Manager processing options, as depicted in Figure 3-5, and press Enter.
Chapter 3. Introduction to File Manager 63

Figure 3-5 Selecting Options before creating a template
8. On the Set Processing Options panel, adjust the COBOL Replacing Options.
a. Enter the From string (the pseudo-text) that is found in the copybook.
b. Enter the To string (the string) that should be placed in the source program at compile time.
Your panel should look similar to the one displayed in Figure 3-6.
Figure 3-6 COBOL copy replacing options in File Manager
In this case, the pseudo-text ==:CUSTIO:== is replaced by the string ==CANCEL-IN==.
64 Introduction to the IBM Problem Determination Tools

9. Press PF3 to save these settings.
10.Type cc on the command line of the Template Workbench panel and press Enter to create the template.
You can have up to five sets of values specified in your profile. The substitution of values is based on the strings found in your copybook.
3.4.3 How to build a template for multi-record file layoutsSome application programs use files that have multiple record types. In certain instances, the record structures are contained in several copybooks. If this is the case at your site, you need to use a little bit of ingenuity to map your files.
File Manager displays data if a record structure matches a copybook file layout. For File Manager to perform this task with different members from the same data set, you must provide a single point of reference.
To do that, create a new copybook, and using a valid COBOL construct, include the other copybooks in it using the COPY command. Figure 3-7 depicts what this could look like.
Figure 3-7 Copybook with nested multiple copybooks
Tip: You must include the equal signs (delimiters) for the File Manager processing to work. If you do not, the compilation of the copybook will fail with a return code of 8.
Chapter 3. Introduction to File Manager 65
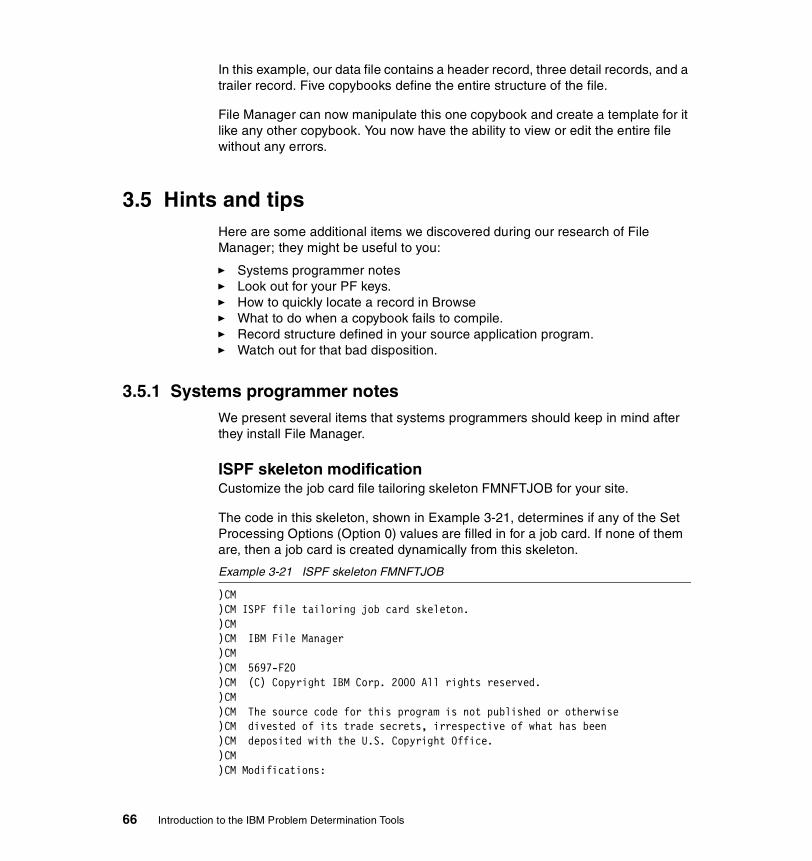
In this example, our data file contains a header record, three detail records, and a trailer record. Five copybooks define the entire structure of the file.
File Manager can now manipulate this one copybook and create a template for it like any other copybook. You now have the ability to view or edit the entire file without any errors.
3.5 Hints and tipsHere are some additional items we discovered during our research of File Manager; they might be useful to you:
� Systems programmer notes� Look out for your PF keys.� How to quickly locate a record in Browse� What to do when a copybook fails to compile.� Record structure defined in your source application program.� Watch out for that bad disposition.
3.5.1 Systems programmer notesWe present several items that systems programmers should keep in mind after they install File Manager.
ISPF skeleton modificationCustomize the job card file tailoring skeleton FMNFTJOB for your site.
The code in this skeleton, shown in Example 3-21, determines if any of the Set Processing Options (Option 0) values are filled in for a job card. If none of them are, then a job card is created dynamically from this skeleton.
Example 3-21 ISPF skeleton FMNFTJOB
)CM)CM ISPF file tailoring job card skeleton.)CM)CM IBM File Manager)CM)CM 5697-F20)CM (C) Copyright IBM Corp. 2000 All rights reserved.)CM)CM The source code for this program is not published or otherwise)CM divested of its trade secrets, irrespective of what has been)CM deposited with the U.S. Copyright Office.)CM)CM Modifications:
66 Introduction to the IBM Problem Determination Tools

)CM)SET FMNJCGEN = 0 )SEL &FMNPJC1 = &Z && &FMNPJC2 = &Z && &FMNPJC3 = &Z && &FMNPJC4 = &Z //&ZUSER.B JOB &ZACCTNUM, // &ZUSER,MSGCLASS=A, // NOTIFY=&ZUSER,CLASS=A, // MSGLEVEL=(1,1) )CM Set flag to indicate job card information was generated )SET FMNJCGEN = 1 )ENDSEL )SEL &FMNJCGEN ¬= 1&FMNPJC1 &FMNPJC2 &FMNPJC3 &FMNPJC4 )ENDSEL )IM FMNFTEXC
Pay particular attention to the CLASS and MSGCLASS parameters in the JOB card. We found that message class A does not produce any output at this site. It took several phone calls and e-mails to verify the product was working correctly. After we changed the message class to H, we saw the output we expected.
Application programmer ISPF profile alertFile Manager creates an ISPF profile member called FMNTMHST to keep track of the data set-to-copybook (or data set-to-template) association. If your site’s application programmers are typical, they manipulate dozens of data sets as part of their work effort. Each association causes this table to grow (by approximately 100 bytes).
If the ISPF profile data set does not have enough space, at some point some program product (not necessarily File Manager) will not be able to update a table.
You should review the default attributes of the ISPF profile data set that is created for new application programmers and make any appropriate changes. Also, consider reviewing the size of existing profile data sets to see if they are approaching either a directory block or extent limit.
APF authorizationThe IBM File Manager for OS/390 Installation and Customization Guide, GC27-0814, has some interesting notes regarding File Manager and APF authorization.
Chapter 3. Introduction to File Manager 67
The message displayed on the ISPF screen when the VER command is issued always indicates that File Manager is not running APF authorized, because it cannot run APF authorized under ISPF.
You can determine if File Manager is APF authorized only by executing a batch job and including the following input statement:
$$FILEM VER
3.5.2 Look out for your PF keysIf you press PF2 to split the screen while you are in Data Set Browse (Option 1) or Data Set Edit (Option 2), you will be disappointed. The keylist assigned to these File Manager options changes the value of PF2 to ZOOM. We found this to be annoying (even frustrating) at times — especially because we do not display our PF key settings.
We discovered File Manager has twenty-nine different keylists. Even to us, this seemed excessive. But, as you navigate through the product, the function key values change. You need to be aware of them.
Note: We found only one IBM product that had more keylists. That was IBM BookManager, with 49. So do not say there is not trivia to be learned from our redbook.
3.5.3 How to quickly locate a record in BrowseHere is a function that is not documented in the user’s guide, but which we found very useful while working on this project.
When you use Data Set Browse (Option 1) to browse a file which has a key and you are using a copybook (or template), File Manager automatically displays a screen with a Key field.
To locate a record whose key you know, simply type it (or the starting value) in the Key field.
An example, shown in Figure 3-8, depicts a VSAM file at the first record of the file.
Note: Our recommendation for new users (even though we know it uses up valuable screen realestate) is to turn on the function key display, until you get used to the product. To do that, use either one of the following commands:
� FKA ON� PFSHOW ON
68 Introduction to the IBM Problem Determination Tools

Figure 3-8 Start of a VSAM file demonstrating use of Key field
Type s in the Key field and press Enter to automatically scroll to records that start with that key, as shown in Figure 3-9.
Figure 3-9 Records starting with “s” as a result of a key locate
This feature is only available when records are displayed in TABL or SNGL format (which requires the use of a copybook or template). Regrettably, this feature does not appear in Data Set Edit (Option 2).
Chapter 3. Introduction to File Manager 69
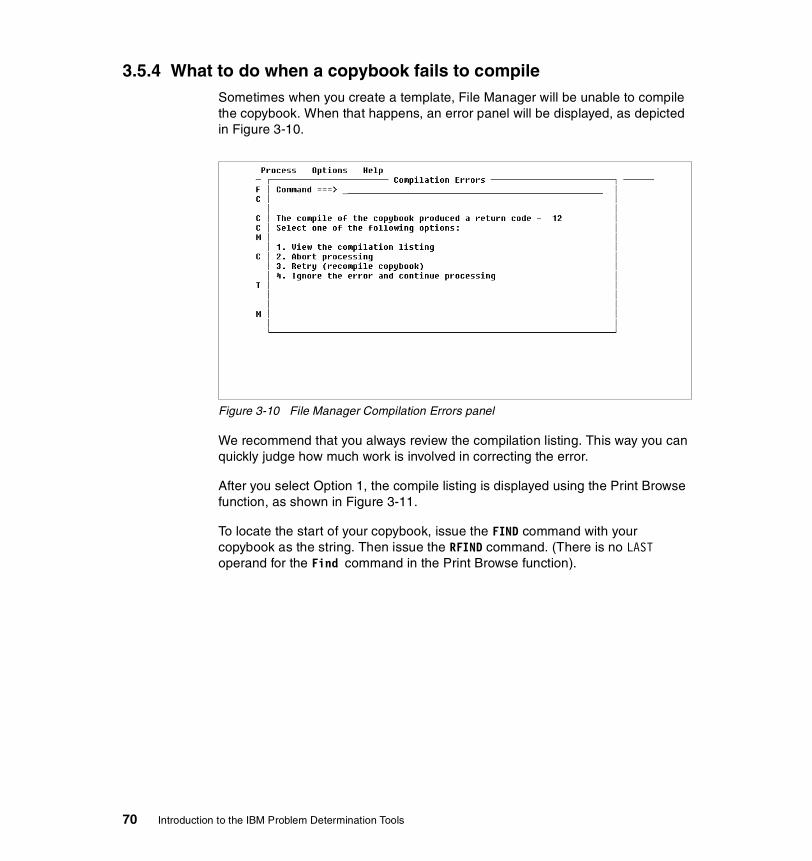
3.5.4 What to do when a copybook fails to compileSometimes when you create a template, File Manager will be unable to compile the copybook. When that happens, an error panel will be displayed, as depicted in Figure 3-10.
Figure 3-10 File Manager Compilation Errors panel
We recommend that you always review the compilation listing. This way you can quickly judge how much work is involved in correcting the error.
After you select Option 1, the compile listing is displayed using the Print Browse function, as shown in Figure 3-11.
To locate the start of your copybook, issue the FIND command with your copybook as the string. Then issue the RFIND command. (There is no LAST operand for the Find command in the Print Browse function).
70 Introduction to the IBM Problem Determination Tools

Figure 3-11 File Manager copybook compile listing at the point of error
Review the listing to determine what changes are necessary. Press PF3 twice to return to the Template Workbench panel.
3.5.5 Record structure defined in source application programIf the record structure of one of your application files is contained an application source program, File Manager cannot use it.
You must extract the record layout and create a copybook to perform any file manipulation with File Manager.
We suggest a certain amount of caution when doing this. You should use whatever resources are available to you so that you do not create multiple versions of the same file layout.
3.5.6 Watch out for that bad dispositionEvery time we used the Data Create Utility (Option 3.1), the value in the Disposition field automatically reverted to Mod.
This may have been related to the Systems Managed Storage (SMS) rules at this site.
Depending on your file structure, this might not matter to you. Otherwise, you will have more data in your file than you may have intended. You just have to be careful.
Chapter 3. Introduction to File Manager 71
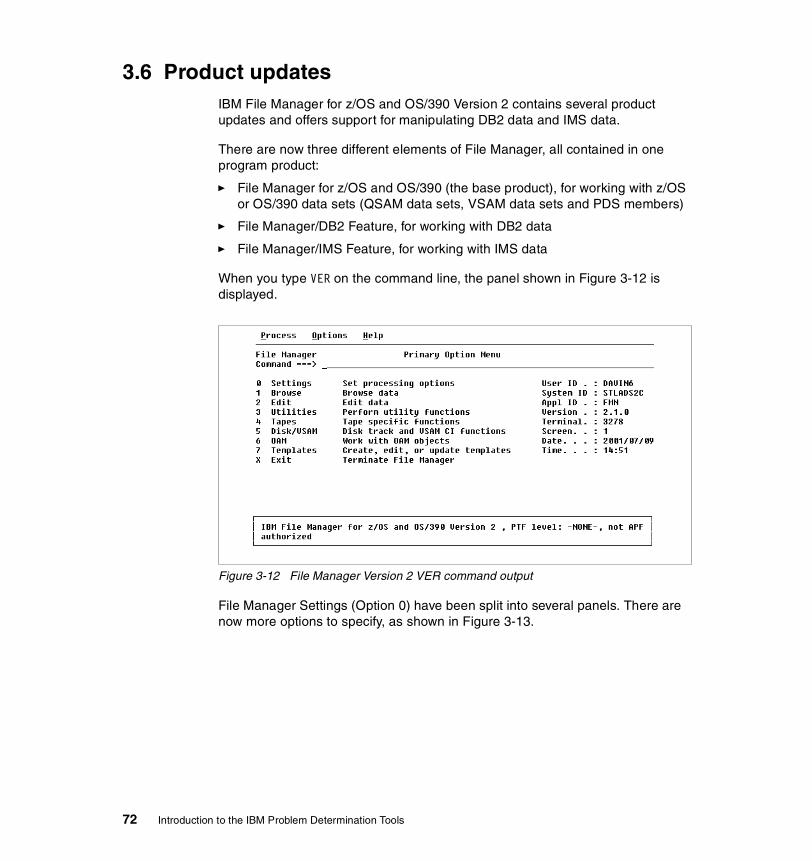
3.6 Product updatesIBM File Manager for z/OS and OS/390 Version 2 contains several product updates and offers support for manipulating DB2 data and IMS data.
There are now three different elements of File Manager, all contained in one program product:
� File Manager for z/OS and OS/390 (the base product), for working with z/OS or OS/390 data sets (QSAM data sets, VSAM data sets and PDS members)
� File Manager/DB2 Feature, for working with DB2 data
� File Manager/IMS Feature, for working with IMS data
When you type VER on the command line, the panel shown in Figure 3-12 is displayed.
Figure 3-12 File Manager Version 2 VER command output
File Manager Settings (Option 0) have been split into several panels. There are now more options to specify, as shown in Figure 3-13.
72 Introduction to the IBM Problem Determination Tools

Figure 3-13 File Manager Version 2 Settings panel
If your copybooks use COBOL COPY compiler-directing statements or PL/I %INCLUDE directives to include other members that do not exist in the same PDS as the copybook, you can now specify up to ten data sets where these other members are stored.
Field reference numbers begin counting from 1 at the start of each record type in a template; field #1 always refers to the level-01 group item in the current record type. (In Version 1, field reference numbers continued incrementing between the record types in a template.)
When browsing or editing data in SNGL or TABL display format, the information displayed next to (SNGL) or above (TABL) each field now includes: data type, starting column and length.
Figure 3-14 depicts the how Version 1 displays data being edited in SNGL mode, while Figure 3-15 depicts how Version 2 displays the same data.
Chapter 3. Introduction to File Manager 73

Figure 3-14 File Manager Version 1 record mapping
Figure 3-15 File Manager Version 2 record mapping
We use the File Manager/DB2 Feature in “Scenario 3: Using File Manager/DB2 and Debug Tool” on page 171.
74 Introduction to the IBM Problem Determination Tools

Chapter 4. Introduction to Debug Tool
IBM Debug Tool lets application programmers trace through an application program to determine where errors exist and to identify areas of potential problems. In this chapter, our emphasis is on application programs written in COBOL for OS/390 & VM. However, we identify some of the differences that are applicable to those written in VS COBOL II.
We start by listing the appropriate software levels at which we conducted the research for this book. We describe how to compile an application program to use Debug Tool, and describe how to invoke an application program and start Debug Tool. We include various considerations for debugging batch programs, CICS programs, and DB2 programs. We discuss two new features of Debug Tool, Dynamic Debug and Separate Side File. Finally, we present some hints and tips for application and systems programmers.
Please keep this in mind: Debug Tool requires the TEST option at both compile-time and runtime. Each use of the keyword has a different set of sub-options. We include a review of each one so you can see how they are used.
4
© Copyright IBM Corp. 2002 75

4.1 Start by validating your software levelsTo effectively use Debug Tool, you must have the correct levels of software installed on your system. The Authorized Program Analysis Reports (APARs) we have listed should be reviewed to identify the corresponding Program Temporary Fix (PTF) appropriate for your operating environment.
4.1.1 APAR informationThe APAR information contained in Table 4-1 should be used as a guide by systems programmers responsible for installing and maintaining Debug Tool. This list contains information that was specific to our system and for programs written in COBOL for OS/390 & VM.
Table 4-1 APARs required for Debug Tool
Program product APAR Notes
OS/390 Version 2 Release 6 and Release 7
OW32736 Adds support for SVC used by Debug Tool’s Dynamic Debug feature
COBOL for OS/390 & VM V2R1M0 and above
PQ36963 Introduces the new SEPARATE sub-option of the TEST compiler option to create the separate symbolic debug file (also known as a side file)
Supplemented with PQ40298
Corrects invalid HOLD information in PQ36963
PQ49999 Corrects a corrupt file in SYSDEBUG for programs larger than 5000 lines
Language Environment Version 1 Release 9 and above
PQ35436 Adds support for the SEPARATE sub-option of the TEST compiler option (i.e., support for the side file)
Supplemented with PQ41104
Corrects problems when SCEERUN is loaded from read-only storage
Supplemented with PQ48745
Tells you to correct misspelled word in sample EQACCSD (IGZDVGIN should be IGZDBGIN)
CICS Version 4.1 PQ36558 Adds support for the Debug Tool side file
CICS Transaction Server 1.2 and 1.3
PQ36683 Adds support for the Debug Tool side file
76 Introduction to the IBM Problem Determination Tools

Additional notesThe following PTFs are currently required (at the time of writing) for the Dynamic Debug feature:
� OS/390 V2R6 and above
– UQ54286, UQ54287, and UQ54288 (or newer)
4.2 What you need to prepare your application programBefore you can test your COBOL application program with Debug Tool, you must compile it with the appropriate options.
Only a few modifications need to be made to a standard batch compile process to support the use of Debug Tool.
� Include the TEST compile option, with appropriate sub-options.� Save the appropriate, required output files.
Suggestions for making modifications to your change management software are included in “Implementing the tools in your environment” on page 101.
Debug Tool PQ30470 Introduces Dynamic Debug feature (this is the minimum level required)
Supplemented with PQ31829
Corrects error in internal Debug Tool module
PQ43111 and PQ43112
Needed for OS/390 2.10 and higher
Important: Please note that these PTFs have been superseded by the ones listed above:
� OS/390 V2R6 through OS/390 V2R9– UQ43269, UQ43270, and UQ43271
� OS/390 2.10 and above– PTFs UQ49030, UQ49031, and UQ49032
Program product APAR Notes
Chapter 4. Introduction to Debug Tool 77

At the simplest level, you can include the TEST compile option when you compile your application program. When you do this, it is the equivalent of specifying different sub-options. The sub-options depend on the level of COBOL compiler, as depicted in Table 4-2.
Table 4-2 Default TEST compile options for COBOL compilers
Note: COBOL for OS/390 & VM requires the appropriate PTFs to be applied to support these options, as described in 4.1.1, “APAR information” on page 76.
TEST causes the compiler to create symbol tables and to insert program hooks at selected points in your application program’s object module. Debug Tool uses the symbol tables to obtain information about program variables and the program hooks to gain control of your application program during its execution. Debug hooks increase the size of the object module and can decrease runtime performance.
COBOL for OS/390 application programs can be debugged without program hooks inserted by the compiler. These programs can be compiled with the TEST(NONE) compiler option, but the Dynamic Debug feature must be installed. Refer to 4.5, “New features of Debug Tool” on page 94.
4.2.1 A description of the TEST compile optionThe TEST compile option has three sub-options, as depicted in Figure 4-1:
1. The first specifies whether compiled-in hooks will be generated by the compiler.
2. The second specifies whether symbolic information will be generated.
3. The third specifies whether that symbolic information will be part of the object program or will be contained in a separate file.
You can specify any combination of sub-options; however, you can specify SEPARATE only when SYM is in effect.
COBOL compiler level Default TEST compile option with sub-options
VS COBOL II TEST (there are no sub-options)
COBOL for OS/390 &VM TEST(ALL,SYM,NOSEPARATE)
78 Introduction to the IBM Problem Determination Tools

Figure 4-1 TEST compiler options
Refer to COBOL for OS/390 & VM Programming Guide, SC26-9049 and to Debug Tool User’s Guide and Reference, SC09-3137, for a complete discussion of these sub-options.
4.2.2 Additional compiler option informationSome other compiler options that should be used to provide improved debugging capabilities include:
� NONUMBER� SOURCE� RESIDENT (VS COBOL II only)
Usage notesWhen you use TEST with or without any of the sub-options, the OBJECT compiler option goes into effect.
When you use any TEST sub-option other than NONE, the NOOPTIMIZE compiler option goes into effect. TEST(NONE,SYM) does not conflict with OPTIMIZE, which allows you to debug optimized application programs with some limitations.
4.2.3 Required output filesYou must retain the following output files:
� Compile listing.
– All cases (unless you use a side file)
� Debug file (also known as a side file)
– Only if COBOL for OS/390 & VM is used with the SEPARATE option.– You must specify a SYSDEBUG DD statement in your compile JCL.
� Of course, you need the resulting object or load module.
E R R O R c o m m a n d s _ f i l e
,T E S T
N O T e s t
N O N E
(
, )p r e f e r e n c e _ f i le
P R O M P T
N O P R O M P T
,
*;c o m m a n d
*
A L L
Chapter 4. Introduction to Debug Tool 79

Debug Tool uses the output created by the TEST compiler option. It does not use the output created by the COBOL compiler option, LIST, like some other program products.
The attributes of the files that can be used by Debug Tool are listed in Table 4-3.
Table 4-3 Files created by the compiler for use by Debug Tool
4.2.4 Link-edit optionsDebug Tool requires no specific link-edit options for batch COBOL or for DB2 application programs.
To invoke Debug Tool under CICS, you should use the DTCN transaction. For each application program that uses DTCN, you must include the object module EQADCCXT from the EQAW.V1R2M0.SEQAMOD load library when you link-edit your program.
Note: The assembler-level instructions found in the compiler listing are required by Fault Analyzer.
We recommend that you use LIST and retain the compiler listings, despite the increase in output file size and the possible performance degradation of Debug Tool. Refer to “Implementing the tools in your environment” on page 101 for a complete discussion.
Data set type Record format
Record length
Structure Notes
COBOL listing F, FB, or FBA
133 PDS, Sequential, or HFS
Member name must match programRequired DD name is SYSPRINTData set name included in load module
SEPARATE debug file (side file)
FB 80 to 1024
PDS, Sequential, or HFS
Member name must match programRequired DD name is SYSDEBUGData set name included in load module
Note: Each site should determine whether it is necessary to relink-edit a CICS application program to remove this object module before it is staged for promotion to production.
80 Introduction to the IBM Problem Determination Tools

More information about DTCN can be found in 4.3.7, “CICS application program considerations” on page 88.
4.2.5 Sample batch compile jobExample 4-1 shows one representation of a sample batch job that could be used to compile and link-edit a batch COBOL application program for Debug Tool.
Example 4-1 Sample COBOL batch job with Debug Tool compile options
//DAVIN6CC JOB ,CLASS=A,NOTIFY=&SYSUID,MSGCLASS=H,MSGLEVEL=(1,1)
//*
//********************************************************************
//* JOB TO COMPILE A COBOL MODULE
//********************************************************************
//* LICENSED MATERIALS - PROPERTY OF IBM *
//* 5655-ADS (C) COPYRIGHT IBM CORP. 2001 *
//* ALL RIGHTS RESERVED *
//********************************************************************
//*
//COBCOMP EXEC PGM=IGYCRCTL,
// PARM=(DYNAM,LIB,RENT,APOST,MAP,XREF,LIST,NOSEQ,
// NONUMBER,’TEST(ALL,SYM,SEPARATE)’)
//STEPLIB DD DISP=SHR,DSN=IGY.V2R1M0.SIGYCOMP
//SYSLIB DD DISP=SHR,DSN=DAVIN6.PDPAK.COPYLIB
//SYSIN DD DISP=SHR,DSN=DAVIN6.PDPAK.SOURCE(TRADERB)
//SYSLIN DD DISP=(MOD,PASS),DSN=&&LOADSET,UNIT=SYSALLDA,
// SPACE=(CYL,(1,1))
//SYSUT1 DD SPACE=(CYL,(1,1)),UNIT=SYSALLDA
Chapter 4. Introduction to Debug Tool 81
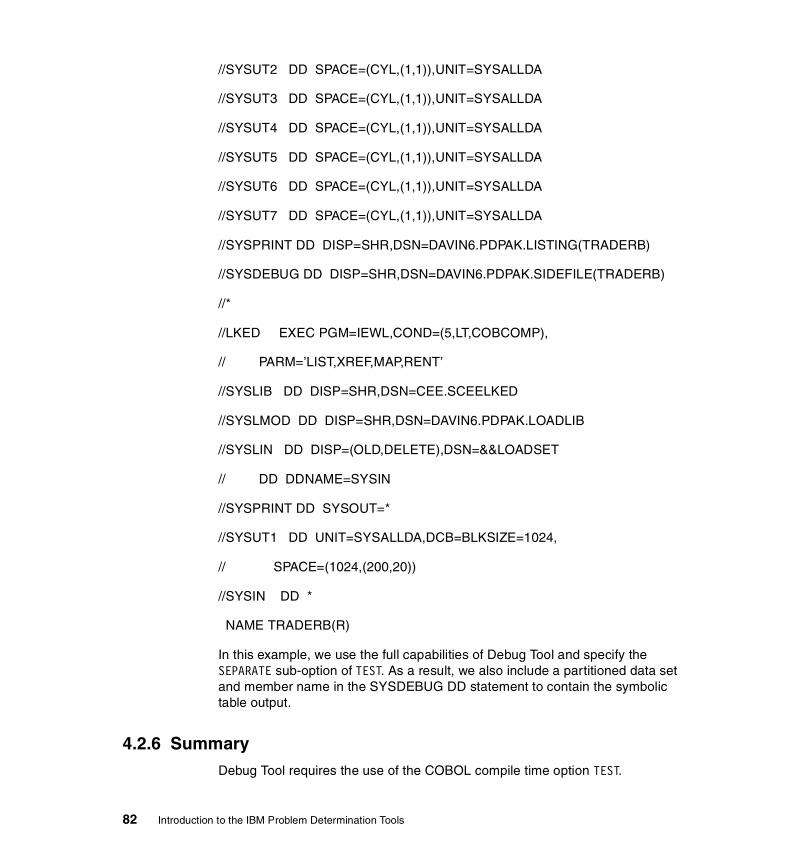
//SYSUT2 DD SPACE=(CYL,(1,1)),UNIT=SYSALLDA
//SYSUT3 DD SPACE=(CYL,(1,1)),UNIT=SYSALLDA
//SYSUT4 DD SPACE=(CYL,(1,1)),UNIT=SYSALLDA
//SYSUT5 DD SPACE=(CYL,(1,1)),UNIT=SYSALLDA
//SYSUT6 DD SPACE=(CYL,(1,1)),UNIT=SYSALLDA
//SYSUT7 DD SPACE=(CYL,(1,1)),UNIT=SYSALLDA
//SYSPRINT DD DISP=SHR,DSN=DAVIN6.PDPAK.LISTING(TRADERB)
//SYSDEBUG DD DISP=SHR,DSN=DAVIN6.PDPAK.SIDEFILE(TRADERB)
//*
//LKED EXEC PGM=IEWL,COND=(5,LT,COBCOMP),
// PARM=’LIST,XREF,MAP,RENT’
//SYSLIB DD DISP=SHR,DSN=CEE.SCEELKED
//SYSLMOD DD DISP=SHR,DSN=DAVIN6.PDPAK.LOADLIB
//SYSLIN DD DISP=(OLD,DELETE),DSN=&&LOADSET
// DD DDNAME=SYSIN
//SYSPRINT DD SYSOUT=*
//SYSUT1 DD UNIT=SYSALLDA,DCB=BLKSIZE=1024,
// SPACE=(1024,(200,20))
//SYSIN DD *
NAME TRADERB(R)
In this example, we use the full capabilities of Debug Tool and specify the SEPARATE sub-option of TEST. As a result, we also include a partitioned data set and member name in the SYSDEBUG DD statement to contain the symbolic table output.
4.2.6 SummaryDebug Tool requires the use of the COBOL compile time option TEST.
82 Introduction to the IBM Problem Determination Tools

This option has sub-options that control how Debug Tool manipulates program variables and how it traverses the structure of the program:
� To get the full capabilities of Debug Tool, compile with TEST(ALL,SYM) or TEST(ALL,SYM,SEPARATE).
� To get the smallest load module, one that is a virtual equivalent of NOTEST, compile with TEST(NONE,SYM,SEPARATE).
4.3 What it takes to debug your application programTo start a debug session with Debug Tool, you invoke your application program, including the TEST runtime option.
After Debug Tool is invoked, it gains control of your application program and suspends execution to allow you to perform tasks like setting breakpoints, checking the value of variables, or examining the contents of storage.
At the present time, the most effective location to execute a batch application program is in TSO READY mode. This allows you to enter any of the necessary file allocations and the application program invocation command.
You can also run your debug session in batch mode with a commands file (script).
4.3.1 A description of the TEST runtime optionThe TEST runtime option has four sub-options as depicted in Figure 4-2.
1. The first specifies which conditions in your application program will cause Debug Tool to gain control.
2. The second specifies the commands file that will be used.
3. The third specifies how to start up Debug Tool at initialization (either right before or right after Language Environment initialization).
4. The fourth specifies the preferences file that will be used.
Chapter 4. Introduction to Debug Tool 83

Figure 4-2 TEST runtime options
The IBM default when TEST is specified is TEST(ALL,*,PROMPT,INSPPREF)
NotesWhen an asterisk is used in place of an actual commands file, the terminal is used as the source of the commands. However, when Debug Tool is run in batch mode, a commands file is required.
Refer to Language Environment for OS/390 & VM Programming Reference, SC28-1940, and to Debug Tool User’s Guide and Reference, SC09-3137, for a complete discussion of these sub-options.
4.3.2 How to determine your site’s runtime optionsYou can view what your site has established for Language Environment (LE) runtime options. You specify RPTOPTS(ON) when you execute your application program. RPTOPTS(ON) lists the runtime options in alphabetical order. The report lists the option names and shows where each option obtained its current setting.
To generate this report, include the parameter when you execute your application program, as shown in Example 4-2.
Example 4-2 Program execution requesting list of LE runtime options
//*********************************************//GO EXEC PGM=TRADERB, // PARM='/RPTOPTS(ON)' //STEPLIB DD DISP=SHR,DSN=DAVIN6.WORK.LOADLIB
,
T E S T
N O T e s t
A L L(
,
)
( A L L , S Y M )
B L O C K
N O N E
P A T H
S T M T
N O S Y M
S Y M
N O S E P A R A T E
N O S E P A R A T E,
S E P A R A T E,( 1 )
( 1 )
( 1 )
N o t e :( 1 ) S E P A R A T E a n d N O S E P A R A T E a r e a v a i l a b l e o n l y f o r C O B O L f o r O S / 3 9 0 p r o g r a m s .
84 Introduction to the IBM Problem Determination Tools

An extract of the resulting report is shown in Example 4-3.
Example 4-3 Extract of the LE runtime options report
Installation default STACK(131072,131072,BELOW,KEEP) Installation default STORAGE(NONE,NONE,NONE,8192) Installation default TERMTHDACT(TRACE) Installation default NOTEST(ALL,"*","PROMPT","INSPPREF") Installation default THREADHEAP(4096,4096,ANYWHERE,KEEP) Installation default TRACE(OFF,4096,DUMP,LE=0) Installation default TRAP(ON,SPIE)
The complete report listing from this example can be found in Appendix A, “Language Environment runtime options report” on page 201.
4.3.3 What else is requiredYou must also make certain the appropriate environment is established for your application program's execution. This includes allocating:
� Debug Tool's load library (if it is not in LINKLIST or in a STEPLIB allocated to your TSO or CICS session)
� Debug Tool's supporting files
� Your application's input and output files
At the present time, Debug Tool does not provide a utility or mechanism to allocate the files required for a debugging session. You must issue the TSO ALLOCATE commands either at the READY prompt or by using a CLIST or REXX exec.
If you are not familiar with using either CLISTs or REXX execs to perform file allocations, the following books (depending on your coding language preference) will come in handy:
� OS/390 TSO/E CLISTs, SC28-1973� OS/390 TSO/E User’s Guide, SC28-1974� OS/390 TSO/E Command Reference, SC28-1969� OS/390 TSO/E REXX User’s Guide, SC28-1968� OS/390 TSO/E REXX Reference, SC28-1975
Chapter 4. Introduction to Debug Tool 85

4.3.4 Debug Tool's supporting filesDebug Tool may use the files listed in Table 4-4 in a typical debugging session.
Table 4-4 File types used by Debug Tool
Additional informationNote: You can use a COBOL listing or a side file, but not both.
If you use the SEPARATE sub-option of TEST at compile time, you cannot specify a compiler listing to Debug Tool at runtime. This is because the side file actually contains the listing.
The contents of a Log file can be edited and then reused as a member of a Commands file.
The Save file is not used under CICS.
4.3.5 Batch invocationIt is possible to use Debug Tool in batch mode. This is useful in situations where there is a sizeable amount of code to step through, and you want to get a general feel for how the program logic flows.
Data set type Record format
Record length
Structure Notes
COBOL listing F, FB, or FBA
133 PDS, Sequential, or HFS
Member name must match program
SEPARATE debug file (side file)
FB 80 to 1024
PDS, Sequential, or HFS
Member name must match program
Commands file FB 80 PDS, Sequential, or HFS
Default DD name is INSPIN (input)
Preferences file FB 80 PDS, Sequential, or HFS
Default DD name is INSPPREF (input)
Log file FB 72 Sequential Default DD name is INSPLOG (output)
Save file FB 80 Sequential Default DD name is INSPSAFE (output)
86 Introduction to the IBM Problem Determination Tools

Invoke your program as shown in Example 4-4 with the appropriate TEST runtime options and allocate the required data sets.
Note: When debugging in batch mode, use QUIT to explicitly end your session.
Example 4-4 Invoking Debug Tool via batch job
//DAVIN7X JOB CLASS=A,MSGCLASS=H,MSGLEVEL=(1,1),// REGION=32M,NOTIFY=&SYSUID//*****************************************************************//* JCL TO RUN A BATCH DEBUG TOOL SESSION//* PROGRAM TRADERB WAS PREVIOUSLY COMPILED WITH THE COBOL//* COMPILER TEST OPTION//*****************************************************************//*//STEP1 EXEC PGM=TRADERB,// PARM=’/TEST(,INSPIN,,)’//*//STEPLIB DD DISP=SHR,DSN=DAVIN7.PDPAK.LOAD// DD DISP=SHR,DSN=EQAW.V1R2M0.SEQAMOD//SYSPRINT DD SYSOUT=*//SYSABEND DD SYSOUT=*//COMPFILE DD DISP=SHR,DSN=DAVIN6.PDPAK.COMPFILE//CUSTFILE DD DISP=SHR,DSN=DAVIN6.PDPAK.CUSTFILE//TRANSACT DD DISP=SHR,DSN=DAVIN7.PDPAK.TRANFILE//REPOUT DD SYSOUT=*//TRANREP DD SYSOUT=*//*//INSPIN DD DISP=SHR,DSN=DAVIN7.DT.COMMANDS//INSPLOG DD SYSOUT=*,DCB=LRECL=72,RECFM=FB//*
4.3.6 DB2 application program considerationsHere’s some good news for DB2 programmers: With the exception of compiling with the TEST compiler option, you do not have to make any changes to your existing compile and link process.
To invoke your application program with Debug Tool, you have two options:
� Using TSO commands� Using the TSO Call Access Facility
TSO commandsTo use the TSO command interface to start executing your application program, issue the DSN command to invoke DB2. Then, issue the RUN subcommand and include the TEST runtime option as a parameter.
Chapter 4. Introduction to Debug Tool 87

For example:
RUN PROG(progname) PLAN(planname) LIB(‘your.user.library’) PARMS(‘/TEST’)
TSO Call Access FacilityTo use the TSO Call Access Facility (CAF), you link-edit the CAF interface module, DSNALI, with your application program. Then, issue the TSO CALL command for your application program and include the TEST runtime option as a parameter.
For example:
CALL ‘change.mgmt.test.loadlib(progname)’ ‘/TEST’
4.3.7 CICS application program considerationsTo invoke Debug Tool in CICS, you issue the DTCN transaction. DTCN is a full-screen CICS interface that allows you to modify any Language Environment runtime option for your application program.
Figure 4-3 depicts the panel displayed after the DTCN transaction is issued.
Figure 4-3 CICS DTCN primary menu
You enter any one or more of the fields of the application program you want to debug:
� Terminal ID� Transaction ID� Program ID� User ID
88 Introduction to the IBM Problem Determination Tools

Press PF9 to view or change any other runtime options. Figure 4-4 depicts the panel that is displayed.
Figure 4-4 CICS DTCN Menu 2
Change or enter any applicable LE runtime options that are needed for your application program. This allows you to modify settings and include runtime options without adding a user runtime module (CEEUOPT) to your program:
� Press PF3 to return to the DTCN primary menu.� Press PF4 to save your changes.� Press PF3 to exit DTCN.
DTCN stores one profile for each DTCN terminal. This profile is retained until it is explicitly deleted, or CICS is brought down.
A concise explanation of DTCN can be found in the member DTCNUSE in the EQAW.V1R2M0.SEQASAMP data set.
CICS Debug Tool Log fileThe Debug Tool Log file is not automatically started for a CICS debugging session the way it is for a TSO session. You need to issue the following command:
SET LOG ON FILE dsn
Note: When you are finished testing, invoke DTCN. To turn off the profile, press PF6 to delete the profile then PF3 to exit DTCN.
Chapter 4. Introduction to Debug Tool 89

You should consider putting this command in your Preferences file. If you do, you must make sure the log is large enough to hold all of the output that your debugging session will produce.
4.4 The primary interface for Debug ToolThe full-screen mode of debugging, whether run in TSO or CICS, lets you view three different aspects of a debugging session:
� Monitor: Monitors changes in your program.
� Source: Views your program source code.
� Log: Records commands and other interactions between Debug Tool and your program.
Figure 4-5 depicts the start of a debugging session with the sample batch program, TRADERB.
Figure 4-5 Debug Tool full-screen interface
As you can see, Debug Tool’s PF keys are displayed automatically. We recommend that you keep them displayed, despite the screen real-estate they use, until you are very comfortable with the default settings.
4.4.1 Review of screen areasA brief description of each of the screen areas.
90 Introduction to the IBM Problem Determination Tools

Monitor windowThis window displays the status of items you choose to monitor, such as variables, registers, programs, the execution environment, and Debug Tool settings. For example, you can use this window to watch the content of variables change during application program execution.
Source windowThis window displays the application program source or listing, with the current statement highlighted. In the prefix area at the left of this window, you can enter commands to set, display, and remove breakpoints. There is also an optional suffix area on the right, that can be used to display frequency counts.
Log windowThis window records and displays your interactions with Debug Tool and, optionally, shows program output. This window contains the same information as the log file. You can exclude STEP and GO commands from appearing by specifying SET ECHO OFF in your Preferences file.
For a complete explanation of how to manipulate the debugging windows, refer to Debug Tool User’s Guide and Reference, SC09-2137.
4.4.2 Descriptions of frequently used commandsWe include descriptions of several commonly used commands to give you a flavor of how easy it is to use Debug Tool. To see how some of these commands are used, refer to Chapter 8, “Scenario 2: Using Debug Tool” on page 153. In these examples, all of the commands are entered on the command line and the results are displayed in the Log window.
ATThe AT command defines a breakpoint. You temporarily suspend your application program’s execution when you issue this command. You can review the processing that has already taken place or issue other Debug Tool commands.
Example:
at line 334 list “about to setup files”;go;
Result:
AT LINE 334 LIST "About to set up files" ;
GO ; EQA1140I About to set up files
Chapter 4. Introduction to Debug Tool 91

CLEARThe CLEAR command removes the actions of previously issued Debug Tool commands, this includes breakpoints.
Examples:
clear at;
clear log;
Note: The last example does not clear the contents of a Log file directed to SYSOUT in a batch job.
COMPUTEThe COMPUTE command assigns the value of an arithmetic expression to a WORKING-STORAGE variable.
Example:
compute holdings = dec-no-shares * 10;
DESCRIBEThe DESCRIBE command displays information about the application program, variables, and the environment.
Example:
describe attributes ws-current-date;
Result:
DESCRIBE ATTRIBUTES WS-CURRENT-DATE ; EQA1102I ATTRIBUTES for WS-CURRENT-DATE EQA1105I Its length is 8 EQA1103I Its address is 089826CD EQA1112I 02 TRADERB:>WS-CURRENT-DATE EQA1112I 03 TRADERB:>WS-YR XXXX DISP EQA1112I 03 TRADERB:>WS-MM XX DISP EQA1112I 03 TRADERB:>WS-DD XX DISP
DISABLE / ENABLEThe DISABLE command makes the AT breakpoint inoperative, but does not clear it; you can ENABLE it later without typing the entire command again.
Example:
disable at statement 334;
92 Introduction to the IBM Problem Determination Tools
GOThe GO command instructs Debug Tool to start or resume running your program.
LISTThe LIST command displays information about a program, such as the values of variables, frequency information, and the like.
Use parenthesis around working storage variables to prevent any confusion with actual LIST operands.
Example:
list (ws-current-date);
Refer to 4.6.4, “Recording how many times each source line runs” on page 99, for an example of the use of LIST FREQUENCY.
MONITORThe MONITOR command allows you to observe changes to WORKING-STORAGE variables in the Monitor window while the program executes.
Example:
monitor list dec-no-shares;
Result:
The results of the MONITOR command can be seen in Chapter 8, “Scenario 2: Using Debug Tool” on page 153.
MOVEThe MOVE command transfers data from one area of storage to another. This allows you to manipulate the contents of WORKING-STORAGE variables, and possibly alter the flow of the program as it executes.
Example:
move 250 to dec-no-shares;
QUERYThe QUERY command displays the values of Debug Tool settings and information about the current program. There are more than 30 forms to this command.
Example:
query location;
Chapter 4. Introduction to Debug Tool 93

Result:
QUERY LOCATION ; EQA1242I You are executing commands in the STATEMENT TRADERB ::> TRADERB : 334.1 breakpoint. EQA1238I The current location is TRADERB ::> TRADERB :> 334.1.
SETThe SET command sets various switches that affect the operation of Debug Tool.
Example:
set echo off;
Result:
STEP and GO statements do not appear in the Log window, but they do go to the Log file.
STEPThe STEP command causes Debug Tool to execute your program one (or more) statements at a time.
Example:
step 5;
Result:
Debug Tool will execute five lines of code, one line at a time.
For a complete description of all the available commands, refer to Debug Tool User’s Guide and Reference, SC09-2137.
4.5 New features of Debug ToolDebug Tool has recently added two new features:
� Dynamic Debug� Separate Debug File
These features are available as a result of modifications made to the TEST compile option. A summary of each feature follows.
94 Introduction to the IBM Problem Determination Tools

4.5.1 Dynamic DebugA new feature of Debug Tool is called Dynamic Debug. This feature allows you to debug COBOL for OS/390 application programs without the use of compiled-in debug hooks.
Normally, debug hooks are added into the object module when you specify the TEST compiler option with any of its sub-options (except NONE). Debug hooks increase the size of the object and can decrease runtime performance. Dynamic Debug allows you to create smaller objects by removing the need for compiled-in debug hooks. It also gives you the benefit of not having to recompile your COBOL application programs prior to moving them into production.
To prepare your application program for Dynamic Debug, compile it using the TEST(NONE,SYM) compile-time option.
The symbolic debug tables allow you to access variables and other symbol information while you are debugging. The symbolic debug tables are placed in the object by default. To further reduce the size of the load module, consider using the other new feature of Debug Tool, called Separate Debug File.
4.5.2 Separate Debug FileA new sub-option to the TEST compiler option moves the symbolic debug tables out of the object module and into a separate file or data set (known as a side file). This allows you to generate load modules that are smaller in size. With a side file, Debug Tool no longer depends on the compiler listing.
To prepare your application program for Separate Debug File, you need to use the new SEPARATE sub-option of the TEST compiler option. When you use the SEPARATE sub-option, you also need to include a SYSDEBUG DD statement in your JCL. The compiler stores the symbolic debug tables in the file or data set specified on the SYSDEBUG DD statement.
You can use the SEPARATE sub-option with the Dynamic Debug feature to create the smallest modules that are still debuggable. Use the following compiler option to create these small modules:
TEST(NONE,SYM,SEPARATE)
Important: No debug hooks are created; however, symbolic debug tables are created.
Chapter 4. Introduction to Debug Tool 95

4.5.3 AdvantagesBy using these new features, you can reduce the risk that you are putting an application program into production that is not optimized for that environment.
If you have been saving your listings to help debug future production abends, you can now save the separate debug files. The size of a symbolic debug table is significantly smaller than a listing.
4.5.4 How this helps application programmersApplication programmers benefit from these new features:
� The application program they worked on in test is still in the same form as the one that is moved to production.
� This can reduce the number of last minute compiles prior to staging application programs for production.
� The components are available for immediate debugging if the application program experiences any problems after release.
4.6 Hints and tipsHere are some additional items we discovered during our research of Debug Tool that might be useful to you:
� Systems programmer notes� Customer concerns� How to point to a debug file� Recording how many times each source line runs
4.6.1 Systems programmer notesThe following notes provide post-installation information for systems programmers:
Note: To take advantage of the smaller load module and separate debug files, you must modify your compiler procedures. This can have some impact on your change management process.
96 Introduction to the IBM Problem Determination Tools

Dynamic Debug installation informationAfter Debug Tool is received, systems programmers should refer to the EQASVDOC member in the EQAW.V1R2M0.SEQASAMP data set. This contains a complete explanation of the system requirements and detailed installation procedures for the Dynamic Debug feature.
CICS set-upAfter Debug Tool has been properly installed, the following tasks still need to be performed to set up the product.
1. Refresh the CICS definitions for Debug Tool.
You can find these definitions in the members EQACCSD and EQACDCT of the EQAW.V1R2M0.SEQASAMP data set.
Note: If you have CICS Transaction Server, you can omit the EQACDCT updates and remove the comments from the transient data definitions at the end of EQACCSD.
2. Update the JCL that starts CICS:
a. Include Debug Tool’s load library (EQAW.V1R2M0.SEQAMOD) and the Language Environment runtime load library (CEE.SCEERUN) in the DFHRPL concatenation.
b. Include EQA00DYN from Debug Tool’s load library in the STEPLIB concatenation. You can do this in one of two ways:
• APF authorize the EQAW.V1R2M0.SEQAMOD data set and add the data set to the STEPLIB concatenation.
• Copy the EQA00DYN module from the EQAW.V1R2M0.SEQAMOD data set to a library that is already in the STEPLIB concatenation.
c. Ensure that no DD statements exist for:
• CINSPIN• CINSPLS• CINSPOT
APAR informationAs a final reminder, 4.1.1, “APAR information” on page 76, contains a list of the software updates required to use these features.
4.6.2 Customer concernsOne of the more pressing concerns of most customers is:
Chapter 4. Introduction to Debug Tool 97

“I want to make certain that any changes made to an application program to enable Debug Tool will not affect the ability of that application program when it runs in production.”
Compiling with TEST(NONE,SYM,SEPARATE) produces the smallest load module possible that allows you to use nearly the full capabilities of Debug Tool. This option should not cause any adverse performance issues when run in production. Using this option requires the appropriate software levels for the operating system, the compiler, and Debug Tool.
We compiled the program, TRADERB, (used in Chapter 8, “Scenario 2: Using Debug Tool” on page 153) with different TEST options. Table 4-5 shows the changes in size of the resulting load module.
Table 4-5 TRADERB load module sizes from different TEST compile options
Clearly, the first load module is the smallest; however, there does not appear to be that much of a difference between it and the third.
Each site should make the determination based on their business practices.
4.6.3 How to point to a debug file or listingWhen you use the TEST compile-time option, the compiler stores the name of the listing data set or debug file in the object module. Debug Tool uses this information to locate the listing data set or debug file. Therefore, if you move or rename the data set or file, Debug Tool will not be able to locate it.
This is useful if your change management software moves the file to different libraries when the load module is promoted.
Compiler option Load module size (in hexadecimal)
NOTEST 3770
TEST(ALL,SYM,NOSEPARATE) BC00
TEST(NONE,SYM,SEPARATE) 38A0
Tip: You can specify the new debug file or data set name using the SET DEFAULT LISTINGS or SET SOURCE commands in your command file.
Alternatively, you can press PF4 at the start of your debug session to select a file from a list, or to enter a new location.
98 Introduction to the IBM Problem Determination Tools

4.6.4 Recording how many times each source line runsTo record how many times each line of your code executed, do the following:
1. Allocate the Log file (if you are running in batch mode, direct the log to the JES spool).
2. Issue the following commands:
SET FREQUENCY ON;AT TERMINATION LIST FREQUENCY *;GO;
3. At the end of your session, save the Log file and review it.
Example 4-5 shows an extract of a log file from one of our sample application programs.
Example 4-5 Frequency counts from TRADERB
* Frequency of statement executions in TRADERB * 330.1 = 1 * 332.1 = 1 * 334.1 = 1 * 336.1 = 1 * 339.1 = 1 * 340.1 = 1 * 341.1 = 1 * 342.1 = 1 * 343.1 = 1 * 344.1 = 1 * 346.1 = 1 * 348.1 = 1 * 351.1 = 0 //\\\\//* 806.1 = 2 * 807.1 = 2 * 809.1 = 0 * 811.1 = 2 * 813.1 = 0 * Total Statements=264 Total Statements Executed=137 Percent * Executed=52
Chapter 4. Introduction to Debug Tool 99

100 Introduction to the IBM Problem Determination Tools

Chapter 5. Implementing the tools in your environment
In this chapter we review key components required to use each of the Problem Determination Tools. We present various models so that you can decide how to implement the components in your environment.
As a reminder, this chapter concentrates on COBOL for OS/390 & VM programs. Although the Problem Determination Tools support multiple programming languages, they are not covered in this redbook.
5
Important: If you have read the preceding chapters, you know that Fault Analyzer and Debug Tool each have an output component called a side file.
What, you mean you just jumped here for some quick answers? Shame on you! Go back and (at least) read Chapter 1, “Overview of the Problem Determination Tools” on page 3.
Please keep in mind: They are not the same file; they do not have the same construct; they merely share the same name.
© Copyright IBM Corp. 2002 101

5.1 Fault Analyzer componentsThe principal components that Fault Analyzer uses as input come from the output of the COBOL compiler:
� Compiler listing� Side file
A side file is the product of post-processing a compiler listing.
For Fault Analyzer to provide the greatest degree of failure analysis at the time an application program abends, you need a compiler listing or a side file; you do not need both.
When Fault Analyzer attempts to analyze an abend, it looks for source line information in the following order:
� It looks for a side file.
� If one cannot be located, then Fault Analyzer looks for a compiler listing.
– If a listing is found, then Fault Analyzer generates a side file (and places it in a temporary data set that will be deleted after the analysis is complete).
– If a listing cannot be found, then Fault Analyzer is not able to provide source line detail, although it can still provide an analysis of the abend.
When application programmers have the source line information available at the time of an abend, they need less time to correct the problem.
5.1.1 ListingsFault Analyzer requires the assembler-level instructions contained in a COBOL application program and the relationship among, and location of, the data areas to determine the exact instruction at which an abend occurred.
The following COBOL compiler options provide this information:
� SOURCE� LIST� MAP� XREF
Note: These options are also used by other, third-party debugging and dump analysis program products to obtain the assembler-level instructions for either compile-time or post-compile processing.
102 Introduction to the IBM Problem Determination Tools

Your site has probably standardized on these compile-time options in either your system procs or your change management software. However, using these compiler options (especially LIST) often results in very large output files.
If you already have the DASD allocated (or designated) to retain these listings, you can, and should, continue to save them.
Naming conventionsFault Analyzer requires that the compiler listing be retained as a member of a partitioned data set (PDS) or a PDS/E. The member name of the listing must match the name of the program.
5.1.2 Side filesFault Analyzer side files are intelligent extracts of the COBOL compiler listing information, stored in a format that Fault Analyzer can more easily access.
You use a Fault Analyzer program to create a side file from a compiler listing. To do this, either add a separate step to the batch job during compile time, or specify a batch or an interactive re-analysis during a Fault Analyzer ISPF session. We described this process in detail in 2.3.3, “How to create a side file” on page 20.
After you create and store a side file, there is no benefit to Fault Analyzer in keeping the listing. However, the listing is still beneficial to application programmers who may need to review the fully expanded contents of their application programs.
Note: If your site stores compiler listings as sequential files and you want to use them with Fault Analyzer, there is a sample REXX exec that can help.
It is designed to read multiple sequential files and copy the contents into members in a PDS. The program name must be appear in the data set name for this routine to work. Refer to Appendix A, “Convert multiple sequential files to members of a PDS” on page 203.
Restriction: If your listings are kept in a compressed (or proprietary) format, you must code a Fault Analyzer user exit to expand the compressed file and point to the temporary data set that contains the expanded version.
We regret that we cannot show you an example, but coding one would have been beyond the scope of this project.
Chapter 5. Implementing the tools in your environment 103

Naming conventionsFault Analyzer requires that the side file be retained as a member of a PDS or a PDS/E. The member name of the side file must match the name of the program.
5.1.3 Output file size comparisonYou may be curious, as we were, about what kind of difference there is between the size of compiler listings and side files. Table 5.1 shows the difference in sizes between data sets that contain the output of our sample CICS and batch applications, Trader.
Table 5-1 Size of listing data set versus side file data set for Trader applications
These statistics are based on only three programs: MYTRADMV, MYTRADS, and TRADERB. These programs contain less than 1000 lines of code, and have relatively small areas of working storage.
5.1.4 Steps toward implementationWe offer three models that you can use, or modify as needed, to implement Fault Analyzer components in your environment:
Model 1 You want to implement a unique form of contingency planning or your application programs experience frequent abends.
Model 2 Your application programs encounter few or infrequent abends, and you already retain compiler listings.
Model 3 Your site is storage (or budget) constrained and DASD is at a premium.
In all instances, we assume you have some form of change management process in place, irrespective of whether it is a vendor program product or in-house developer.
Model 1You need to set up contingency plans, because economic conditions are forcing you to reduce your application programming staff. Unfortunately, your application programs abend with a greater frequency than permitted by service level agreements.
Output type Size (in tracks)
Listing 38
Side file 7
104 Introduction to the IBM Problem Determination Tools
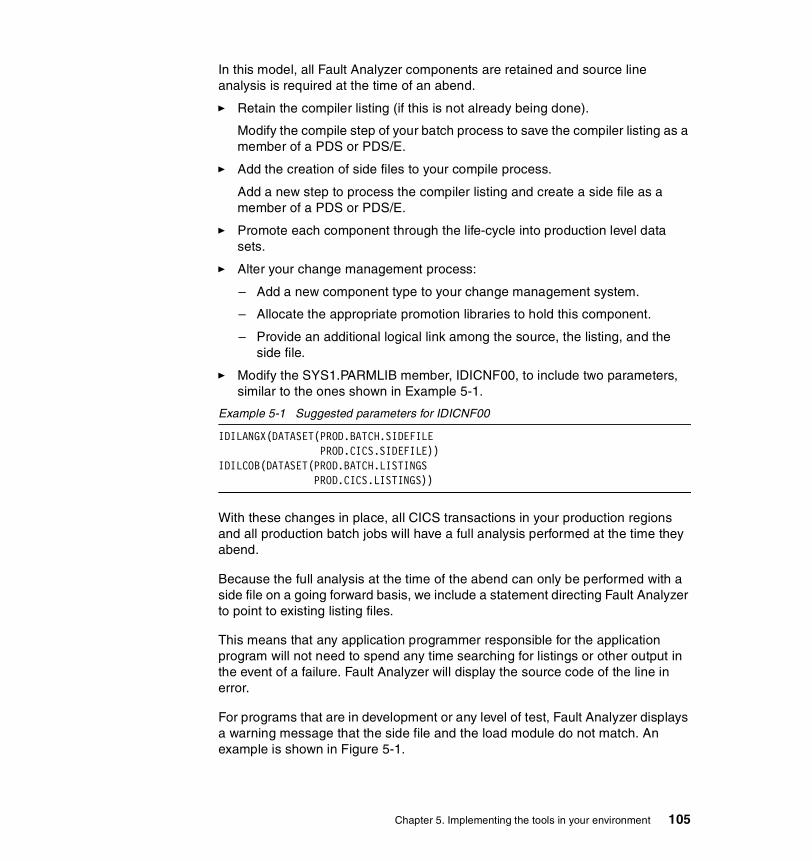
In this model, all Fault Analyzer components are retained and source line analysis is required at the time of an abend.
� Retain the compiler listing (if this is not already being done).
Modify the compile step of your batch process to save the compiler listing as a member of a PDS or PDS/E.
� Add the creation of side files to your compile process.
Add a new step to process the compiler listing and create a side file as a member of a PDS or PDS/E.
� Promote each component through the life-cycle into production level data sets.
� Alter your change management process:
– Add a new component type to your change management system.
– Allocate the appropriate promotion libraries to hold this component.
– Provide an additional logical link among the source, the listing, and the side file.
� Modify the SYS1.PARMLIB member, IDICNF00, to include two parameters, similar to the ones shown in Example 5-1.
Example 5-1 Suggested parameters for IDICNF00
IDILANGX(DATASET(PROD.BATCH.SIDEFILE PROD.CICS.SIDEFILE))IDILCOB(DATASET(PROD.BATCH.LISTINGS PROD.CICS.LISTINGS))
With these changes in place, all CICS transactions in your production regions and all production batch jobs will have a full analysis performed at the time they abend.
Because the full analysis at the time of the abend can only be performed with a side file on a going forward basis, we include a statement directing Fault Analyzer to point to existing listing files.
This means that any application programmer responsible for the application program will not need to spend any time searching for listings or other output in the event of a failure. Fault Analyzer will display the source code of the line in error.
For programs that are in development or any level of test, Fault Analyzer displays a warning message that the side file and the load module do not match. An example is shown in Figure 5-1.
Chapter 5. Implementing the tools in your environment 105

Figure 5-1 Fault Analyzer side file and load module mismatch
At this point, an application programmer can request either an interactive or batch re-analysis of the dump and can include a standardized Options File member that points to the correct level of side file. The member used would depend on the stage of the program in the life-cycle.
Example 5-2 and Example 5-3 show how the appropriate statements can be specified in an Options File for UAT and Development environments, respectively.
Example 5-2 Suggested parameters for UAT environment
IDILANGX(DATASET(UAT.BATCH.SIDEFILE UAT.CICS.SIDEFILE))IDILCOB(DATASET(UAT.BATCH.LISTINGS UAT.CICS.LISTINGS))
Example 5-3 Suggested parameters for the development environment
IDILANGX(DATASET(TEST.BATCH.SIDEFILE TEST.CICS.SIDEFILE))IDILCOB(DATASET(TEST.BATCH.LISTINGS TEST.CICS.LISTINGS))
106 Introduction to the IBM Problem Determination Tools

Model 2Your site has implemented strict quality controls and even has an oversight committee to perform code reviews prior to user acceptance testing (UAT). Your change management system retains the application program compiler listings, but does not compress them. Your site archives inactive versions of these listings using a third-party program product.
In this model, your application programmers perform a re-analysis shortly after the abend.
� Create a procedure that performs the following processes:
– Recalls the archived listing– Converts the listing to a side file– Invokes the batch re-analysis
The JCL for this batch job uses two symbolic parameters provided by the application programmer:
– The fault ID– The program name
The application programmer can submit the batch job to perform a re-analysis of the dump and can review the analysis report in the JES spool.
Model 3A budget freeze has been mandated at your site, but your DASD reserves are slowly being consumed. You need an alternative method to perform dump analysis.
In this model, only the Fault Analyzer side file is retained. Source line analysis is obtained as needed:
� Eliminate the retention of compiler listings.Modify the compile step of your batch process to place the compiler listing into a member of a temporary PDS.
� Add the creation of side files to your compile process.
Add a new step to process the compiler listing and create a side file as a member of a PDS/E.
� Promote this new component through the life-cycle into production level data sets.
� Validate your change management process.
Use the same component type and library names for the side files.
Chapter 5. Implementing the tools in your environment 107

Application programmers can request an interactive re-analysis of any dump and can include an Options File member that points to the appropriate level of side file. The data set name of the side file depends on the stage of the program in the life-cycle.
5.1.5 SummaryWe offered three models for implementing Fault Analyzer components in your environment. Here is a summary of the advantages and disadvantages associated with these models:
AdvantagesThe main advantage of these implementation plans is the ability to have a full dump analysis — with complete source line information — at the time of abend or during re-analysis.
Application programmers may still need to refer to the complete (i.e., fully expanded) compiler listing for assistance during problem determination. As such, retaining the compiler listings provides value.
You do not need a separately licensed program product option to translate the assembler-level instructions to source code format at the time of an abend.
DisadvantagesAdditional DASD may be required to store compiler listings or side files, depending on the model you chose to implement.
Each site should determine whether the cost of additional DASD for storing side files is offset by the ability to identify and to isolate problems quickly.
Significant alteration or modification to several core change management processes (i.e., compile and promotion) may be necessary to retain side files.
5.2 File Manager componentsThe principal components that File Manager uses as input are based on input to the COBOL compiler:
� Copybook� Template
A template is the product of a COBOL compile step that reads and processes the copybook.
108 Introduction to the IBM Problem Determination Tools

For File Manager to provide the greatest degree of flexibility in selecting and formatting records, you need a copybook or a template; you do not need both.
5.2.1 TemplatesYou create templates in two ways:
� Use the Template Workbench in File Manager.� In an Edit or Browse session, select the Edit copybook or template field.
Each method offers you the option of saving the template.
Some File Manager functions in batch allow you to use templates; however, they do not allow you to save them.
After a template is created, you can use REXX functions to provide additional processing or record selection.
Naming conventionsTemplates can perform different functions with respect to the records that are displayed or selected.
File Manager does not mandate any form of naming convention, nor does it impose any restrictions on how you name templates.
5.2.2 File associationsA by-product of mapping an application file using a copybook or template is a record in the user’s ISPF profile member, FMNTMHST. This table contains one row for each association between a data set name and a copybook or template member name.
This function allows you to browse or edit an application file without specifying a copybook or template. It does require you to establish this mapping at least once before you take advantage of the product’s memory.
5.2.3 Steps toward implementationWe offer one model that you can use, or modify as needed, to implement File Manager in your environment.
Note: IBM recommends that templates be created and saved to avoid the overhead of compiling copybooks during each edit or browse session.
Chapter 5. Implementing the tools in your environment 109

Model 1 Develop naming conventions for File Manager components.
Model 1Have your standards group review the naming standards for COBOL components and establish a similar charter for naming templates.
You can choose to develop naming standards based on the function the template performs:
� Give a template the same name as the copybook from which it was derived.
Store these templates in data sets named like the ones in which copybooks are contained.
If you choose to do this, establish a standard which states these templates only perform a mapping function.
� Give a template the name of the file it maps when multiple copybooks define the file.
A specific example would be the creation of one template for multi-record files that use several copybooks.
After you create an appropriate naming convention for your site, add it to your standards documentation. Consider updating the File Manager ISPF Tutorial panels with this information.
What you cannot doA second model, which we did consider, is to include the creation of templates into your change management process (e.g., whenever a copybook changes, a template is updated to reflect those changes).
Unfortunately, File Manager does not support this.
There is no utility to let you to compile copybooks into templates in batch mode, either. This means you cannot take your existing copybook library and process it in its entirety.
Restriction: All template creation must be done one member at a time and must be done using the File Manager dialog.
110 Introduction to the IBM Problem Determination Tools

5.2.4 SummaryWe offered only one model for implementing File Manager components in your environment. Here is a summary of the advantages and disadvantages associated with any implementation plan.
AdvantagesThe main advantage of this implementation plan would be a greater understanding of the data contents of application files. If you adhere to existing conventions, the ability to locate new components can be accomplished more quickly.
Templates can use REXX to perform pattern matching and record selection.
DisadvantagesThe main disadvantage is the time it takes for your standards group to evaluate how templates can be used and how they should be named.
Templates use REXX to perform various functions; some may consider this to be a disadvantage. At issue are the answers to the following questions:
� Do your application programmers know REXX?� How much money is in your training budget to provide REXX education?
Additional considerationsDespite providing the ISPF interface in the Template Workbench, the product lacks the ability to automate the template creation. There is no utility to let you to compile copybooks into templates in batch mode. Therefore, there can be no interface with any change management system to automatically update a template based on a change to a copybook.
The associations that File Manager builds between data set names and copybook or template names is done on an individual ISPF user basis. This function cannot be externalized, although the contents of the ISPF table can be mapped.
For example, Brenda can create a template for the same application file that Eddie is working with. Each of their templates may simply map the record layout of the file. Or, each of their templates may perform different functions with the data in the file.
Individual file associations can result in duplicated work for each application programmer. If you develop standard naming conventions and control the location of templates, you can reduce this re-work.
Chapter 5. Implementing the tools in your environment 111

5.3 Debug Tool componentsThe principal components that Debug Tool uses as input come from the output of the COBOL compiler:
� Load module� Compiler listing� Side file
By using the TEST compile option (and any of the sub-options), you create a load module that Debug Tool can use.
A side file is the product of post-processing a compiler listing.
For Debug Tool to provide the ability to step through an application program, you need a compiler listing or a side file; you do not need both.
5.3.1 Load modulesWhen the TEST compile option is used, depending on the sub-options specified, the data set name of either the compiler listing or the side file is placed in the load module. This lets Debug Tool know where to get the source code to display during the debugging session.
5.3.2 ListingsDebug Tool, like other debugging products (e.g., those from Compuware and Computer Associates), requires a compiler listing with the following compile-time options:
� SOURCE� LIST� MAP� XREF
However, unlike other tools, it does not use the assembler-level instructions from the LIST option for its processing. It places its debug hooks directly in the load module.
Note: These are the same compiler options required by Fault Analyzer; we recommend that you use them.
Naming conventionsDebug Tool places no restrictions on how a compiler listing should be retained. However, if it is stored in a PDS, the member name of the listing must match the name of the program.
112 Introduction to the IBM Problem Determination Tools

5.3.3 Side filesSide files, generated by the SEPARATE sub-option of TEST, are a recent upgrade to the product. This provides application programmers with a way of reducing the size of a load module by taking the symbol tables and placing them in a separate file.
Naming conventionsDebug Tool places no restrictions on how a side file should be retained. However, if it is stored in a PDS, the member name of the listing must match the name of the program.
5.3.4 Steps toward implementationWe present one model that you can use, or modify as needed, to implement Debug Tool in your environment.
We assume you have some form of change management process in place, irrespective of whether it is a vendor program product or in-house developed.
This model covers the key environments where you would most likely use Debug Tool:
� For development and test environments, use the full features of Debug Tool.
You can set your compile-time parameter to:
TEST(ALL,SYM)
� In a production environment, do not use any Debug Tool features.
You can set your compile-time parameter to:
NOTEST
� Alternatively, if you wish to have some level of Debug Tool support in production, use the Dynamic Debug feature with Separate Side File support.
You can set your compile-time parameter to:
TEST(NONE,SYM,SEPARATE)
To make these changes, consider the following:
� Retain the compiler listing (if this is not already being done).
Modify the compile step of your batch process to save the compiler listing as a member of a PDS or PDS/E.
� Add the creation of side files to your compile process.
Base this on a checkbox in an ISPF panel to add the TEST compile option.
Chapter 5. Implementing the tools in your environment 113

Add the SYSDEBUG DD statement to the batch compile JCL to process the side file as a member of a PDS or PDS/E.
� Alter your change management process:
– Add a new component type to your change management system.
– Allocate the appropriate libraries to hold this component.
– Provide an additional logical link among the source, the listing, and the side file.
� Ensure that no components compiled with the full TEST option are promoted to production.
This will force application programmers to perform one last compile, before the load module is promoted to production, to create a load module that uses the appropriate level of TEST.
AdvantagesThe primary advantage is full debugging capabilities before the load module is moved to production.
DisadvantagesAdditional DASD is required to store compiler listings or side files to permit debugging in development and test environments.
Each site should determine whether the cost of additional DASD for storing side files is offset by the ability to trace through program logic.
Significant alteration or modification to several core change management processes (i.e., compile and promotion) may be necessary to retain side files. Additional work is needed to enforce a no TEST policy in production.
Application programmers will be required to compile one more time before an application program is released to production
Restriction: If you compile a program with the Separate Debug File feature, and you somehow lose the side file, you must recompile the program. You cannot use the listing in a debugging session; Debug Tool will not let you.
No utility exists to take a listing and generate a side file.
114 Introduction to the IBM Problem Determination Tools

5.4 Common groundWe have presented models that depict how the Problem Determination Tools can be implemented in your environment. We now recap this information to see if they can be integrated with one another.
Fault AnalyzerFault Analyzer uses these key components:
� One (the compiler listing) is for geared for application programmers, the other (the side file) is geared for the tool itself. The component used by the tool is produced automatically.
� The tool is easy for application programmers to understand and is easy for them to use.
� The tool might be time-consuming for systems programmers to customize.
File ManagerFile Manager uses two key components:
� One (the copybook) is geared for application programmers, the other (the template) is geared for the tool. The component used by the tool is produced manually; there is no batch facility to do this.
� The tool provides some very useful features. However, it requires application programmers to be skilled with REXX to be able to obtain the greatest benefit.
Debug ToolDebug Tool uses three key components:
� Again, one (the listing) is geared for application programmers, the other two (the load module and the side file) is geared for the tool. The components required by the tool can be produced automatically.
� The tool is moderately difficult to use, but is extremely powerful. However, it requires that the application program load module be modified by a compile-time option. It also requires a different set of sub-options for full debugging capability versus production runtime.
The only components that can be used jointly are the compiler listings and the different side files. To produce these and maintain them with a change management tool requires significant modification to existing processes.
Each site needs to review their requirements for ongoing development and independently assess how they need to approach standardized problem determination.
Chapter 5. Implementing the tools in your environment 115

116 Introduction to the IBM Problem Determination Tools

Part 2 Scenarios using the Problem Determination Tools
In part two we present a set of scenarios, in CICS and batch, that demonstrate how to use the Problem Determination Tools.
Part 2
© Copyright IBM Corp. 2002 117

118 Introduction to the IBM Problem Determination Tools

Chapter 6. Introduction to the scenarios
In the scenarios that we present in the following chapters, all of the applications are running on a single S/390 processor.
These scenarios were designed to highlight features of the Problem Determination Tools in a brief, but effective manner.
In this chapter we cover:
� An overview of the scenarios� How to install the application software� The system configuration� How to validate the installation
Portions of these scenarios were adapted from a tutorial provided by the IBM WebSphere Application Development Solution (ADS) for OS/390. You do not need access to an ADS system to use this book. We have provided the means for you to download the applications and run them, if you wish.
6
© Copyright IBM Corp. 2002 119

6.1 Scenarios overviewWe have one application which has been written to demonstrate the features of the Problem Determination Tools. It is the Trader stock trading application. The users of this application might be investors checking their holdings, or buying and selling shares of stock. The application takes two forms:
� CICS� Batch
Note: This application does not reflect real-world securities processing. It is merely designed to demonstrate the features of the Problem Determination Tools.
In the chapters that follow, we create scenarios based on the Trader application. In each scenario, we deliberately introduce errors into the application to allow us to demonstrate the functionality of the tools. We then describe, in detail, the steps that you take to isolate the error and to correct the problem.
Product updatesThroughout this chapter we refer to the term, product updates. This denotes a software upgrade to two of the Problem Determination Tools. Specifically, a PTF for Fault Analyzer and a new version for File Manager.
These product updates allowed us to modify one of the existing scenarios. We were able to create a new one that uses DB2 tables instead of VSAM files to demonstrate new File Manager/DB2 functions.
6.1.1 Overview of the programsThe Trader application is used to maintain a stock portfolio held by an individual. This application enables you to:
� Obtain quotes (in batch mode, you list portfolios and their values)� Buy more shares of a company’s stock� Sell currently held shares of a company’s stock
The Trader application uses two VSAM KSDS files:
� Company file� Customer file
The Company file contains the stock name and the past week’s quotes. The Customer file contains a record for each customer and company that he or she owns, including the number of shares held.
120 Introduction to the IBM Problem Determination Tools

In the CICS application, the transaction input is taken directly from an online user’s interactions. In the batch application, the user’s input is replaced with a sequential file that contains several records that represent a day’s transactions.
Overview of the CICS programFigure 6-1 depicts the processing that occurs in the CICS application.
Figure 6-1 Trader application: single user transaction with CICS
Note: When you invoke this application, you can use any username and password. But, if you want to see the status from previous trading, use the same username each time.
Overview of the batch programFigure 6-2 depicts the processing that occurs in the batch application.
MYTRADM
VSAM file
MYTRADS
VSAM file
Customer Company
CICS
Chapter 6. Introduction to the scenarios 121

Figure 6-2 Trader application: multiple remote site transactions with batch
Note: You should always lists the holdings of a username to determine the number of shares in a portfolio before you begin to trade with it.
6.1.2 The application program environmentThe application programs listed in Table 6-1 were created for this redbook and are installed on our system. These application programs were designed to demonstrate the functionality of the Problem Determination Tools.
Table 6-1 Application programs in the Trader application
Product updatesAfter the products were updated, the application programs listed in Table 6-2 were created and installed.
Table 6-2 Application programs in the Trader application after product updates
Tranfile
Customer CompanySite B
Site A
Site C
TRADERB
VSAM file VSAM file
Application program Subsystem Purpose
MYTRADMVMYTRADS
CICS To retrieve customer information from VSAM files
TRADERB Batch To process customer transactions from sequential and VSAM files
Application program Subsystem Purpose
MYTRADMDMYTRADD
CICS and DB2 To retrieve customer information from DB2 tables (instead of VSAM files)
122 Introduction to the IBM Problem Determination Tools
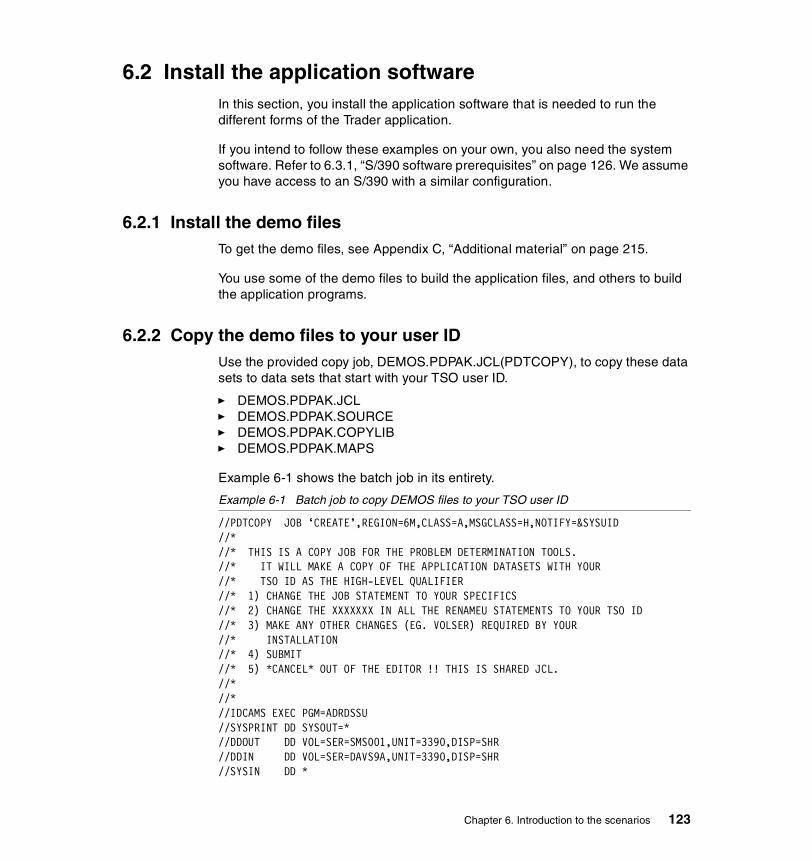
6.2 Install the application softwareIn this section, you install the application software that is needed to run the different forms of the Trader application.
If you intend to follow these examples on your own, you also need the system software. Refer to 6.3.1, “S/390 software prerequisites” on page 126. We assume you have access to an S/390 with a similar configuration.
6.2.1 Install the demo filesTo get the demo files, see Appendix C, “Additional material” on page 215.
You use some of the demo files to build the application files, and others to build the application programs.
6.2.2 Copy the demo files to your user IDUse the provided copy job, DEMOS.PDPAK.JCL(PDTCOPY), to copy these data sets to data sets that start with your TSO user ID.
� DEMOS.PDPAK.JCL� DEMOS.PDPAK.SOURCE� DEMOS.PDPAK.COPYLIB� DEMOS.PDPAK.MAPS
Example 6-1 shows the batch job in its entirety.
Example 6-1 Batch job to copy DEMOS files to your TSO user ID
//PDTCOPY JOB ‘CREATE’,REGION=6M,CLASS=A,MSGCLASS=H,NOTIFY=&SYSUID//*//* THIS IS A COPY JOB FOR THE PROBLEM DETERMINATION TOOLS.//* IT WILL MAKE A COPY OF THE APPLICATION DATASETS WITH YOUR//* TSO ID AS THE HIGH-LEVEL QUALIFIER//* 1) CHANGE THE JOB STATEMENT TO YOUR SPECIFICS//* 2) CHANGE THE XXXXXXX IN ALL THE RENAMEU STATEMENTS TO YOUR TSO ID//* 3) MAKE ANY OTHER CHANGES (EG. VOLSER) REQUIRED BY YOUR//* INSTALLATION//* 4) SUBMIT//* 5) *CANCEL* OUT OF THE EDITOR !! THIS IS SHARED JCL.//*//*//IDCAMS EXEC PGM=ADRDSSU//SYSPRINT DD SYSOUT=*//DDOUT DD VOL=SER=SMS001,UNIT=3390,DISP=SHR//DDIN DD VOL=SER=DAVS9A,UNIT=3390,DISP=SHR//SYSIN DD *
Chapter 6. Introduction to the scenarios 123

COPY DATASET(INCLUDE(DEMOS.PDPAK.JCL ) ) - OUTDD(DDOUT) CATALOG INDD(DDIN) ALLDATA(*) ALLEXCP - RENAMEU(XXXXXXX) COPY DATASET(INCLUDE(DEMOS.PDPAK.SOURCE ) ) - OUTDD(DDOUT) CATALOG INDD(DDIN) ALLDATA(*) ALLEXCP - RENAMEU(XXXXXXX) COPY DATASET(INCLUDE(DEMOS.PDPAK.COPYLIB ) ) - OUTDD(DDOUT) CATALOG INDD(DDIN) ALLDATA(*) ALLEXCP - RENAMEU(XXXXXXX) COPY DATASET(INCLUDE(DEMOS.PDPAK.MAPS ) ) - OUTDD(DDOUT) CATALOG INDD(DDIN) ALLDATA(*) ALLEXCP - RENAMEU(XXXXXXX)
Edit the JCL and change all instances of XXXXXXX to your TSO user ID.
Submit the job to copy the data sets.
After the job finishes, you need to edit the members of the JCL data set to validate the following information:
� DB2 load library and runtime library� COBOL compiler load library� Language Environment (LE) runtime library� CICS load library
These data sets must be named according to your sites’s standards.
In addition, you need to change the string, YOUR-TSO-USERID to your TSO user ID. If you wish, you can use the File Manager Find/Change Utility to perform this step.
6.2.3 Set up the applicationsThe starting point for the scenarios is an established stock trading application. Here are the steps that you need to perform if you want to set up this application at your site.
1. Generate the MYTRAD mapset using the GENMAP job.
2. Compile all of the COBOL programs with the appropriate batch compile job, as shown in Table 6-3.
Table 6-3 COBOL application programs with compile batch job names
Program Batch job Proc
MYTRADMV COBCIC COBPROC
MYTRADS COBCICS COBPROC
124 Introduction to the IBM Problem Determination Tools
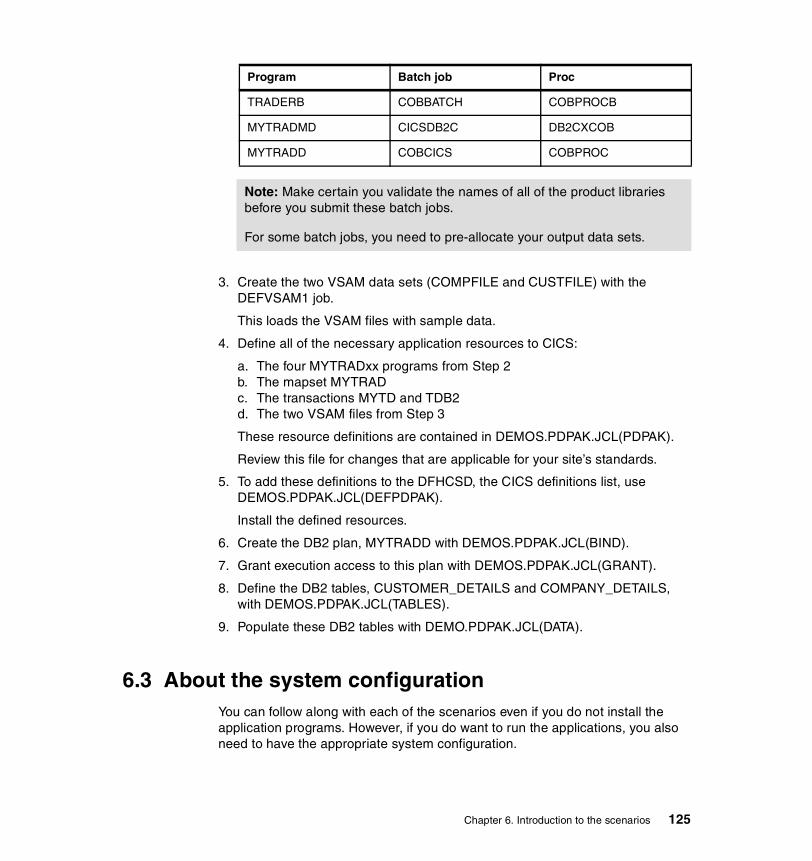
3. Create the two VSAM data sets (COMPFILE and CUSTFILE) with the DEFVSAM1 job.
This loads the VSAM files with sample data.
4. Define all of the necessary application resources to CICS:
a. The four MYTRADxx programs from Step 2b. The mapset MYTRADc. The transactions MYTD and TDB2d. The two VSAM files from Step 3
These resource definitions are contained in DEMOS.PDPAK.JCL(PDPAK).
Review this file for changes that are applicable for your site’s standards.
5. To add these definitions to the DFHCSD, the CICS definitions list, use DEMOS.PDPAK.JCL(DEFPDPAK).
Install the defined resources.
6. Create the DB2 plan, MYTRADD with DEMOS.PDPAK.JCL(BIND).
7. Grant execution access to this plan with DEMOS.PDPAK.JCL(GRANT).
8. Define the DB2 tables, CUSTOMER_DETAILS and COMPANY_DETAILS, with DEMOS.PDPAK.JCL(TABLES).
9. Populate these DB2 tables with DEMO.PDPAK.JCL(DATA).
6.3 About the system configurationYou can follow along with each of the scenarios even if you do not install the application programs. However, if you do want to run the applications, you also need to have the appropriate system configuration.
TRADERB COBBATCH COBPROCB
MYTRADMD CICSDB2C DB2CXCOB
MYTRADD COBCICS COBPROC
Note: Make certain you validate the names of all of the product libraries before you submit these batch jobs.
For some batch jobs, you need to pre-allocate your output data sets.
Program Batch job Proc
Chapter 6. Introduction to the scenarios 125

This section briefly reviews the software that was installed on our system, and what you would need to run the applications on yours.
6.3.1 S/390 software prerequisitesWe developed the Trader application and the scenarios on an S/390 with the following software installed and configured:
� OS/390 V2R9
� CICS Transaction Server for OS/390 V1.3
� The Problem Determination Tools:
– IBM Fault Analyzer for OS/390 Version 1, Release 1 (with Program Temporary Fix, UQ54133)
– IBM File Manager for OS/390 Version 1, Release 1
– IBM Debug Tool Version 1, Release 2
Product updatesThe following software products were used after two of the Problem Determination Tools were updated:
� DB2 Universal Database for OS/390 V6.1
� OS/390 SecureWay Communications Server V2.9, configured with SMTP
� The Problem Determination Tools
– IBM Fault Analyzer for OS/390 Version 1, Release 1 (with Program Temporary Fix, UQ55392)
– IBM File Manager for z/OS and OS/390 Version 2, Release 1
– IBM File Manager/DB2 Feature
It is possible that other levels of these software components may work, but the applications were tested with the levels listed here.
6.3.2 About the CICS configurationA summary of the steps required to set up the CICS configuration follows:
� The CICS resource definitions are specified in DEMOS.PDPAK.JCL(PDPAK).
Note: This file was updated after the requisite PTFs were applied for Debug Tool. Refer to 4.1.1, “APAR information” on page 76, for more details.
� An entry for the PDPAK group was added to the site’s CICS definitions list, DFHCSD. We used DEMOS.PDPAK.JCL(DEFPDPAK) to place these entries in DEMOCICS.COMMON.CSDDEFS(DEMOLIST).
126 Introduction to the IBM Problem Determination Tools

� After all of the batch compile jobs completed, the load modules for the CICS COBOL application programs, MYTRADMV, MYTRADMD, MYTRADS, and MYTRADD were in DEMOS.CICS.LOAD, which is in the CICS DFHRPL.
6.3.3 About the DB2 configurationA summary of the steps required to set up the DB2 configuration follows:
� The batch job DEMOS.PDPAK.JCL(BIND) creates a plan used by the CICS application.
The plan name is MYTRADD, which is specified in the DB2 entry of the CICS definitions.
� The batch job DEMOS.PDPAK.JCL(GRANT) grants execution access to the plan MYTRADD.
� The batch job DEMOS.PDPAK.JCL(TABLES) defines the tables CUSTOMER_DETAILS and COMPANY_DETAILS.
� The batch job DEMO.PDPAK.JCL(DATA) populates these tables.
6.4 Validate the installationAfter you have established all of the components of the applications in your environment, you need to validate the installation.
6.4.1 Getting startedThis section tells you what must be running on the system to allow the applications to execute.
Before you can start the applications, the subsystems must be started. On our system, we issue the following chain of commands to display a list of all active jobs and to sort them alphabetically:
=a;sd;da;prefix *;sort jobname
Each of the processes listed in Table 6-4 are found to be active.
Table 6-4 Subsystems required for Trader application
Jobname Purpose
CICSC001 The CICS demonstration region, in which the CICS COBOL (and DB2) demo application programs (MYTRADxx) are installed and configured.
DBA1MSTR DB2 process
Chapter 6. Introduction to the scenarios 127

6.4.2 Starting the Trader application in CICSThe following steps will start the Trader application:
1. Verify that you have installed this application correctly.2. Logon to your demonstration CICS region; in our case, it is C001.3. Enter the transaction, MYTD.4. Enter the User Name RB_DEMO and the Password ITSO.5. Select a company to trade.
Obtain real-time quotesThe following steps will obtain real-time quotes:
1. Request a list of real-time quotes for the selected company.2. Share prices from the prior week are displayed, including net present value.
Buy sharesThe following steps will buy shares:
1. Enter the number of shares to purchase.2. A confirmation message is issued.
Sell sharesThe following steps will sell shares:
1. Enter the number of shares to sell.2. A confirmation message is issued.
6.4.3 Running the Trader application in batchThe following steps run the Trader application in batch:
1. Verify that you have installed this application correctly.
2. Create a transaction file that contains sample records to buy, sell, and list shares in one company.
You can use the one in DEMOS.PDPAK.SAMPLES(SAMPTRAN).
Run the batch jobThis runs the batch job:
� Submit the batch job, TRADERB.
� This job invokes the program, TRADERB, which reads the transaction file. The contents of the file dictate the actions of the program
128 Introduction to the IBM Problem Determination Tools
� Each record is validated against the Company file. If a BUY or a SELL request is found, the appropriate program logic is invoked. The Customer file is updated as a result.
� All reports are written to the JES spool.
6.5 SummaryWe have presented an overview of the system where we developed the scenarios that use the Trader application.
We provided you with instructions that helped you install the application software. We outlined the steps necessary to set-up the applications.
You verified that both applications work.
Chapter 6. Introduction to the scenarios 129

130 Introduction to the IBM Problem Determination Tools

Chapter 7. Scenario 1: Using Fault Analyzer and File Manager
In this chapter, we describe the application components that exist in the CICS environment on our system and how they are set up.
We explain the processing that is performed in the CICS Trader application.
We force the application to abend and describe, in detail, the steps needed to identify the cause of an abend in the application, using Fault Analyzer. We then describe how to manipulate the data to correct the problem, using File Manager.
7
© Copyright IBM Corp. 2002 131

7.1 Set up the componentsTwo types of components need to be established for this scenario:
� CICS components� Program products
– Fault Analyzer– File Manager
7.1.1 CICS componentsComponents used by the Trader application are listed in Table 7-1. The data sets and member names of the application programs, the copybooks, and the JCL for compiling these programs are listed in Appendix A, “Components of the Trader application” on page 205.
Table 7-1 CICS components of the Trader application for scenario 1
7.1.2 Program productsTo use the Problem Determination Tools with this scenario, please make sure you have the following output or supporting files for each product:
Fault AnalyzerEnsure Fault Analyzer is correctly installed in your CICS region. See 2.5.2, “CICS set-up” on page 27.
You must have a compiler listing or side file for the programs MYTRADMV and MYTRADS.
Component Details Remarks
Programs MYTRADMVMYTRADS
CICS COBOL programs
Tran ID MYTD Transaction associated with the program, MYTRADMV
Mapset NEWTRAD BMS mapset containing all the maps used by the application
Files DEMOS.PDPAK.CUSTFILEDEMOS.PDPAK.COMPFILE
VSAM files used by the application
Copybooks CUSTFILECOMPFILE
File definition for CUSTFILE and COMPFILE
132 Introduction to the IBM Problem Determination Tools

� If you are not using the supplied batch jobs to compile these programs, make sure you specify the following compiler options:
LIST,SOURCE,XREF,MAP
File ManagerYou need the copybooks that contain the record structure of the VSAM files DEMOS.PDPAK.CUSTFILE and DEMOS.PDPAK.COMPFILE
� Copybooks CUSTFILE and COMPFILE
Make sure you run the DEFVSAM1 batch job to load the VSAM files. Refer to 6.2.3, “Set up the applications” on page 124.
7.2 Walkthrough of the CICS Trader applicationThe CICS Trader application is used to maintain a stock portfolio held by an individual. This application enables you to:
� Obtain quotes� Buy more shares of a company’s stock� Sell currently held shares of a company’s stock
Before you start the application, access CICSC001, or your own CICS application region.
Enter the transaction ID MYTD.
The Logon screen of the application is displayed in Figure 7-1. A username and a password are required to access the application.
Note: This example was designed to demonstrate the capabilities of the Problem Determination Tools. Therefore, a minimal amount of code was developed. This application does not represent real-world securities processing.
Chapter 7. Scenario 1: Using Fault Analyzer and File Manager 133

Figure 7-1 Trader application Logon screen
7.2.1 Log on to the applicationLog on to the application with a username and password. In this example, enter the username RB_DEMO and the password ITSO.
After you press Enter, the Company Selection screen is displayed, as shown in Figure 7-2. This screen lists the companies you can trade.
Note: In the Trader application, navigation keys are displayed at the bottom of each screen. PF3 is used to go back to the previous screen (except on the Logon screen) and PF12 is used to terminate the application.
134 Introduction to the IBM Problem Determination Tools

Figure 7-2 Trader application Company Selection screen
Note: You must select a company to continue with the application:
� Select 4, IBM, and press Enter.� The Options screen is displayed, as shown in Figure 7-3.
Figure 7-3 Trader application Options screen
On this screen, you select the trading option you want to perform:
� Obtain real-time quotes for a company.� Buy additional shares of the company.� Sell existing shares of the company.� You continue by selecting each option, in turn.
Chapter 7. Scenario 1: Using Fault Analyzer and File Manager 135

7.2.2 Obtaining quotesSelect Option 1, New Real-Time Quote, and press Enter.
The Real-Time Quote screen is displayed, as shown in Figure 7-4.
Figure 7-4 Trader application Real-Time Quote screen
This screen displays the price of the company’s share over the past seven days, the number of shares held, and the value of those shares based on the current day’s price:
� The company’s share price is read from the VSAM file DEMOS.PDPAK.COMPFILE (COMPFILE).
� The details of the user’s portfolio, (e.g., the number of shares held), are read from the VSAM file DEMOS.PDPAK.CUSTFILE (CUSTFILE).
Press PF3 to return to the Options screen.
7.2.3 Buying sharesSelect Option 2, Buy Shares, and press Enter.
The Shares Buy screen is displayed, as shown in Figure 7-5.
136 Introduction to the IBM Problem Determination Tools

Figure 7-5 Trader application Shares Buy screen
Enter the number of shares you want to buy and press Enter.
The Options screen is re-displayed with a message in the lower, left-hand corner of the screen indicating the status of the transaction.
If the process is successful, the value of the number of shares held is updated in the CUSTFILE.
7.2.4 Selling sharesSelect Option 3, Sell Shares, and press Enter.
The Shares Sell screen is displayed, as shown in Figure 7-6.
Chapter 7. Scenario 1: Using Fault Analyzer and File Manager 137

Figure 7-6 Trader application Shares Sell screen
Enter the number of shares you want to sell and press Enter.
The Options screen is re-displayed with a message in the lower, left-hand corner of the screen indicating the status of the transaction.
If the process is successful, the value of the number of shares held is updated in the CUSTFILE.
7.3 Tracking an abend in the applicationTo demonstrate the capabilities of the Problem Determination Tools, we force the application to abend and you step through the process of fixing it. Fault Analyzer is used to identify the cause of the abend. File Manager is used to correct an error in a VSAM application file.
Note: We wanted to perform all of the steps in this example and obtain the screen shots at the same time. In reality, the process of writing this section took several days. As a result, there are discrepancies with the dates and times in some of the figures. These are not deliberate errors, and they are not meant to mislead you.
138 Introduction to the IBM Problem Determination Tools

In this example, you attempt to obtain the real-time quotes of IBM for the customer, RB_DEMO. After you select Option 1 on the Options menu of CICS Trader application and press Enter, the application abends. The CICS-issued transaction abend message is shown in Figure 7-7.
Figure 7-7 Trader application abend on the Options screen
7.3.1 Viewing the abend in Fault AnalyzerYou use Fault Analyzer to conduct the analysis of the abend.
1. Access Fault Analyzer in your ISPF session.
The fault history file is displayed, as shown in Figure 7-8.
Chapter 7. Scenario 1: Using Fault Analyzer and File Manager 139
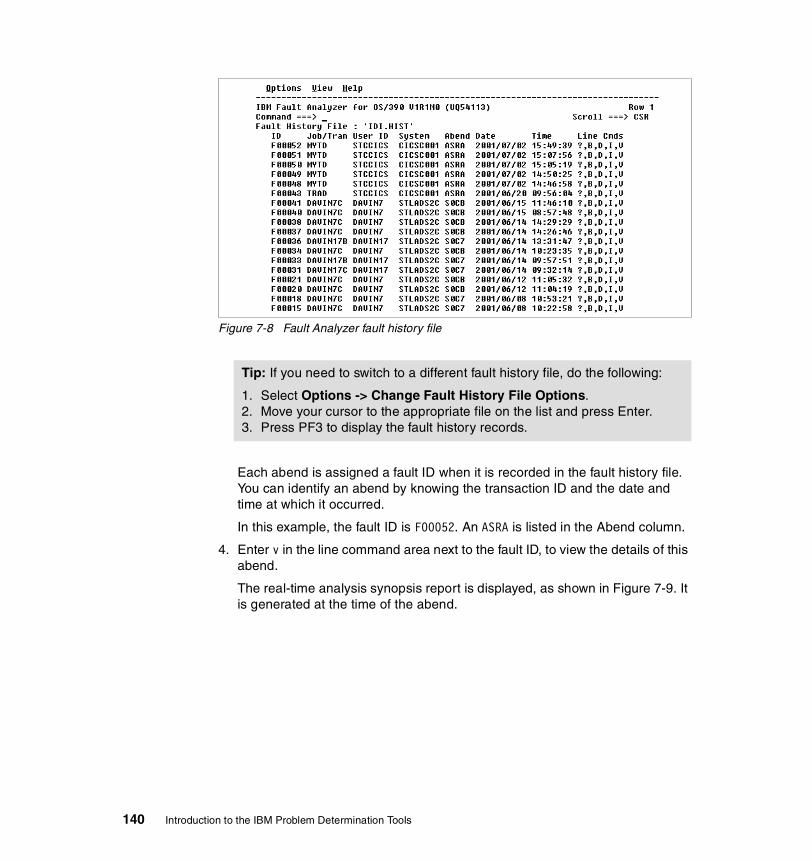
Figure 7-8 Fault Analyzer fault history file
Each abend is assigned a fault ID when it is recorded in the fault history file. You can identify an abend by knowing the transaction ID and the date and time at which it occurred.
In this example, the fault ID is F00052. An ASRA is listed in the Abend column.
4. Enter v in the line command area next to the fault ID, to view the details of this abend.
The real-time analysis synopsis report is displayed, as shown in Figure 7-9. It is generated at the time of the abend.
Tip: If you need to switch to a different fault history file, do the following:
1. Select Options -> Change Fault History File Options.2. Move your cursor to the appropriate file on the list and press Enter.3. Press PF3 to display the fault history records.
140 Introduction to the IBM Problem Determination Tools

Figure 7-9 Fault Analyzer real-time analysis report synopsis
5. Look more closely at the report in Figure 7-9. You can see:
a. Program MYTRADS experienced the abend.b. The detail of the abend; in this example it is a data exception.c. A short explanation of the abendd. An attempt to identify the instruction that caused the abend
The source statement cannot be identified because the compiler listing (or side file) for the program MYTRADS was not available to Fault Analyzer when the program abended.
Refer to Chapter 5, “Implementing the tools in your environment” on page 101, for a discussion about using side files in production and development environments.
7.3.2 Initiating interactive re-analysis for the abendYou must re-analyze the dump to identify the source statement in the program MYTRADS that caused the abend. This can be done in one of two ways:
� Interactive re-analysis
The abend is re-analyzed and the reports are displayed online in the ISPF session.
� Batch re-analysis
The abend is re-analyzed in a batch job and the reports can be viewed in the spool or can be directed to a data set. This does not tie up your ISPF session.
Chapter 7. Scenario 1: Using Fault Analyzer and File Manager 141
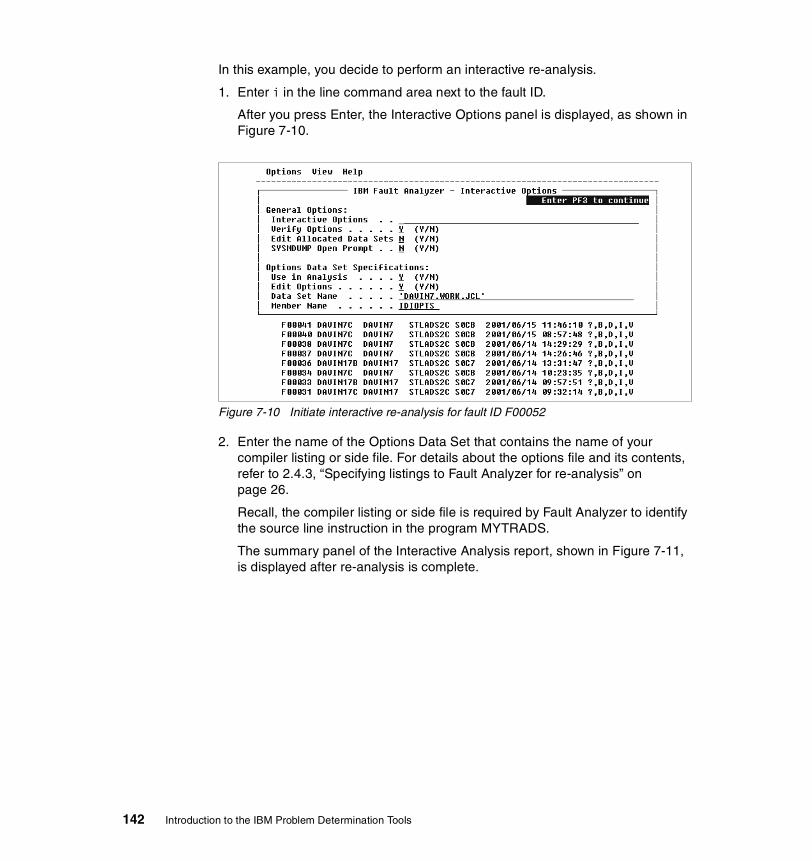
In this example, you decide to perform an interactive re-analysis.
1. Enter i in the line command area next to the fault ID.
After you press Enter, the Interactive Options panel is displayed, as shown in Figure 7-10.
Figure 7-10 Initiate interactive re-analysis for fault ID F00052
2. Enter the name of the Options Data Set that contains the name of your compiler listing or side file. For details about the options file and its contents, refer to 2.4.3, “Specifying listings to Fault Analyzer for re-analysis” on page 26.
Recall, the compiler listing or side file is required by Fault Analyzer to identify the source line instruction in the program MYTRADS.
The summary panel of the Interactive Analysis report, shown in Figure 7-11, is displayed after re-analysis is complete.
142 Introduction to the IBM Problem Determination Tools

Figure 7-11 Summary page Interactive Analysis report
3. Select 1 to view the Synopsis section.
The Synopsis section starts with the same description that is shown in the real-time analysis report that you obtained using the v line command.
4. Scroll to the bottom of this section to view the statement that caused the error.
The values of the variables at the time of the abend are also displayed, as shown in Figure 7-12.
Figure 7-12 Interactive Analysis Synopsis section displaying cause of error
5. You determine the cause of the error by looking at the values of the variables.
Chapter 7. Scenario 1: Using Fault Analyzer and File Manager 143

In this example, the problem is caused by invalid data. It is clearly indicated that the field DEC-NO-SHARES has an invalid value. This field is defined in WORKING-STORAGE as a packed decimal field, yet it contains numeric data in an invalid format.
6. Press PF3 to end from this panel and return to the Summary panel.
7. Select 2, Point-of-failure.
The Point of Failure section starts with a summary similar to the Synopsis section, but without the textual description.
8. Scroll down to the bottom of this section until you see the highlighted heading, Associated Storage Areas, as shown in Figure 7-13.
Figure 7-13 Interactive Analysis Point of Failure section
9. Place the cursor over the highlighted text and press Enter.
This displays a listing of the WORKING-STORAGE section of the program:
– The data definitions are shown on the left-hand side of the listing.
– The data values, in character format, start on the right-hand side of the listing.
– The data values, in hexadecimal format, are on the far right-hand side of the listing.
10.Issue the following command to find the field in error:
Find ‘DEC-NO-SHARE’
11.Scroll up until you find the level-01 group item that contains this field, as shown in Figure 7-14.
144 Introduction to the IBM Problem Determination Tools

Figure 7-14 Point of Failure section Associated Storage Areas
12.Split the ISPF screen and view this program’s (MYTRADS) compiler listing to find out how this level-01 group item is loaded with data values.
Note: If you did not retain a compiler listing as output from the batch compile, refer to the source code directly.
In this example, CUSTOMER-IO-BUFFER is loaded from a CICS READ INTO statement as shown in Figure 7-15.
Figure 7-15 Compiler listing showing CUSTOMER-IO-BUFFER being loaded
13.Swap back to the Fault Analyzer panel.
Chapter 7. Scenario 1: Using Fault Analyzer and File Manager 145

14.The key of the record in the VSAM file is displayed in the Associated Storage Areas panel. It contains the customer name and the company name.
15.Find the key field of the record, then locate the value in the data buffer.
You may have to scroll to the right to see the entire value.
In this example, the values are RB_DEMO and IBM.
Now that you have determined the problem is with data in the CUSTFILE, you can correct the error with the help of File Manager.
7.3.3 Using File Manager to correct a problem with dataYou use File Manager to correct the invalid data in the application file:
1. Access File Manager in your ISPF session.
2. Go to Data Set Edit (Option 2).
3. Enter the VSAM Data set name and the Copybook Data set name, as shown in Figure 7-16.
Figure 7-16 File Manager Edit Entry panel
Note: You must disable and close the CUSTFILE in the CICS region before you attempt to edit it. If you do not, File Manager will display the following error message when you edit the file:
VSAM OPEN RC X'08', Error Code X'A8
146 Introduction to the IBM Problem Determination Tools
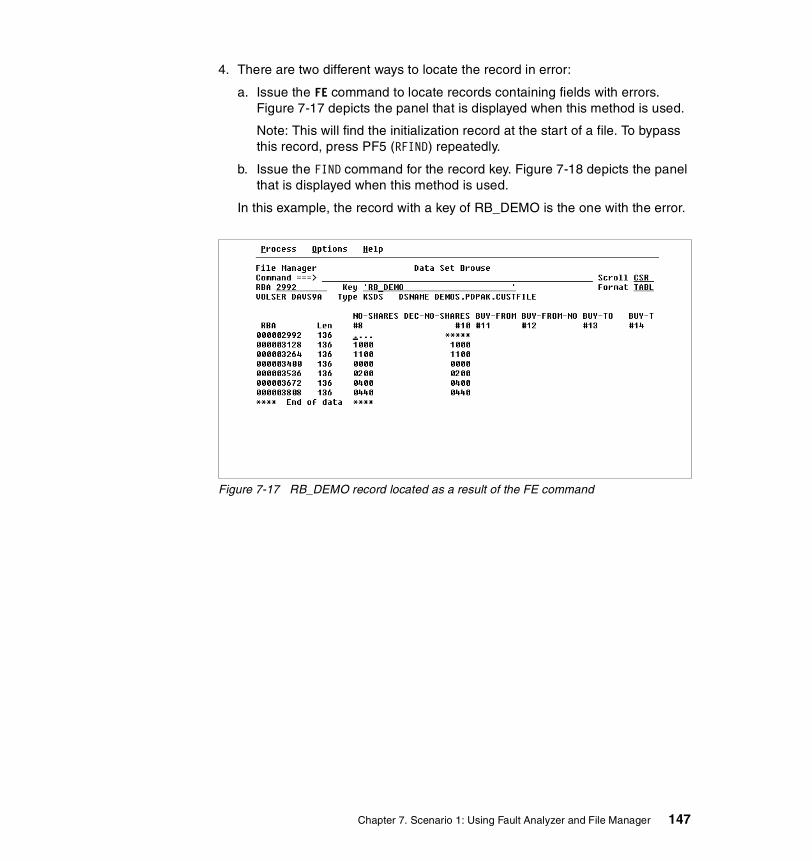
4. There are two different ways to locate the record in error:
a. Issue the FE command to locate records containing fields with errors. Figure 7-17 depicts the panel that is displayed when this method is used.
Note: This will find the initialization record at the start of a file. To bypass this record, press PF5 (RFIND) repeatedly.
b. Issue the FIND command for the record key. Figure 7-18 depicts the panel that is displayed when this method is used.
In this example, the record with a key of RB_DEMO is the one with the error.
Figure 7-17 RB_DEMO record located as a result of the FE command
Chapter 7. Scenario 1: Using Fault Analyzer and File Manager 147
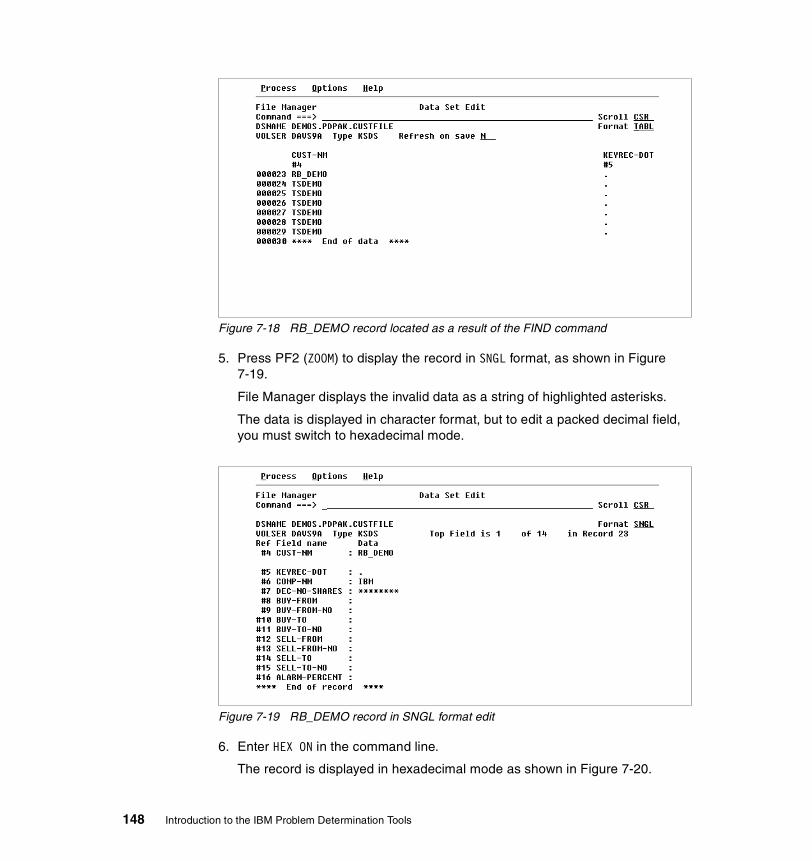
Figure 7-18 RB_DEMO record located as a result of the FIND command
5. Press PF2 (ZOOM) to display the record in SNGL format, as shown in Figure 7-19.
File Manager displays the invalid data as a string of highlighted asterisks.
The data is displayed in character format, but to edit a packed decimal field, you must switch to hexadecimal mode.
Figure 7-19 RB_DEMO record in SNGL format edit
6. Enter HEX ON in the command line.
The record is displayed in hexadecimal mode as shown in Figure 7-20.
148 Introduction to the IBM Problem Determination Tools
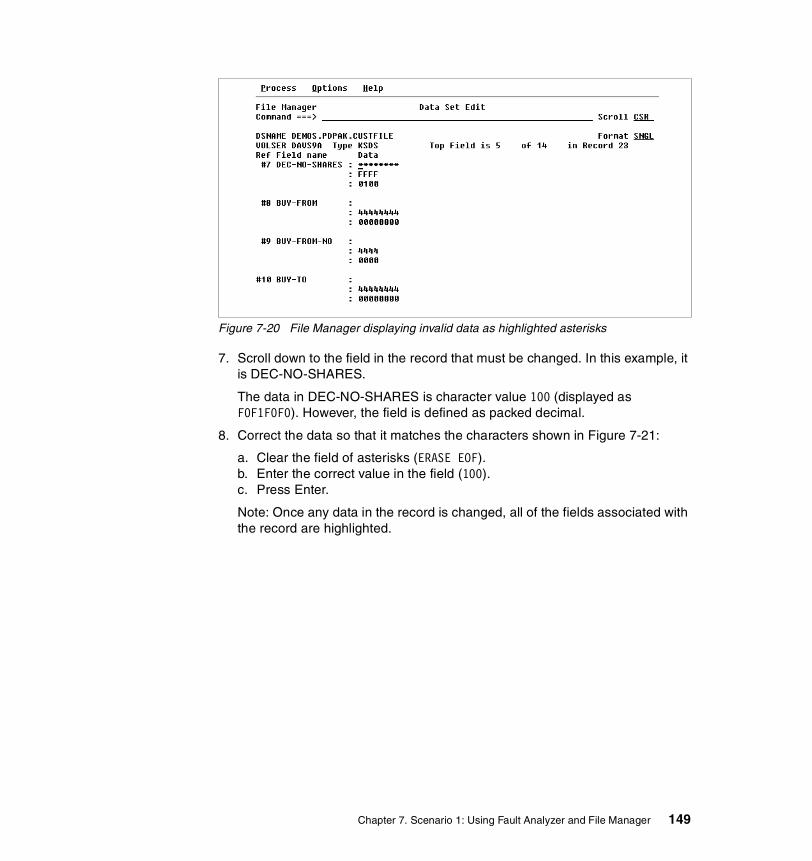
Figure 7-20 File Manager displaying invalid data as highlighted asterisks
7. Scroll down to the field in the record that must be changed. In this example, it is DEC-NO-SHARES.
The data in DEC-NO-SHARES is character value 100 (displayed as F0F1F0F0). However, the field is defined as packed decimal.
8. Correct the data so that it matches the characters shown in Figure 7-21:
a. Clear the field of asterisks (ERASE EOF).b. Enter the correct value in the field (100).c. Press Enter.
Note: Once any data in the record is changed, all of the fields associated with the record are highlighted.
Chapter 7. Scenario 1: Using Fault Analyzer and File Manager 149

Figure 7-21 File Manager displaying corrected data as highlighted fields
9. Enter HEX OFF in the command line to return the fields to character format.
10.Press PF3 to save the changes and to end from the Edit session.
7.3.4 Running the application after the fixYou finished correcting the invalid data in the CUSTFILE, now access the Trader application in CICS.
Obtain a real-time quote in IBM for customer RB_DEMO.
This results in a successful execution, and the screen shown in Figure 7-22 is displayed.
Note: Do not forget to enable and open the CUSTFILE in the CICS region.
150 Introduction to the IBM Problem Determination Tools
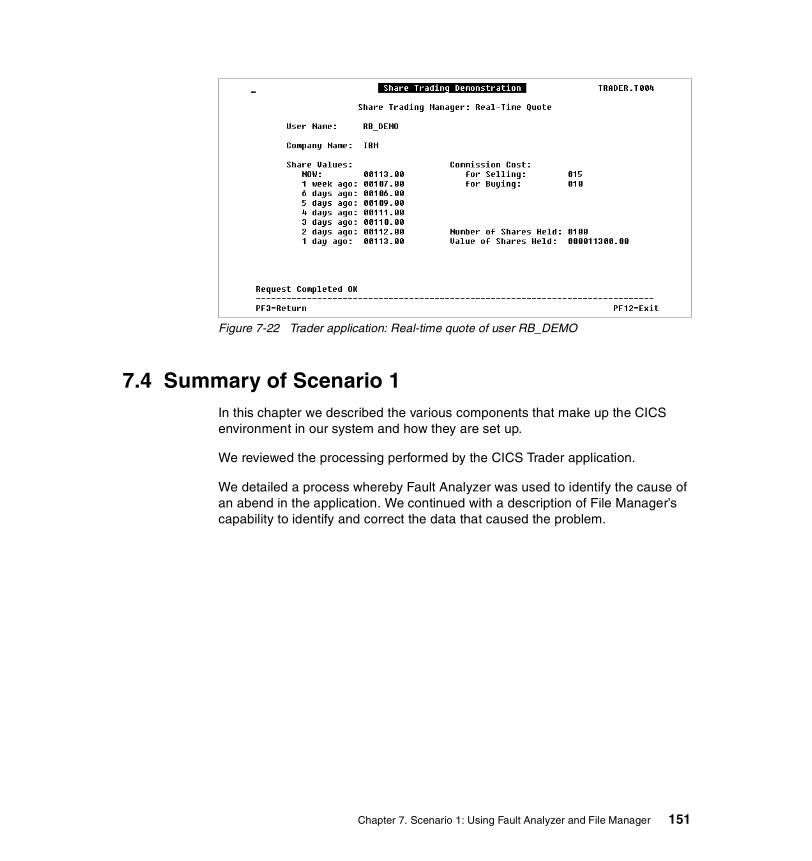
Figure 7-22 Trader application: Real-time quote of user RB_DEMO
7.4 Summary of Scenario 1In this chapter we described the various components that make up the CICS environment in our system and how they are set up.
We reviewed the processing performed by the CICS Trader application.
We detailed a process whereby Fault Analyzer was used to identify the cause of an abend in the application. We continued with a description of File Manager’s capability to identify and correct the data that caused the problem.
Chapter 7. Scenario 1: Using Fault Analyzer and File Manager 151

152 Introduction to the IBM Problem Determination Tools

Chapter 8. Scenario 2: Using Debug Tool
In this chapter we describe the application components that exist in the batch environment in our system and how they are set up.
We explain the processing that is performed in the batch Trader application.
We force the application to produce incorrect output and describe, in detail, the steps needed to identify the logic error in the application, using Debug Tool in batch mode. We then describe how to step through the program to isolate and to correct the problem, using Debug Tool in foreground mode.
8
© Copyright IBM Corp. 2002 153

8.1 Set up the componentsTwo types of components need to be established for this scenario:
� Batch components� Program products
– Debug Tool
8.1.1 Batch componentsComponents used by the Trader application are listed in Table 8-1. The data sets and member names of the application programs, the copybooks, and the JCL for compiling the programs are listed in Appendix A, “Components of the Trader application” on page 205.
Table 8-1 Batch components of the Trader application for scenario 2
8.1.2 Program productsTo use the Problem Determination Tools with this scenario, please make sure you have the following output or supporting files for the following product:
Debug ToolYou must have a compiler listing or side file for the program TRADERB.
� If you are not using the supplied batch job to compile this program, make sure you specify the following compiler options:
LIST,XREF,MAP,RENT,TEST
If you prefer to use a side file instead of a compiler listing, include the SEPARATE sub-option of the TEST compiler option. Recall the side file required by Debug Tool is different from the one required by Fault Analyzer. See 4.2.3, “Required output files” on page 79 for more details.
Component Details Remarks
Program TRADERB Batch COBOL program
JCL TRADER JCL to run the batch application
Files DEMOS.PDPAK.CUSTFILEDEMOS.PDPAK.COMPFILEDEMOS.PDPAK.TRANFILE
VSAM files and sequential transaction file used by the application
Copybooks CUSTFILECOMPFILETRANFILE
File definition for Customer file, Company file, and Transaction file
154 Introduction to the IBM Problem Determination Tools

Make sure you run the DEFVSAM1 batch job to load the VSAM files. Refer to 6.2.3, “Set up the applications” on page 124.
8.2 Walkthrough of the batch Trader applicationThe batch Trader application is used to maintain stock portfolios held by individuals. You execute a batch job that processes a day’s worth of trading activity, which:
� Lists portfolios and their value� Buys shares of a company’s stock� Sells shares of a company’s stock
8.2.1 The Trader batch jobThe batch job that executes the Trader application is shown in Example 8-1.
Example 8-1 JCL to run the batch Trader application
//DAVIN7CR JOB (123,A,TESTING,’RED BOOK’),’ENHANCE’,// CLASS=A,MSGCLASS=H,MSGLEVEL=(1,1),// REGION=32M,NOTIFY=&SYSUID//********************************************************************//* LICENSED MATERIALS - PROPERTY OF IBM *//* 5655-ADS (C) COPYRIGHT IBM CORP. 2001 *//* ALL RIGHTS RESERVED *//********************************************************************//GO EXEC PGM=TRADERB//STEPLIB DD DISP=SHR,DSN=DAVIN7.PDPAK.LOAD//SYSPRINT DD SYSOUT=*//SYSABEND DD SYSOUT=*//COMPFILE DD DISP=SHR,DSN=DAVIN6.PDPAK.COMPFILE//CUSTFILE DD DISP=SHR,DSN=DAVIN6.PDPAK.CUSTFILE//TRANSACT DD DISP=SHR,DSN=DAVIN7.PDPAK.TRANFILE//REPOUT DD SYSOUT=*//TRANREP DD SYSOUT=*
Note: This example was designed to demonstrate the capabilities of the Problem Determination Tools. Therefore, a minimal amount of code was developed. This application does not represent real-world securities processing.
Chapter 8. Scenario 2: Using Debug Tool 155

The job invokes program TRADERB, which reads a sequential file (TRANSACT) to obtain the day’s transactions. The program processes each of the records in this file. While it does this, the program reads the Company file (COMPFILE) and reads and updates the Customer file (CUSTFILE).
After the program processes the input file, it generates two output reports:
� REPOUT, which contains a list of all customer portfolios.
� TRANREP, which contains a detailed list of the transaction activity and processing status.
8.2.2 The Transaction fileThe Transaction file is an 80-byte, sequential file that is input to the Trader application. It can contain three types of requests:
� List shares� Buy shares� Sell shares
Example 8-2, depicts typical records in the Transaction file.
Example 8-2 Batch Trader application Transaction file
----+----1----+----2----+----3----+----4----+----5----+----6----+----7----+----12345RB_DEMO .IBM BUY_SELL 0030112345RB_DEMO .Veck_Transport BUY_SELL 0025112345RB_DEMO SHARE_VALUE
The record layout for the Transaction file is shown in Table 8-2.
Table 8-2 Transaction file record layout
Column Description Field name
1-5 Account number TR-ACCOUNT-NUMBER
6-35 Customer name TR-CUSTOMER-NAME
36 Dot FILLER
37-51 Company name TR-COMPANY-NAME
52-71 Request type TR-REQUEST-TYPE
72-75 Number of shares (for Buy or Sell requests)
TR-NO-OF-SHARES
76 Transaction type (for Buy or Sell requests)
TR-SUBTYPE
156 Introduction to the IBM Problem Determination Tools

After the program, TRADERB, reads each record, it examines the TR-REQUEST-TYPE field to determine the type of processing to perform.
8.2.3 Listing sharesIf the field, TR-REQUEST-TYPE, contains the value, SHARE_VALUE, the program uses the value in the TR-CUSTOMER-NAME field to print a report that lists the shares held by that customer for each company he or she owns.
A typical report is shown in Example 8-3.
Example 8-3 Batch Trader application List Shares report
CUSTOMER : RB_DEMO 07/07/2001 ----------------------------------------------------------------- COMPANY SHARES SHARE TOTAL HELD VALUE COST----------------------------------------------------------------- Glass_and_Luget_plc 60 19.00 1,140.00 IBM 60 113.00 6,780.00 Veck_Transport 35 36.00 1,260.00
8.2.4 Buying sharesIf the field, TR-REQUEST-TYPE, contains the value, BUY_SELL, and the field, TR-SUB-TYPE, contains a value of 1, the program processes a request to buy the number of shares in TR-NO-OF-SHARES.
After the process completes successfully, the program updates the Customer file, DEMOS.PDPAK.CUSTFILE.
The program also produces a Transaction report, as shown in Example 8-4. This report lists the transaction file input request and the status of the processing. The STATUS column in the report lists how the request was processed. If the processing is successful, the message PROCESSED is printed, otherwise the message *ERROR* is printed.
Example 8-4 Batch Trader application Transaction report listing BUY shares
-------------------------------------------------------------------------------CUSTOMER COMPANY QTY REQ-TYP STATUS-------------------------------------------------------------------------------RB_DEMO IBM 30 BUY PROCESS
77-80 Blank FILLER
Column Description Field name
Chapter 8. Scenario 2: Using Debug Tool 157

RB_DEMO Veck_Transport 25 BUY PROCESS
8.2.5 Selling sharesIf the field, TR-REQUEST-TYPE, contains the value, BUY_SELL, and the field, TR-SUB-TYPE, contains a value of 2, the program processes a request to sell the number of shares in TR-NO-OF-SHARES.
After the process completes successfully, the program updates the Customer file, DEMOS.PDPAK.CUSTFILE.
The program also produces a Transaction report, as shown in Example 8-5. This report lists the transaction file input request and the status of the processing. The STATUS column in the report lists how the request was processed. If the processing is successful, the message PROCESSED is printed, otherwise the message *ERROR* is printed.
Example 8-5 Batch Trader application Transaction report listing SELL shares
-------------------------------------------------------------------------------CUSTOMER COMPANY QTY REQ-TYP STATUS-------------------------------------------------------------------------------RB_DEMO IBM 30 SELL PROCESSRB_DEMO Veck_Transport 25 SELL PROCESS
8.3 Tracking a problem with the applicationTo demonstrate the capabilities of the Problem Determination Tools, we force the application to encounter an error. Your business user tells you about a problem with the output that is in one of the reports. You step through the process of fixing it, and use Debug Tool — in batch and foreground mode — to first identify and then to isolate a problem in the application program logic.
In this example, you have a Transaction file that contains the day’s trading activity for the customer, RB_DEMO:
� Buy 30 shares of IBM.� Buy 25 shares of Veck_Transport.� List the shares held by RB_DEMO.
158 Introduction to the IBM Problem Determination Tools
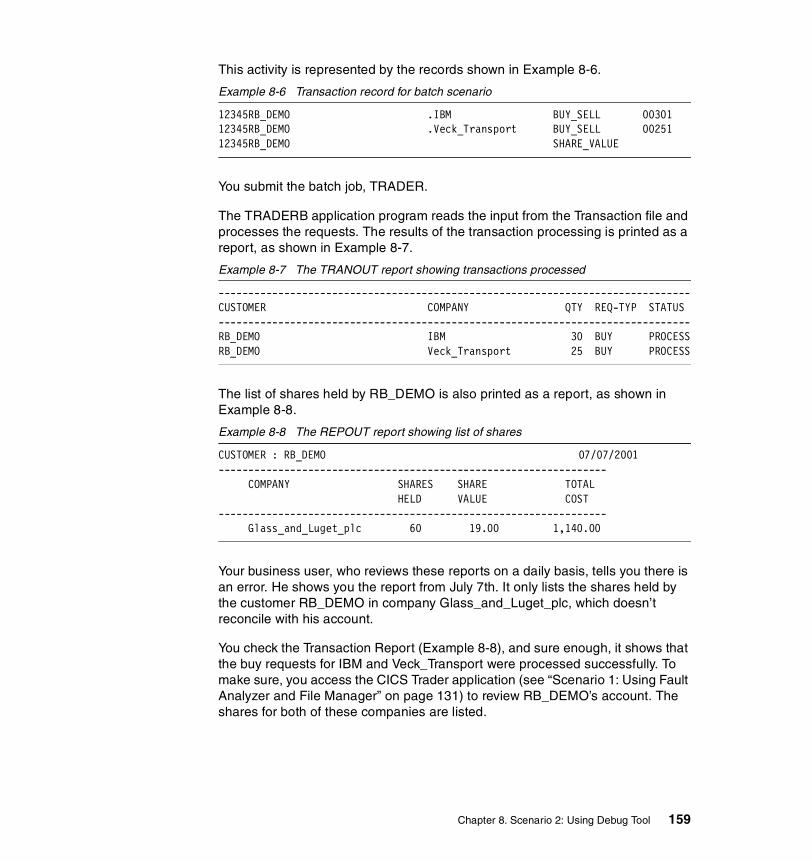
This activity is represented by the records shown in Example 8-6.
Example 8-6 Transaction record for batch scenario
12345RB_DEMO .IBM BUY_SELL 0030112345RB_DEMO .Veck_Transport BUY_SELL 0025112345RB_DEMO SHARE_VALUE
You submit the batch job, TRADER.
The TRADERB application program reads the input from the Transaction file and processes the requests. The results of the transaction processing is printed as a report, as shown in Example 8-7.
Example 8-7 The TRANOUT report showing transactions processed
-------------------------------------------------------------------------------CUSTOMER COMPANY QTY REQ-TYP STATUS-------------------------------------------------------------------------------RB_DEMO IBM 30 BUY PROCESSRB_DEMO Veck_Transport 25 BUY PROCESS
The list of shares held by RB_DEMO is also printed as a report, as shown in Example 8-8.
Example 8-8 The REPOUT report showing list of shares
CUSTOMER : RB_DEMO 07/07/2001 ----------------------------------------------------------------- COMPANY SHARES SHARE TOTAL HELD VALUE COST----------------------------------------------------------------- Glass_and_Luget_plc 60 19.00 1,140.00
Your business user, who reviews these reports on a daily basis, tells you there is an error. He shows you the report from July 7th. It only lists the shares held by the customer RB_DEMO in company Glass_and_Luget_plc, which doesn’t reconcile with his account.
You check the Transaction Report (Example 8-8), and sure enough, it shows that the buy requests for IBM and Veck_Transport were processed successfully. To make sure, you access the CICS Trader application (see “Scenario 1: Using Fault Analyzer and File Manager” on page 131) to review RB_DEMO’s account. The shares for both of these companies are listed.
Chapter 8. Scenario 2: Using Debug Tool 159

You can see there is a problem printing all of the shares held by a customer. You know from experience it has something to do with the program logic, because the buy requests have been processed successfully, and two new records have been written to customer file for RB_DEMO.
You decide to investigate further and use Debug Tool.
8.3.1 Using Debug Tool in batch mode to try to find the errorYou figure that you will use Debug Tool to show you the flow of program so that you can find out where the program is experiencing the problem. You can do this by listing the paragraphs that are performed when the job executes.
To do this, you create a Commands file for Debug Tool commands, and instruct Debug Tool to use this file at the start of the debug session.
Setting up the Commands fileFor this example, you need to create a Commands file. This can be any fixed-block, 80-byte sequential file, or a member of a partitioned data set (PDS). Example 8-9 contains the commands to list the paragraphs that are performed when the program executes.
Example 8-9 Debug Tool commands to list paragraph names
AT GLOBAL LABEL PERFORM; LIST LINES %LINE; GO; END-PERFORM; GO; QUIT;
This routine requests a listing of the line number and name of each paragraph (label) in the program.
Running Debug Tool in batch modeYou also need to create a batch job to invoke Debug Tool to debug your program. The fastest way to do this is to modify the existing Trader batch job, as shown in Example 8-10.
You include the TEST runtime option and to point to your Commands file. The output from the Commands file will be directed to the JES spool (although it could also go to a sequential file).
160 Introduction to the IBM Problem Determination Tools

Note: All of the changes to the original batch job are depicted in boldfaced text.
Example 8-10 Batch job to run Debug Tool for quick problem identification
//DAVIN7CR JOB (123,A,TESTING,'RED HERE'),'ENHANCE',// CLASS=A,MSGCLASS=H,MSGLEVEL=(1,1),// REGION=32M,NOTIFY=&SYSUID//********************************************************************//* LICENSED MATERIALS - PROPERTY OF IBM *//* 5655-ADS (C) COPYRIGHT IBM CORP. 2001 *//* ALL RIGHTS RESERVED *//********************************************************************//GO EXEC PGM=TRADERB,// PARM='/TEST(,INSPIN,,)'//STEPLIB DD DISP=SHR,DSN=DAVIN7.PDPAK.LOAD// DD DISP=SHR,DSN=EQAW.V1R2M0.SEQAMOD//SYSPRINT DD SYSOUT=*//SYSABEND DD SYSOUT=*//COMPFILE DD DISP=SHR,DSN=DAVIN6.PDPAK.COMPFILE//CUSTFILE DD DISP=SHR,DSN=DAVIN6.PDPAK.CUSTFILE//TRANSACT DD DISP=SHR,DSN=DAVIN7.PDPAK.TRANFILE//REPOUT DD SYSOUT=*//TRANREP DD SYSOUT=*//*//INSPIN DD DISP=SHR,DSN=DAVIN7.DT.COMMANDS//INSPLOG DD SYSOUT=*,DCB=(LRECL=72,RECFM=FB)//*
Make the following changes to the JCL:
� Add a comma after the program name.
� Include a parameter that specifies overrides to runtime options, and include TEST and your Command file.
� Add the load library for Debug Tool to the STEPLIB concatenation (if it is not in LINKLIST).
� Add the DD statement INSPIN and use your Command file.
� Add the DD statement INSPLOG and use the JES spool for the Log file.
Submit this job. After the batch job completes, review the output of the Log file.
The contents of the Log fileDebug Tool lists each of the line numbers and paragraph names in the Log file, as shown in Example 8-11.
Chapter 8. Scenario 2: Using Debug Tool 161
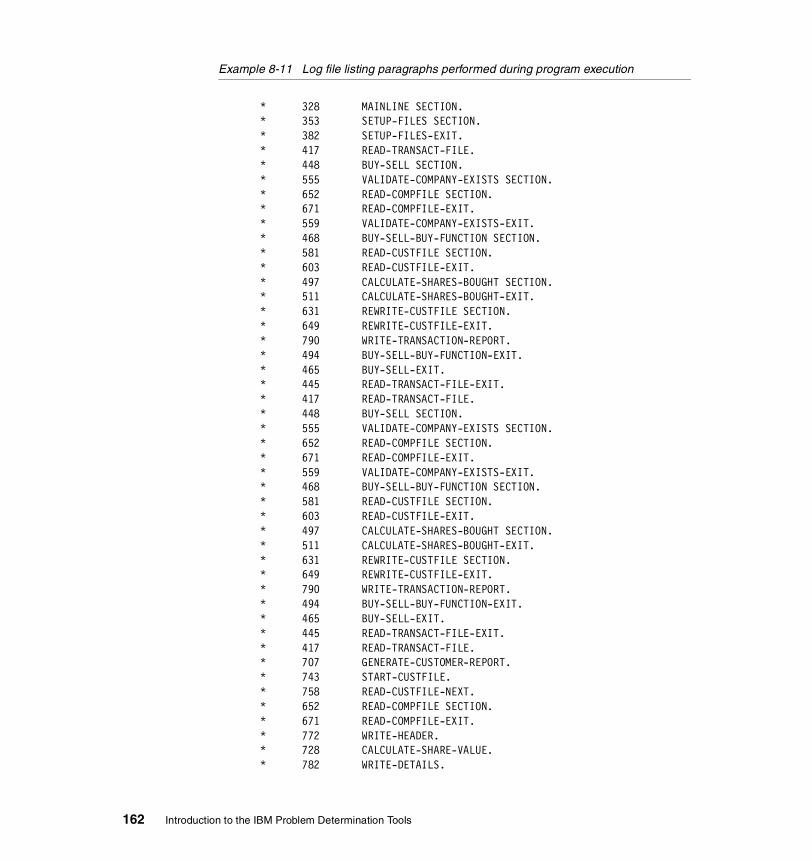
Example 8-11 Log file listing paragraphs performed during program execution
* 328 MAINLINE SECTION. * 353 SETUP-FILES SECTION. * 382 SETUP-FILES-EXIT. * 417 READ-TRANSACT-FILE. * 448 BUY-SELL SECTION. * 555 VALIDATE-COMPANY-EXISTS SECTION. * 652 READ-COMPFILE SECTION. * 671 READ-COMPFILE-EXIT. * 559 VALIDATE-COMPANY-EXISTS-EXIT. * 468 BUY-SELL-BUY-FUNCTION SECTION. * 581 READ-CUSTFILE SECTION. * 603 READ-CUSTFILE-EXIT. * 497 CALCULATE-SHARES-BOUGHT SECTION. * 511 CALCULATE-SHARES-BOUGHT-EXIT. * 631 REWRITE-CUSTFILE SECTION. * 649 REWRITE-CUSTFILE-EXIT. * 790 WRITE-TRANSACTION-REPORT. * 494 BUY-SELL-BUY-FUNCTION-EXIT. * 465 BUY-SELL-EXIT. * 445 READ-TRANSACT-FILE-EXIT. * 417 READ-TRANSACT-FILE. * 448 BUY-SELL SECTION. * 555 VALIDATE-COMPANY-EXISTS SECTION. * 652 READ-COMPFILE SECTION. * 671 READ-COMPFILE-EXIT. * 559 VALIDATE-COMPANY-EXISTS-EXIT. * 468 BUY-SELL-BUY-FUNCTION SECTION. * 581 READ-CUSTFILE SECTION. * 603 READ-CUSTFILE-EXIT. * 497 CALCULATE-SHARES-BOUGHT SECTION. * 511 CALCULATE-SHARES-BOUGHT-EXIT. * 631 REWRITE-CUSTFILE SECTION. * 649 REWRITE-CUSTFILE-EXIT. * 790 WRITE-TRANSACTION-REPORT. * 494 BUY-SELL-BUY-FUNCTION-EXIT. * 465 BUY-SELL-EXIT. * 445 READ-TRANSACT-FILE-EXIT. * 417 READ-TRANSACT-FILE. * 707 GENERATE-CUSTOMER-REPORT. * 743 START-CUSTFILE. * 758 READ-CUSTFILE-NEXT. * 652 READ-COMPFILE SECTION. * 671 READ-COMPFILE-EXIT. * 772 WRITE-HEADER. * 728 CALCULATE-SHARE-VALUE. * 782 WRITE-DETAILS.
162 Introduction to the IBM Problem Determination Tools

* 758 READ-CUSTFILE-NEXT. * 652 READ-COMPFILE SECTION. * 671 READ-COMPFILE-EXIT. * 726 GENERATE-CUSTOMER-REPORT-EXIT. * 445 READ-TRANSACT-FILE-EXIT. * 417 READ-TRANSACT-FILE. * 445 READ-TRANSACT-FILE-EXIT. * 385 CLOSEDOWN-FILES SECTION. * 414 CLOSEDOWN-FILES-EXIT. * 417 READ-TRANSACT-FILE. * 445 READ-TRANSACT-FILE-EXIT.
Review the program’s processing along with the Log fileYou review what TRADERB is designed to do to try and isolate the problem.
You recall that the Customer file has one record for every company in which the customer holds shares.
When a transaction to list shares is processed, the program starts to read the Customer file. It reads the records one at a time and prints the details, until the record of a different customer is read.
You review the Transaction file and see the two transactions. You realize that it does not matter if RB_DEMO had no shares in IBM and Veck_Transport before the Trader batch job executed, because two records were written to the Customer file when the program processed these records. One was for IBM and another was for Veck_Transport.
You recognize that when TRADERB processes the record in the Transaction file to list the shares held by RB_DEMO, the paragraph READ-CUSTFILE-NEXT should be executed at least four times (one read past the current Customer record).
You look carefully at the Log file, which shows that READ-CUSTFILE-NEXT is only executed twice. This proves to you there is a problem with the logic in the section of the program that reads the Customer file.
8.3.2 Using Debug Tool in foreground to pin-point the solutionBefore starting a foreground debugging session, make sure the following are allocated to your TSO session:
� The Debug Tool load library
In our system, this is EQAW.V1R2M0.SEQAMOD.
� The files used by the batch Trader application
Chapter 8. Scenario 2: Using Debug Tool 163

These are the same as the ones used in the batch job, TRADER, with one exception. You are going to have only one record in the Transaction file to list the shares held by customer RB_DEMO.
� A Log file and a Commands file (to be used in the debug session)
You can use the ones you created for the batch invocation of Debug Tool.
Setting up a REXX execFor this example, you build a REXX exec called DAVIN7.DT.EXEC(TRADERB). Example 8-12 contains the TSO commands to allocate the files to your session.
Example 8-12 REXX exec to allocate files needed for debugging session
/* Rexx */ADDRESS TSO“ALLOC FI(SEQAMOD) DA(‘EQAW.V1R2M0.SEQAMOD’) SHR REU”“ALLOC FI(INSPLOG) DA(‘DAVIN7.DT.LOG.PS’) SHR REU”“ALLOC FI(MYCOMMD) DA(‘DAVIN7.DT.COMMANDS’) SHR REU”/* */“ALLOC FI(TRANSACT) DA(‘DAVIN7.PDPAK.TRANFILE’) SHR REU”“ALLOC FI(CUSTFILE) DA(‘DAVIN6.PDPAK.CUSTFILE’) SHR REU”“ALLOC FI(COMPFILE) DA(‘DAVIN6.PDPAK.COMPFILE’) SHR REU”“ALLOC FI(REPOUT) DA(*)”“ALLOC FI(TRANREP) DA(*)”“ALLOC FI(INQREP) DA(*)”
Start your debugging session:
1. Exit ISPF and get to READY mode.
2. Issue the following command to execute your REXX exec:
EX ‘DAVIN7.DT.EXEC(TRADERB)’
3. Issue the following command to attach the Debug Tool load library to your session:
TSOLIB ACTIVATE FILE(SEQAMOD)
4. Start Debug Tool by invoking the program TRADERB with the TEST runtime option:
CALL ‘DAVIN7.PDPAK.LOAD(TRADERB)’ ‘/TEST’
Debug Tool starts, with the first line of your program shown in the Source window, as shown in Figure 8-1.
164 Introduction to the IBM Problem Determination Tools

Figure 8-1 Debug Tool at the start of program TRADERB
Because you determined the problem occurs when reading the Customer file; you decide to set a breakpoint when the START command is issued on the Customer file.
5. Enter the string, “START-CUSTFILE” (in double quotes), on the command line and press PF5 (FIND).
This finds the first occurrence of the string START-CUSTFILE. The cursor is positioned on that line, as shown in Figure 8-2.
Figure 8-2 Debug Tool with a breakpoint set at START-CUSTFILE
Chapter 8. Scenario 2: Using Debug Tool 165

6. Press PF6.
This sets the breakpoint on that line (line 708).
7. Press PF9 to issue the GO command.
The program executes and stops at line 708, PERFORM START-CUSTFILE, before it is executed.
8. You review the code within the current paragraph and note the following:
a. Line 711 contains the instruction, PERFORM READ-CUSTFILE-NEXT.
b. There is a MOVE statement that uses two variables, KEYREC and WS-CUST-KEY.
You want to see what happens to the values in these fields (KEYREC and WS-CUST-KEY) when the Customer file is read.
9. Enter the following command on the command line:
MONITOR LIST (KEYREC, WS-CUST-KEY);
The values of these variables is displayed in the Monitor window, as shown in Figure 8-3.
Figure 8-3 Monitor window displaying values of WORKING-STORAGE variables
10.Press PF2 to step through the program one statement at a time.
Tip: If you already know the line number, you can set the breakpoint by entering the command explicitly on the command line:
AT 708;
166 Introduction to the IBM Problem Determination Tools
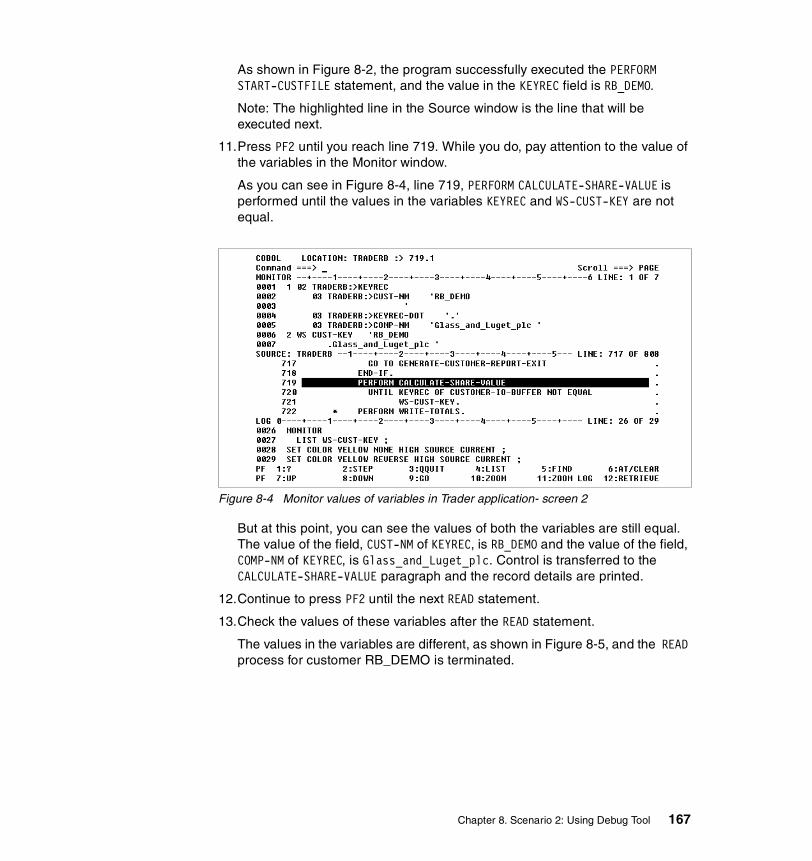
As shown in Figure 8-2, the program successfully executed the PERFORM START-CUSTFILE statement, and the value in the KEYREC field is RB_DEMO.
Note: The highlighted line in the Source window is the line that will be executed next.
11.Press PF2 until you reach line 719. While you do, pay attention to the value of the variables in the Monitor window.
As you can see in Figure 8-4, line 719, PERFORM CALCULATE-SHARE-VALUE is performed until the values in the variables KEYREC and WS-CUST-KEY are not equal.
Figure 8-4 Monitor values of variables in Trader application- screen 2
But at this point, you can see the values of both the variables are still equal. The value of the field, CUST-NM of KEYREC, is RB_DEMO and the value of the field, COMP-NM of KEYREC, is Glass_and_Luget_plc. Control is transferred to the CALCULATE-SHARE-VALUE paragraph and the record details are printed.
12.Continue to press PF2 until the next READ statement.
13.Check the values of these variables after the READ statement.
The values in the variables are different, as shown in Figure 8-5, and the READ process for customer RB_DEMO is terminated.
Chapter 8. Scenario 2: Using Debug Tool 167

Figure 8-5 Monitor values of variables in Trader application- screen 3
You can see that the record is for RB_DEMO, because the field CUST-NM of KEYREC has that value.
But the key value, KEYREC, is different from WS-CUST-KEY because the field COMP-NM of KEYREC has a new value, IBM, and the variable WS-CUST-KEY still has the old value.
Because these values are different, control is not transferred to the CALCULATE_SHARE-VALUE paragraph, as shown in Figure 8-6, and the READ process for this customer is terminated.
Figure 8-6 Monitor values of variables in Trader application, Screen 4
168 Introduction to the IBM Problem Determination Tools

14.Enter the QQUIT command on the command line to end the session.
You found that saving the value of the previously read key value of the Customer record and checking it with key value immediately after the next read is causing the problem.
Because the customer has one record for every company in which he holds shares, the program logic must be changed to check only the CUST-NM of KEYREC. Saving the CUST-NM field of KEYREC and checking it just after a READ NEXT should solve the problem.
The two changes you make to the program are:
Before (line 712)MOVE KEYREC OF CUSTOMER-IO-BUFFER TO WS-CUST-KEY
AfterMOVE CUST-NM OF CUSTOMER-IO-BUFFER TO WS-CUST-NM
Before (line 719)PERFORM CALCULATE-SHARE-VALUE UNTIL KEYREC OF CUSTOMER-IO-BUFFER NOT EQUAL WS-CUST-KEY.
AfterPERFORM CALCULATE-SHARE-VALUE
UNTIL CUST-NM OF CUSTOMER-IO-BUFFER NOT EQUAL WS-CUST-NM.
8.3.3 Executing the batch application after the fixYou finish correcting the program logic in TRADERB and you recompile the program.
You submit the batch job TRADER.
This results in a successful execution, and the report shown in Example 8-13 is displayed.
Example 8-13 Successful output of TRADERB following program changes
CUSTOMER : RB_DEMO 07/07/2001 ----------------------------------------------------------------- COMPANY SHARES SHARE TOTAL HELD VALUE COST----------------------------------------------------------------- Glass_and_Luget_plc 60 19.00 1,140.00 IBM 60 113.00 6,780.00
Chapter 8. Scenario 2: Using Debug Tool 169

Veck_Transport 35 36.00 1,260.00
8.4 Summary of Scenario 2In this chapter we described the various components that make up the batch environment in our system and how they are set up.
We reviewed the processing performed by the batch Trader application.
We detailed a process which used Debug Tool in batch mode to identify a possible problem in the application. We continued with a description of Debug Tool’s capability in foreground mode to pin-point an error to allow it to be corrected.
170 Introduction to the IBM Problem Determination Tools
Chapter 9. Scenario 3: Using File Manager/DB2 and Debug Tool
In this chapter we describe the application components that exist in the CICS and DB2 environments in our system and how they are set up.
We explain the processing that is performed in the CICS DB2 Trader application.
We force the application to encounter an error and describe, in detail, the steps needed to identify the cause of the problem in the application, using Debug Tool. We then describe how to manipulate the data to correct the problem, using File Manager/DB2.
9
© Copyright IBM Corp. 2002 171

9.1 Set up the componentsTwo sets of components need to be established for this scenario:
� CICS and DB2 components� Program products:
– Debug Tool– File Manager/DB2
9.1.1 CICS and DB2 componentsComponents used by the Trader application are listed in Table 9-1. The data sets and member names of the application programs, the copybooks, and the JCL for compiling the programs are listed in Appendix A, “Components of the Trader application” on page 205.
Table 9-1 CICS and DB2 components of the Trader application for scenario 3
9.1.2 Program productsTo use the Problem Determination Tools, please make sure that you have the following for each product:
Debug ToolYou must have a compiler listing or side file for the programs MYTRADMD and MYTRADD.
� If you are not using the supplied batch jobs to compile these programs, make sure you specify the following compiler options:
LIST,XREF,MAP,RENT,TEST
� You must also include the load module EQADCCXT in the link-edit step of the compile job.
Component Details Remarks
Programs MYTRADMDMYTRADD
CICS DB2 COBOL programs
Tran ID TDB2 CICS transaction associated with the program, MYTRADMD
Mapset NEWTRAD BMS mapset containing all the maps used by the application
Tables CUSTOMER_DETAILSCOMPANY_DETAILS
DB2 tables used by the application
172 Introduction to the IBM Problem Determination Tools

If you prefer to use a side file instead of a compiler listing, include the SEPARATE sub-option of the TEST compiler option. Recall the side file required by Debug Tool is different from the one required by Fault Analyzer. See 4.2.3, “Required output files” on page 79.
File Manager/DB2You need the dynamically created templates for the DB2 tables CUSTOMER_DETAILS and COMPANY_DETAILS
Make sure you run the TABLES batch job to create the DB2 tables, and then run the DATA batch job to load the DB2 tables. Refer to 6.2.3, “Set up the applications” on page 124.
9.2 Walkthrough of the Trader applicationThe CICS DB2 Trader application is used to maintain a stock portfolio held by an individual. This application enables you to:
� Obtain quotes� Buy more shares of a company’s stock� Sell currently held shares of a company’s stock
There is no visual difference between this example and the one presented in “Scenario 1: Using Fault Analyzer and File Manager” on page 131. Only the back-end processing is different. This scenario uses DB2 tables instead of VSAM files. Figure 9-1 depicts the processing that occurs in the CICS DB2 application.
Note: This example was designed to demonstrate the capabilities of the Problem Determination Tools. Therefore, a minimal amount of code was developed. This application does not represent real-world securities processing.
Chapter 9. Scenario 3: Using File Manager/DB2 and Debug Tool 173

Figure 9-1 Trader application: single user transaction CICS with DB2
9.3 Tracking a problem in the applicationTo demonstrate the capabilities of the Problem Determination Tools, we force the application to encounter an error. The Trader Customer Service Representative (Deanna Polm) tells you about a problem with a customer account following a series of transactions. You step through the process of fixing it using File Manager/DB2 and Debug Tool to first identify and then to isolate and fix the problem in the application program.
9.3.1 Recreating the errorIn this example, you invoke the Trader application and perform the following actions for the customer, RB_DEMO, using IBM as the company in which shares are traded:
1. Launch the Trader application.2. Select IBM as the company you want to trade.3. Select Option 3 on the Options screen.4. On the Shares-Sell screen (shown in Figure 9-2), sell 10 shares.
The Options screen is re-displayed with the message, Request Completed OK.
MYTRADMD
DB2 Table
MYTRADD
DB2 Table
Customer Company
CICS
174 Introduction to the IBM Problem Determination Tools

Figure 9-2 Recreating a problem in the Trader application Part 1
5. Select Option 1 on the Options screen to obtain real-time quotes and a listing of the shares held.
The share details are listed, as shown in Figure 9-3. Note the Number of Shares Held field has a value of 5.
Figure 9-3 Recreating a problem in the Trader application Part 2
6. Press PF3 to return to the Options screen.
7. Select Option 2 and buy 5 shares.
The Options screen is re-displayed with the message, Request Completed OK.
Chapter 9. Scenario 3: Using File Manager/DB2 and Debug Tool 175

8. Once again, select Option 1, and review the Number of Shares Held. Figure 9-4 shows this value as 0.
Figure 9-4 Recreating a problem in the Trader application part 3
Clearly, Deanna has pointed out a serious problem with this series of transactions.
You believe the problem is with the data in the table, CUSTOMER_DETAILS, or in the program that reads the table.
You decide to look first at the specific customer record in the database to see if that will help you understand more about the problem.
9.3.2 Viewing the data in File Manager/DB2The following steps allow you to view data:
9. Access File Manager/DB2 in your ISPF session.
The File Manager/DB2 Primary Option Menu is displayed, as shown in Figure 9-5.
176 Introduction to the IBM Problem Determination Tools
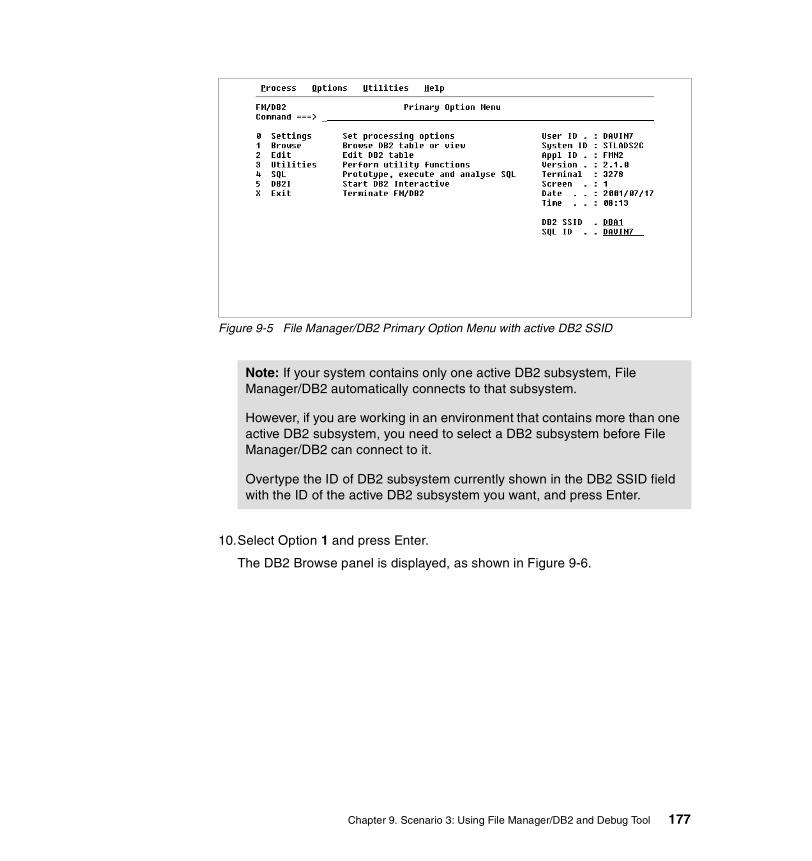
Figure 9-5 File Manager/DB2 Primary Option Menu with active DB2 SSID
10.Select Option 1 and press Enter.
The DB2 Browse panel is displayed, as shown in Figure 9-6.
Note: If your system contains only one active DB2 subsystem, File Manager/DB2 automatically connects to that subsystem.
However, if you are working in an environment that contains more than one active DB2 subsystem, you need to select a DB2 subsystem before File Manager/DB2 can connect to it.
Overtype the ID of DB2 subsystem currently shown in the DB2 SSID field with the ID of the active DB2 subsystem you want, and press Enter.
Chapter 9. Scenario 3: Using File Manager/DB2 and Debug Tool 177

Figure 9-6 File Manager/DB2 Browse panel
11.Specify the following information:
a. The table Ownerb. The table Namec. Select 3 in the Processing Options field.
The Table Browse panel is displayed, as shown in Figure 9-7.
Figure 9-7 File Manager/DB2 Table Browse panel
12.Issue the FIND command (just like you would in ISPF) to find the record for customer RB_DEMO.
178 Introduction to the IBM Problem Determination Tools

The record containing the string, RB_DEMO, is displayed as the first line in the panel and the cursor is placed on that record, as shown in Figure 9-8.
Figure 9-8 File Manager/DB2 Table Browse panel after a FIND command
13.Issue the RFIND command until you locate the record that has a value of IBM in the COMPANY column.
In Figure 9-8, you can see that the value in the NO_SHARES column is -5. This is incorrect data in the database.
At this point, you believe the problem is due to faulty logic in the program that updates the CUSTOMER_DETAILS table.
You review the compiler listing to get an overview of the program and to see where the table is processed.
You decide to debug the program with Debug Tool.
9.3.3 Using Debug Tool to identify the logic problemSet up the debug session for the TDB2 transaction in your CICS region.
1. Enter transaction ID DTCN.
The DTCN screen is displayed, as shown in Figure 9-9.
Chapter 9. Scenario 3: Using File Manager/DB2 and Debug Tool 179

Figure 9-9 Debug Tool CICS transactions control screen (DTCN)
2. Enter the program name MYTRADMD in the Program ID field and press Enter.
3. Press PF4 to save the profile.
4. Repeat these two steps for program MYTRADD.
Note: We could have used just the terminal ID to achieve the same results.
5. Press PF3 to exit from this screen.
6. Enter the transaction ID TDB2.
The debugging session starts, as shown in Figure 9-10.
180 Introduction to the IBM Problem Determination Tools
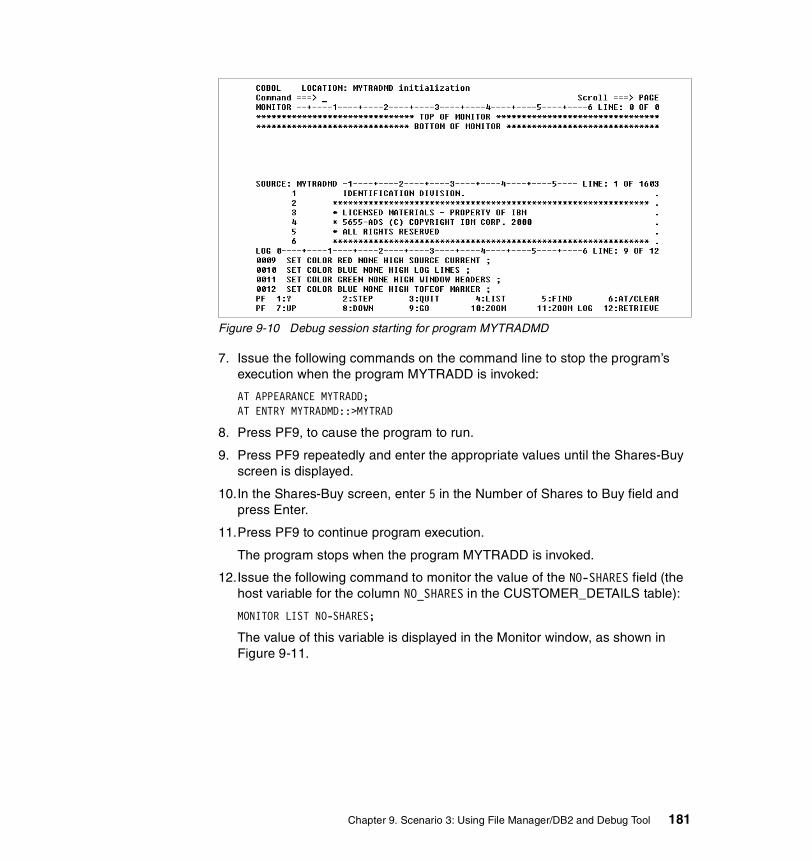
Figure 9-10 Debug session starting for program MYTRADMD
7. Issue the following commands on the command line to stop the program’s execution when the program MYTRADD is invoked:
AT APPEARANCE MYTRADD;AT ENTRY MYTRADMD::>MYTRAD
8. Press PF9, to cause the program to run.
9. Press PF9 repeatedly and enter the appropriate values until the Shares-Buy screen is displayed.
10.In the Shares-Buy screen, enter 5 in the Number of Shares to Buy field and press Enter.
11.Press PF9 to continue program execution.
The program stops when the program MYTRADD is invoked.
12.Issue the following command to monitor the value of the NO-SHARES field (the host variable for the column NO_SHARES in the CUSTOMER_DETAILS table):
MONITOR LIST NO-SHARES;
The value of this variable is displayed in the Monitor window, as shown in Figure 9-11.
Chapter 9. Scenario 3: Using File Manager/DB2 and Debug Tool 181
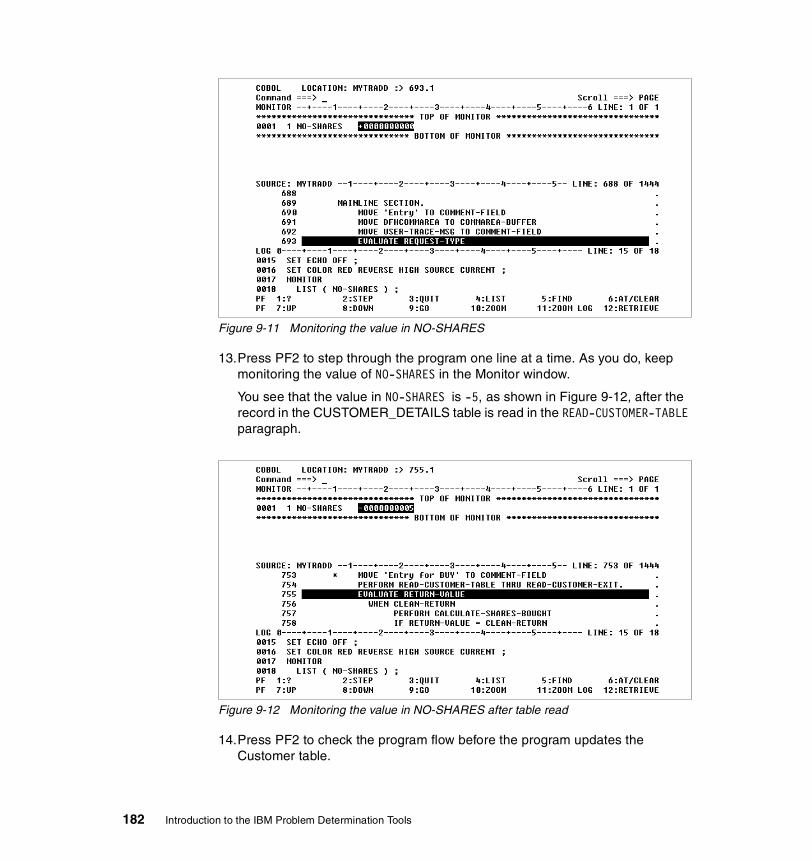
Figure 9-11 Monitoring the value in NO-SHARES
13.Press PF2 to step through the program one line at a time. As you do, keep monitoring the value of NO-SHARES in the Monitor window.
You see that the value in NO-SHARES is -5, as shown in Figure 9-12, after the record in the CUSTOMER_DETAILS table is read in the READ-CUSTOMER-TABLE paragraph.
Figure 9-12 Monitoring the value in NO-SHARES after table read
14.Press PF2 to check the program flow before the program updates the Customer table.
182 Introduction to the IBM Problem Determination Tools
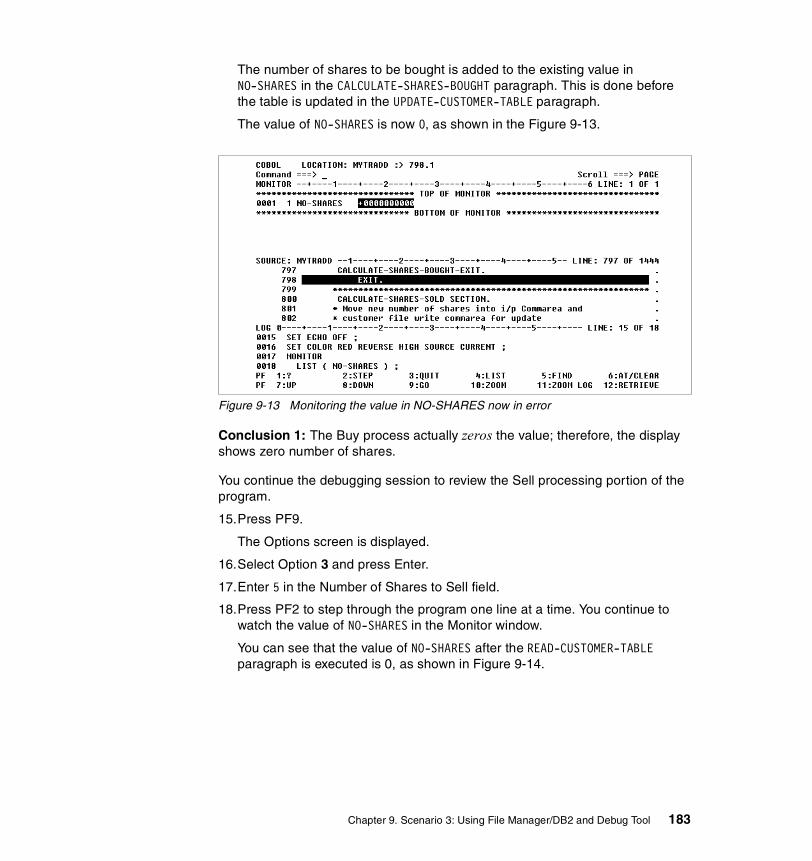
The number of shares to be bought is added to the existing value in NO-SHARES in the CALCULATE-SHARES-BOUGHT paragraph. This is done before the table is updated in the UPDATE-CUSTOMER-TABLE paragraph.
The value of NO-SHARES is now 0, as shown in the Figure 9-13.
Figure 9-13 Monitoring the value in NO-SHARES now in error
Conclusion 1: The Buy process actually zeros the value; therefore, the display shows zero number of shares.
You continue the debugging session to review the Sell processing portion of the program.
15.Press PF9.
The Options screen is displayed.
16.Select Option 3 and press Enter.
17.Enter 5 in the Number of Shares to Sell field.
18.Press PF2 to step through the program one line at a time. You continue to watch the value of NO-SHARES in the Monitor window.
You can see that the value of NO-SHARES after the READ-CUSTOMER-TABLE paragraph is executed is 0, as shown in Figure 9-14.
Chapter 9. Scenario 3: Using File Manager/DB2 and Debug Tool 183
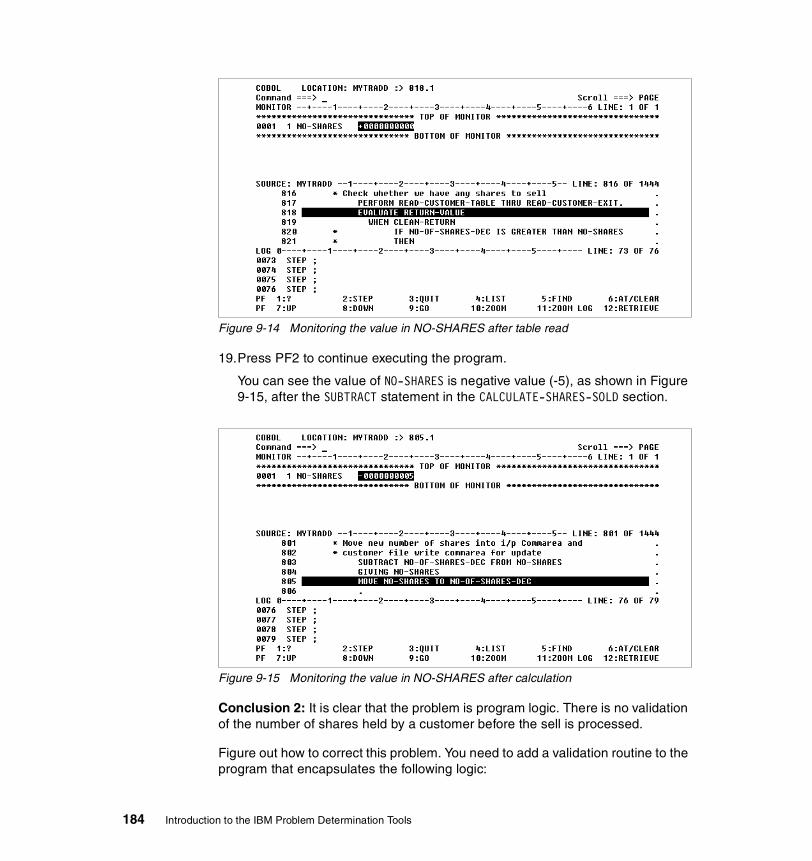
Figure 9-14 Monitoring the value in NO-SHARES after table read
19.Press PF2 to continue executing the program.
You can see the value of NO-SHARES is negative value (-5), as shown in Figure 9-15, after the SUBTRACT statement in the CALCULATE-SHARES-SOLD section.
Figure 9-15 Monitoring the value in NO-SHARES after calculation
Conclusion 2: It is clear that the problem is program logic. There is no validation of the number of shares held by a customer before the sell is processed.
Figure out how to correct this problem. You need to add a validation routine to the program that encapsulates the following logic:
184 Introduction to the IBM Problem Determination Tools
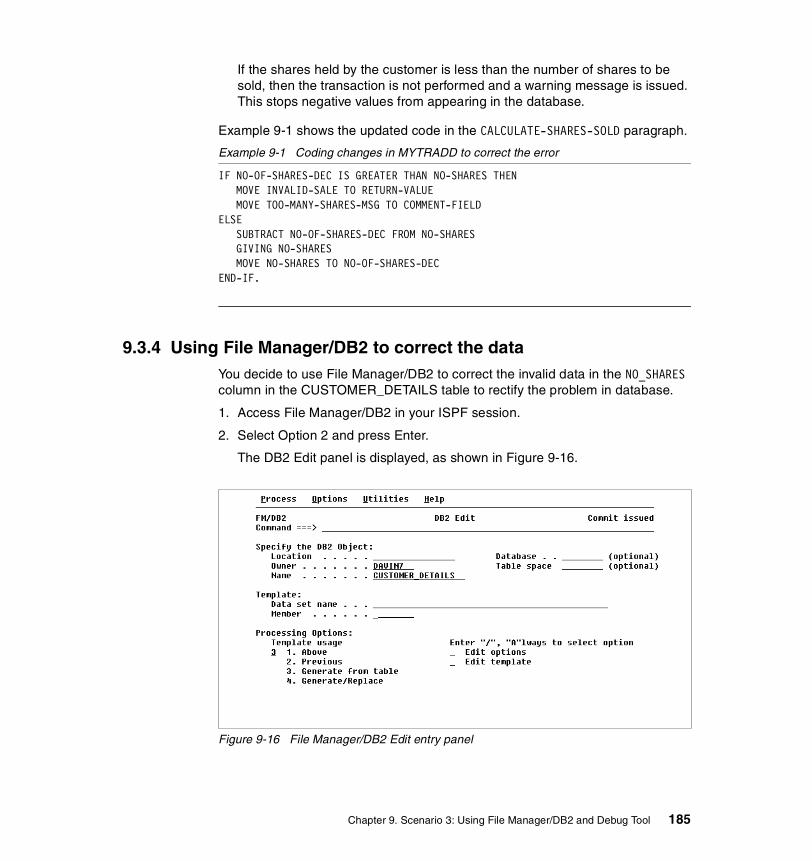
If the shares held by the customer is less than the number of shares to be sold, then the transaction is not performed and a warning message is issued. This stops negative values from appearing in the database.
Example 9-1 shows the updated code in the CALCULATE-SHARES-SOLD paragraph.
Example 9-1 Coding changes in MYTRADD to correct the error
IF NO-OF-SHARES-DEC IS GREATER THAN NO-SHARES THEN MOVE INVALID-SALE TO RETURN-VALUE MOVE TOO-MANY-SHARES-MSG TO COMMENT-FIELD ELSE SUBTRACT NO-OF-SHARES-DEC FROM NO-SHARES GIVING NO-SHARES MOVE NO-SHARES TO NO-OF-SHARES-DEC END-IF.
9.3.4 Using File Manager/DB2 to correct the dataYou decide to use File Manager/DB2 to correct the invalid data in the NO_SHARES column in the CUSTOMER_DETAILS table to rectify the problem in database.
1. Access File Manager/DB2 in your ISPF session.
2. Select Option 2 and press Enter.
The DB2 Edit panel is displayed, as shown in Figure 9-16.
Figure 9-16 File Manager/DB2 Edit entry panel
Chapter 9. Scenario 3: Using File Manager/DB2 and Debug Tool 185

3. Specify the following information:
a. The table Ownerb. The table Namec. Select 3 in the Processing Options field.
The Table Edit panel is displayed, as shown in Figure 9-17.
Figure 9-17 File Manager/DB2 Table Edit panel
4. Change the value in the NO_SHARES column to 0 for customer RB_DEMO’s holding in IBM.
5. Enter SAVE on the command line.
The change is saved and the message, Commit issued is displayed, as shown in Figure 9-18.
186 Introduction to the IBM Problem Determination Tools

Figure 9-18 File Manager/DB2 Table Edit panel with corrected data saved
9.4 Summary of Scenario 3In this chapter we described the various components that make up the CICS and DB2 environments in our system, and how they are set up.
We reviewed the processing performed by the CICS DB2 Trader application.
We detailed a process which used Debug Tool, running under CICS, to identify a problem with the logic in the application. We continued with a description of File Manager/DB2’s capability to correct the data that resulted from the problem.
Chapter 9. Scenario 3: Using File Manager/DB2 and Debug Tool 187

188 Introduction to the IBM Problem Determination Tools

Part 3 Appendixes
Part 3
© Copyright IBM Corp. 2002 189

190 Introduction to the IBM Problem Determination Tools

Appendix A. Problem determination tools supporting information
This appendix contains report listings, longer versions of REXX code, and sample batch jobs that have been described in this redbook.
It contains the following:
� Fault Analyzer Notification user exit� File Manager ISPF panel modifications� File Manager batch job to process multi-record file� Language environment runtime options report� Convert multiple sequential files to members of a PDS� Components of the Trader application
A
© Copyright IBM Corp. 2002 191

Fault Analyzer Notification user exitExample A-1 contains the REXX code (used by Fault Analyzer) to send an e-mail notification to an application programmer when a production batch job abends.
Note: SMTP must be established at the site for this exit to work.
Example: A-1 Fault Analyzer Notification user exit RWAKUP3AM
/* Rexx *//**********************************************************************//* Exec: WakUp3AM *//* Function: Send an e-mail to notify programmer of application abend *//* History: 06/15/2001 - LMK - Created *//* 07/09/2001 - LMK - Modified to use DEST parm of IDIALLOC *//**********************************************************************//* *//* This exit can optionally be used with IBM Fault Analyzer for *//* OS/390 to notify application developers of a production batch *//* abend via e-mail. *//* *//* On entry, two stems are provided: *//* - ENV *//* - NFY *//* Both of these data areas are described in the User’s Guide. *//* *//* To use this exit, the name of the EXEC (in this example, *//* WAKUP3AM is used, but this can be any name) must be specified *//* in an EXITS option as follows: *//* *//* EXITS(NOTIFY(REXX((WAKUP3AM))) *//* *//* For the exit to be invoked by Fault Analyzer, it must be made *//* available via the IDIEXEC DDname: *//* *//* IDIEXEC(IDI.REXX) *//* *//**********************************************************************//* Processing: If a batch job abends on any system other than System A, then: - Obtain all of the system-level variables and formulate a message - Get the application ID (3rd field in accounting info) - Read the Contact list; make sure it is sorted; ignore any comments - Look up the application and find the person’s name and e-mail id - Use SMTP to send the message to his/her text pager/**********************************************************************/ If Env.Job_Type = ‘C’ | , Env.System_Name = ‘ASYS’ Then Do /* You don’t want to process anything from CICS or Sys A */
192 Introduction to the IBM Problem Determination Tools
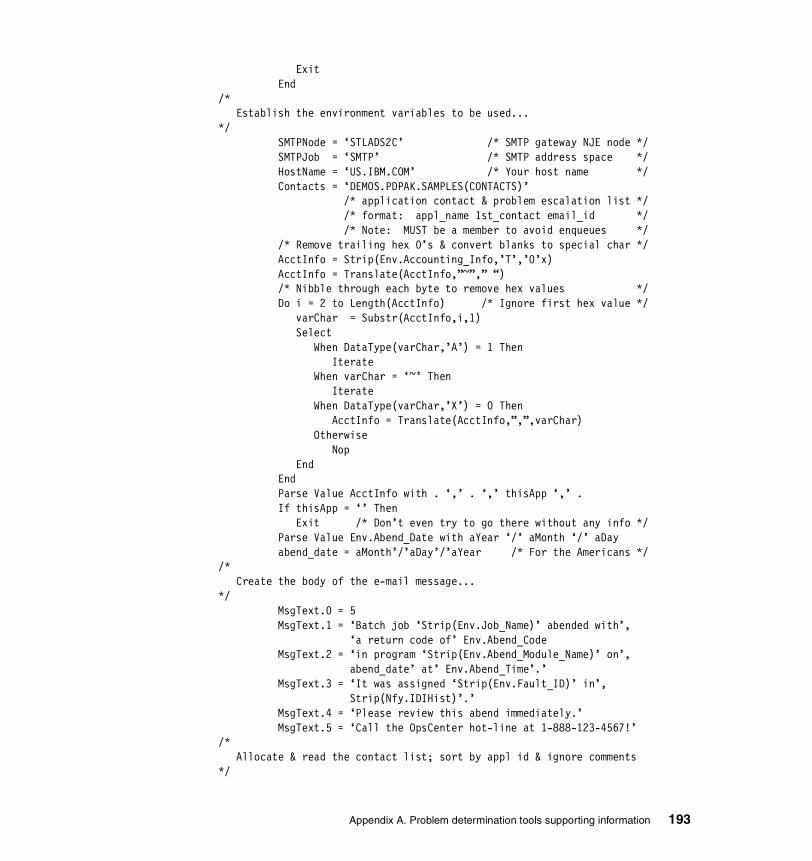
Exit End/* Establish the environment variables to be used...*/ SMTPNode = ‘STLADS2C’ /* SMTP gateway NJE node */ SMTPJob = ‘SMTP’ /* SMTP address space */ HostName = ‘US.IBM.COM’ /* Your host name */ Contacts = ‘DEMOS.PDPAK.SAMPLES(CONTACTS)’ /* application contact & problem escalation list */ /* format: appl_name 1st_contact email_id */ /* Note: MUST be a member to avoid enqueues */ /* Remove trailing hex 0’s & convert blanks to special char */ AcctInfo = Strip(Env.Accounting_Info,’T’,’0’x) AcctInfo = Translate(AcctInfo,”~”,” “) /* Nibble through each byte to remove hex values */ Do i = 2 to Length(AcctInfo) /* Ignore first hex value */ varChar = Substr(AcctInfo,i,1) Select When DataType(varChar,’A’) = 1 Then Iterate When varChar = ‘~’ Then Iterate When DataType(varChar,’X’) = 0 Then AcctInfo = Translate(AcctInfo,”,”,varChar) Otherwise Nop End End Parse Value AcctInfo with . ‘,’ . ‘,’ thisApp ‘,’ . If thisApp = ‘’ Then Exit /* Don’t even try to go there without any info */ Parse Value Env.Abend_Date with aYear ‘/’ aMonth ‘/’ aDay abend_date = aMonth’/’aDay’/’aYear /* For the Americans *//* Create the body of the e-mail message...*/ MsgText.0 = 5 MsgText.1 = ‘Batch job ‘Strip(Env.Job_Name)’ abended with’, ‘a return code of’ Env.Abend_Code MsgText.2 = ‘in program ‘Strip(Env.Abend_Module_Name)’ on’, abend_date’ at’ Env.Abend_Time’.’ MsgText.3 = ‘It was assigned ‘Strip(Env.Fault_ID)’ in’, Strip(Nfy.IDIHist)’.’ MsgText.4 = ‘Please review this abend immediately.’ MsgText.5 = ‘Call the OpsCenter hot-line at 1-888-123-4567!’/* Allocate & read the contact list; sort by appl id & ignore comments*/
Appendix A. Problem determination tools supporting information 193

“IDIAlloc DD(InRead) DSN(“Contacts”) Shr” /* No quotes! */ intRCode = RC If intRCode > 0 Then Do “IDIWTO IDIUSR01E”, “Unable to open Contacts list for”, Strip(Env.Fault_ID) “failed with RC=”intRCode Exit End Address MVS , “ExecIO * DiskR InRead (Stem DataLine. Open Finis” intRCode = RC If intRCode > 0 Then Do “IDIWTO IDIUSR02E”, “There was an error reading the Contacts List”, “RC=”intRCode Exit End “IDIFree DD(InRead)” intRCode = RC Call QSort DataLine.0 /* make sure input is sorted */ i = 0 /* don’t process any lines */ j = 0 /* that are commented out */ Do j = 1 to DataLine.0 If Left(DataLine.j,1) = ‘*’ Then Iterate Else Do i = i + 1 NewList.i = DataLine.j End End NewList.0 = i Drop DataLine. /* release unused variable set *//* Look up the application and find the contact’s name and e-mail id*/ strSrch4 = Strip(thisApp) Call BinSerch intRCode = Result /* 0 = found, 4 = not found */ If intRCode > 0 Then Do “IDIWTO IDIUSR03E”, “Unable to find “thisApp “in the Contacts list” Exit End/* Build the message and ship it off...*/ Call BuildEMsg /* Generate the message text */ “IDIAlloc DD(SMTPITSO) Sysout(A) Dest(“SMTPNode”.”SMTPJob”)” intRCode = RC
194 Introduction to the IBM Problem Determination Tools

If intRCode > 0 Then Do “IDIWTO IDIUSR04E”, “Unable to the allocate eMail message!”, “FA Issued RC=”intRCode Exit End Else Do “IDIWTO IDIUSR04I”, “Transmission of note for “Strip(Env.Fault_ID), “was sent to “strPName End Address MVS , “ExecIO * DiskW SMTPITSO (Stem SMTPOut. Finis” intRCode = RC “IDIFree DD(SMTPITSO)” intRCode = RC Exit/**********************************************************************//* Quick sort routine... *//**********************************************************************/QSort: Procedure Expose DataLine. Parse Arg N S = 1; StackL.1 = 1; StackR.1 = N Do Until S = 0 L = StackL.S; R = StackR.S; S = S - 1 Do Until L >= R I = L; J = R; P = (L + R) % 2 If DataLine.L > DataLine.P Then Do W = DataLine.L DataLine.L = DataLine.P DataLine.P = W End If DataLine.L > DataLine.R Then Do W = DataLine.L DataLine.L = DataLine.R DataLine.R = W End If DataLine.P > DataLine.R Then Do W = DataLine.P DataLine.P = DataLine.R DataLine.R = W End X = DataLine.P Do Until I > J Do I = I While DataLine.I < X; End Do J = J by -1 While X < DataLine.J; End If I <= J Then Do W = DataLine.I DataLine.I = DataLine.J
Appendix A. Problem determination tools supporting information 195
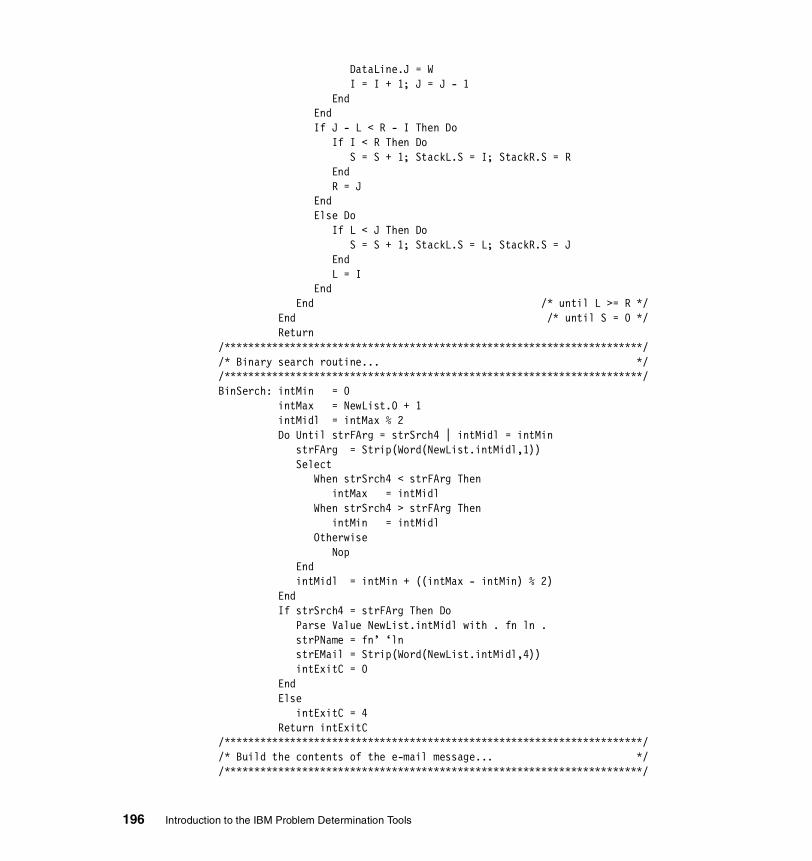
DataLine.J = W I = I + 1; J = J - 1 End End If J - L < R - I Then Do If I < R Then Do S = S + 1; StackL.S = I; StackR.S = R End R = J End Else Do If L < J Then Do S = S + 1; StackL.S = L; StackR.S = J End L = I End End /* until L >= R */ End /* until S = 0 */ Return/**********************************************************************//* Binary search routine... *//**********************************************************************/BinSerch: intMin = 0 intMax = NewList.0 + 1 intMidl = intMax % 2 Do Until strFArg = strSrch4 | intMidl = intMin strFArg = Strip(Word(NewList.intMidl,1)) Select When strSrch4 < strFArg Then intMax = intMidl When strSrch4 > strFArg Then intMin = intMidl Otherwise Nop End intMidl = intMin + ((intMax - intMin) % 2) End If strSrch4 = strFArg Then Do Parse Value NewList.intMidl with . fn ln . strPName = fn’ ‘ln strEMail = Strip(Word(NewList.intMidl,4)) intExitC = 0 End Else intExitC = 4 Return intExitC/**********************************************************************//* Build the contents of the e-mail message... *//**********************************************************************/
196 Introduction to the IBM Problem Determination Tools

BuildEMsg: SMTPOut.1 = ‘helo ‘HostName SMTPOut.2 = ‘mail from:<‘userID()||’@’HostName’>’ SMTPOut.3 = ‘rcpt to:<‘strEMail’@’HostName’>’ SMTPOut.4 = ‘data’ date = Date(“N”)” “Time()” LCL” date = Substr(Date,1,7)Substr(Date,10) SMTPOut.5 = ‘Date: ‘date SMTPOut.6 = ‘From: ‘UserID()||’@’HostName SMTPOut.7 = ‘To: “‘strPName’”’ SMTPOut.8 = ‘Subject: Abend in job ‘Env.Job_Name SMTPOut.9 = “ “ ix = 9 Do i = 1 to MsgText.0 ix = ix + 1 SMTPOut.ix = MsgText.i End ix = ix + 1 SMTPOut.ix = “.” ix = ix + 1 SMTPOut.ix = “ “ SMTPOut.0 = ix Return
Appendix A. Problem determination tools supporting information 197

File Manager ISPF panel modificationsExample A-2 depicts the change made to ISPF panel FMNPSCKD. This change was made to clear the contents of the Catalog ID field when the Enter key is pressed. This eliminates the need to explicitly include the catalog when processing the data set.
We added the following line of code:
&FMNVDCAT = &Z
In the example, the text in bold represents the change.
Example: A-2 ISPF panel FMNPSCKD with modification
&FMNSRL = TRANS(&FMNDFUN LIST,YES *,SKIP) &P = ' %' &FMNXDRFM = &FMNVDRFM IF (&MSG = &Z) .MSG = 'FMNE510A' .ALARM = &FMNALARM /* alarm to be sounded ? @D4A*/ &FMNMH = &FMNMHELP /* field help panel for lmsg line*/ IF (&FMNMH = '') /* if no message help */ &FMNMH = .HELP /* show extended help */)PROC IF (&ZCMD = '') VER(&FMNVDDSN,NB) &FMNVDCAT = &Z &TVAR = TRUNC(&FMNVDORG,1) IF (&FMNVDSH2 ¬= '') VER(&FMNVDSH1,NONBLANK) &TVAR = TRUNC(&FMNVDALO,1) &FMNVDALO = TRANS(&TVAR R,REC K,KB M,MB T,TRK C,CYL *,*) VER(&FMNVDALO,NB,LIST,REC,KB,MB,TRK,CYL) VER(&FMNVDSP1,NONBLANK)
198 Introduction to the IBM Problem Determination Tools

File Manager batch job to process multi-record fileExample A-3 depicts the full batch job used in 3.2.5, “How to split a single file into constituent record types” on page 51. The job includes file clean-up, allocation, and invocation of File Manager.
Example: A-3 File Manager batch job
//DAVIN6F1 JOB (12345678),’PD PAK’,CLASS=A,MSGCLASS=H,MSGLEVEL=(1,1), JOB00250// REGION=32M,NOTIFY=&SYSUID//*//DELETE EXEC PGM=IDCAMS//SYSPRINT DD SYSOUT=*//SYSIN DD * DELETE DAVIN6.SPLIT.REC01 DELETE DAVIN6.SPLIT.REC02 DELETE DAVIN6.SPLIT.REC03 DELETE DAVIN6.SPLIT.EXTRA SET MAXCC = 0/*//FILESET EXEC PGM=IEFBR14//SYSPRINT DD SYSOUT=*//REC01 DD DSN=DAVIN6.SPLIT.REC01,DISP=(NEW,CATLG),// SPACE=(TRK,(1,1),RLSE),UNIT=SYSALLDA,// RECFM=FB,LRECL=80,BLKSIZE=0//REC02 DD DSN=DAVIN6.SPLIT.REC02,DISP=(NEW,CATLG),// SPACE=(TRK,(1,1),RLSE),UNIT=SYSALLDA,// RECFM=FB,LRECL=80,BLKSIZE=0//REC03 DD DSN=DAVIN6.SPLIT.REC03,DISP=(NEW,CATLG),// SPACE=(TRK,(1,1),RLSE),UNIT=SYSALLDA,// RECFM=FB,LRECL=80,BLKSIZE=0//EXTRA DD DSN=DAVIN6.SPLIT.EXTRA,DISP=(NEW,CATLG),// SPACE=(TRK,(1,1),RLSE),UNIT=SYSALLDA,// RECFM=FB,LRECL=80,BLKSIZE=0//*//FM EXEC PGM=FILEMGR//STEPLIB DD DSN=FMN.SFMNMOD1,DISP=SHR //* DD DSN=IGY.SIGYCOMP,DISP=SHR //SYSPRINT DD SYSOUT=*//RECORDS DD DISP=SHR,DSN=DAVIN6.WORK.TEXT(SAMPFIL1)//REC01 DD DISP=OLD,DSN=DAVIN6.SPLIT.REC01//REC02 DD DISP=OLD,DSN=DAVIN6.SPLIT.REC02//REC03 DD DISP=OLD,DSN=DAVIN6.SPLIT.REC03//EXTRA DD DISP=OLD,DSN=DAVIN6.SPLIT.EXTRA//SYSIN DD *$$FILEM DSC INPUT=RECORDS,$$FILEM OUTPUT=EXTRA,
Appendix A. Problem determination tools supporting information 199

$$FILEM PROC=*DDNAME = ‘REC’ || FLD(1,2)IF NCO(FLD(1,2),1,2,3) THEN DO WRITE(DDNAME) EXIT ‘DROP’END/+/*
200 Introduction to the IBM Problem Determination Tools

Language Environment runtime options reportExample A-4 depicts the complete output of our system’s Language Environment (LE) runtime options. The report is produced when the RPTOPTS(ON) parameter is included at program execution.
Example: A-4 Language Environment runtime options report
Options Report for Enclave TRADERB 06/25/01 11:23:58 AM Language Environment V2 R9.0
LAST WHERE SET OPTION ------------------------------------------------------------------------------- Installation default ABPERC(NONE) Installation default ABTERMENC(ABEND) Installation default NOAIXBLD Installation default ALL31(OFF) Installation default ANYHEAP(16384,8192,ANYWHERE,FREE) Installation default NOAUTOTASK Installation default BELOWHEAP(8192,4096,FREE) Installation default CBLOPTS(ON) Installation default CBLPSHPOP(ON) Installation default CBLQDA(OFF) Installation default CHECK(ON) Installation default COUNTRY(US) Installation default NODEBUG Installation default DEPTHCONDLMT(10) Installation default ENVAR(““) Installation default ERRCOUNT(0) Installation default ERRUNIT(6) Installation default FILEHIST Default setting NOFLOW Installation default HEAP(32768,32768,ANYWHERE,KEEP,8192,4096) Installation default HEAPCHK(OFF,1,0) Installation default HEAPPOOLS(OFF,8,10,32,10,128,10,256,10,1024,10,2048,10) Installation default INFOMSGFILTER(OFF,,,,) Installation default INQPCOPN Installation default INTERRUPT(OFF) Installation default LIBRARY(SYSCEE) Installation default LIBSTACK(4096,4096,FREE) Installation default MSGFILE(SYSOUT,FBA,121,0,NOENQ) Installation default MSGQ(15) Installation default NATLANG(ENU) Installation default NONONIPTSTACK(4096,4096,BELOW,KEEP) Installation default OCSTATUS Installation default NOPC
Appendix A. Problem determination tools supporting information 201

Installation default PLITASKCOUNT(20) Installation default POSIX(OFF) Installation default PROFILE(OFF,””) Installation default PRTUNIT(6) Installation default PUNUNIT(7) Installation default RDRUNIT(5) Installation default RECPAD(OFF) Invocation command RPTOPTS(ON) Installation default RPTSTG(OFF) Installation default NORTEREUS Installation default RTLS(OFF) Installation default NOSIMVRD Installation default STACK(131072,131072,BELOW,KEEP) Installation default STORAGE(NONE,NONE,NONE,8192) Installation default TERMTHDACT(TRACE) Installation default NOTEST(ALL,”*”,”PROMPT”,”INSPPREF”) Installation default THREADHEAP(4096,4096,ANYWHERE,KEEP) Installation default TRACE(OFF,4096,DUMP,LE=0) Installation default TRAP(ON,SPIE) Installation default UPSI(00000000) Installation default NOUSRHDLR(,) Installation default VCTRSAVE(OFF) Installation default VERSION() Installation default XUFLOW(AUTO)
202 Introduction to the IBM Problem Determination Tools

Convert multiple sequential files to members of a PDSExample A-5 depicts the REXX code that you can use (or modify for your use) to collect multiple sequential files and copy the contents into members of a PDS.
Note: The member name must appear as a qualifier in the data set name for this routine to work.
Example: A-5 Sequential files to members of a PDS
/* Rexx *//**********************************************************************//* Exec: Seq2PDS1 *//* Function: Create PDS members from multiple sequential files... *//* History: 08/07/1997 - LMK - Created *//* 07/17/2001 - LMK - Modified for RedBook samples... *//**********************************************************************//* Note: Data set/member name pattern is hardcoded - modify as needed!*//**********************************************************************/
Parse Upper Arg Debug DbugMode/* Invoke debugging features when asked...*/ If Debug = ‘DEBUG’ Then Do If DbugMode = ‘’ Then Do DbugMode = ‘R’ End Interpret Trace DbugMode End/* Establish the environment and variables to be used...*/ Address IspExec ‘Control Errors Return’
DSLevel = ‘APPL.X.*.MASTER’ /* Change for your site */ PDSFile = ‘TEST.LISTINGS.MASTER’ /* Change for your site *//* Get a data set list like ISPF 3.4...*/ “LMDInit ListID(DataID) Level(“DSLevel”)” intLCode = RC Do While intLCode = 0 “LMDList ListID(“DataID”) Option(List)” , “DataSet(DataVar) Stats(Yes)” intLCode = RC If intLCode = 0 Then Do If ZDLDSORG = ‘PS’ Then Do /* Change for your site */
Appendix A. Problem determination tools supporting information 203

Parse Var DataVar null1 ‘X.’ MbrName ‘.MASTER’ . Say ‘Processing ‘MbrName Address TSO , “Alloc Fi(ReadIn)”, “Da(‘”DataVar”’) Shr Reu” intRCode = RC Address MVS , “ExecIO * DiskR Readin (Stem DataLine. Open Finis” intRCode = RC Address TSO , “Alloc Fi(OutMembr) “, “Da(‘”PDSFile”(“MbrName”)’) Old Reu” intRCode = RC Address MVS , “ExecIO “DataLine.0” DiskW “, “OutMembr (Stem DataLine. Open Finis” intRCode = RC Address TSO , “Free Fi(OutMembr) “ intRCode = RC Address TSO , “Free Fi(ReadIn)” intRCode = RC End End End “LMDList ListID(“DataID”) Option(Free)” intRCode = RC “LMDFree ListID(“DataID”)” intRCode = RCFinal: Exit
204 Introduction to the IBM Problem Determination Tools
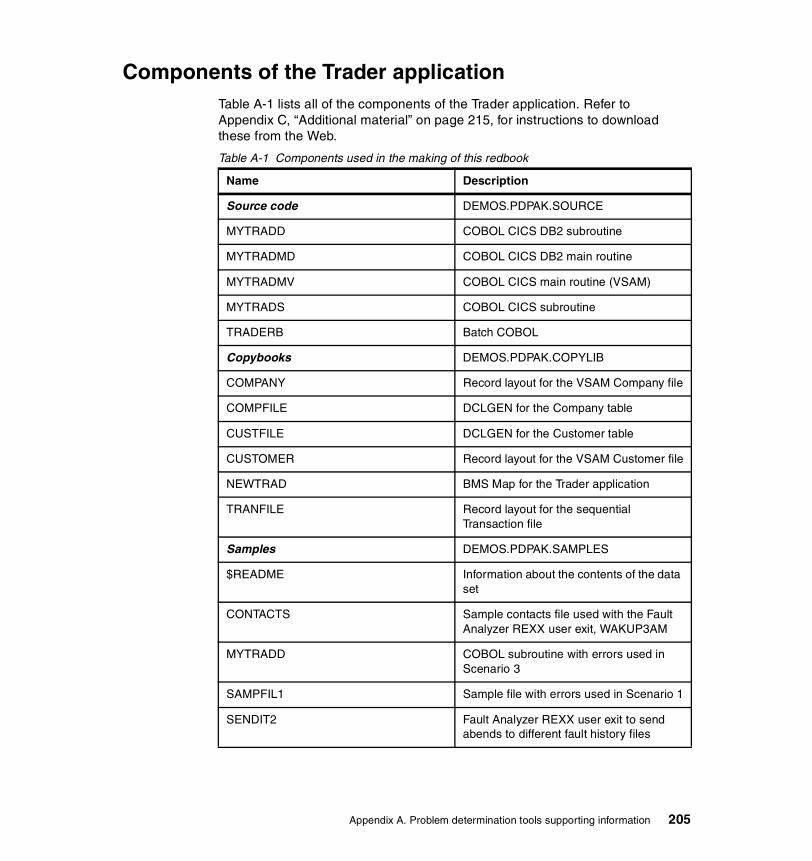
Components of the Trader applicationTable A-1 lists all of the components of the Trader application. Refer to Appendix C, “Additional material” on page 215, for instructions to download these from the Web.
Table A-1 Components used in the making of this redbook
Name Description
Source code DEMOS.PDPAK.SOURCE
MYTRADD COBOL CICS DB2 subroutine
MYTRADMD COBOL CICS DB2 main routine
MYTRADMV COBOL CICS main routine (VSAM)
MYTRADS COBOL CICS subroutine
TRADERB Batch COBOL
Copybooks DEMOS.PDPAK.COPYLIB
COMPANY Record layout for the VSAM Company file
COMPFILE DCLGEN for the Company table
CUSTFILE DCLGEN for the Customer table
CUSTOMER Record layout for the VSAM Customer file
NEWTRAD BMS Map for the Trader application
TRANFILE Record layout for the sequential Transaction file
Samples DEMOS.PDPAK.SAMPLES
$README Information about the contents of the data set
CONTACTS Sample contacts file used with the Fault Analyzer REXX user exit, WAKUP3AM
MYTRADD COBOL subroutine with errors used in Scenario 3
SAMPFIL1 Sample file with errors used in Scenario 1
SENDIT2 Fault Analyzer REXX user exit to send abends to different fault history files
Appendix A. Problem determination tools supporting information 205
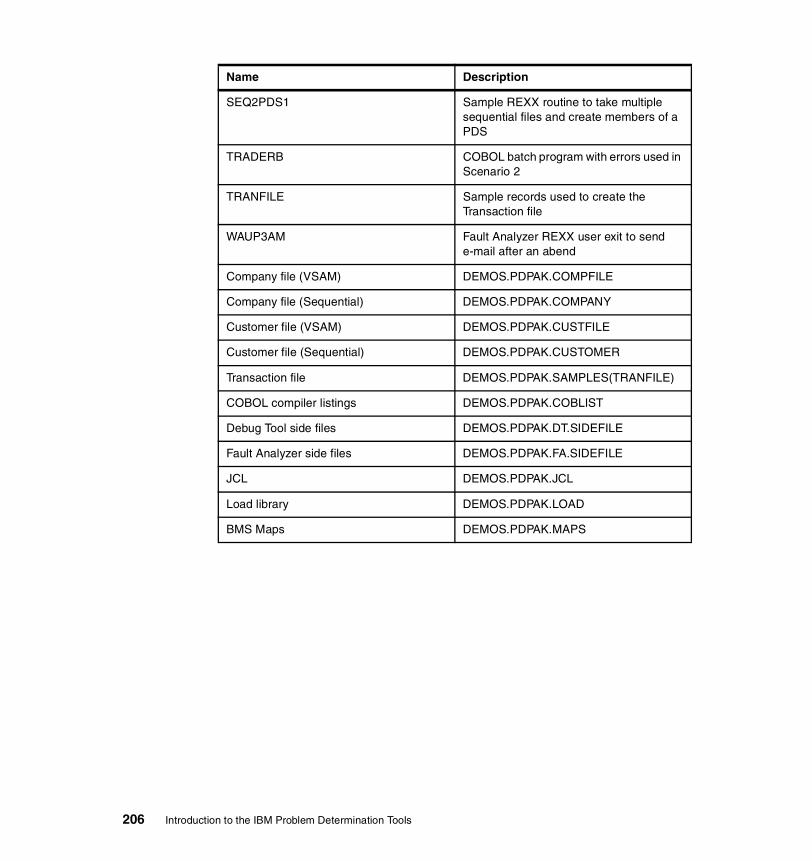
SEQ2PDS1 Sample REXX routine to take multiple sequential files and create members of a PDS
TRADERB COBOL batch program with errors used in Scenario 2
TRANFILE Sample records used to create the Transaction file
WAUP3AM Fault Analyzer REXX user exit to send e-mail after an abend
Company file (VSAM) DEMOS.PDPAK.COMPFILE
Company file (Sequential) DEMOS.PDPAK.COMPANY
Customer file (VSAM) DEMOS.PDPAK.CUSTFILE
Customer file (Sequential) DEMOS.PDPAK.CUSTOMER
Transaction file DEMOS.PDPAK.SAMPLES(TRANFILE)
COBOL compiler listings DEMOS.PDPAK.COBLIST
Debug Tool side files DEMOS.PDPAK.DT.SIDEFILE
Fault Analyzer side files DEMOS.PDPAK.FA.SIDEFILE
JCL DEMOS.PDPAK.JCL
Load library DEMOS.PDPAK.LOAD
BMS Maps DEMOS.PDPAK.MAPS
Name Description
206 Introduction to the IBM Problem Determination Tools

Appendix B. Fault Analyzer fault history file conversion
This appendix describes our experiences when we converted the Fault Analyzer fault history file structure from VSAM to PDS/E.
B
© Copyright IBM Corp. 2002 207
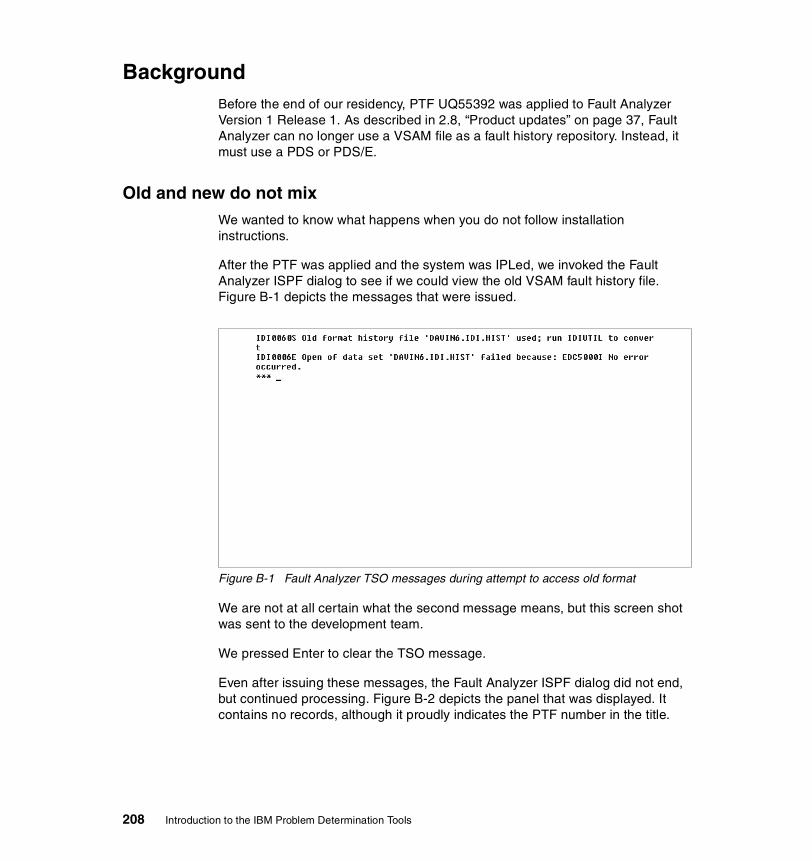
BackgroundBefore the end of our residency, PTF UQ55392 was applied to Fault Analyzer Version 1 Release 1. As described in 2.8, “Product updates” on page 37, Fault Analyzer can no longer use a VSAM file as a fault history repository. Instead, it must use a PDS or PDS/E.
Old and new do not mixWe wanted to know what happens when you do not follow installation instructions.
After the PTF was applied and the system was IPLed, we invoked the Fault Analyzer ISPF dialog to see if we could view the old VSAM fault history file. Figure B-1 depicts the messages that were issued.
Figure B-1 Fault Analyzer TSO messages during attempt to access old format
We are not at all certain what the second message means, but this screen shot was sent to the development team.
We pressed Enter to clear the TSO message.
Even after issuing these messages, the Fault Analyzer ISPF dialog did not end, but continued processing. Figure B-2 depicts the panel that was displayed. It contains no records, although it proudly indicates the PTF number in the title.
208 Introduction to the IBM Problem Determination Tools

Figure B-2 Resulting Fault Analyzer display during attempt to access old format
We used one of our example CICS programs to force a dump, just to see what would happen. The JES log, displayed in Figure B-3, contains the error message (IDI0060S) issued by Fault Analyzer. This CICS dump was not added to the file.
Figure B-3 JES log with error message during attempt to dump to old format
Appendix B. Fault Analyzer fault history file conversion 209
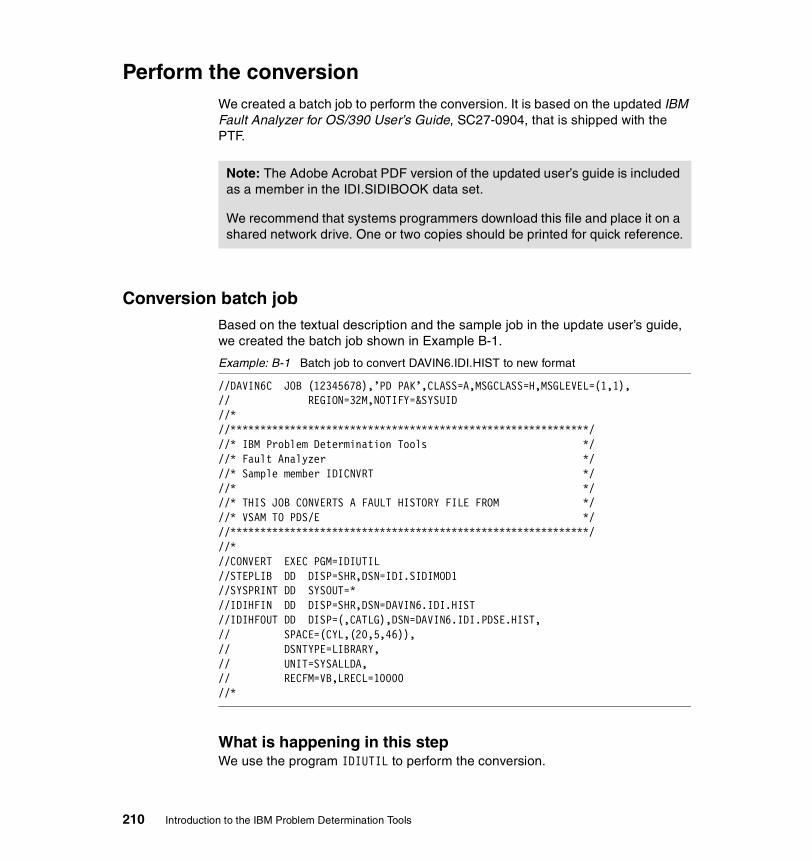
Perform the conversionWe created a batch job to perform the conversion. It is based on the updated IBM Fault Analyzer for OS/390 User’s Guide, SC27-0904, that is shipped with the PTF.
Conversion batch jobBased on the textual description and the sample job in the update user’s guide, we created the batch job shown in Example B-1.
Example: B-1 Batch job to convert DAVIN6.IDI.HIST to new format
//DAVIN6C JOB (12345678),’PD PAK’,CLASS=A,MSGCLASS=H,MSGLEVEL=(1,1),// REGION=32M,NOTIFY=&SYSUID//*//************************************************************///* IBM Problem Determination Tools *///* Fault Analyzer *///* Sample member IDICNVRT *///* *///* THIS JOB CONVERTS A FAULT HISTORY FILE FROM *///* VSAM TO PDS/E *///************************************************************///*//CONVERT EXEC PGM=IDIUTIL//STEPLIB DD DISP=SHR,DSN=IDI.SIDIMOD1//SYSPRINT DD SYSOUT=*//IDIHFIN DD DISP=SHR,DSN=DAVIN6.IDI.HIST//IDIHFOUT DD DISP=(,CATLG),DSN=DAVIN6.IDI.PDSE.HIST,// SPACE=(CYL,(20,5,46)),// DSNTYPE=LIBRARY,// UNIT=SYSALLDA,// RECFM=VB,LRECL=10000//*
What is happening in this stepWe use the program IDIUTIL to perform the conversion.
Note: The Adobe Acrobat PDF version of the updated user’s guide is included as a member in the IDI.SIDIBOOK data set.
We recommend that systems programmers download this file and place it on a shared network drive. One or two copies should be printed for quick reference.
210 Introduction to the IBM Problem Determination Tools

For accuracy and completeness, we included a STEPLIB DD statement to point to the Fault Analyzer load library. This statement is not required if the product is installed in LINKLIST.
The input fault history file, IDIHFIN, is one of the test files that was created during this project. The utility simply reads this file.
The output fault history file, IDIHFOUT, is a newly allocated PDS/E.
You must include a SYSPRINT DD statement for the utility-generated status messages.
Batch report outputThe batch job to convert this small fault history file took less than one minute to execute.
Let us review the report outputThe key portion of the batch job’s output report is displayed in Example B-2.
Example: B-2 Output report from conversion batch job
1 IDIUTIL Converting VSAM DAVIN6.IDI.HIST input Fault History File to DAVIN6.IDI.PDSE.HIST
IDIUTIL Writing Fault F00001 to DAVIN6.IDI.PDSE.HIST IDIUTIL Writing Fault F00002 to DAVIN6.IDI.PDSE.HIST IDIUTIL Writing Fault F00003 to DAVIN6.IDI.PDSE.HIST IDIUTIL Writing Fault F00004 to DAVIN6.IDI.PDSE.HIST IDIUTIL Writing Fault F00005 to DAVIN6.IDI.PDSE.HIST IDIUTIL Writing Fault F00006 to DAVIN6.IDI.PDSE.HIST IDIUTIL Writing Fault F00007 to DAVIN6.IDI.PDSE.HIST IDIUTIL Writing Fault F00008 to DAVIN6.IDI.PDSE.HIST IDIUTIL Writing Fault F00009 to DAVIN6.IDI.PDSE.HIST IDIUTIL Writing Fault F00010 to DAVIN6.IDI.PDSE.HIST IDIUTIL Writing Fault F00011 to DAVIN6.IDI.PDSE.HIST IDIUTIL Writing Fault F00012 to DAVIN6.IDI.PDSE.HIST IDIUTIL Writing Fault F00013 to DAVIN6.IDI.PDSE.HIST IDIUTIL Writing Fault F00014 to DAVIN6.IDI.PDSE.HIST IDIUTIL Writing Fault F00015 to DAVIN6.IDI.PDSE.HIST IDIUTIL Writing Fault F00016 to DAVIN6.IDI.PDSE.HIST IDIUTIL Writing Fault F00017 to DAVIN6.IDI.PDSE.HIST IDIUTIL Writing Fault F00018 to DAVIN6.IDI.PDSE.HIST IDIUTIL Writing Fault F00019 to DAVIN6.IDI.PDSE.HIST IDIUTIL Writing Fault F00020 to DAVIN6.IDI.PDSE.HIST IDIUTIL Writing Fault F00021 to DAVIN6.IDI.PDSE.HIST IDIUTIL Writing Fault F00022 to DAVIN6.IDI.PDSE.HIST
Appendix B. Fault Analyzer fault history file conversion 211
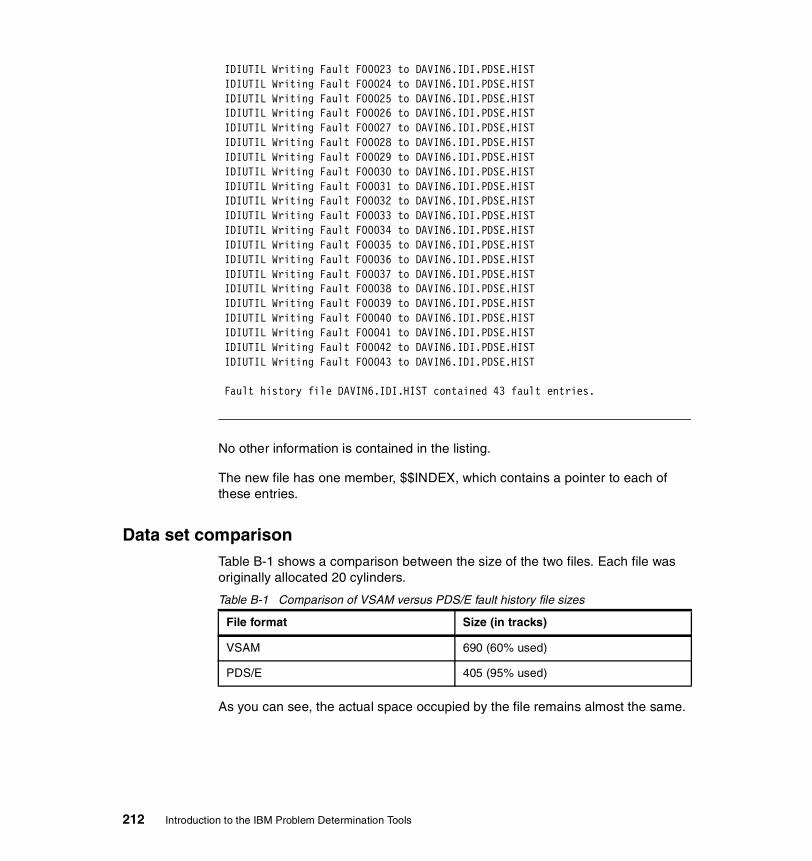
IDIUTIL Writing Fault F00023 to DAVIN6.IDI.PDSE.HIST IDIUTIL Writing Fault F00024 to DAVIN6.IDI.PDSE.HIST IDIUTIL Writing Fault F00025 to DAVIN6.IDI.PDSE.HIST IDIUTIL Writing Fault F00026 to DAVIN6.IDI.PDSE.HIST IDIUTIL Writing Fault F00027 to DAVIN6.IDI.PDSE.HIST IDIUTIL Writing Fault F00028 to DAVIN6.IDI.PDSE.HIST IDIUTIL Writing Fault F00029 to DAVIN6.IDI.PDSE.HIST IDIUTIL Writing Fault F00030 to DAVIN6.IDI.PDSE.HIST IDIUTIL Writing Fault F00031 to DAVIN6.IDI.PDSE.HIST IDIUTIL Writing Fault F00032 to DAVIN6.IDI.PDSE.HIST IDIUTIL Writing Fault F00033 to DAVIN6.IDI.PDSE.HIST IDIUTIL Writing Fault F00034 to DAVIN6.IDI.PDSE.HIST IDIUTIL Writing Fault F00035 to DAVIN6.IDI.PDSE.HIST IDIUTIL Writing Fault F00036 to DAVIN6.IDI.PDSE.HIST IDIUTIL Writing Fault F00037 to DAVIN6.IDI.PDSE.HIST IDIUTIL Writing Fault F00038 to DAVIN6.IDI.PDSE.HIST IDIUTIL Writing Fault F00039 to DAVIN6.IDI.PDSE.HIST IDIUTIL Writing Fault F00040 to DAVIN6.IDI.PDSE.HIST IDIUTIL Writing Fault F00041 to DAVIN6.IDI.PDSE.HIST IDIUTIL Writing Fault F00042 to DAVIN6.IDI.PDSE.HIST IDIUTIL Writing Fault F00043 to DAVIN6.IDI.PDSE.HIST
Fault history file DAVIN6.IDI.HIST contained 43 fault entries.
No other information is contained in the listing.
The new file has one member, $$INDEX, which contains a pointer to each of these entries.
Data set comparisonTable B-1 shows a comparison between the size of the two files. Each file was originally allocated 20 cylinders.
Table B-1 Comparison of VSAM versus PDS/E fault history file sizes
As you can see, the actual space occupied by the file remains almost the same.
File format Size (in tracks)
VSAM 690 (60% used)
PDS/E 405 (95% used)
212 Introduction to the IBM Problem Determination Tools

Results after the conversionWe launched Fault Analyzer and pointed to the converted file.
Note: To access the new file, you must select Options —> 1. Change Fault History File Options, and enter the file name in the Fault History File field.
Figure B-4 depicts Fault Analyzer with the converted fault history file displayed.
Figure B-4 Converted Fault Analyzer fault history file
NotesWe also performed a conversion on the existing IDI.HIST file, which was created at the end of August 2000. We found the following idiosyncrasies:
� CICS entries did not have valid transaction IDs listed, although all of the data was valid.
Entries for new CICS transaction abends were listed correctly.
� Fault Analyzer reuses empty fault IDs.
We deleted some entries from the file early in the project. The new fault ID numbers appear at the top of the list.
We logged these items with the development team. The effect of this behavior is shown in Figure B-5.
Appendix B. Fault Analyzer fault history file conversion 213

Figure B-5 Results of original IDI.HIST conversion
214 Introduction to the IBM Problem Determination Tools

Appendix C. Additional material
This redbook refers to additional material that can be downloaded from the Internet as described below.
Locating the Web materialThe Web material associated with this redbook is available in softcopy on the Internet from the IBM Redbooks Web server. Point your Web browser to:
ftp://www.redbooks.ibm.com/redbooks/SG246296
Alternatively, you can go to the IBM Redbooks Web site at:
ibm.com/redbooks
Select the Additional materials and open the directory that corresponds with the redbook form number, SG246296.
Using the Web materialThe additional Web material that accompanies this redbook includes the following files:
File name Descriptiondemo6296.zip Zipped code samples
C
© Copyright IBM Corp. 2002 215

System requirements for downloading the Web materialThe following system configuration is recommended:
Hard disk space: 3.7 MB for the downloaded zip file and unpacked filesOperating System: Windows NT 4.0/2000Processor: PentiumMemory: 128 MB
How to use the Web materialCreate a subdirectory (folder) on your workstation, and unzip the contents of the Web material zip file into this folder.
The extracted files are all in binary format. They are the output of the TSO TRANSMIT command.
Use your mainframe file transfer protocol to upload the binary files. You must use the following attributes: FB, LRECL=80, BLKSIZE=3120.
After each file is uploaded, issue the following command from the TSO READY prompt:
RECEIVE INDA(xxxx)
where xxxx is the name of the file.
The default high-level qualifier assigned to the file will be your TSO user ID.
Note: You can delete the zipped file and the temporary folder after you finish uploading all of the files.
216 Introduction to the IBM Problem Determination Tools

Related publications
The publications listed in this section are considered particularly suitable for a more detailed discussion of the topics covered in this redbook.
IBM RedbooksFor information on ordering these publications, see “How to get IBM Redbooks” on page 218.
Other resourcesThese publications are also relevant as further information sources:
� COBOL for OS/390 & VM Language Reference, SC26-9046
� COBOL for OS/390 & VM Programming Guide, SC26-9049
� Debug Tool User’s Guide and Reference, SC09-2137
� IBM Fault Analyzer for OS/390 User’s Guide, SC27-0904
� IBM File Manager for OS/390 User’s Guide and Reference, SC27-0815
� Language Environment for OS/390 & VM Programming Reference, SC28-1940
� OS/390 MVS JCL Reference, GC28-1757
� OS/390 SecureWay Communications Server IP User's Guide, GC31-8514
� OS/390 TSO/E CLISTs, SC28-1973
� OS/390 TSO/E Command Reference, SC28-1969
� OS/390 TSO/E REXX Reference, SC28-1975
� OS/390 TSO/E REXX User’s Guide, SC28-1974
� OS/390 TSO/E User’s Guide, SC28-1968
Newly released publications are available for the latest versions of some Problem Determination Tools:
� IBM File Manager for z/OS and OS/390 User’s Guide and Reference, SC27-1315
� IBM File Manager for z/OS and OS/390 DB2 Feature User’s Guide and Reference, SC27-1264
© Copyright IBM Corp. 2002 217
� File Manager/IMS User’s Guide and Reference, SC27-1267
Referenced Web sitesThese Web sites are also relevant as further information sources:
� Debug Tool homepage:
http://www.ibm.com/servers/eserver/zseries/dt/
� Solution for OS/390:
http://www.ibm.com/s390/ads/
How to get IBM RedbooksSearch for additional Redbooks or Redpieces, view, download, or order hardcopy from the Redbooks Web site:
ibm.com/redbooks
Also download additional materials (code samples or diskette/CD-ROM images) from this Redbooks site.
Redpieces are Redbooks in progress; not all Redbooks become Redpieces and sometimes just a few chapters will be published this way. The intent is to get the information out much quicker than the formal publishing process allows.
IBM Redbooks collectionsRedbooks are also available on CD-ROMs. Click the CD-ROMs button on the Redbooks Web site for information about all the CD-ROMs offered, as well as updates and formats.
Pay particular attention to the following:
CD-ROM Title Collection Kit Number
IBM System/390 Redbooks Collection SK2T-2177IBM Application Development Redbooks Collection SK2T-8037
218 Introduction to the IBM Problem Determination Tools218 Introduction to the IBM Problem Determination Tools

Special notices
References in this publication to IBM products, programs or services do not imply that IBM intends to make these available in all countries in which IBM operates. Any reference to an IBM product, program, or service is not intended to state or imply that only IBM's product, program, or service may be used. Any functionally equivalent program that does not infringe any of IBM's intellectual property rights may be used instead of the IBM product, program or service.
Information in this book was developed in conjunction with use of the equipment specified, and is limited in application to those specific hardware and software products and levels.
IBM may have patents or pending patent applications covering subject matter in this document. The furnishing of this document does not give you any license to these patents. You can send license inquiries, in writing, to the IBM Director of Licensing, IBM Corporation, North Castle Drive, Armonk, NY 10504-1785.
Licensees of this program who wish to have information about it for the purpose of enabling: (i) the exchange of information between independently created programs and other programs (including this one) and (ii) the mutual use of the information which has been exchanged, should contact IBM Corporation, Dept. 600A, Mail Drop 1329, Somers, NY 10589 USA.
Such information may be available, subject to appropriate terms and conditions, including in some cases, payment of a fee.
The information contained in this document has not been submitted to any formal IBM test and is distributed AS IS. The use of this information or the implementation of any of these techniques is a customer responsibility and depends on the customer's ability to evaluate and integrate them into the customer's operational environment. While each item may have been reviewed by IBM for accuracy in a specific situation, there is no guarantee that the same or similar results will be obtained elsewhere. Customers attempting to adapt these techniques to their own environments do so at their own risk.
Any pointers in this publication to external Web sites are provided for convenience only and do not in any manner serve as an endorsement of these Web sites.
© Copyright IBM Corp. 2002 219

The following terms are trademarks of other companies:
Tivoli, Manage. Anything. Anywhere.,The Power To Manage., Anything. Anywhere.,TME, NetView, Cross-Site, Tivoli Ready, Tivoli Certified, Planet Tivoli, and Tivoli Enterprise are trademarks or registered trademarks of Tivoli Systems Inc., an IBM company, in the United States, other countries, or both. In Denmark, Tivoli is a trademark licensed from Kjøbenhavns Sommer - Tivoli A/S.
C-bus is a trademark of Corollary, Inc. in the United States and/or other countries.
Java and all Java-based trademarks and logos are trademarks or registered trademarks of Sun Microsystems, Inc. in the United States and/or other countries.
Microsoft, Windows, Windows NT, and the Windows logo are trademarks of Microsoft Corporation in the United States and/or other countries.
PC Direct is a trademark of Ziff Communications Company in the United States and/or other countries and is used by IBM Corporation under license.
ActionMedia, LANDesk, MMX, Pentium and ProShare are trademarks of Intel Corporation in the United States and/or other countries.
UNIX is a registered trademark in the United States and other countries licensed exclusively through The Open Group.
SET, SET Secure Electronic Transaction, and the SET Logo are trademarks owned by SET Secure Electronic Transaction LLC.
Other company, product, and service names may be trademarks or service marks of others.
220 Introduction to the IBM Problem Determination Tools
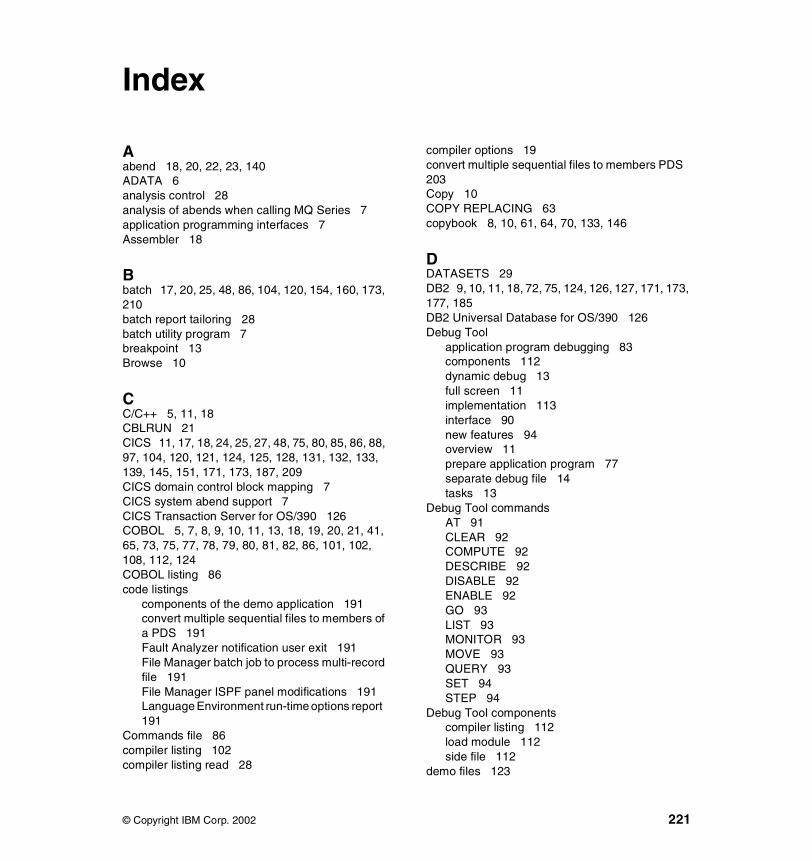
Index
Aabend 18, 20, 22, 23, 140ADATA 6analysis control 28analysis of abends when calling MQ Series 7application programming interfaces 7Assembler 18
Bbatch 17, 20, 25, 48, 86, 104, 120, 154, 160, 173, 210batch report tailoring 28batch utility program 7breakpoint 13Browse 10
CC/C++ 5, 11, 18CBLRUN 21CICS 11, 17, 18, 24, 25, 27, 48, 75, 80, 85, 86, 88, 97, 104, 120, 121, 124, 125, 128, 131, 132, 133, 139, 145, 151, 171, 173, 187, 209CICS domain control block mapping 7CICS system abend support 7CICS Transaction Server for OS/390 126COBOL 5, 7, 8, 9, 10, 11, 13, 18, 19, 20, 21, 41, 65, 73, 75, 77, 78, 79, 80, 81, 82, 86, 101, 102, 108, 112, 124COBOL listing 86code listings
components of the demo application 191convert multiple sequential files to members of a PDS 191Fault Analyzer notification user exit 191File Manager batch job to process multi-record file 191File Manager ISPF panel modifications 191Language Environment run-time options report 191
Commands file 86compiler listing 102compiler listing read 28
© Copyright IBM Corp. 2002
compiler options 19convert multiple sequential files to members PDS 203Copy 10COPY REPLACING 63copybook 8, 10, 61, 64, 70, 133, 146
DDATASETS 29DB2 9, 10, 11, 18, 72, 75, 124, 126, 127, 171, 173, 177, 185DB2 Universal Database for OS/390 126Debug Tool
application program debugging 83components 112dynamic debug 13full screen 11implementation 113interface 90new features 94overview 11prepare application program 77separate debug file 14tasks 13
Debug Tool commandsAT 91CLEAR 92COMPUTE 92DESCRIBE 92DISABLE 92ENABLE 92GO 93LIST 93MONITOR 93MOVE 93QUERY 93SET 94STEP 94
Debug Tool componentscompiler listing 112load module 112side file 112
demo files 123
221

DETAIL 29DFSORT 54dump output 18DUMPDSN 29dynamic debug 13, 77, 94, 95
EEdit 10end processing 28EXCLUDE 29EXITS 30EXPLAIN 10Extract 10
FFault Analyzer
batch re-analysis 25compiler options 19components 102customization 27customization options 29environments 18fault history file conversion 208hints and tips 32history file 5, 18implementation 104interactive analysis 23key features 4notification user exit 192overview 17product requirements 6real-time analysis 18re-analyze 22side file 20supported languages 5user exits 6
Fault Analyzer modelsModel 1 104Model 2 107Model 3 107
Fault Analyzer notification 36fault ID 18FAULTID 30File Manager
batch job process multi-record file 199batch processing 9batch utilities 55components 108
create VSAM file from another 46DB2 10examples 41Find/Change Utility 42functions 7global find/replace 42hints and tips 66implementation 109IMS 10initialize VSAM file low-value record 48ISPF panel modifications 198REXX functions 9split file into constituent parts 52template processing 62templates 8
File Manager componentscopybook 108template 108
File Manager modelsModel 1 110
File Manager REXX functionsCO 45DROP 54DSC 45DSG 50EXIT 46, 54FLD 53NCO 54PRINT 46STOP IMMEDIATE 46WRITE 46, 54
FLD 9
HHigh Level Assembler 5
IIBM Debug Tool, Version 1 Release 2 4IBM Fault Analyzer for OS/390 4IBM File Manager for OS/390 4IBM File Manager for z/OS and OS/390 4IDCN 27IDCN INSTALL 27IDCN UNINSTALL 27IDILANGX 21IDIOPTS 26IDIXCEE 27, 28IDIXCX52 27
222 Introduction to the IBM Problem Determination Tools
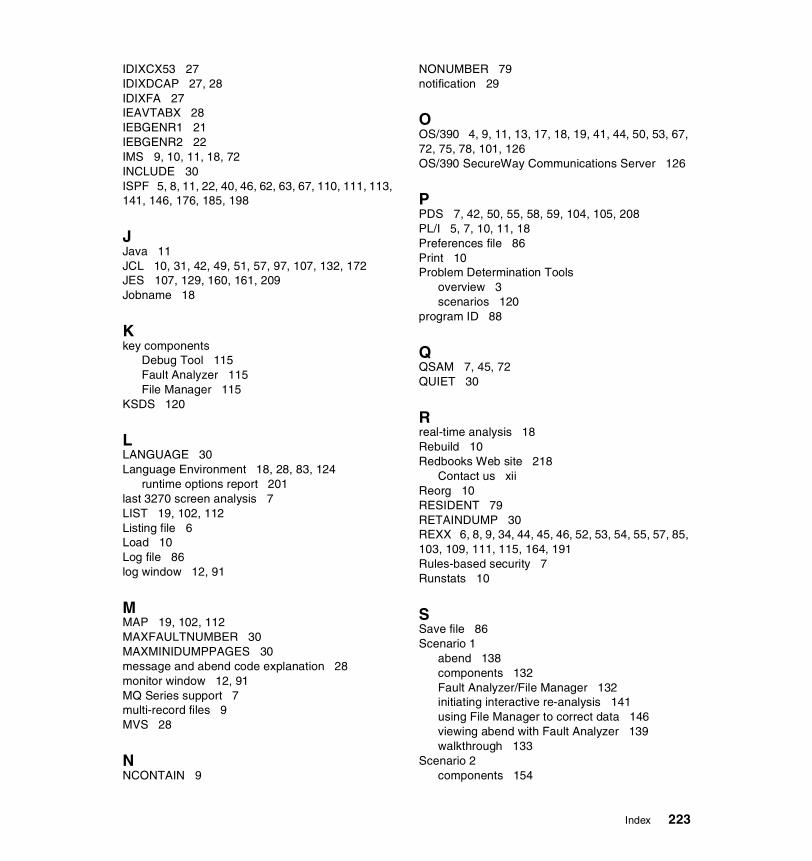
IDIXCX53 27IDIXDCAP 27, 28IDIXFA 27IEAVTABX 28IEBGENR1 21IEBGENR2 22IMS 9, 10, 11, 18, 72INCLUDE 30ISPF 5, 8, 11, 22, 40, 46, 62, 63, 67, 110, 111, 113, 141, 146, 176, 185, 198
JJava 11JCL 10, 31, 42, 49, 51, 57, 97, 107, 132, 172JES 107, 129, 160, 161, 209Jobname 18
Kkey components
Debug Tool 115Fault Analyzer 115File Manager 115
KSDS 120
LLANGUAGE 30Language Environment 18, 28, 83, 124
runtime options report 201last 3270 screen analysis 7LIST 19, 102, 112Listing file 6Load 10Log file 86log window 12, 91
MMAP 19, 102, 112MAXFAULTNUMBER 30MAXMINIDUMPPAGES 30message and abend code explanation 28monitor window 12, 91MQ Series support 7multi-record files 9MVS 28
NNCONTAIN 9
NONUMBER 79notification 29
OOS/390 4, 9, 11, 13, 17, 18, 19, 41, 44, 50, 53, 67, 72, 75, 78, 101, 126OS/390 SecureWay Communications Server 126
PPDS 7, 42, 50, 55, 58, 59, 104, 105, 208PL/I 5, 7, 10, 11, 18Preferences file 86Print 10Problem Determination Tools
overview 3scenarios 120
program ID 88
QQSAM 7, 45, 72QUIET 30
Rreal-time analysis 18Rebuild 10Redbooks Web site 218
Contact us xiiReorg 10RESIDENT 79RETAINDUMP 30REXX 6, 8, 9, 34, 44, 45, 46, 52, 53, 54, 55, 57, 85, 103, 109, 111, 115, 164, 191Rules-based security 7Runstats 10
SSave file 86Scenario 1
abend 138components 132Fault Analyzer/File Manager 132initiating interactive re-analysis 141using File Manager to correct data 146viewing abend with Fault Analyzer 139walkthrough 133
Scenario 2components 154
Index 223

Debug Tool in foreground 163tracking a problem 158using Debug Tool/batch mode 160walkthrough 155
Scenario 3components 172File Manager/DB2 and Debug Tool 171tracking a problem 174using Debug Tool 179using File Manager/DB2 185viewing data in File Manager/DB2 176walkthrough 173
Scenariosapplications set up 124components 205demo code 215demo file installation 123overview 120programs overview 120system configuration 125validate installation/configuration 127
security 7separate debug file 13, 94SEPARATE debug file (side file) 86side file 6, 19, 22, 102, 103SOURCE 19, 79, 102, 112source window 12, 91SQL 10subsystem security 7SYSABEND 28SYSMDUMP 28SYSUDUMP 28
TTALLY 9Templates 8, 61terminal ID 88TEST 14trace table analysis 7transaction ID 88TSO 35, 83, 85, 87, 163, 208, 216TSO Call Access Facility 87
UUNIX 18user acceptance test 42, 107user exits 6User ID 18
user ID 88
VVM 11, 13, 19, 75, 78, 101VSAM 7, 38, 41, 42, 46, 47, 50, 51, 72, 120, 138, 146, 155, 207
XXMIT 44XPCABND 27XREF 19, 102, 112
Zz/OS 4, 9, 11, 17, 18, 41, 72
224 Introduction to the IBM Problem Determination Tools

(0.2”spine)0.17”<->0.473”
90<->249 pages
Introduction to the IBM Problem
Determination Tools


®
SG24-6296-00 ISBN 0738423408
INTERNATIONAL TECHNICALSUPPORTORGANIZATION
BUILDING TECHNICALINFORMATION BASED ONPRACTICAL EXPERIENCE
IBM Redbooks are developed by the IBM International Technical Support Organization. Experts from IBM, Customers and Partners from around the world create timely technical information based on realistic scenarios. Specific recommendations are provided to help you implement IT solutions more effectively in your environment.
For more information:ibm.com/redbooks
Introduction to theIBM ProblemDetermination Tools
Overview of the Problem Determination Tools offering
Introduction to Fault Analyzer, File Manager, Debug Tool
Hints and tips for using the tools
This IBM Redbook describes the IBM Problem Determination Tools and includes scenarios that show how to use the tools to recognize, locate, and fix applications. The products included in this suite of tools are:
IBM Fault Analyzer, which helps you find the cause of abends in application programs. You can use it for problem determination while developing application programs or while they are in production.
IBM File Manager, which provides powerful functions for you to use as an application developer or system support person. Utilities provide the ability to:-Browse or update VSAM data, tape, or disk volumes-Define, display, change, and delete catalog entries-Search data sets and records for specific data-Manipulate DB2 data and IMS data
IBM Debug Tool, which is a robust, interactive source-level debugging tool. It helps you examine, monitor, and control the execution of programs written in C/C++, COBOL, PL/I, or Java (each compiled with the appropriate IBM compiler) on a z/OS, OS/390, MVS, or VM system. Debug Tool supports debugging of applications in various subsystems including CICS, IMS, and DB2.
Back cover