introduction to the european monitoring and evaluation programme
TRANSCRIPT

Atmos. Chem. Phys., 12, 5447–5481, 2012www.atmos-chem-phys.net/12/5447/2012/doi:10.5194/acp-12-5447-2012© Author(s) 2012. CC Attribution 3.0 License.
AtmosphericChemistry
and Physics
Introduction to the European Monitoring and EvaluationProgramme (EMEP) and observed atmospheric compositionchange during 1972–2009
K. Tørseth, W. Aas, K. Breivik, A. M. Fjæraa, M. Fiebig, A. G. Hjellbrekke, C. Lund Myhre, S. Solberg, andK. E. Yttri
NILU – Norwegian Institute for Air Research, P.O. Box 100, 2027 Kjeller, Norway
Correspondence to:K. Tørseth ([email protected])
Received: 31 December 2011 – Published in Atmos. Chem. Phys. Discuss.: 19 January 2012Revised: 16 May 2012 – Accepted: 3 June 2012 – Published: 22 June 2012
Abstract. European scale harmonized monitoring of atmo-spheric composition was initiated in the early 1970s, andthe activity has generated a comprehensive dataset (avail-able at http://www.emep.int) which allows the evaluationof regional and spatial trends of air pollution during a pe-riod of nearly 40 yr. Results from the monitoring madewithin EMEP, the European Monitoring and Evaluation Pro-gramme, show large reductions in ambient concentrationsand deposition of sulphur species during the last decades.Reductions are in the order of 70–90 % since the year 1980,and correspond well with reported emission changes. Alsoreduction in emissions of nitrogen oxides (NOx) are reflectedin the measurements, with an average decrease of nitrogendioxide and nitrate in precipitation by about 23 % and 25 %respectively since 1990. Only minor reductions are howeverseen since the late 1990s. The concentrations of total nitratein air have decreased on average only by 8 % since 1990, andfewer sites show a significant trend. A majority of the EMEPsites show a decreasing trend in reduced nitrogen both in airand precipitation on the order of 25 % since 1990. Deposi-tion of base cations has decreased during the past 30 yr, andthe pH in precipitation has increased across Europe. Largeinter annual variations in the particulate matter mass concen-trations reflect meteorological variability, but still there is arelatively clear overall decrease at several sites during thelast decade. With few observations going back to the 1990s,the observed chemical composition is applied to documenta change in particulate matter (PM) mass even since 1980.These data indicate an overall reduction of about 5 µg m−3
from sulphate alone. Despite the significant reductions in sul-
phur emissions, sulphate still remains one of the single mostimportant compounds contributing to regional scale aerosolmass concentration. Long-term ozone trends at EMEP sitesshow a mixed pattern. The year-to-year variability in ozonedue to varying meteorological conditions is substantial, mak-ing it hard to separate the trends caused by emission changefrom other effects. For the Nordic countries the data indi-cate a reduced occurrence of very low concentrations. Themost pronounced change in the frequency distribution is seenat sites in the UK and the Netherlands, showing a reductionin the higher values. Smaller changes are seen in Germany,while in Switzerland and Austria, no change is seen in thefrequency distribution of ozone. The lack of long-term dataseries is a major obstacle for studying trends in volatile or-ganic compounds (VOC). The scatter in the data is large, andsignificant changes are only found for certain componentsand stations. Concentrations of the heavy metals lead andcadmium have decreased in both air and precipitation dur-ing the last 20 yr, with reductions in the order of 80–90 % forPb and 64–84 % for Cd (precipitation and air respectively).The measurements of total gaseous mercury indicate a dra-matic decrease in concentrations during 1980 to about 1993.Trends in hexachlorocyclohexanes (HCHs) show a signifi-cant decrease in annual average air concentrations. For otherpersistent organic pollutants (POPs) the patterns is mixed,and differs between sites and between measurements in airversus precipitation.
Published by Copernicus Publications on behalf of the European Geosciences Union.

5448 K. Tørseth et al.: Introduction to the European Monitoring and Evaluation Programme (EMEP)
1 Introduction
A European network of monitoring sites to quantify input ofnutrients to agricultural areas was established in 1947 (Eg-ner et al., 1955; Rohde and Granat, 1984). Swedish scien-tists later discovered that the observed acidity in precipita-tion gradually increased and posed the hypothesis that an-thropogenic emissions of sulphur could adversely impactnatural ecosystems even distant from source regions (Oden,1968). This formed the basis for a coordinated research ef-fort during the period 1972–1977 to study long range trans-port of air pollutants. The activity was coordinated througha project funded by the Organisation for Economic Co-operation and Development (OECD, 1977). A new measure-ment station network was established and, combined withemissions inventories (Semb, 1978) and model calculations(Eliassen, 1978), transboundary fluxes of acidifying pollu-tants were proven to be significant. Political consensus wasreached on the need for an international coordinated actionand this subsequently led to the establishment of the Con-vention on Long Range Transboundary Air Pollution (CLR-TAP) in 1979. The network of monitoring sites establishedfor the OECD project was later continued under the Euro-pean Monitoring and Evaluation Programme (EMEP), andthe program itself was extended to include a wide range ofsubstances which are subject to atmospheric transport acrossnational boundaries.
The main objective of EMEP is to provide governmentswith information of the deposition and concentration of airpollutants, as well as the quantity and significance of thelong-range transmission of air pollutants and their fluxesacross boundaries (UNECE, 2004a). The EMEP observa-tions include measurements of species linked to acidifica-tion, eutrophication, photochemical oxidants, heavy metals,persistent organic pollutants, and particulate matter. Most ofthe substances included in the EMEP monitoring programare also fundamental for improving the knowledge of climatechange and both local and urban air quality. Obviously, themeasurements need to be made in a comparable way at allsites and consistent in time to allow the assessment of tem-poral and spatial trends. The Chemical Coordinating CentreEMEP (EMEP-CCC) was established at NILU (NorwegianInstitute for Air Research) in 1977 to harmonize these ef-forts. An overview of the development of the main EMEPmeasurement program is illustrated in Fig. 1. The measure-ments are widely used by the scientific community, and haveserved as a basis for an extensive number of scientific studiesduring nearly 40 yr. A major objective of this paper is thusto present and document the EMEP observation network andhow it serves as a lead programme for addressing air quality,atmospheric composition change and transboundary fluxesof harmful substances.
The monitoring activity is supplemented with develop-ment of emission inventories, modelling of atmosphericchemistry transport and deposition, and with integrated as-
sessment modelling including projections to develop costefficient measures. This supports legally binding protocolsaiming to reduce environmental impacts on ecosystems, hu-man health and materials. The EMEP protocol (one of theeight protocols under CLRTAP, see Fig. 1) specifies commit-ments of its parties including the funding of technical centreswhich support the activities defined by the workplan. Partiesare further obliged to implement the monitoring program asdefined by the EMEP monitoring strategy (UNECE, 2009).An introduction to the history and the activities undertakenby CLRTAP can be found in UNECE (2004b). The mon-itoring concept established by EMEP is similar to what isserving similar monitoring efforts outside the European re-gion, including North America (NADP, IMPROVE, CAP-MoN and others), South East Asia (EANET), Africa (Debits)and South Asia (Male Declaration) (Tørseth, 2008). Theseregional programs are contributing to the WMO Global At-mosphere Watch (GAW) programme. In December 2004, theEMEP Task Force on Hemispheric Transport of Air Pollu-tion (TF HTAP) was established as a response to the in-creasing scientific evidence of the importance of intercon-tinental transport of air pollutants. Since its first meeting inJune 2005, the TF HTAP has organized a series of projectsand collaborative model experiments designed to advancethe state-of-science related to the intercontinental transportof ozone, particulate matter, mercury, and persistent organicpollutants (HTAP, 2010).
Since EMEP was established, knowledge about air pol-lution has greatly increased, and as a result of legislation,economical and technological changes, emission source dis-tribution and source strengths have undergone significantchanges. Independent measurements are still required to as-sess atmospheric pollution in general and the effect of abate-ment measures in particular. In addition to monitoring trends,information on atmospheric processes is of key importanceto validate and further develop models (e.g. Simpson et al.,2012; Travnikov et al., 2012). Certain EMEP sites operat-ing advanced instrumentation have documented their impor-tance as a distributed research infrastructure and have therebyqualified for support from the EC and from national researchcouncils. Examples of such infrastructures projects includethe European Supersites for Atmospheric Aerosol Research(EUSAAR) addressing aerosols (Philippin et al., 2009), theAerosols, Clouds, and Trace gases Research InfraStructureNetwork (ACTRIS) addressing aerosols and reactive gases(http://www.actris.net), and the Integrated non-CO2 Green-house Gas Observing System (InGOS) for non-CO2 green-house gases (http://www.ingos-infrastructure.eu/). In theseEU-projects, support is given to improve methodologies andsupport access to sites and distribution of data to broad usercommunities. This is an important link to scientific commu-nities and contributes to further development of the EMEPprogram. The basic monitoring however is founded in obli-gations to the international conventions CLRTAP/EMEP andWMO-GAW, and relies on national funding.
Atmos. Chem. Phys., 12, 5447–5481, 2012 www.atmos-chem-phys.net/12/5447/2012/

K. Tørseth et al.: Introduction to the European Monitoring and Evaluation Programme (EMEP) 5449
Fig. 1.Development of the measurement programme. Bars represent the number of parties/countries submitting data according to the level-1and level-2 monitoring requirements, respectively. Lines indicate the number of sites for which measurements of the various variables havebeen measured (g)= gaseous, (a)= aerosol, AN= NH3+NH+
4 and/or HNO3+NO−
3 .
This paper gives an overview of the monitoring withinEMEP and presents main findings from the program. Re-sults are presented and discussed in the following chaptersaccording to the themes addressed by CLRTAP. We docu-ment the main development of the monitoring program withfocus on selected spatial and temporal trends. EMEP has re-cently started the preparation of an assessment report studywhich will be aimed at analyzing the links between observedtrends and emission changes. National experts will be givena major role in that study whereas in the present paper wehave a broader and more subjective perspective. As a back-ground we refer to the previous EMEP assessment report(Lovblad et al., 2004) which presented an analysis of thefirst 25 yr of measurement data. In Table 2 we list a num-ber of recent publications addressing regional scale trendsof European air pollution. This paper is based on the data re-ported to the EMEP database. These data have been validatedthrough a quality assurance/quality control process involvingthe individual institutions responsible for the different sitesand the EMEP-CCC as documented by the reports availablein the EMEP-CCC series (www.emep.int). Other papers inthe present EMEP ACP Special Issue present more in-depthanalysis of specific datasets.
2 Observational network and quality assurance
The EMEP monitoring sites are located such that significantlocal influences (local emission sources, local sinks, topo-graphic features, etc.) are minimised. The basic idea is thatthe data should be representative for a larger region. The
site criteria are defined in the EMEP manual (EMEP/CCC,2001), and the sites are classified as regional or global. Al-though the goal is to avoid that local sources unduly affect theobservations, this can not be realized in an absolute sense.The major focus has been to avoid influence from signifi-cant industrial or transport related sources resulting in a net-work of rural sites (the siting criteria was originally basedon recommendations outlined by WMO, 1974). Sites will toa varying degree be influenced by local and regional agri-cultural activities, various natural sources as well as otherlocal sources (i.e. ammonia, pesticides, carbonaceous ma-terial, mineral dust etc.). A site which has a large spatialrepresentativity for one given chemical compound may thushave low representativity for another variable. For an up-dated discussion on site representativity we refer to Henneet al. (2010) and references therein. In general one can as-sume that EMEP sites in general do represent the regionalscale atmospheric composition, but for more in-depth studiesof individual datasets, we recommend to also take additionalmetadata information into account. The observational dataare reported to the EMEP-CCC every year with a time lagof 1.5 yr (e.g. Hjellbrekke and Fjæraa, 2011, and referencestherein).
The EMEP monitoring focuses on species and parame-ters which are important for understanding the sources andexposure/fluxes of pollutants as well as to understand atmo-spheric processes in general. Data for more than 600 differ-ent variables have been reported to the EMEP database atEMEP-CCC (http://ebas.nilu.no), and the number is contin-uously growing (see Fig. 1) as new methodologies become
www.atmos-chem-phys.net/12/5447/2012/ Atmos. Chem. Phys., 12, 5447–5481, 2012

5450 K. Tørseth et al.: Introduction to the European Monitoring and Evaluation Programme (EMEP)
Table 1. General overview of the EMEP monitoring program for the period 2009-2020, (UNECE, 2009).
Level-1 Level-2 supersites
– Main inorganic components in precipitationand in air
– Heavy metals in precipitation– Ozone– Gas particle nitrogen ratios (low cost)– PM10 and PM2.5 mass– Meteorology
– PM composition (EC/OC, mineral dust)– Aerosol physical and optical properties– CH4– Tracers (CO and halocarbons)– POPs in air and precipitation– Heavy metals in air– VOC– + all level-1 components
available, and new environmental challenges are identified.The EMEP monitoring obligations are defined by the EMEPmonitoring strategy (UNECE, 2009). The monitoring pro-gram is now built on activities assigned to three so-calledlevels. Level-1 consists of basic, well-established methodssuch as the monitoring of S- and N-deposition, ozone con-centrations etc. Level-1 variables are measured at a fairlylarge number of sites. More advanced measurements are car-ried out at a subset of the sites, the so-called level-2 super-sites, and is normally undertaken by scientific institutions.The level 2 sites are normally also part of the Global Atmo-sphere Watch program. An overview of the mandatory mon-itoring programme of EMEP is given in Table 1. In addition,EMEP makes use of data from research campaigns (level-3monitoring) and other specific data relevant for understand-ing atmospheric processes. These research campaigns are of-ten coordinated through the EMEP intensive measurementperiods (Aas et al., 2012). The EMEP Task Force on Mea-surements and Modelling plays a central role in involvingnational experts in the development of the EMEP operationalactivities, including the monitoring strategies.
Ideally, the spatial density of sites should reflect the gradi-ents in the air concentrations and deposition fluxes. The im-plementation of an adequate monitoring program has how-ever been difficult in some regions. At present there is a par-ticular need for more sites in the Mediterranean area and inthe EECAA (Eastern Europe, Caucasus and Central Asia) re-gion. Furthermore, a sufficiently short time resolution of themeasurements is needed to allow an assessment of the at-mospheric sources and processes. Hourly data are seen asideal and feasible for some species (like ozone) whereasdaily samples are requested for other variables where sucha high time resolution is not realistic for economic or prac-tical reasons (like aerosol chemical composition and wet de-position of N and S). A time resolution longer than one daywill normally inhibit process studies and the establishmentof source-receptor relationships since the origin and historyof the air masses will be masked. Some species or param-eters are however expensive to measure and a longer sam-pling time may be acceptable. As the technology is devel-oped, measurements with improved time resolution are be-
Table 2. Overview of some recent publications that have usedEMEP data to assess air pollution trends in Europe. In addition thereare a large number of studies which have made assessments basedon national networks or individual measurement sites.
Regional scale trend assessments Subject
Konovalov et al. (2008) Nitrogen oxidesFagerli and Aas (2008) Sulphur and nitrogenHole et al. (2009) Sulphur and nitrogenDayan and Lamb (2005) DepositionBaldsano et al. (2005) Air qualityLovblad et al. (2004) All subjectsBarmpadimos et al. (2012) Particulate matter massWilson et al. (2012) OzoneMonteiro et al. (2012) OzoneColette et al. (2011) Ozone, NO2, PMEEA (2009) OzoneJonson et al. (2006) OzoneVautard et al. (2006) OzoneOltmans et al. (2006) OzoneOrdonez et al. (2005) OzoneSolberg et al. (2005) OzoneSolberg et al. (2001) FormaldehydeHarmens et al. (2010) Heavy metalsHeimburger et al. (2010) Trace metalsPacyna et al. (2009) Mercury, lead, cadmiumWangberg et al. (2007) MercuryKock et al. (2005) MercurySlemr and Scheel (1998) MercurySchuster et al. (2011) PCBs, PBDEsHung et al. (2010) POPsSchuster et al. (2010) PCBsBecker et al. (2008) HCHsDvorska et al. (2008) POPsHoloubek, et al. (2007) POPsAudrone (2006) Benso(a)pyreneBarber et al. (2005) Hexachlorobenzene
coming available (Laj et al., 2009), and EMEP’s strategicgoal is to take benefit from such developments by encour-aging researchers to take part in the monitoring programme.
The monitoring methods used in EMEP are chosen basedon a compromise between several criteria: a sufficient
Atmos. Chem. Phys., 12, 5447–5481, 2012 www.atmos-chem-phys.net/12/5447/2012/
K. Tørseth et al.: Introduction to the European Monitoring and Evaluation Programme (EMEP) 5451
precision is needed at low concentration levels, and themethod should be robust and simple to apply in the field. Ifadequate international standards are available from ComiteEuropeen de Normalisation (CEN) or WMO, EMEP seeks toapply the same criteria. There are some exceptions, for ex-ample if CEN standards are mainly targeting measurementsof air quality in urban areas, the methods may be inade-quate at EMEP sites having low concentrations. Where ref-erence methods are not available, EMEP has developed itsown methodologies through the competence of national ex-perts contributing to the programme. In addition to appliedreference methods and standard operation procedures, EMEPconducts laboratory- and field intercomparison of most com-ponents defined by the monitoring programme. Some speciesare tested annually, i.e. sulphur, nitrogen (Uggerud and Hjell-brekke, 2011a), heavy metals (Uggerud and Hjellbrekke,2011b) and EC/OC (Cavalli and Putaud, 2011), while othersare intercompared more sporadically, i.e. POPs (Schlabachet al., 2011). Field intercomparisons are an important part ofthe quality assurance programme in EMEP to document theoverall uncertainty in the methods used; i.e. for main compo-nents in air (Aas et al., 2007) and deposition of heavy metals(Aas et al., 2009).
Data analysis and statistical methods
The data used in this work is based on public data avail-able in the EMEP database (http://ebas.nilu.no). The EMEPdatabase web interface also offers additional meta infor-mation related to the individual data sets available in thedatabase. This study has focused on time series and siteswhich offer consistent long-term information and a data cap-ture satisfying criteria listed below. Coordinates for sitesspecifically presented in this study are given in Appendix A.For continuous measurements a data capture of 75 % on anannual basis has been required to calculate annual statis-tics; for non-continuous measurements such as heavy met-als, VOC and POPs, the requirement is that at least ninemonths with data are available. Annual means of componentsin precipitation are volume weighted, and concentrations be-low the detection limit have been set equal to one half ofthe actual limit. Further details on how the data are treatedare found in the annual data reports (i.e. Hjellbrekke andFjæraa, 2011). For the statistical analysis, the non-parametric“Mann-Kendall Test” has been used on annual means fordetecting and estimating trends (Gilbert, 1987). The Mann-Kendall test has become a standard method when missingvalues occurs and when data are not normally distributed. Inparallel to this, the Sen’s slope estimator has been used toquantify the magnitude of potential trends. Thus, the Sen’sslope is used to estimate the percent reduction in the con-centration level while the Mann-Kendall test is used to in-dicate the significance level of the trend. Statistical calcu-lations have been carried out using the MAKESENS soft-ware (Salmi et al., 2002) which was developed to be used
for the previous EMEP assessment (Lovblad et al., 2004). InMAKESENS a two tailed test is used for four different sig-nificance levels (α: 0.1, 0.05, 0.01 and 0.001). In this workwe have included all these confidence levels when definingwhether the trend is significant or not. The average per centchange and standard deviation are calculated for all the sites,and not only for those with a significant trend.
In estimating the per cent change per decade for sulphurcompounds (see Fig. 2), we first estimated representative val-ues for each of the years 1980, 1990, 2000 and 2009. Thesevalues were then used to calculate a percent change from onereference year to another. Only sites with measurements forthe whole period and in all media (gas, aerosol and precipita-tion) were included, 14 in all. The estimated concentrationswere calculated using the following approach:
– X1980: Sen’s slope estimate based on theperiod 1980–2009.
– X1990: Sen’s slope estimate based on theperiod 1990–2009.
– X2000: Average of the measured values for the threeyears 1999–2001.
– X2009: Sen’s slope estimate based on theperiod 1990–2009.
A similar procedure was used for reduced- and oxidized ni-trogen, but due to less data available during the 1980, theanalysis was based on data from 1990 only. In contrary tosulphur, there are relatively few sites with concurrent mea-surements of reduced and oxidized nitrogen in both air andprecipitation (Fagerli and Aas, 2008), and for decadal trendswe have chosen to use measurements from all long term mea-surement sites even if there are only measurements in eitherair or precipitation.
All emission changes referred to were calculated from theofficial EMEP emission data which also are used as input forthe EMEP models (EMEP/CEIP, 2011). Only emission datafrom the previous EMEP geographical domain (the domainwas extended in 2008 as described inhttp://www.emep.int/grid/griddescr.html) has been used to ensure comparable datafor the complete time period. Emissions data used for trendanalysis are presented in Appendix B.
3 Major inorganic compounds
3.1 Introduction
Major inorganic compounds include about 30 differentsulphur-, nitrogen- containing compounds, base cations andsea salts present as gases, particles or dissolved in precipita-tion. Their effects on the environment occur through a rangeof processes including acidification (sulphur, nitrogen andbase cations), eutrophication (nitrogen), impact on materi-als and human health (particulate matter). The observations
www.atmos-chem-phys.net/12/5447/2012/ Atmos. Chem. Phys., 12, 5447–5481, 2012

5452 K. Tørseth et al.: Introduction to the European Monitoring and Evaluation Programme (EMEP)
Fig. 2. Average observed reduction in sulphur and nitrogen components compared to the emission reductions in Europe for the different tenyears period from 1980 for sulphur and 1990 for nitrogen. Sulphur trends are calculated from the 14 sites with measurements of all threecomponents since 1980, while for nitrogen the same number of sites, as shown in Table 3, are used, and it is not necessarily the same siteused for all the components.
of inorganic compounds remain a key activity of EMEP, andtime series now extend over nearly 40 yr. Measurements aremade of both air and precipitation samples.
Sulphur and nitrogen deposition causing acidification andeutrophication of ecosystems, rivers and lakes is well docu-mented in the literature throughout the last four decades (Ot-tar et al., 1984; WGE, 2011; Slootweg et al., 2010; Lorenzand Granke, 2009; Skjelkvale et al., 2005). The excess de-position above the critical load for acidity (defined as “Aquantitative estimate of an exposure to one or more pollu-tants below which significant harmful effects on specifiedsensitive elements of the environment do not occur accord-ing to present knowledge”) has been significantly reducedsince 1980. The European area at risk of acidification was11 % in 2000 (Slootweg et al., 2010) and is expected to dropto 4 % by 2020 based on current legislated emission reduc-tion targets (WGE, 2011). Parts of Scandinavia are likely tobe exposed to acidic deposition at a level requiring contin-ued liming of fresh water systems in order to avoid fish deathunless further reductions are agreed. Eutrophication on theother hand will continue to be a major environmental prob-lem in Europe. The risk of eutrophication will affect about40 % of the natural area in Europe in 2020 under the currentbaseline scenario (WGE, 2011; Slootweg et al., 2010). A Eu-ropean nitrogen assessment was recently published (Suttonet al., 2011), describing the various nitrogen sources and thecascade of effects ranging from pollution of air, water andsoil to climate change and reduction of biodiversity. Further-more, even if acidification due to sulphur is being reduced,sulphur remains an environmental problem since sulphate isa major aerosol constituent, which is important for humanhealth and climate forcing.
3.2 Spatial distribution
The monitoring network within the OECD project only cov-ered parts of central Europe, UK and Scandinavia. Sulphurwas measured at all sites, whereas other components weremeasured only at less than one third of the sites. By 2009 thenetwork covered the whole of Europe as well as areas in Cen-tral Asia and Caucasus. Still, the number of monitoring sitesin Eastern Europe is considered inadequate (e.g. Tørseth andHov, 2003; UNECE, 2009). The development in the numberof sites as well as the change in measured concentrations canbe seen in Fig. 3. In 2009, 127 sites reported data for at leastone component in air or precipitation, and 90 of these per-formed measurements of main ions in precipitation.
The highest concentrations of non-sea-salt (nss) sulphate(sulphate corrected for the contribution from sea salt) in pre-cipitation in 2009 were 0.7–1.0 mg S l−1 in Serbia and East-ern Europe. The lowest concentrations (∼ 0.1 mg S l−1) wereobserved in Scandinavia (Hjellbrekke and Fjæraa, 2011). Thespatial patterns of nss S concentration in precipitation andwet deposition in Europe are fairly similar. However, oro-graphic effects lead to distinct local maxima in wet depo-sition. Sites in southern Norway and the region around theAlps typically experience high wet deposition due to highannual precipitation amounts. The concentrations of SO2 andSO2−
4 in air are similar to the distribution of sulphate in pre-cipitation although somewhat more heterogeneous (airborneconcentrations of SO2−
4 have not been corrected for the seasalt contribution since the measurement programme only re-cently has been extended to include the determination ofNa+, Mg2+ or Cl− allowing such corrections). The high-est levels of sulphate in aerosols in 2009 were observed inAustria, Poland, Hungary and Lithuania. Relatively high lev-els were also found at sites in Spain, the Netherlands andCyprus. Furthermore, very high levels of SO2 were mea-sured in Macedonia and Serbia with concentration levels of
Atmos. Chem. Phys., 12, 5447–5481, 2012 www.atmos-chem-phys.net/12/5447/2012/

K. Tørseth et al.: Introduction to the European Monitoring and Evaluation Programme (EMEP) 5453
Fig. 3.Annual mean concentrations of SO2−
4 in aerosols from 1974
to 2009. Unit: µg S m−3.
7–9 µg S m−3 which is four times higher than typically foundat sites in Central Europe (Hjellbrekke and Fjæraa, 2011).
The highest concentrations of total inorganic nitrate ionsin precipitation in 2009 were in the order of 1–2 mg N l−1
(Hjellbrekke and Fjæraa, 2011). These levels are typicallyseen in regions with high population density and associatedemissions from traffic or power generation (EMEP/CEIP,2011), like sites in Germany, Czech Republic, Poland andDenmark. The lowest concentrations (< 0.4 mg N l−1) wereobserved in the outskirts of Europe, i.e. Scandinavia, Irelandand Portugal. Wet deposition of nitrogen ranged from lessthan 1 kg N ha−1 yr−1 to more than 20 kg N ha−1 yr−1. Onaverage, the reduced and oxidized nitrogen contribute ap-proximately with equal amounts to the total N deposition.However, in the Benelux area and in Ireland, the contributionof ammonium deposition exceeds that of nitrate, reflectingregional agricultural sources of ammonia. In contrast, wetdeposition of oxidized nitrogen is generally somewhat higherthan reduced nitrogen in Scandinavia and the Mediterranean,except for a few sites influenced by nearby agriculture.
The air concentrations of NO2 are highest around themajor emission sources, and during 2009, levels exceeding4 µg N m−3 were seen in the Benelux area, Italy and Greece,whereas levels of the order of 3 µg N m−3 were observed insoutheast UK (Hjellbrekke and Fjæraa, 2011). Relatively lowconcentrations of NO2 are seen in Spain, and the lowest lev-els (less than 0.5 µg N m−3) are observed in Scandinavia. Theair concentrations of the other gaseous and particulate nitro-gen compounds show a more scattered pattern. The highestsum of nitric acid+ nitrate (above 1 µg N m−3) was observedat sites in France, Austria and Switzerland, while for sum ofammonia+ ammonium concentrations above 2 µg N m−3 areseen in Switzerland, Czech Republic, Italy, Austria, Hungaryand France (Hjellbrekke and Fjæraa, 2011).
Knowledge of the nitrogen dry deposition fluxes is im-portant for understanding the observed ambient trends. Fur-ther, in order to quantify effects on ecosystems, one clearlyneeds to quantify the dry deposition flux (e.g. Sutton et al.,2011). Monitoring of dry deposition fluxes is however a re-cent addition to the EMEP monitoring program, and has sofar mainly been made in relation to research projects. In par-ticular, the European Union integrated project NitroEurope,has established a network of advanced flux measurements ata few selected sites together with a regional scale network oflow cost denuders (Skiba et al., 2009). These measurementshave been combined with various inferential models to cal-culate the dry deposition (Flechard et al., 2011). The resultsfrom these models show large differences in dry depositionflux estimates: whereas some methods gave values exceed-ing 30–40 kg N ha−1 yr−1 over parts of the Netherlands andBelgium, others gave∼ 20 kg N ha−1 yr−1 at the same sites(Flechard et al., 2011). These large differences illustrate thechallenge in estimating the dry deposition of nitrogen in Eu-rope.
Mineral dust is an important component with respect tocritical load since it counterbalances the acid deposition.The wet deposition of calcium in Europe is significantly in-fluenced by Saharan dust. Wet deposition rates exceeding10 kg Ca ha−1 yr−1 are observed at sites in Spain, Portugal,Italy, Serbia and Croatia (Hjellbrekke and Fjæraa, 2011).Sites with high precipitation amounts located close to thesea also experience high rates of wet deposition due to seasalt calcium. In Belarus the wet deposition of calcium ex-ceeds 10 kg N ha−1 yr−1 which may largely be due to anthro-pogenic emissions. It should be noticed, though, that the sitein Belarus uses a bulk collector (daily sampling), and thusa significant amount of dry dust deposition may be includedif the site is influenced by local Ca emissions. On the lowend of the scale several sites in Scandinavia receive less than1 kg Ca ha−1 yr−1 (Hjellbrekke and Fjæraa, 2011).
The pH value reflects the balance between acidic ions andbase cations. The lowest pH in Europe is observed in theEastern part of the continent which has a relatively highsulphate deposition and a low base cation deposition. The
www.atmos-chem-phys.net/12/5447/2012/ Atmos. Chem. Phys., 12, 5447–5481, 2012

5454 K. Tørseth et al.: Introduction to the European Monitoring and Evaluation Programme (EMEP)
Table 3. Average trends in concentration of major components in air and precipitation and the number of sites with significant trends inaccordance to Mann Kendall test for the periods 1980–2009 and 1990–2009 compared to the emission trends in Europe (EMEP/CEIP, 2011).
No. of sites Sites with sign. Trend Trends in conc Emission
Comp decrease increase Avg. SD trends
Trends 1980–2009
SO2 19 100 % 0 % −92 % 6 %−73 %SO4 air 19 95 % 0 % −70 % 20 %
nss SO4 in precipitation 21 100 % 0 % −80 % 11 %
NO2 8 88 % 0 % −48 % 26 %−31 %NO3 in precipitation 18 83 % 0 % −30 % 16 %
NH4 in precipitation 18 67 % 6 % −27 % 38 % −32 %
Ca in precipitation 10 80 % 0 % −47 % 29 %pH (as H+) in precipitation 22 91 % 0 % −74 % 20 %
Trends 1990–2009
SO2 31 90 % 0 % −75 % 25 %−65 %SO4 air 30 87 % 0 % −56 % 16 %
nss SO4 in precipitation 36 100 % 0 % −64 % 11 %
NO2 28 68 % 11 % −23 % 39 %−31 %sum NO3 air 19 42 % 5 % −8 % 30 %
NO3 in precipitation 36 69 % 0 % −25 % 13 %
sum NH4 air 20 75 % 15 % −24 % 56 %−29 %NH4 in precipitation 35 54 % 3 % −25 % 31 %
Ca precip 34 35 % 3 % −26 % 42 %pH (as H+) in precipitation 37 68 % 0 % −76 % 55 %
highest pH is observed in Spain and parts of Italy (Hjell-brekke and Fjæraa, 2011).
3.3 Temporal trends in concentration
During the OECD project (OECD, 1977), eleven participat-ing countries with totally fifty sites measured major ions inprecipitation, and SO2 and SO2−
4 in air, during 1972–1975.These data are included here together with the EMEP datawhich started in October 1977.
21 of the sites in operation during 2009 have time seriesextending back to 1980, while 36 extend back to 1990. Formeasurements of SO2 and SO2−
4 in air there are a similarnumber of stations. Nitrogen has been continuously mea-sured as ammonium and nitrate in precipitation at 18 sitesfrom 1980, while NO2 has been measured only at 8 sites.Measurements of gaseous nitrate and ammonium started laterand about 20 sites have continuous time series extendingback to 1990. Figure 4 illustrates the long-term data series ofdaily observations throughout this period. Figure 3 shows an-nual averages of sulphate in aerosols during the period from1974 to 2009. Table 3 gives an overview of the trend anal-
ysis for major ions in air and precipitation for the periods1980-2009 and 1990 to 2009. Figure 2 shows the trends inmeasurements for various sulphur and nitrogen componentsfor different decades. As seen from Table 3 and Fig. 2, Eu-rope has experienced large reductions in S emissions duringthe last decades. In the late 1970s, emission control programsstarted, including a number of measures like installation offlue gas desulphurization units at power plants and reductionof the sulphur content of fuel. The large reductions resultedhowever also from the changes in political and economicalsituation in Eastern Europe (Lovblad et al., 2004; Vestrenget al., 2007).
The reported emission reductions in sulphur dioxide andsulphate (Appendix B) were 73 % and 65 % from 1980 to2009 and from 1990 to 2009, respectively (EMEP/CEIP,2011). The EMEP monitoring results of sulphate in air andprecipitation reflect the emission changes throughout Eu-rope (Table 3). For SO2, trends indicate even larger reduc-tions than reported emission reductions, and a suggested ex-planation has been that the oxidizing capacity of the atmo-sphere may have remained unchanged while the amount of
Atmos. Chem. Phys., 12, 5447–5481, 2012 www.atmos-chem-phys.net/12/5447/2012/

K. Tørseth et al.: Introduction to the European Monitoring and Evaluation Programme (EMEP) 5455
Fig. 4. Time series of daily air concentrations of(a) SO2−
4 (unit: µg S m−3) at Birkenes, Norway,(b) NO2 (unit: µg N m−3) at Westerland,
Germany and(c) sum HNO3+NO−
3 , and(d) NH3+NH+
4 (unit: µg N m−3) at Vavihill, Sweden.
SO2 available for oxidation has become smaller (Lovblad etal., 2004). Further, the SO2 dry deposition rates may havechanged with time due to changes in the ambient ammoniaconcentrations (Fowler et al., 2009 and references therein).Data show that the average concentrations as well as the fre-quency and magnitude of sulphur peak episodes have de-creased. The trend is dominated by the trend in concentra-tions during winter (Lovblad et al., 2004).
Presently, the largest emission source of oxidised sul-phur in Europe is power generation (Vestreng et al., 2007;EMEP/CEIP, 2011). Emissions from international shipping
are of growing concern since they are not regulated in cur-rent protocols, and thus have a potential to counteract the re-duced land-based emissions (Dore et al., 2007; Cofala et al.,2007 and Eyring et al., 2010). In 2009, the ship emissionsaccounted for about 15 % of the total sulphur emissions inEurope (EMEP/CEIP, 2011).
There have also been quite substantial reductions in emis-sions of nitrogen oxides during the last decades (Vestreng etal., 2009; EMEP/CEIP, 2011). The variation from country tocountry is however larger for nitrogen compounds comparedto sulphur (Lovblad et al., 2004). The total NOx emissions
www.atmos-chem-phys.net/12/5447/2012/ Atmos. Chem. Phys., 12, 5447–5481, 2012

5456 K. Tørseth et al.: Introduction to the European Monitoring and Evaluation Programme (EMEP)
were fairly constant between 1980 and 1990, although aslight increase occurred in the land based emissions due toincreased traffic (Vestreng et al., 2009; Lovblad et al., 2004).From 1990 to 2009 the NOx emissions in Europe decreasedby 31 %, Table 3 (EMEP/CEIP, 2011) and most of this reduc-tion occurred in the first decade (Fig. 2). The reductions weremainly caused by a change from burning of coal and gas tonuclear power (Lovblad et al., 2004). The economic recoveryin Eastern Europe led to increased NOx emissions from roadtraffic in this area after 2000 (Vestreng et al., 2009). On theother hand, NOx emissions from traffic in Western Europeandecreased, even though fuel consumption increased.
The European trend of NOx emissions are reflected inthe measurements (Table 3). From 1990 to 2009, nitrogendioxide and nitrate in precipitation decreased, on average,by 23 % and 25 %, respectively. Most of these changes oc-curred in the first decade between 1990 and 2000 (Fig. 2).Interestingly, the concentrations of total airborne nitrate de-creased on average only 8 %, and fewer sites show a signifi-cant change (Table 3). These differences in trends can partlybe explained by a shift in equilibrium towards more par-ticulate ammonium nitrate relative to nitric acid caused bya reduction in sulphur dioxide emissions (Fagerli and Aas,2008). A more rapid oxidation of NOx may also have con-tributed (Monks et al., 2009). The total reduction in observedconcentrations of oxidized nitrogen compounds from 1980 to2009 is somewhat larger than from 1990 to 2009. A similartrend is not seen in the emission data, but the discrepancymay partly be explained by significant changes in the num-ber and location of sites when comparing the 1980s with themore recent years.
The total European ammonia emissions decreased by 29 %from 1990 to 2009 (Table 3) (EMEP/CEIP, 2011), thoughwith large regional differences. A majority of the EMEP sitesshow a decreasing trend both in air and precipitation, on av-erage 24–25 %. It should be noted that some EMEP sitesare, due to their location in rural districts, partly affected bylocal ammonia emissions. Concentrations were fairly con-stant from 1980 to 1990, consistent with the small reportedchanges in emissions during that period. The observed down-ward trends were somewhat larger during the period 1990–2000 compared to the period 2000–2009 (Fig. 2).
The deposition of base cations also decreased during thepast 30 yr (Table 3). A majority of the EMEP sites showeda decreasing trend of calcium in precipitation with an av-erage decrease of 47 % from 1980 to 2009 and 26 % from1990 to 2009 (Table 3). In the early 1990s, the closing ofmany lignite-fired power stations, iron and steel smelters aswell the implementation of effective abatement technologiesfor sulphur caused a reduction also in the emissions of basecations (Lovblad, 2004; Hellsten et al., 2007).
Since 1980, large areas have experienced an increase inpH in the order of 0.5–0.6 pH units, corresponding well withsulphur trends. Even though there has been a decrease in bothsulphate and base cations, the sulphate reductions have been
larger. Furthermore, nitrate has also been reduced. At the 22sites with long term pH measurements from 1980 to 2009 theaverage decrease in H+ concentration was 74 %, Table 3.
4 Particulate matter
4.1 Introduction to particulate mass measurements
Aerosols remains a major challenge to atmospheric sciencedue to their detrimental health effects and influence on theEarth’s radiative balance, and thus climate. On a worldwidebasis, the annual number of premature deaths caused by car-diovascular and pulmonary diseases following ambient airparticulate matter (PM) exposure is estimated to be in the or-der of 800 000 (World Health Organization (WHO), 2002).Furthermore, light-scattering aerosol such as sulphate masksthe observed warming from greenhouse gases with an un-known strength over the industrial era resulting in high un-certainty in the climate sensitivity (e.g. the temperature re-sponse of a doubling of CO2) (Forster et al., 2007). Duringthe last years, short-lived climate forcers, especially tropo-spheric ozone and black carbon – a light absorbing aerosolcomponent – have received increased attention. There is sci-entific confidence that mitigation and control of black carbonparticles and tropospheric ozone will have benefits both forhealth and climate change. Black carbon and troposphericozone have substantial regional and global climate impacts.According to a recent integrated assessment (UNEP/DEWA,2011), reducing black carbon and tropospheric ozone start-ing now will slow down the rate of climate warming signif-icantly within the first half of this century, with particularimportance for changes in the Himalayan and Arctic regions(UNEP/DEWA, 2011). The assessment indentifies a set ofmeasures, and full implementation of these would reduce fu-ture global warming by 0.5◦C (0.2–0.7◦C). This further em-phasises the importance of long term measurements and un-derstanding of these variables and their precursors, also inthe future. CLRTAP recently established a “Working Groupon Black Carbon” to address the inclusion of BC as a com-ponent of PM in the process of the revision of the Gothen-burg Protocol. EMEP observations include both elementalcarbon (EC) (based on thermo-optical analysis, giving a mea-sure of the mass concentration) and “black carbon” (based onthe absorption of light using spectroscopic methods, giving ameasure of the aerosol optical properties). EC measurementshave been part of the level-2 programme since 2004, andBC measurements were introduced at level-2 in 2010 (thiswas previously a level-3 activity) albeit time series extendfurther back. While aerosol chemistry had been a key vari-able of EMEP since its initiation, an increased concern aboutpublic health led to the first strategic discussions of includ-ing particulate mass measurements at a joint EMEP/WMOworkshop in 1997 (EMEP-WMO, 1997), and which was fol-lowed up with a more in depth workshop in Interlaken in
Atmos. Chem. Phys., 12, 5447–5481, 2012 www.atmos-chem-phys.net/12/5447/2012/

K. Tørseth et al.: Introduction to the European Monitoring and Evaluation Programme (EMEP) 5457
1999 (EMEP-WMO, 2000; Lazaridis et al., 2002). The needfor more detailed optical and physical characterisation ofaerosols in order to address their impact on the radiative bal-ance and climate system is essential and was adopted (Kah-nert et al., 2004) by EMEP and included in monitoring strat-egy for 2004–2009. The measurements of physical and opti-cal parameters – including those of BC – will however not bediscussed here.
The guidelines for particle mass measurements in EMEPhave been harmonized with what has been specified in theEU’s air quality directives (EU, 1999, 2008) and the stan-dards developed in CEN (1999, 2005). The initial priority ofEMEP was to measure PM10, and the oldest aerosol massmeasurements in EMEP from Switzerland, Czech Republicand Great Britain started in 1996 and 1997. In addition, atseveral sites mainly in Germany and Switzerland, there arevery old measurements for total suspended particulate mat-ter (TSP) all the way back to 1977 (additional data are avail-able from national networks, but here only data from back-ground sites being reported to EMEP are considered). Themethodologies for these measurements are poorly described,and the size cut off is unknown, and therefore these data aredifficult to use for quantification of the mass load, but thesemeasurements are valuable indicators of temporal changes inPM mass concentrations.
The number of sites measuring PM10 and PM2.5 hassteadily increased throughout the last decade. For 2009, massconcentrations of PM are reported for 65 regional or globalbackground sites (61 for PM10; 40 for PM2.5 and 6 for PM1)
(Fig. 1, Hjellbrekke and Fjæraa, 2011; EMEP, 2011). Eventhough the number of sites has increased during the lastyears, it is worth noticing that several sites have unsatis-factory data coverage, and different methodologies are usedhampering the comparability across the network, thus im-provements in data quality for mass measurements is a prior-ity for the years to come.
4.2 Spatial distribution of mass concentration
The lowest measured concentrations of PM10 are generallyobserved in the northern and north-western parts of Eu-rope, i.e. the Nordic countries, remote areas of the BritishIsles, and for high altitude sites on the European mainlandreflecting both population density and distanse to majoranthropogenic sources (Fig. 5, EMEP, 2011; Putaud et al.,2010). The highest levels are seen in the southern parts ofEurope due to influence by both anthropogenic sources aswell as dust outbreaks (Putaud et al., 2010; Querol et al.,2009). The regional variation in PM10 and PM2.5 are quitesimilar as illustrated in Fig. 5. The mean PM10 concentrationfor all EMEP sites was about 15 µg m−3 in 2009 (range 4to 30 µg m−3), while the mean concentration of PM2.5 wasabout 10 µg m−3 (range 3 to almost 20 µg m−3) (EMEP,2011). The annual mean concentration of PM1 ranges from3 to 12 µg m−3 for the six sites with measurements in 2009.
Fig. 5. Geographical distribution of PM2.5 (left) and PM10 (right)in 2009. Unit: µg m−3.
The annual mean regional background PM10 concentrationsare below the EU limit value of 40 µg m−3 (EU, 2008) allover of Europe, but a few sites exceed the WHO recom-mended air quality guidelines (WHO, 2005) of both PM10and PM2.5, which are set to 20 and 10 µg m−3 for the annualmean, respectively. A comparison of the regional back-ground measurements of EMEP with the urban backgroundPM2.5 data reported the European Air Quality Database– AirBase (http://www.eea.europa.eu/data-and-maps/data/airbase-the-european-air-quality-database-6) shows thatmore than 60 % of the urban background concentration islikely to be attributed to the rural background contribution(EMEP, 2011; Putaud et al., 2010).
The relative contribution of fine and coarse particles how-ever varies across Europe. PM2.5/PM10 ratios are availableat 32 sites for the year 2009. The relative contribution of thefine fraction in PM10 is largest in central Europe (0.6–0.8).This is predominantly due to anthropogenic sources, but alsobiogenic secondary organic aerosols (BSOA) can contributesubstantially, in particular during summer (Gelencser et al.,2007). The fraction of fine PM is on average smaller (0.4–0.6) at the sites in southern Europe, where windblown dusthas a large influence (Querol et al., 2009). Relatively lowPM2.5 to PM10 ratios (0.5) are seen for sites close to thecoast due to the presence of coarse sea salt particles. As wellas BSOA, primary biological aerosol particles (PBAP) arefound to be a major contributor to the Scandinavian sites dur-ing the vegetative season (Yttri et al., 2011a, b) contributingto the low PM2.5 to PM10 ratios.
4.3 Chemical speciation of particulate matter
Chemical analysis of the ambient aerosol provides essen-tial information about the various sources contributing to theaerosol loading, as well as about chemical and physical pro-cesses taking place in the atmosphere. The chemical com-position is generally quite different across Europe: on av-erage there is more carbonaceous matter in PM10 in Cen-tral Europe, more nitrate in North-western Europe, and moremineral dust in southern Europe (EMEP, 2011; Putaud et al.,2010). A problem in assessing the chemical speciation is that
www.atmos-chem-phys.net/12/5447/2012/ Atmos. Chem. Phys., 12, 5447–5481, 2012
5458 K. Tørseth et al.: Introduction to the European Monitoring and Evaluation Programme (EMEP)
the necessary diversity of chemical species is rarely avail-able for a full year, but rather for a few selected sites duringresearch campaigns and the EMEP Intensive Monitoring pe-riods (Aas et al., 2012).
Some species are however measured continuously. Sec-ondary inorganic aerosols (SIA) have been monitored fordecades, however not with artefact free methods to differ-entiate the gas/particle partitioning of semi-volatile nitrogenspecies. In 2009, concurrent measurements of sulphate andPM10 were performed at a total of 38 sites, while 27 and 18sites reported nitrate and ammonium respectively. At the ma-jority of these sites, SIA is collected using a sampler withan undefined cut-off whereas at a few sites a sampler with aPM10 inlet is applied. By assuming that these ions are gener-ally found in PM10 size range, the average relative contribu-tion of SIA to PM10 are 13 ± 3 % for SO2−
4 ; 14 ± 8 % for NO−
3and 7 ± 3 % for NH+4 during 2009 (EMEP, 2011). The high-est contribution of SIA is in central Europe, with the highestlevel of sulphate and especially ammonium during summer,and nitrate having increased levels during the cold season,particularly in the Mediterranean area. The contribution ofsea salt to aerosol mass is highly dependent on distance tothe sea, i.e. from about 0.5 % at some continental sites andaround 15 % at sites close to the coast.
The carbonaceous matter is a significant component of theatmospheric aerosol mass, accounting for 10–40 % of thePM10 at the EMEP sites (Yttri et al., 2007). The EMEP pro-gram includes measurements of elemental carbon (EC) andorganic carbon (OC) at 10 sites in 2009. Previously, few ob-servations of the carbonaceous fraction were available, andfurther has there been a lack of comparable observations ofEC/OC data. Due to the high importance of EC/OC for bothclimate and health issues, EMEP performed a dedicated cam-paign to derive the first European wide coordinated monitor-ing effort of EC and OC (Yttri et al., 2007). Similarly, theCARBOSOL (Legrand and Puxbaum, 2007; Pio et al., 2007;Simpson et al., 2007a) and EUCAARI projects (Kulmala etal., 2009) have offered important information on the regionaloccurrence of EC/OC. An increased number of countries andsites have started reporting data of EC and OC. The harmo-nization of methodology has improved through the effortsmade within the EUSAAR project (Cavalli et al., 2010), andthis will continue within the EU project ACTRIS.
Annual mean concentrations of EC (both for PM10 andPM2.5) vary by a factor of 15 from the lowest with0.09 µg C m−3 at Birkenes, Southern Norway, to the highestannual mean concentration at Ispra in Italy with 1.4 µg C m−3
(EMEP, 2011). All the high-EC-loading sites show an in-crease in the EC concentration during winter. These in-creased levels are likely to reflect both increased emissions(influence of wood burning emissions in winter), as well asmeteorological conditions preventing dispersion of the airpollution by frequent temperature inversions and reducedboundary layer height. As for EC, the lowest levels of OC are
observed in Scandinavia, Eastern Mediterranean sites and atcertain high altitude sites (0.6–1.8 µg C m−3) (EMEP, 2011).At sites in Eastern Europe, UK, and northern Italy, the annualmean OC concentration ranged from 2.3–6.8 µg C m−3. Typ-ically the sites experiencing the lowest carbonaceous aerosolloading have higher levels during summer. Increased summertime concentrations of OC have typically been associatedwith formation of secondary organic aerosol (SOA), bothfrom anthropogenic and natural precursor gases. It has alsobeen shown that primary biological aerosol particles (PBAP)contribute to increased levels of OC in summer (Yttri et al.,2007, 2011a, b). In winter, biomass burning is usually themain source, with sizable additional contribution from fos-sil fuel combustion (Gelencser et al., 2007; Gilardoni et al.,2011).
Mineral dust is even more sparsely monitored than car-bonaceous matter in Europe even though it typically consti-tute up to 5–20 % of the ambient PM10 mass (Denier vander Gon et al., 2010). Dust outbreaks may greatly increasethe ambient air levels of PM, especially in Southern Europe(Querol et al., 2009; Perrino et al., 2008). During dust out-break events, the PM10 concentration may exceed the EUlimit value of 50 µg m−3 for the daily mean concentration(Querol et al., 2009). In addition, dust from natural regionalre-suspension, and a number of anthropogenic sources, in-cluding agricultural, industrial and construction sources maycontribute significantly to the ambient PM10 levels in Europe(Putaud et al., 2010; Denier van der Gon et al., 2010). Putaudet al. (2010) also show that average contributions of mineraldust to PM10 and PM2.5 during the period 1996–2007 rangefrom about 4 % in the north-western regions to about 15 %in southern Europe. In the Mediterranean specific study byQuerol et al. (2009), they show that mineral dust is the majorcomponent of PM10 in both western and eastern parts of theregion, with highest levels in the east (38 % of PM10).
4.4 Temporal trends in particulate matterconcentrations
24 EMEP sites have long term measurements of PM10 (9–13 yr) including the year 2009. Most sites have 11 yr of ob-servations, while Vorhegg (Austria) and Penausende (Spain)have 9 yr of data. The longest time series of PM mass con-centration data reported to EMEP goes back to 1996, andreveals large inter annual variations in the concentration lev-els reflecting meteorological variability. Selected time seriesof PM2.5 and PM10 are shown in Fig. 6.
In particular the year 2003 represented an extreme casewith significantly higher levels compared to the rest of theperiod. Despite the inter-annual variability, there is a rel-atively clear overall decrease in the mass concentration atseveral sites. Trend analysis is performed as described inSect. 2.1, for the period 2000–2009. Sites with data for atleast nine of the ten years are included, 24 for PM10 and13 for PM2.5 (Table 4). There is a statistically significant
Atmos. Chem. Phys., 12, 5447–5481, 2012 www.atmos-chem-phys.net/12/5447/2012/

K. Tørseth et al.: Introduction to the European Monitoring and Evaluation Programme (EMEP) 5459
Fig. 6. Time series of PM2.5 (left) and PM10 (right) at selectedEMEP sites.
decrease at about 50 % of the sites in both size fractions,whereas none of the sites showed an increasing trend. The av-erage reductions are 18 % and 27 % for PM10 and PM2.5 re-spectively, corresponding to an average change in mass of 2.9and 3.7 µg m−3 over the same period. When considering theeffect this may have on potential exceedances of limit values,it is worth noticing that the maximum reduction in absolutemass was 8 µg m−3 for PM10 at the Austrian site and as muchas 11 µg m−3 for PM2.5 at the site in Northern Italy, while6 µg m−3 reductions occurred at several other sites. The re-cent analysis on European PM trends (Barmpadimos et al.,2012) using selected EMEP data corrected by meteorologi-cal variability show similar results as those presented here.
The geographical distribution of the relative decrease inper cent (as given in Table 4) is shown in Fig. 7 for PM2.5and PM10. The downward trend in the observed annual meanconcentration of PM mass corresponds to the reported re-duction in the emissions of primary PM and precursors tosecondary PM during the actual period. The SIA precursorsSOx, NOx and NH3 have been reduced with 28 %, 9 % and12 % respectively in EMEP from 2000–2009 (EMEP/CEIP,2011). Primary PM2.5 emissions have decreased by 20 % inthe same period (EMEP/CEIP, 2011). There is a tendency,though not very significant, that the PM2.5/PM10 ratio hasdecreased from 0.70 to 0.63, indicating that the fine fractionmay have decreased relatively more than the coarse fraction(Table 4).
It is more challenging to assess changes in the content ofcarbonaceous matter. Regular continuous measurements ofEC/OC with a long-term goal started in 2001, and are avail-able only at two stations across Europe (in Norway and Italy),and only the Norwegian site has data for EC/OC in both thePM10 and PM2.5 size fractions. Figure 8 presents the time se-ries of EC and OC at the Norwegian site, indicating a slightreduction in concentrations, although there is a large inter-annual variability. Note that there was a change in the analyt-ical protocol for EC/OC measurements in 2008.
Fig. 7. Geographical distribution of the relative change in per centin PM2.5 (left) and PM10 (right) in Europe over the 10 yr 2000–2009. Unit: percent. Sites with no significant trends are shown witha cross, and negative numbers indicate a decrease.
Fig. 8. Time series of EC and OC in PM2.5 and PM10 at Birkenes(NO01), Southern Norway.
Since there are no PM10 or PM2.5 measurements extend-ing over decades, it is difficult to quantify the changes inmass for a longer time perspective. The measurement dataon total suspended particulate matter (TSP) since 1977 showa large reduction in mass concentration. For the fourteenSwiss, German and Hungarian sites with data from 1980to 1995, the average mass decrease in TSP of 7 µg m−3 forthe ten year period 1980–1990 and 14 µg m−3 for the pe-riod 1980–1999 (data not shown). For major ions however,the observed chemical composition documents a change alsoin PM mass since 1980. The changes in mass derived fromchemical composition data, shown in the major ions chap-ter above, indicate that the sulphate trend corresponds to areduction of about 5 µg m−3. Trends in nitrogen since 1990correspond to a reduction of about 1 µg m−3 for nitrate and2 µg m−3 for ammonium. Despite the significant reductionsin sulphur emissions, sulphate still remains one of the sin-gle most important compounds contributing to regional scaleaerosol mass concentration. From an air quality perspective,this calls for even further measures towards decreased sul-phur emissions to reduce aerosol loadings, even though there
www.atmos-chem-phys.net/12/5447/2012/ Atmos. Chem. Phys., 12, 5447–5481, 2012

5460 K. Tørseth et al.: Introduction to the European Monitoring and Evaluation Programme (EMEP)
Table 4. Trend analysis of EMEP sites with PM10 and PM2.5 measurements from 2000-2009 (at some sites time series were initiated in2001).
# sites Sites with sign. trend Per cent change Annual average conc. (µg m−3)
Comp decrease increase Avg. SD 2000(1) 2009 change pr year
Trends 2000(1)–2009
PM10 24 50 % 0 % −18 % 13 % 16.4 13.5 −0.29PM2.5 13 46 % 0 % −27 % 12 % 13.2 9.5 −0.37PM10–PM2.5 11 18 % 9 % −4 % 24 % 4.97 4.87 −0.01PM2.5/PM10 11 27 % 0 % −9 % 9 % 0.70 0.63
are concerns that this may accelerate future warming becauseof the cooling effect of sulphate.
5 Photooxidants and precursors
5.1 Introduction to ozone and precursor measurements
Until the 1970s photochemical ozone pollution was mainlyregarded as a local problem confined to certain regions char-acterized by heavy loads of pollution and a sunny and warmclimate such as e.g. California. It was not until the beginningof the 1980s when ozone measurements from some Euro-pean countries became available (Grennfelt and Schjoldager,1984; Grennfelt et al., 1989), and when the first calculationswith a preliminary EMEP model were made (Eliassen et al.,1982), that a potential large-scale ozone problem in Europewas demonstrated. Biologists have found indications of re-duced growth and damages on plants due to the ambientozone concentration level (e.g. Karlsson et al., 2004; Mills etal., 2011). In recent years, the role of ozone for climate hasgained interest. Tropospheric ozone is the third most impor-tant anthropogenic greenhouse gas with a radiative forcing ofabout 0.35 W m−2 (Forster et al., 2007). This is around 20 %of the forcing of CO2 since pre-industrial time. Ozone andaerosols are thus the main short-lived climate forcers.
Ozone measurements became part of the EMEP pro-gramme in EMEP’s third phase (1984–1986), continuing theOECD programme OXIDATE (Grennfelt et al., 1989). The1998 NOx protocol was the first protocol to abate emissionsof ozone precursors, although the original focus of that pro-tocol was acid deposition. In the first years most of the ozonemonitoring stations was located in the UK, the Nordic coun-tries and central Europe (Germany, Switzerland and Aus-tria). Gradually the network has expanded to the south andeast. EMEP’s monitoring programme for VOC was initiatedin 1989. Regular measurements of light hydrocarbons (grabsamples) and carbonyl compounds (8 h samples) started at afew European sites in 1992–1993. The monitoring networkfor VOC has changed considerably with time, and the num-ber of sites has varied between 5 and 17 (Solberg et al.,2001).
Figure 9 shows the number of years with data for all theozone and NO2 stations which have been in operation dur-ing the 20 yr period 1990–2009. Clearly, certain parts of Eu-rope are much better covered and have a significantly longerhistory than other parts. For ozone, the longest monitoringhistory is found in the UK, central Europe and the Nordiccountries while a shorter history is seen in France and Spain.Few sites are located in the east and southeast part of thecontinent. For 2009, a total of 27 countries reported ozonedata from 130 stations. The network for NO2 (Fig. 9) showsa somewhat better coverage in the southeast than for ozone,whereas the number of sites measuring VOC is much lowerthan for ozone and NO2 as seen by Fig. 10.
The maps in Fig. 9 and Fig. 10 include all EMEP siteswhich have been in operation during the 20 yr period 1990–2009. Since the network has changed considerably with time,the station maps in Fig. 9 and Fig. 10 are not directly compa-rable to the present situation. Particularly for VOC the siteshave changed with time. The present status (data for 2009)is that 11 sites perform measurements of light hydrocarbonsand only 3 sites have carbonyl compounds, shown in Fig. 11.
All ozone measurements within EMEP are done by UVmonitors following the guidelines in the EMEP manual. In-formation about the ozone data quality, calibration and main-tenance procedures have been collected from the participants(Aas et al., 2001). Furthermore, questionnaires have beendistributed to the countries requesting information about theroutines for calibration and maintenance of the UV moni-tors. The most recent overview was compiled in 2007 andis available in electronic form on the EMEP web page:http://www.nilu.no/projects/ccc/emepdata.html. The question ofspatial representativity – recently discussed by Henne etal. (2010) – is, however, equally important as the operationof the instrument for ozone measurements. Ozone concentra-tion near the ground is influenced by several factors, such asland use and topography, both affecting the surface dry de-position, as well as NOx sources in the vicinity leading toimmediate ozone destruction. The importance of these pro-cesses normally varies through the day, following the diurnalcycle of the planetary boundary layer and the vertical mix-ing. Thus, the representativity of an ozone monitoring station
Atmos. Chem. Phys., 12, 5447–5481, 2012 www.atmos-chem-phys.net/12/5447/2012/

K. Tørseth et al.: Introduction to the European Monitoring and Evaluation Programme (EMEP) 5461
Fig. 9. Number of years with EMEP monitoring data during 1990–2009 for ozone (left) and NO2 (right).
Fig. 10.Number of years with EMEP monitoring data during 1990–2009 for light hydrocarbons (left) and carbonyl compounds (right).
does not only depend on the distance to emission sources butalso to the “inhomogeneity” of the surrounding area. Areaswith strong gradients in topography and land use will leadto a poorer representativity of the ozone measurements thane.g. a flat desert.
Measurements of hydrocarbons are mostly done by can-ister grab samples followed by GC analyses in the labora-tory. The samples are collected twice per week except for theFrench sites where they are collected once per week. At afew sites a continuous GC monitor at the station is used. Car-bonyls are measured by sampling in DNPH (Dinitrophenyl-hydrazine) cartridges for 8 h (08:00–16:00 UT). As for thehydrocarbons, the carbonyls samples are collected twice perweek. The QA procedures for the VOCs are described inthe EMEP manual (EMEP/CCC, 2001) and technical de-tails are given in the EMEP annual data reports (Solberg,2011, and references therein). The measurements of VOCsand NOx/NOy will be further developed within the frameof ACTRIS both with respect to frequency, harmonizationof measurements and measurement protocols and number ofsites.
Fig. 11.The EMEP VOC monitoring stations in operation in 2009(adopted from Solberg, 2011).
5.2 Spatial distribution of ozone and precursors
Surface ozone is closely linked to the meteorology. Thus,large regional differences are seen in Europe, reflecting dif-ferent climate conditions. The conditions range from a po-lar climate in the far north to a moist marine climate in thewestern part to the warm, dry and sunny conditions in thesouth. Furthermore, the dominant westerly wind flow causesa gradual build-up of continental emissions and ozone as airmoves across the continent. The topography of the Alps has astrong influence in that sites at different altitudes are exposedto very different ozone levels (Loibl et al., 1994), and some-times the mixing between the boundary layer and the freetroposphere act as an effective means of transporting man-made ozone and precursors from populated valleys into thefree troposphere (Furger et al., 2000; Ordonez et al., 2005).Already the EUROTRAC project TOR showed that there isa spatial gradient across Europe with ozone increasing fromnorthwest to southeast in summer and an opposite gradientin winter (Scheel et al., 1997). This reflects the switch fromNOx reducing ozone in winter to photochemical ozone for-mation in summer.
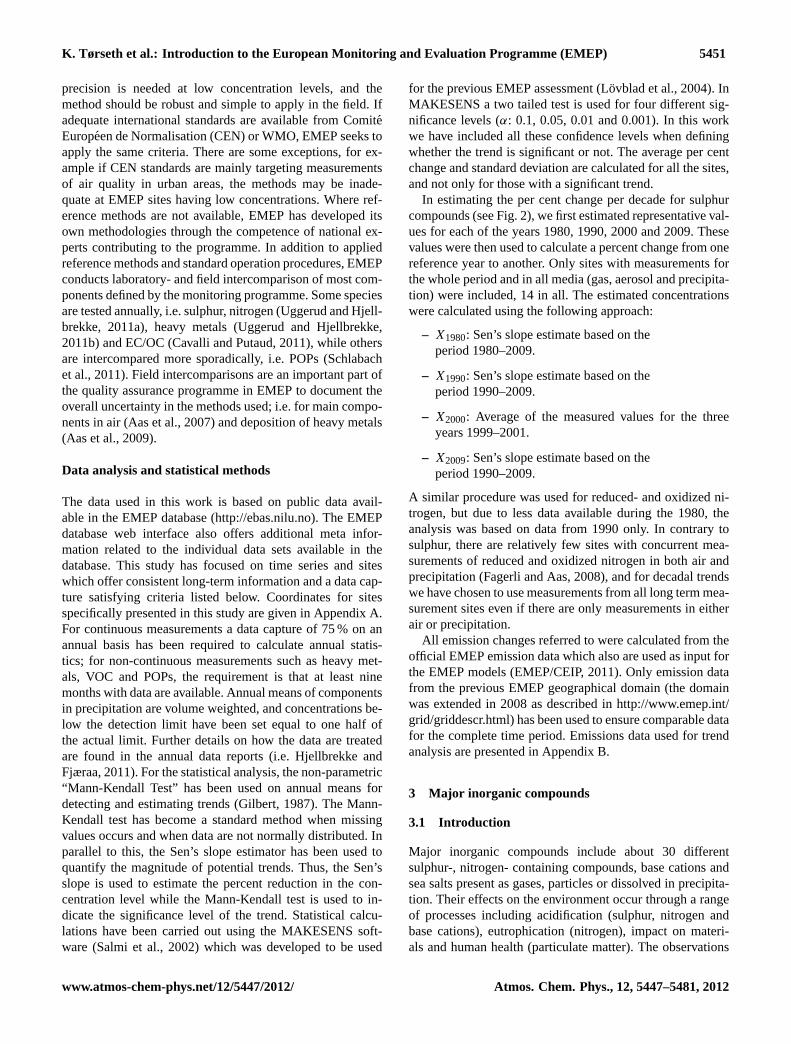
Five year mean values (2005–2009) of AOT40 (Accumu-lated exposure Over a Threshold concentration of 40 ppb)and summer 99 percentiles (p99) based on hourly EMEPozone data for the summer half year are shown in Fig. 12.The AOT40 values shown here are based directly on the mea-surements which normally are taken at 2–3 m above ground.The correct AOT40 value to be used for the assessment ofdamage to crops should refer to 1 m above ground accord-ing to UNECE (see discussion in Simpson et al., 2007b). An
www.atmos-chem-phys.net/12/5447/2012/ Atmos. Chem. Phys., 12, 5447–5481, 2012
5462 K. Tørseth et al.: Introduction to the European Monitoring and Evaluation Programme (EMEP)
Fig. 12.Five years means of the 6-months AOT40 (left) and the 6-months 99 percentile (p99) averaged over the years 2005–2009. Thesummer half year (April–September) was used for both parameters.AOT40 values are in ppb h. The 99 percentiles are in µg m−3.
increasing gradient is apparent from north to south for bothparameters. Marked differences between the two parametersare also seen. While the highestp99 values are confined tocentral Europe (Switzerland/Austria), high AOT40 values areseen also in Spain, south France and Crete. This could reflectthat AOT40 is partly determined by the general backgroundlevel at the actual latitude, whereas thep99 values are morestrongly linked to photochemical pollution episodes.
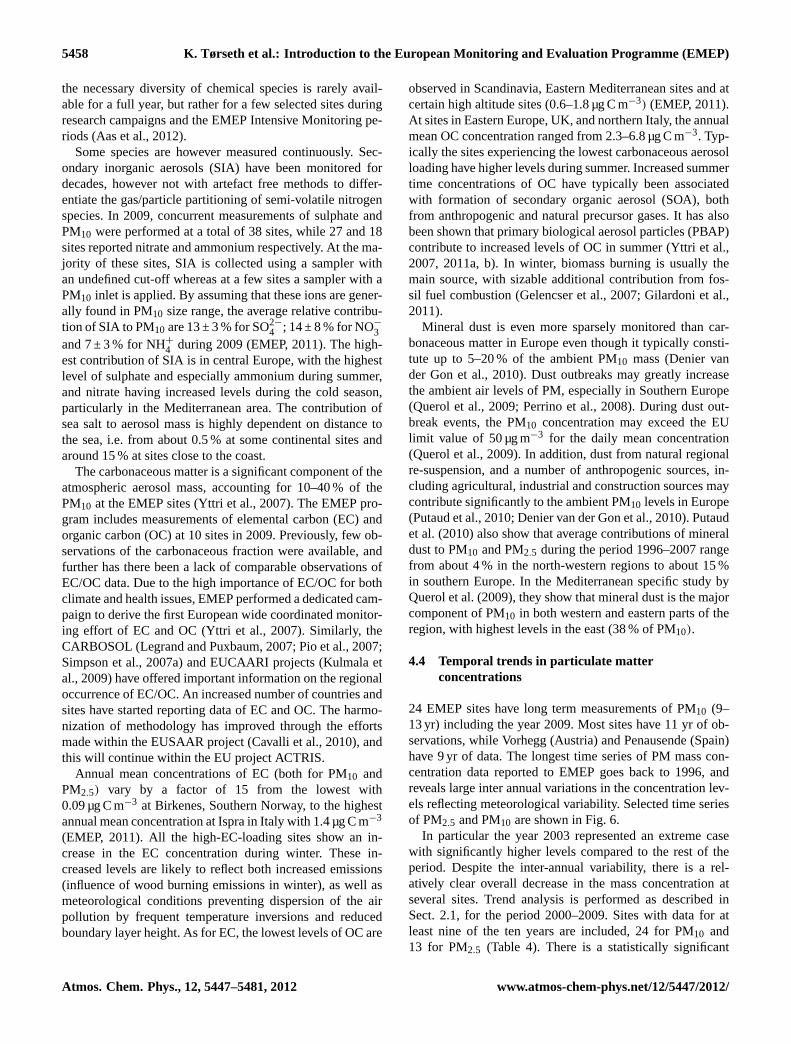
The number of EMEP VOC stations is too small to eval-uate the geographical distribution in detail. Data show, how-ever, that in winter when the photochemical oxidation is ata minimum, many of the hydrocarbons become fairly wellmixed over Europe. Small spatial gradients in the winter me-dian concentrations are seen for long-lived species such asethane and propane (Fig. 13). The unsaturated alkenes aresubject to oxidation by O3 also in winter and show clearerspatial differences also in that season.
5.3 Long-term trends in ozone and precursors
The issue of long-term trends in ozone has received increasedattention during the last years. Many publications report anapparent mismatch between the trends in the anthropogenicemission of precursors and the observed trends (or lack oftrends) in ozone (e.g. Colette et al., 2011; Wilson et al.,2012). The European anthropogenic emissions of NOx andNMVOC have been reduced by 31 % and 46 % (EMEP/CEIP,2011), respectively, from 1990 to 2009. As these are the mainprecursors for ozone, one would expect clear changes in theEuropean ozone concentration levels. However, due to thestrong coupling between ozone and weather regimes and thesubstantial hemispherical background level, trends in ozoneare often difficult to detect without very long time series.The recent study by Colette et al. (2011) showed very goodagreement between observed and modelled NOx levels in Eu-rope, whereas they comment that “ozone trends turned out tobe much more challenging to reproduce”. Nevertheless, theyfound that the suite of models included in their work wereable to capture the trends at the majority of the sites.
Fig. 13.Box- and whisker-diagrams for hydrocarbons measured atEMEP sites (Appendix A) satisfying the data requirements duringwinter 2009 (January, February, November, December). The mark-ers indicate the 10-, 25-, 50-, 75- and 90-percentiles. Mean valuesare indicated by a cross. The dashed line connects the median valuesfor clarity. Unit: ppt(v).
A recent study by the European Environment Agency(EEA) concluded that the reductions in emission of anthro-pogenic ozone precursors are not reflected in the observedannual average ozone concentrations, which do not show adownward trend in Europe between 1999 and 2009 (EEA,2011). The study found that the number of exceedances ofthe 120 µg m−3 target value (8-h mean) went down in theyears after 1992, but stabilized later. In a previous EEA study(EEA, 2009) trend analyses indicated significant reductionsin ozone concentrations at British and Dutch stations (fallingduring the 1990s and levelling off thereafter). For the Aus-trian and Swiss stations, no significant trends were identified.The EEA, 2011 report used all the EEA sites, including urbanand suburban ones. Its focus is on describing the current airquality situation and has less attention to addressing trends.The EEA ozone trend study of 2009 (EEA, 2009) used only
Atmos. Chem. Phys., 12, 5447–5481, 2012 www.atmos-chem-phys.net/12/5447/2012/
K. Tørseth et al.: Introduction to the European Monitoring and Evaluation Programme (EMEP) 5463
sites classified as rural background in Airbase, and as a re-sult of the fact that national agencies use their EMEP sites toalso report for the European Commission Air Quality Direc-tive, these datasets have a large overlap. No urban or subur-ban sites were included in the analysis and the study lookedat single stations individually (mainly for the period 1995–2006) and included also results from regional scale photo-chemical modelling.
Smidt et al. (2010) found that at forest sites in Austria SO2and NOx concentrations decreased after 1990 whereas nosignificant changes are seen in the ozone AOT40 values and95-percentiles. Chevalier et al. (2007) looked at ozone datafrom the French EMEP network and from high mountainsites. They found no change in concentration levels at the sta-tion Pic-du-Midi (2877 m a.s.l.) since the early 1990s, whilefor some stations in the Alps they saw increasing ozone lev-els. Vautard et al. (2006) compared European EMEP ozonemeasurements for the period 1990–2002 with chemical trans-port model calculations. They found indications of reducedpeak concentrations and an increase in the ozone baselinelevel. They argued that for central/northern Europe the emis-sion reductions given in the official EMEP data may be toooptimistic.
A study of long-term EMEP model and measurement datawas published by Jonson et al. (2006). They also studied datafrom the period 1990 to 2002 and found a mixed picture forozone. At most sites a downward trend in the 98 percentileswas found, but they comment that the inferred trends couldbe biased by the selection of start year. According to theiranalyses long-term ozone changes were a combined resultof reduced precursor emissions and increased ozone back-ground levels. The results indicated that the reductions inNOx emissions have been less effective in summer comparedto winter. Solberg et al. (2005) analysed EMEP ozone mea-surements from the Nordic countries during the 1990s andestimated a reduction in the 99 percentiles of the order of15 µg m−3 for southern Norway and southern Sweden. Thescatter in the data was large, making the analysis uncertain,and according to the model results larger reductions shouldhave occurred.
In general, long-term ozone trends at EMEP sites show amixed pattern. Several studies report reduced peak concen-trations, mainly during the 1990s, followed by stable ozoneconcentrations during the 2000s. Results depend criticallyon the parameter used in the statistical analyses (high per-centile, annual mean, AOT40 etc.). Furthermore, the year-to-year variability in ozone due to varying meteorology issubstantial, making it hard to separate the trends caused byreduced emissions from other effects. Thus, trend analysesbased on measurement data alone is difficult and chemicaltransport model (CTM) calculations are often needed for theevaluation. Simpson et al. (1997) estimated that if one at-tempts to identify emission trends by the ozone monitoringdata alone one would need of the order of 30 yr of data. Asnoted by the EEA ozone trend study (EEA, 2009) the lack
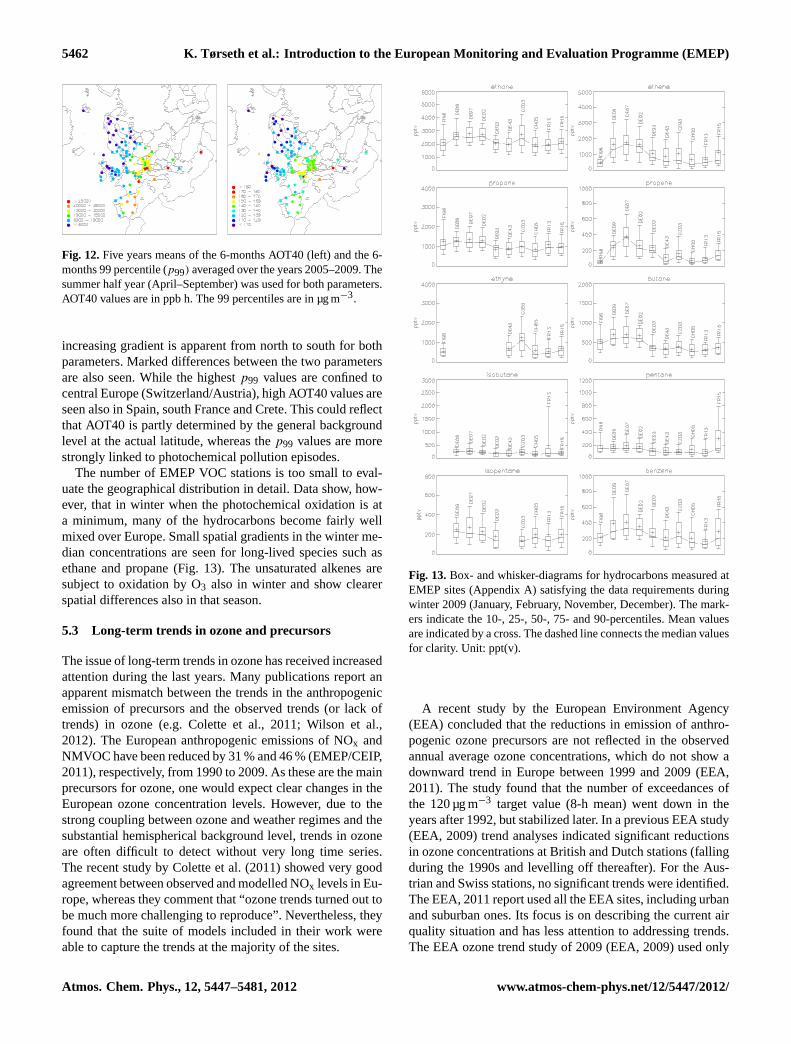
Fig. 14. Ten years mean of the 6-months’ AOT40 (April–September) for the years 1990–1999 (left) and 2000–2009 (right).Unit: ppb h.
Fig. 15.Ten years mean of the annual 99 percentiles (p99) based onhourly data from the summer half year (April–September) for theyears 1990–1999 (left) and 2000–2009 (right). Unit: µg m−3.
of long-term ozone data is a major obstacle for identifyingsignificant trends in Europe today.
Model runs are not included in the present work and to re-duce the effect of inter-annual variability we have calculated10-yr mean values for 1990–99 and 2000–2009, respectively.The length of the period is a compromise between climatevariability (10 yr is a short period in that sense) and emissionchange within the period.
Figures 14 and 15 show the results for the summer 6-months AOT40 and 99 percentiles (p99), respectively. Inlarge regions of the continent the change in monitoring net-work and lack of long-term data prevents any trend assess-ment. Many countries did not have ozone stations for a suffi-cient number of years during the 1990s while in other coun-tries the station network has changed from the 1990s to the2000s. Despite this, certain patterns are seen. The results in-dicate a clearer reduction inp99 than in the AOT40. Thisis in line with the expectations, as AOT40 is highly sen-sitive to the general background level whereas thep99 ismore strongly linked to the number and extent of photo-chemical episodes. Reductions in thep99 are seen in Eng-land, Benelux countries, Germany and the Czech Republic(Fig. 16). For Switzerland and Austria it is difficult to seeany clear changes. A slight increase is seen in Spain, but the
www.atmos-chem-phys.net/12/5447/2012/ Atmos. Chem. Phys., 12, 5447–5481, 2012

5464 K. Tørseth et al.: Introduction to the European Monitoring and Evaluation Programme (EMEP)
Fig. 16. Frequency distribution of hourly ozone concentrations for selected EMEP sites (Appendix A) (arranged by region from north tosouth) for the periods 1990–1999 (red) and 2000–2009 (blue). X-axis: µg m−3, y-axis: frequency. Binsize: 6 µg m−3.
change in station network makes it difficult to evaluate thisfurther.
The changes in AOT40 are smaller (Fig. 14). Reductionsin England and Benelux countries are seen, whereas for otherparts of the continent the pattern is more mixed. These resultsindicate fairly stable AOT40 values in Switzerland, Austriaand the Czech Republic.
As mentioned above, the type of indicator (mean, per-centile, AOT40, etc.) is critical for the estimated trend. Thereason for this is that ozone is a secondary pollutant whichdepends on the emissions of VOC and NOx in a non-linearway. On a European scale, NOx acts as an ozone sink inwinter and an ozone source in summer. Thus, reduced NOxemissions will lead to increased ozone in winter and reducedozone in summer at rural background sites. At more pollutedsites the NOx titration of ozone may last longer into the warmseason and the switch from representing an ozone sink to rep-
resenting an ozone source is more difficult to predict. Annualmean values are therefore of little value for evaluating ozonetrends. Reduced NOx emissions should instead give rise toa narrower frequency distribution of ozone. The number ofboth the low and the high ozone concentrations should godown as explained above if the NOx emissions are reduced.
To look for such changes we have calculated the frequencydistribution of hourly ozone concentrations based on thesame two 10-yr periods as mentioned above (1990–1999 and2000–2009). Figure 16 shows the distributions for selectedstations which have a nearly complete 20-yr time series. Un-fortunately, not many sites have such a long monitoring his-tory. There are more EMEP sites with sufficiently long timeseries than shown in Fig. 16, but we made a selection takinginto account the geographical coverage to avoid e.g. a biastowards certain countries.
Atmos. Chem. Phys., 12, 5447–5481, 2012 www.atmos-chem-phys.net/12/5447/2012/

K. Tørseth et al.: Introduction to the European Monitoring and Evaluation Programme (EMEP) 5465
The frequency plots show a mixed picture. For the Nordiccountries the data indicate a slight reduction in the numberof very low values. On the other hand, the highest percentilesare reduced at some Nordic sites and increased at others. Aclear reduction in the highest values is apparent at Vavihill(SE0011) in southwest Sweden, whereas a very small changeis seen at Prestebakke (NO0043) in southeast Norway. Thereason for these differences is not clear.
The most pronounced change is seen at sites in the UKand the Netherlands, showing a reduction in the frequencyof higher values. Also at Mace Head (IE0031) at the Irishwest coast the data show a narrowing of the frequency dis-tribution. Compared to this, surprisingly small changes areseen in Germany, Switzerland and Austria. For the two lat-ter countries, no change is seen in the frequency distributionof ozone. At the German sites a slight reduction in the high-est ozone values are found. The change is not large though,and applies only to the extreme right tail of the distribution.As opposed to this, a marked narrowing of the distributionis seen at Svratouch (CZ0001), Ispra (IT0004) and Krvavec(SI0032).
The reason why the changes in ozone frequency distribu-tion vary that much across Europe is not clear. The resultsare, however, in line with the previously mentioned trendstudies. The lack of change in ozone distribution at Swissand Austrian sites is particularly surprising. These countriesare located in central Europe and are receivers of pollutantsfrom all directions. Thus, we would expect a clear signal ofthe reduced NOx and VOC emissions. The effect of the Alpscausing a vertical mixing combined with a possible rise inthe hemispheric ozone baseline level has been proposed asan explanation (e.g. Ordonez et al., 2005). It has however notbeen proven that this effect is sufficiently large to completelycounteract the effect of the reduced European emissions. Ashift in the fleet of personal vehicles from petrol fuelled todiesel fuelled cars leading to an increased NO2/NOx emis-sion ratio has also been proposed to contribute to a change inthe photochemistry (Jenkin et al., 2008).
Figure 17 shows the differences in the measured per-centiles as a function of thepx(2000s) for the same stationsas in Fig. 16, i.e.px(2000s)− px(1990s),x = [1, 10, 50, 90,95, 99, 99.5]. The results do show a slight increase in thelowest percentiles and a decrease in the high percentiles. Itis only for the two extreme percentiles,p99 andp99.9, that asystematic reduction is seen, and even for these indicators wefind increases at some sites. Forp95 there is no strong pos-itive or negative bias for these stations when taken together.The annual median (p50) is increased at most of these sites.
It is important to keep in mind that the results in Figs. 16and 17 are strongly biased by the selection of monitoringsites and should not be regarded as representative for theEMEP region in general. The sites cover only certain regionsof the continent and for the east, southeast and southwestparts of Europe there are no sites with sufficiently long timeseries to carry out this analysis.
Fig. 17. The change in ozone percentiles from the 10-yr period1990–1999 to 2000–2009 as a function of the percentile values in2000–2009 for the 20 stations shown in the previous figure. Thecolor codes indicate the type of percentiles.
The lack of long-term running stations is a major obstaclealso for studying trends in VOC at EMEP sites. The changein VOC network (change in stations and in measurement fre-quency) since the start of the programme in 1992–1993 re-duces the number of sites suitable for trend studies to a min-imum. Figure 18 shows the annual medians based on datafrom four winter months for the period 1995 to 2009. Notethat the sampling frequency at FR0013 (Peyrusse Vieille) hasbeen reduced from twice a week to once per week. The win-ter medians could be used as a proxy for the emission sourcestrength, whereas in summer the oxidation by OH will maskthe concentration levels at a varying degree, depending onthe chemical life time.
The linear Sen trend slopes are shown in Table 5. The scat-ter in the data is large, and significant changes are only foundfor certain components/stations. Furthermore, no consistentpicture is seen. While a marked decline is apparent for allcompounds at Kosetice (CZ0003), the other slopes are actu-ally positive, indicating a rise in the concentrations.
6 Heavy metals
6.1 Introduction to heavy metal observations
Heavy metals are of major environmental concern due totheir persistence, ability to bio-accumulate and their negativeeffect on human health and the environment (Pacyna et al.,
www.atmos-chem-phys.net/12/5447/2012/ Atmos. Chem. Phys., 12, 5447–5481, 2012

5466 K. Tørseth et al.: Introduction to the European Monitoring and Evaluation Programme (EMEP)
Table 5.Sen’s non-parametric slope estimator of the annual trend [ppt yr−1] for measured light hydrocarbons. Only statistically significanttrends are shown.
Years ethane ethene ethyne propane Butane isobutane pentane isopentane benzene toluene
FI0096 96-09DE0002 1998–2009 68DE0008 2000–2009 174 70 58 81 32 17CZ0003 1995–2009 −33 −94 −83 −32 −21 −10 −9 −17 −22 −16FR0013 1999–2009 71 13
Fig. 18. Annual winter (January, February, November, December)median concentrations of hydrocarbons at Pallas (FI96), Waldhof(DE02), Schmucke (DE08), Kosetice (CZ03) and Peyrusse Vieille(FR13) during the period 1995–2009 (from Solberg, 2011).
1984). Therefore regulation of these elements has been a pri-ority both on a regional (CLRTAP) and global scale (UNEP).Heavy metals were included in EMEP’s monitoring programin 1999. However, earlier data are available and have beenincluded in the EMEP database. Thus, the database includesmeasurements back to 1976 for a few sites, although most ofthe time series start around 1990. During the seventh phaseof EMEP (EB.AIR/GE.1/1998/8) it was recommended thatthe future work under the Convention should concentrate oneight priority elements: lead (Pb), mercury (Hg), cadmium(Cd), chromium (Cr), nickel (Ni), zinc (Zn), copper (Cu) andarsenic (As), and particular attention was paid to the firstthree elements. The Aarhus Treaty, signed in 1998 by nearlyall European countries, targets Cd, Pb and Hg and commit-ted the Parties to reduce their emissions for these three metalscompared to 1990.
Mercury differs from the other trace elements by hav-ing a longer residence time in the atmosphere, changing itschemical form (gaseous elemental mercury as well as reac-tive gaseous and particulate mercury), and having the pos-sibility for re-emission to the atmosphere after deposition.Consequently, mercury has a higher potential for long-rangetransport. Mercury is therefore of a more global concern, andeven though the European emissions have decreased duringthe last decades, the impact of increased Asian emissions aresignificant both in Europe and in the Arctic (UNEP, 2008;HTAP, 2010; AMAP, 2011).
To document and harmonise the analytical as well as thefield procedures a joint working group consisting of rep-resentatives from HELCOM (Convention on the Protectionof the Marine Environment of the Baltic Sea Area), EMEP,OSPARCOM (The Convention for the Protection of the ma-rine Environment of the North-East Atlantic) and AMAP(Arctic Monitoring and Assessment Programme) initiated aplan for regular laboratory intercomparisons, starting in 1994(Berg and Semb, 1996; Uggerud and Hjellbrekke, 2011a),and field intercomparison starting at Deuselbach in 1995(Winkler and Roider, 1995). The EMEP methods are har-monized with air and deposition measurements defined inEU (EU, 1999, 2004, 2008; Aas et al., 2009; EMEP/CCC,2001). There are several challenges with respect to data qual-ity of the heavy metal measurements. Contamination of thesamples is a large risk if the standard operating procedures
Atmos. Chem. Phys., 12, 5447–5481, 2012 www.atmos-chem-phys.net/12/5447/2012/

K. Tørseth et al.: Introduction to the European Monitoring and Evaluation Programme (EMEP) 5467
Fig. 19.Average concentrations of Pb in aerosols in 1990 and 2009(unit ng Pb m−3).
are not followed (EMEP, 2001). Furthermore, the concen-tration levels are relatively low (especially in the last years)and the analytical methods used are not always adequate. Acommon problem is that the detection limit is often too highcompared to the general concentration level at the site. Fur-ther, the data capture is also in general much poorer than e.g.for main components especially for components in air whichare often sampled only one or two days a week.
6.2 Heavy metals spatial distribution
Maps showing the annual average concentrations of Pb andCd in aerosols in 1990 and 2009 are presented in Fig. 19. Themonitoring network has been extended to a larger area of Eu-rope in the last decades. The obligations given by the EMEPmonitoring strategy (UNECE, 2009) and EU’s air quality di-rectives (EU, 2004, 2008) have clearly improved the site cov-erage the last years, although there still is a lack of measure-ments in some parts of Europe. The Mediterranean regionand the most eastern part of Europe are more or less lackingmeasurements of heavy metals. In 1990, Pb was measuredat 42 sites. At only two of these sites were concurrent airand precipitation measurements carried out. In 2009, mea-surements of heavy metals in both air and precipitation werecarried out at 36 sites. Totally 71 measurement sites for heavymetals were in operation. Mercury in either form (air or pre-cipitation) was measured at 26 sites and 12 of these had datafor both air and precipitation (Aas and Breivik, 2011).
The concentrations of heavy metals in air and precipita-tion resembles the emission distribution (see Pacyna et al.,2009) fairly well showing high values in Central Europe andlower concentrations in Northern Europe (Figs. 19 and 20).The lowest concentrations are generally observed in northernScandinavia, Greenland, Iceland, and the westernmost part ofEurope. The concentration and deposition levels increase tothe southeast, but not homogeneously. Certain “hot spots” areseen for some elements. For Pb in precipitation, the highestlevels in 2009 were observed in Italy and Hungary with con-centrations exceeding 2 ng l−1, while for Pb in aerosols thehighest levels were observed in the Benelux countries andSlovakia where concentrations reached almost 10 ng Pb m−3
Fig. 20.Average concentrations of Cd in aerosols in 1990 and 2009(unit ng Cd m−3).
(Aas and Breivik, 2011). The lowest concentrations of Pband Cd during 2009 were found in the Nordic countries andin Great Britain. The highest Cd levels in precipitation werefound in Slovakia and the Czech Republic with concentra-tions around 0.2 ng l−1 while the highest levels in aerosolswere observed in the Benelux countries and in Slovakia, withannual averages exceeding 0.2 ng Cd m−3.
The spatial pattern of lead and cadmium is confirmed bythe European moss surveys (Harmens et al., 2010). The low-est concentrations of metals in mosses are found in Scan-dinavia, the Baltic States and northern parts of the UK,while the highest concentrations are observed in Belgium andsouth-eastern Europe.
The spatial distribution of elemental Hg in air and precip-itation does not follow the same pattern as the other heavymetals; the highest annual average in 2009 was observed inSweden and the lowest in the UK and Eastern Europe. Thereason why the Hg concentration pattern differs from the pri-mary Hg emission pattern is that Hg has a long residencetime in the atmosphere and also that re-emission from soiland ocean may affect more distant sites (e.g. Strode et al.,2007). The concentration distribution of Hg in aerosols showa more scattered pattern, but earlier studies have indicatedhigh concentrations of total particulate Hg (TPM) near thesource areas in Germany and lower towards the north (Wang-berg et al., 2003; Munthe et al., 2003). For the other elementsmeasured we refer to the annual EMEP data reports (e.g. Aasand Breivik, 2011).
6.3 Heavy metals temporal trends
The maps for 1990 and 2009 presented in Figs. 19 and 20clearly show that the Pb and Cd concentrations in both air andprecipitation have decreased during the last 20 yr. Figure 21shows trend plots of Cd, Pb and Hg in both air and precip-itation from selected sites. Only Sweden has time series ofHg extending back to the early 1980s. The concentrations ofPb and Cd during the last two decades can be compared withthe emission changes for these compounds (Table 6). The re-ductions in measured Pb are between 80 % (in precipitation)and 90 % (in aerosols). The emission reduction is in the same
www.atmos-chem-phys.net/12/5447/2012/ Atmos. Chem. Phys., 12, 5447–5481, 2012

5468 K. Tørseth et al.: Introduction to the European Monitoring and Evaluation Programme (EMEP)
Table 6.Change in Cd and Pb concentrations in air and precipitation, compared to emission changes from 1990 through 2009.
No. of sites Sites with significant trend Trends in conc. Emission
Comp decrease increase Avg. SD trends
Trends 1990–2009
Pb air 11 100 % 0 % −90 % 7 %−84 %Pb precip. 7 100 % 0 % −80 % 22 %
Cd air 8 100 % 0 % −84 % 14 %−54 %Cd precip. 9 89 % 0 % −64 % 53 %
Fig. 21. Change of Pb (top) and Cd (middle) concentration inaerosol and mercury in air and precipitation (bottom) at selectedEMEP stations. Note that it is not necessarily the same sites thathave time series in both air and precipitation.
range (EMEP/CEIP, 2011), mainly due to the use of unleadedgasoline and the introduction of efficient dust-removal instal-lations in industrial plants (Pacyna et al., 2007, 2009). Thereduction in measured cadmium is also significant, between64 % (in precipitation) and 84 % (in aerosols).
One should keep in mind that the sites with long termmeasurements are situated in central and Northern Europe,and that their average decrease may be higher than for theEMEP domain as a whole. The emission reduction of Cd inthe EU15 countries is 68 % compared to 54 % for the wholeregion (EMEP/CEIP, 2011). In addition to the EMEP sites in
central and Northern Europe, there are some additional siteswith long term data confirming the large reduction of Pb andCd in Europe. In a study based on measurements from thenorth-western Mediterranean Sea, a 90 % decrease in the Pbconcentrations in air between 1986 and 2008 was found. Inthe same study a reduction of Cd concentrations by 54 % wasfound (Heimburger et al., 2010). In a study measuring traceelements in mosses, the observed trend was similar to thatshown from EMEP observation data, and with reductions inPb and Cd levels by between 52 and 72 % during the periodfrom 1990 to 2005 (Harmens et al., 2010).
A major decline of the European Hg emissions occurredat the end of the 1980s and around 1990 (Pacyna et al 2009).Figure 21 indicates there are no major changes since 1990and this is confirmed by a Mann-Kendall statistical test forboth air and precipitation measurements. However, at theSwedish site with long term measurements of gaseous el-emental mercury there has been a reduction of about 60 %since 1980, and most of this occurred before 1992 (Fig. 21).In other studies a downward trend is found also for the Hgmeasurements in precipitation. Wangberg et al. (2007) ob-served a reduction in deposition between 10 % and 30 %when comparing the periods 1995–1998 and 1999–2002 forvarious sites in OSPARCOM/EMEP. However, the concen-trations reveal a significant inter-annual variability and thechoice of time period may determine if a trend is detected.
The measurements of total gaseous mercury (TGM) forthe period from 1980 to about 1993, indicate a dramatic de-crease of about 60 % in ambient concentrations. Concentra-tion changes reflect the emission change in Europe during thesame period (EMEP/CEIP, 2011; Pacyna 2007, 2009). TGMhas been monitored at the summit of the Wank Mountainin the Bavarian Alps in the first half of the nineties (Slemrand Scheel, 1998) and the decrease in concentrations wasabout 22 % from 1990 to 1994. Their study confirms the quitedramatic change in mercury emissions during this period onboth regional and global scale. Reduced emissions in Europeand the long lifetime of Hg have resulted in an increased fo-cus on non-European sources (HTAP, 2010).
Atmos. Chem. Phys., 12, 5447–5481, 2012 www.atmos-chem-phys.net/12/5447/2012/

K. Tørseth et al.: Introduction to the European Monitoring and Evaluation Programme (EMEP) 5469
7 Persistent organic pollutants
7.1 Introduction
POPs are organic chemicals identified as being toxic, bio-accumulative, persistent and prone to long-range transport.Recognition of long-range atmospheric transport of POPs toremote areas such as the Arctic from the 1980s and onwards(e.g. Ottar, 1981; Wania and Mackay, 1993) contributed tothe adoption of the Aarhus Protocol on POPs in 1998 andinitially included 16 substances/substance groups. In 2009,seven additional substances were amended to the Protocol(ECE/EB.AIR/99/ADD.1). POPs in air and deposition havebeen reported to EMEP since 1999, yet the EMEP databasenow contains historical monitoring data from 1991 onwards(see Fig. 1).
For most other air pollutants covered by CLRTAP, concen-trations in air tend to decline with distance from source re-gions due to dispersion, dilution, degradation and deposition(Wania, 1999). However, for some POPs, surprisingly highconcentrations have been measured far from major emis-sion regions (Wania, 1999). A characteristic feature of manyPOPs, unlike most other air pollutants, is their potentialto undergo reversible atmospheric deposition (e.g. Larsson,1985; Nizzetto et al., 2010). Therefore, air concentrationsmeasured today might be caused by either recent primary at-mospheric emissions or attributed to re-volatilization of thesepersistent and semi-volatile substances from contaminatedsurface reservoirs (soil, water, vegetation, snow, etc.) in con-tact with the atmosphere. This feature not only complicatespredictions of source-receptor relationships (Malanichev etal., 2004), but is also an important factor to consider wheninterpreting air and deposition measurements, including spa-tial and temporal trends. This is also why complementarymeasurements of additional environmental surface media aredesirable in the context of POP monitoring to better under-stand and predict air-surface exchange (e.g. Ruzickova etal., 2008). In the following, selected data from the EMEPdatabase on POPs are presented, which both may serve tohighlight some of the data contained therein as well as keyfeatures controlling the spatial and temporal trends of se-lected POPs in air. We refer to the literature for a more de-tailed account of EMEP data containing more detailed anal-yses of specific sites and/or contaminants (e.g. Brorstrom-Lunden et al., 1994; Eckhardt et al., 2009; Dvorska et al.,2008; Holoubek et al., 2007; Hung et al., 2010; Wania andHaugen, 1999).
7.2 Spatial patterns of selected POPs
Although the number of POP monitoring stations has grad-ually increased over the last decade, the number of sites isstill limited in terms of spatial coverage with stations mainlylocated in north-western Europe (Aas and Breivik, 2011). Asan example of data contained in the EMEP database, Fig. 22
Fig. 22.Spatial patterns for pyrene in air (left) at EMEP stations in2009, and (right) measured using passive air samplers across Euro-pean background stations in 2006 (from Halse et al., 2011). Unit:ng m−3.
shows the spatial pattern of pyrene from EMEP sites in 2009.Pyrene belongs to the group of polycyclic aromatic hydrocar-bons (PAHs), which are mainly formed during incompletecombustion of carbonaceous material (e.g. Breivik et al.,2007; Zhang and Tao, 2009). While PAHs also are subject tolong-range atmospheric transport to remote areas (e.g. Hal-sall et al., 2001), model calculations indicate that their long-range atmospheric transport (LRT) potential is often morelimited than that of many other legacy POPs (Beyer et al.,2003), which in turn suggest that a large spatial variability isto be expected – and indeed observed (Jaward et al., 2004b).Thus, the “true” spatial pattern for such contaminants may bedifficult to rationalize based on a limited number of EMEPstations (Fig. 22a). To illustrate this, we also show the spa-tial pattern in European background air during the summer of2006 in Fig. 22b, measured using passive air samplers (PAS)(Halse et al., 2011). PAS are cost-efficient sampling deviceswhich typically integrate air concentrations over longer time-periods (weeks, months, years) (Harner et al., 2006; Shoeiband Harner, 2002), and which have become popular both fortemporal (Schuster et al., 2011) and spatial surveys (Pozoet al., 2009). From these data, it becomes evident that rela-tive large differences in observed air concentrations of pyreneare measured between adjacent stations in e.g. central partsof Europe. Halse et al. (2011) found that the max/min ratiofor measured air concentrations varied from>380 (β-HCH)to 5 (HCB), illustrating that what may be considered ade-quate spatial coverage for some POPs may not be sufficientfor others. This study also included a direct comparison ofPAS results with EMEP data, highlighting that coordinatedPAS campaigns have the potential to serve as a valuable inter-comparison resource, both within EMEP and beyond, whichcomplements insights from interlaboratory intercomparisonsalone (e.g. Su and Hung, 2010).
7.3 Temporal trends of selected POPs
Although the temporal coverage (sampling duration and fre-quency) of air measurements varies within the EMEP POPs
www.atmos-chem-phys.net/12/5447/2012/ Atmos. Chem. Phys., 12, 5447–5481, 2012

5470 K. Tørseth et al.: Introduction to the European Monitoring and Evaluation Programme (EMEP)
measurement programme, all air measurements are carriedout using active air sampling (AAS) techniques. To illustratesome of the EMEP POPs data that are available, we haveplotted the long-term temporal trends of two hexachlorocy-clohexanes (HCHs) in air from seven EMEP sites with longterm measurements in Fig. 23. HCH is an insecticide whichhas seen extensive use world-wide (Li, 1999), either as un-purified technical HCH (55–80 %α-HCH, 8–15 %γ -HCH)or as lindane (>99 % γ -HCH which is the isomer with in-secticidal properties) (Breivik et al., 1999). In Europe, it hasbeen estimated that 382 000 tonnes of technical HCH and81 000 tonnes lindane were used between 1970 and 1996(Breivik et al., 1999). HCH was also produced at several fac-tories in Europe, but this has apparently ceased across thecontinent when production ended in Romania a few yearsago (Vijgen et al., 2011). While the production and use ofHCH may have peaked in the late 1960s/early 1970s and de-clined thereafter, the attention in recent years has increas-ingly shifted towards the problems associated with remain-ing stockpiles and wastes (Vijgen et al., 2011). As seen fromFig. 23 and as further confirmed by the statistical analysisin Table 7, both HCHs show a significant decrease in an-nual average air concentrations. Yet, there are also some no-table differences in levels and patterns among these two iso-mers which deserve attention. As comparing and contrastingdata from different laboratories is a complicating factor (Suand Hung, 2010) when interpreting POP measurements fromdifferent sites, specific attention is given towards the longertime-trends from the Norwegian sites. Unlike Lista/Birkenes(NO99/NO01), the Zeppelin observatory (NO42) is locatedin the high Arctic at Spitsbergen. These Norwegian EMEPsites all show a fairly consistent decline inα-HCH andγ -HCH over almost two decades. Furthermore, air concentra-tions of α-HCH are also very similar at these Norwegiansites over the years (Fig. 23a). Still, there is a striking dif-ference when comparing the divergent atmospheric concen-trations ofγ -HCH at Zeppelin versus those in southern Nor-way (Fig. 23b). While this could have something to do withdifferent patterns of historical usage of technical HCH andlindane affecting these two stations (for which only technicalHCH contains significant amounts ofα-HCH), it is also seenas a reflection of differences in physical-chemical propertiesbetween different HCH isomers (Xiao et al., 2004). This is inturn expected to affect the LRT potential within the group ofHCHs (Beyer et al., 2003; Li et al., 2002), withγ -HCH beingmore easily subject to wet deposition compared toα-HCH.α-HCH is also seen as the isomer with a more significant po-tential for re-volatilization (Breivik and Wania, 2002; Harneret al., 1999). Thus, the example shown (Fig. 23) serves to il-lustrate that even for POPs having identical chemical formu-las but different isomers, there may be significant differencesin LRT behaviour.
Table 7 presents a trend analysis for selected POPs in pre-cipitation and air during 1996–2009. Beyond including datafor α- andγ -HCH previously introduced and discussed, we
Fig. 23. Temporal trends in annual average air concentrations(pg m−3) for α-HCH (top) andγ -HCH (bottom) at EMEP sites.Two sites located in the vicinity of each other both in Norway andSweden are combined for trend analysis.
have included two PAHs (benzo[a]pyrene and pyrene) andthree of the indicator polychlorinated biphenyls (PCBs: 28,153 and 180). These substances belong to a group of 209different industrial chemicals which were produced between1930 and 1993 with a peak in∼ 1970 (Breivik et al., 2007).Finally, we have included hexachlorobenzene (HCB) in thetrend analysis as a representative of POPs recognized as hav-ing miscellaneous sources (Barber et al., 2005). HCB is fur-thermore characterised by its elevated volatility comparedto many legacy POPs combined with a long atmospherichalf-life (Wania and Mackay, 1996), leading to a high atmo-spheric mobility and limited spatial variability in remote ar-eas (Jaward et al., 2004a). From Table 7 we observe that eachof these legacy POPs, whether measured in air or precipita-tion, all show a significant decline at one or more sites duringthe time period from 1996 to 2009. However, this pattern isonly consistent across all sites and both media for the HCHs.For the other compounds and compartments, there is alwaysone or more site(s) not showing a significantly decreasingtrend. For PCB-28 in precipitation, one of the sites (DE09) iseven showing a significant increase which intuitively is hardto rationalize for a substance for which global production
Atmos. Chem. Phys., 12, 5447–5481, 2012 www.atmos-chem-phys.net/12/5447/2012/
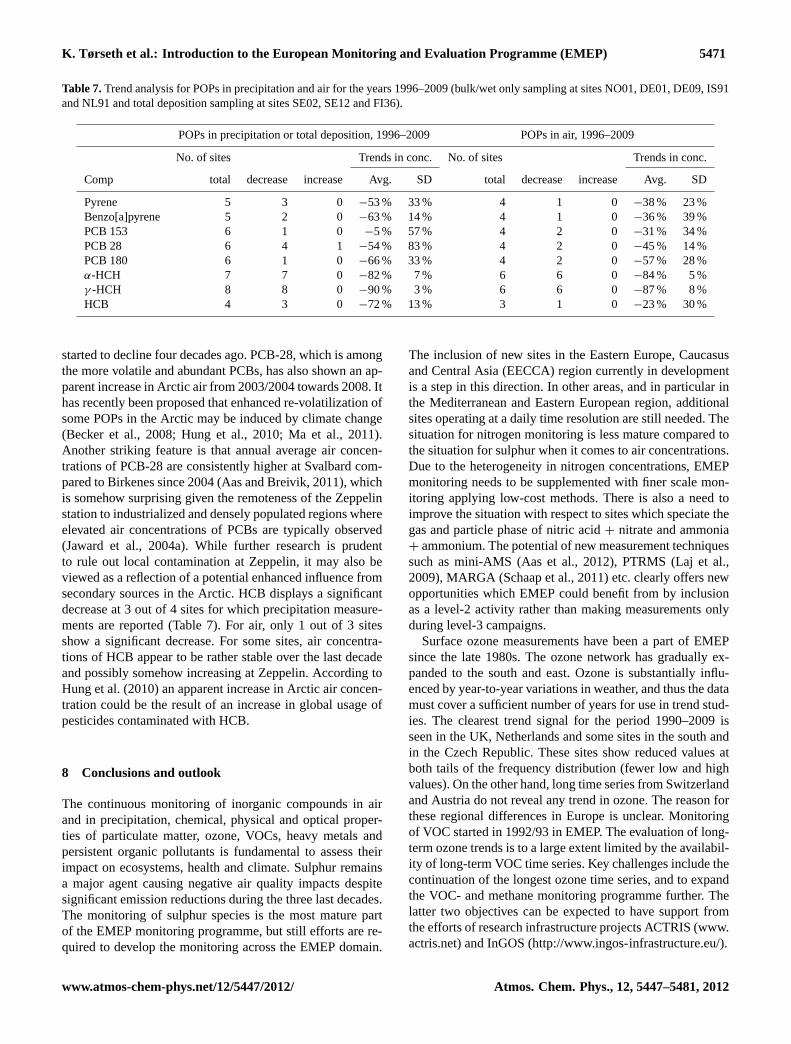
K. Tørseth et al.: Introduction to the European Monitoring and Evaluation Programme (EMEP) 5471
Table 7.Trend analysis for POPs in precipitation and air for the years 1996–2009 (bulk/wet only sampling at sites NO01, DE01, DE09, IS91and NL91 and total deposition sampling at sites SE02, SE12 and FI36).
POPs in precipitation or total deposition, 1996–2009 POPs in air, 1996–2009
No. of sites Trends in conc. No. of sites Trends in conc.
Comp total decrease increase Avg. SD total decrease increase Avg. SD
Pyrene 5 3 0 −53 % 33 % 4 1 0 −38 % 23 %Benzo[a]pyrene 5 2 0 −63 % 14 % 4 1 0 −36 % 39 %PCB 153 6 1 0 −5 % 57 % 4 2 0 −31 % 34 %PCB 28 6 4 1 −54 % 83 % 4 2 0 −45 % 14 %PCB 180 6 1 0 −66 % 33 % 4 2 0 −57 % 28 %α-HCH 7 7 0 −82 % 7 % 6 6 0 −84 % 5 %γ -HCH 8 8 0 −90 % 3 % 6 6 0 −87 % 8 %HCB 4 3 0 −72 % 13 % 3 1 0 −23 % 30 %
started to decline four decades ago. PCB-28, which is amongthe more volatile and abundant PCBs, has also shown an ap-parent increase in Arctic air from 2003/2004 towards 2008. Ithas recently been proposed that enhanced re-volatilization ofsome POPs in the Arctic may be induced by climate change(Becker et al., 2008; Hung et al., 2010; Ma et al., 2011).Another striking feature is that annual average air concen-trations of PCB-28 are consistently higher at Svalbard com-pared to Birkenes since 2004 (Aas and Breivik, 2011), whichis somehow surprising given the remoteness of the Zeppelinstation to industrialized and densely populated regions whereelevated air concentrations of PCBs are typically observed(Jaward et al., 2004a). While further research is prudentto rule out local contamination at Zeppelin, it may also beviewed as a reflection of a potential enhanced influence fromsecondary sources in the Arctic. HCB displays a significantdecrease at 3 out of 4 sites for which precipitation measure-ments are reported (Table 7). For air, only 1 out of 3 sitesshow a significant decrease. For some sites, air concentra-tions of HCB appear to be rather stable over the last decadeand possibly somehow increasing at Zeppelin. According toHung et al. (2010) an apparent increase in Arctic air concen-tration could be the result of an increase in global usage ofpesticides contaminated with HCB.
8 Conclusions and outlook
The continuous monitoring of inorganic compounds in airand in precipitation, chemical, physical and optical proper-ties of particulate matter, ozone, VOCs, heavy metals andpersistent organic pollutants is fundamental to assess theirimpact on ecosystems, health and climate. Sulphur remainsa major agent causing negative air quality impacts despitesignificant emission reductions during the three last decades.The monitoring of sulphur species is the most mature partof the EMEP monitoring programme, but still efforts are re-quired to develop the monitoring across the EMEP domain.
The inclusion of new sites in the Eastern Europe, Caucasusand Central Asia (EECCA) region currently in developmentis a step in this direction. In other areas, and in particular inthe Mediterranean and Eastern European region, additionalsites operating at a daily time resolution are still needed. Thesituation for nitrogen monitoring is less mature compared tothe situation for sulphur when it comes to air concentrations.Due to the heterogeneity in nitrogen concentrations, EMEPmonitoring needs to be supplemented with finer scale mon-itoring applying low-cost methods. There is also a need toimprove the situation with respect to sites which speciate thegas and particle phase of nitric acid+ nitrate and ammonia+ ammonium. The potential of new measurement techniquessuch as mini-AMS (Aas et al., 2012), PTRMS (Laj et al.,2009), MARGA (Schaap et al., 2011) etc. clearly offers newopportunities which EMEP could benefit from by inclusionas a level-2 activity rather than making measurements onlyduring level-3 campaigns.
Surface ozone measurements have been a part of EMEPsince the late 1980s. The ozone network has gradually ex-panded to the south and east. Ozone is substantially influ-enced by year-to-year variations in weather, and thus the datamust cover a sufficient number of years for use in trend stud-ies. The clearest trend signal for the period 1990–2009 isseen in the UK, Netherlands and some sites in the south andin the Czech Republic. These sites show reduced values atboth tails of the frequency distribution (fewer low and highvalues). On the other hand, long time series from Switzerlandand Austria do not reveal any trend in ozone. The reason forthese regional differences in Europe is unclear. Monitoringof VOC started in 1992/93 in EMEP. The evaluation of long-term ozone trends is to a large extent limited by the availabil-ity of long-term VOC time series. Key challenges include thecontinuation of the longest ozone time series, and to expandthe VOC- and methane monitoring programme further. Thelatter two objectives can be expected to have support fromthe efforts of research infrastructure projects ACTRIS (www.actris.net) and InGOS (http://www.ingos-infrastructure.eu/).
www.atmos-chem-phys.net/12/5447/2012/ Atmos. Chem. Phys., 12, 5447–5481, 2012
5472 K. Tørseth et al.: Introduction to the European Monitoring and Evaluation Programme (EMEP)
The reductions in heavy metal emissions within Europehave been extensive, and the observation data clearly reflectthese changes. The monitoring of heavy metals concentra-tions in precipitation is generally satisfactory, but fewer sitesmeasure concentrations in air. For mercury, the Europeansources have been reduced significantly resulting in a rela-tively large contribution from non-European sources to am-bient levels. The monitoring efforts within Europe have grad-ually improved in Northern Europe, while other regions havelittle data. Additional sites are clearly also needed outside theEMEP region.
Time-series for some POPs are now approaching twodecades, yet challenges remain in deciphering the relativeimportance of primary and secondary emissions as well asthe potential influence of processes related to climate changein controlling these time trends. However, complementedwith independent data sets on POPs derived during spe-cific campaigns by various research groups (e.g. Jaward etal., 2004a, b) and other relevant monitoring efforts withinparts of Europe, such as the UK TOMPS programme (ToxicOrganic Micro-pollutants Monitoring Network) (Schuster etal., 2010), MONET CEEC (Monitoring of persistent or-ganic compounds in the air using the passive air samplingtechnique) in Central and Eastern Europe and MONARPOP(Monitoring Network in the Alpine Region for Persistentand other Organic Pollutants in the Alps) (Kaiser, 2009), thespatial coverage for many legacy POPs have recently beenjudged to be adequate (HTAP, 2010). Of vital importance tothe improved understanding of spatial patterns in recent yearshave been the recent developments within passive air sam-pling (PAS) techniques (e.g. Harner et al., 2006; Ockenden etal., 1998) and their application at a variety of spatial scales.However, a major limitation of the PAS technique is that itonly captures the gaseous fraction of POPs in air. Secondly,the uncertainty in back-calculated air concentrations derivedon the basis of PAS relying on polyurethane foam disks haspreviously been estimated to be within a factor 2–3 (Gouinet al., 2005; Harner et al., 2006). Finally, information rele-vant to assess the short-term variability of air concentrationsis lost using PAS techniques which integrate air concentra-tions over longer time periods. Hence, the active samplingtechniques offering better temporal resolution which are en-couraged under the EMEP programme remain essential forevaluating model predictions and to assess potential sourceregions controlling specific LRT events (Malanichev et al.,2004). For example, the use of active techniques was essen-tial to identify the impact of biomass burning on air concen-trations of PCBs in the Arctic (Eckhardt et al., 2007). Thereis nevertheless still potential for further development and im-provement to the EMEP POPs programme, which in part alsowill depend on future scientific developments. Examples are(i) further assessment and improvement of QA/QC-protocolsto ensure the comparability of data, and (ii) further devel-opment of sampling and analytical techniques of new POPs
with divergent properties to the many legacy POPs that wereinitially included under the POP protocol.
EMEP has since it initiation based its work on consen-sus driven activities where national experts and nominatedinstitutions have collaborated to address the transboundaryaspects of air pollution. The activities have thus ranged fromsimple but robust monitoring to innovative and state-of-the-art observations using new technologies. This synergy ofoperational and scientific activities has been very success-ful, and is a key basis element of the most recently adoptedEMEP monitoring strategy (valid for the period 2010–2019).The national monitoring activity serves as a mechanism toinvolve national stakeholders and expertise also in the pol-icy formulations. The Research Infrastructures activities ofthe European Commission Framework Programmes (EC-FP)have contributed to these efforts and have strengthened spe-cific aspects of the EMEP monitoring programme signifi-cantly. Still, there are obvious challenges across the EMEPdomain in maintaining and developing the monitoring activ-ities. A particular concern is the observation that some coun-tries are reducing their ambitions related to air quality issues.We note also that the financial basis for international collab-orative research related to atmospheric composition researchhas been significantly reduced during the last years. Duringthe period of existence of EMEP both national research pro-grammes as well as EC-FP4 to EC-FP7 programmes haveprovided such opportunities. There is thus extensive docu-mentation that long-term monitoring activities benefit frombeing supplemented by research programmes which can sup-port in-depth analyses of data in combination with modelsand other tools. The tendency during the latter years is how-ever an increased focus on other societal questions. We arguehowever that uncertainties in understanding the atmosphericcomposition changes are still large and that a strengtheningof the area will yield improved climate, health and ecosystemresearch results and, thus, better guidance for environmentalpolicy.
Atmos. Chem. Phys., 12, 5447–5481, 2012 www.atmos-chem-phys.net/12/5447/2012/

K. Tørseth et al.: Introduction to the European Monitoring and Evaluation Programme (EMEP) 5473
Appendix A
Table A1. List of stations included in the trend analysis (for information about other sites presented on maps we refer tohttp://ebas.nilu.no).
CODE Station Name Lat. Long. m a.s.l.
AT0002R Illmitz 47◦46′0′′ N 16◦46′0′′ E 117AT0041R Haunsberg 47◦58′23′′ N 13◦0′58′′ E 730BE0032R Eupen 51◦27′27′′ N 6◦0′10′′ E 295CH0002R Payerne 46◦48′47′′ N 6◦56′41′′ E 489CH0005R Rigi 47◦4′3′′ N 8◦27′50′′ E 1031CZ0001R Svratouch 49◦44′0′′ N 16◦3′0′′ E 737CZ0003R Kosetice 49◦35′0′′ N 15◦5′0′′ E 534DE0001R Westerland 54◦55′32′′ N 8◦18′35′′ E 12DE0002R Langenbrugge 52◦48′8′′ N 10◦45′34′′ E 74DE0003R Schauinsland 47◦54′53′′ N 7◦54′31′′ E 1205DE0007R Neuglobsow 53◦10′0′′ N 13◦2′0′′ E 62DE0008R Schmucke 50◦39′0′′ N 10◦46′0′′ E 937DE0009R Zingst 54◦26′0′′ N 12◦44′0′′ E 1DE0043G Hohenpeissenberg 47◦48′0′′ N 11◦1′0′′ E 985DK0003R Tange 56◦21′0′′ N 9◦36′0′′ E 13DK0031R Ulborg 56◦17′0′′ N 8◦26′0′′ E 10ES0009R Campisabalos 41◦16′52′′ N 3◦8′34′′ W 1360FI0009R Uto 59◦46′45′′ N 21◦22′38′′ E 7FI0036R Pallas (Matorova) 68◦0′0′′ N 24◦14′23′′ E 340FI0050R Hyytiala 61◦51′0′′ N 24◦17′0′′ E 181FI0096G Pallas (Sammaltunturi) 68◦0′0′′ N 24◦9′0′′ E 340FR0013R Peyrusse Vieille 43◦37′0′′ N 0◦11′0′′ E 200FR0015R La Tardiere 46◦39′0′′ N 0◦45′0′′ W 133GB0002R Eskdalemuir 55◦18′47′′ N 3◦12′15′′ W 243GB0006R Lough Navar 54◦26′35′′ N 7◦52′12′′ W 126GB0036R Harwell 51◦34′23′′ N 1◦19′0′′ W 137GB0038R Lullington Heath 50◦47′34′′ N 0◦10′46′′ E 120GB0091R Banchory 57◦4′36′′ N 2◦32′4′′ W 120IE0031R Mace Head 53◦10′0′′ N 9◦30′0′′ W 15IS0091R Storhofdi 63◦24′0′′ N 20◦17′0′′ W 118IT0004R Ispra 45◦48′0′′ N 8◦38′0′′ E 209NL0009R Kollumerwaard 53◦20′2′′ N 6◦16′38′′ E 1NL0010R Vredepeel 51◦32′28′′ N 5◦51′13′′ E 28NO0001R Birkenes 58◦23′0′′ N 8◦15′0′′ E 190NO0015R Tustervatn 65◦50′0′′ N 13◦55′0′′ E 439NO0042G Spitsbergen, Zeppelinfjell 78◦54′0′′ N 11◦53′0′′ E 474NO0043R Prestebakke 59◦0′0′′ N 11◦32′0′′ E 160NO0099R Lista 58◦6′0′′ N 6◦34′0′′ E 13SE0002R Rorvik 57◦25′0′′ N 11◦56′0′′ E 10SE0011R Vavihill 56◦1′0′′ N 13◦9′0′′ E 175SE0012R Aspvreten 58◦48′0′′ N 17◦23′0′′ E 20SE0014R Rao 57◦23′38′′ N 11◦54′50′′ E 5SI0032R Krvavec 46◦17′58′′ N 14◦32′19′′ E 1740SK0004R Stara Lesna 49◦9′0′′ N 20◦17′0′′ E 808
www.atmos-chem-phys.net/12/5447/2012/ Atmos. Chem. Phys., 12, 5447–5481, 2012

5474 K. Tørseth et al.: Introduction to the European Monitoring and Evaluation Programme (EMEP)
Appendix B
Table B1. Emission data used for trend analysis (from EMEP/CEIP, 2011).
SOx NOx Nred PM NMVOC
Area/Year 1980 1990 2000 2009 1980 1990 2000 2009 1980 1990 2000 2009 2000 2009 1990 2009Albania 72 74 39 37 24 23 21 29 32 23 29 24 9 14 31 32Armenia 141 86 11 26 15 60 31 24 25 24 13 17 0 0 95 41Austria 360 74 32 21 246 212 206 187 52 69 65 64 23 20 284 123Azerbaijan 15 615 162 85 43 171 104 91 25 68 37 53 6 4 376 238Belarus 740 888 162 155 234 379 208 168 142 215 142 150 40 27 497 216Belgium 828 361 172 76 442 382 334 213 89 112 85 67 33 16 305 108Bosnia and 482 484 420 431 79 73 53 51 31 21 17 17 20 19 48 43HerzegovinaBulgaria 2050 2007 918 658 416 363 184 165 144 144 56 51 59 34 214 146Croatia 150 178 62 67 60 88 74 77 37 53 39 36 9 10 105 80Cyprus 28 46 46 17 13 19 22 19 8.5 5 6 5 4 2 16 11Czech Republic 2257 1876 264 173 937 742 321 251 156 157 74 73 28 20 374 151Denmark 452 176 29 15 307 266 201 132 138 134 93 77 22 24 166 95Estonia 287 274 97 55 70 74 37 29 24 26 10 10 21 19 71 36Finland 584 259 79 59 295 299 210 153 39 38 37 37 40 38 221 111France 3214 1333 632 303 2024 1829 1575 1117 795 787 802 744 381 270 2414 878Georgia 230 43 7 23 121 64 30 51 97 36 20 26 3 2 151 228Germany (DDR+ 7514 5289 656 448 3334 2878 1911 1370 835 758 594 597 143 100 3584 1285FRG merged)Greece 400 487 493 427 306 299 328 375 79 79 74 63 49 63 281 212Hungary 1633 1011 486 80 273 276 185 167 157 124 71 68 26 28 252 128Iceland 18 9 35 74 21 9 27 24 3 4 4 4 1 0 12 6Ireland 222 186 140 33 73 119 138 90 112 114 121 108 12 9 111 52Italy 3440 1795 749 231 1585 1945 1431 981 441 405 449 391 179 144 2023 1107KazakhstanKyrgyzstanLatvia 96 97 16 4 83 69 36 29 38 47 13 16 23 28 73 61Lithuania 311 263 43 36 152 158 47 65 85 82 25 28 0 0 0Luxembourg 24 26 2 3 23 20 16 19 7 7 7 4 17 10 136 70Malta 29a 29 24 16 14a 14 8 11 1a 1 2 2 1 1 8 3Netherlands 490 189 73 38 583 549 395 276 234 249 163 125 24 16 491 154Norway 136 53 27 16 191 224 210 178 20 20 24 23 59 42 295 140Poland 4100 3278 1511 861 1229 1581 838 820 550 511 322 273 135 120 832 615Portugal 253 317 284 76 158 243 293 239 96 55 61 48 87 76 273 179Republic of 308 175 13 7 115 131 27 29 53 61 25 27 2 6 123 36MoldovaRomania 1055 1310 760 460 523 527 297 247 340 289 206 188 116 123 517 432Russiab 7323 6113 2263 1723b 3634 3600 2457 3350b 1189 1204 663 602b 0 0 0 0Serbia (and 406 593 396 453 192 165 137 141 90 74 65 60 45 41 158 126Montenegro)Slovakia 780 542 127 64 197 215 107 86 63 66 32 25 23 28 122 65Slovenia 234 198 92 12 51 63 50 45 24 25 19 18 14 13 53 31Spain 2913 2166 1419 403 1068 1247 1277 946 285 329 377 354 95 73 1135 671Sweden 491 117 42 30 404 306 210 149 54 55 56 48 28 27 443 180Switzerland 116 42 18 13 170 156 107 78 77 68 66 64 12 10 262 91TajikistanTFYR 107 110 90 113 39 46 39 33 17 15 14 7 9 9 21 28Turkey 1030 1519 2000 1557 364 691 1118 1278 321 373 402 409 305 247 636 1320TurkmenistanUkraine 3849 3921 1599 1290 1145 1753 871 528 729 373 485 187 289 276 1053 275United Kingdom 4852 3699 1253 397 2580 2932 1789 1086 361 373 333 288 103 70 2396 826UzbekistanNorth AfricaAsianBaltic Sea 228 168 188 122 352 236 276 327 22 17 8 13Black Sea 57 45 56 69 86 62 81 97 7 8 2 4Mediterranean Sea 1189 858 1070 1306 1639 1234 1564 1868 124 153 41 67North Sea 454 361 443 288 648 508 649 771 52 39 18 29Remaining NE 901 384 494 614 1266 565 723 858 58 71 19 30Atlantic OceanNatural marine 743a 743 743 743Volcanic 2000a 2000 2000 2000
TOTAL 59 592 46 863 22 737 16 368 27 810 27 865 21 253 19 318 8095 7673 6198 5478 2759 2366 20 748 10 777sum Parties 54 020 42 304 17 743 11 226 27 786 27 842 21 232 15 397 8095 7673 6198 5478 2497 2078 20 659 10 634marine 2829 1816 2251 2399 55 581 55 648 42 454 3921 262 288 88 143
a Data for 1980 not available, used 1990.b Emissions from Russia is sum of Kaliningrad, Kazakhstan in the former official EMEP domain; Kola/Karelia; St. Petersburg/Novgorod-Pskov; Rest of the Russian Federation.Not comparable dataset for 2009, and used emissions from 2006 instead.
Atmos. Chem. Phys., 12, 5447–5481, 2012 www.atmos-chem-phys.net/12/5447/2012/

K. Tørseth et al.: Introduction to the European Monitoring and Evaluation Programme (EMEP) 5475
Acknowledgements.We would like to express our thanks to allthose who are involved in the EMEP monitoring efforts and havecontributed through operating sites, performing chemical analysisand by submissions of data. This work was supported by theCo-operative Programme for Monitoring and Evaluation of theLong-range Transmission of Air pollutants in Europe (EMEP)under UNECE. We also thank the reviewers and the editor forvaluable contributions to the paper.
Edited by: D. Simpson
References
Aas, W. and Breivik, K.: Heavy metals and POP measure-ments, 2009, Norwegian Institute for Air Research, Kjeller,EMEP/CCC-Report 3/2011, 2011.
Aas, W., Hjellbrekke, A.-G., Schaug, J., and Solberg, S.: Data qual-ity 1999, quality assurance and field comparisons, Kjeller, Nor-wegian Institute for Air Research, EMEP/CCC Report 6/2001,2001.
Aas, W., Hanssen, J. E., and Schaug, J.: Field intercomparison ofmain components in air in EMEP, Water Air Soil Poll. Focus,1567–7230, 2007.
Aas, W., Alleman, L. Y., Bieber, E., Coleman, P., Gladtke, D.,Houdret, J.-L., Karlsson, V., and Monies, C.: Comparison ofmethods for measuring atmospheric deposition of arsenic, cad-mium, nickel and lead, J. Environ. Monit., 11, 1276–1283, 2009.
Aas, W., Tsyro, S., Bieber, E., Bergstrom, R., Ceburnis, D., Eller-mann, T., Fagerli, H., Frolich, M., Gehrig, R., Makkonen, U.,Nemitz, E., Otjes, R., Perez, N., Perrino, C., Prevot, A. S. H.,Putaud, J.-P., Simpson, D., Spindler, G., Vana, M., and Yttri,K. E.: Lessons learnt from the first EMEP intensive measure-ment periods, Atmos. Chem. Phys. Discuss., 12, 3731–3780,doi:10.5194/acpd-12-3731-2012, 2012.
AMAP Assessment 2011: Mercury in the Arctic. Arctic Monitoringand Assessment Programme (AMAP), Oslo, Norway. xiv + 193pp., 2011.
Audrone, R. M.: Long-term trends of benzo(a)pyrene concentrationon the eastern coast of the Baltic Sea, Atmos. Environ, 40, 2046–2057,doi:10.1016/j.atmosenv.2005.11.045, 2006.
Baldsano, J. M., Goncalves, M., and Jimenz, P.: A review of back-ground air quality trends in Europe using EMEP data. Air pol-lution XIII, Thirteenth International Conference on Modelling,Monitoring and Management of Air Pollution, 82, 129–138,2005.
Barber, J. L., Sweetman, A. J., van Wijk, D., and Jones, K. C.:Hexachlorobenzene in the global environment: Emissions, lev-els, distribution, trends and processes, Sci. Total Environ., 349,1–44, 2005.
Barmpadimos, I., Keller, J., Oderbolz, D., Hueglin, C., and Prevot,A. S. H.: One decade of parallel fine (PM2.5) and coarse(PM10–PM2.5) particulate matter measurements in Europe:trends and variability, Atmos. Chem. Phys., 12, 3189–3203,doi:10.5194/acp-12-3189-2012, 2012.
Becker, S., Halsall, C. J., Tych, W., Kallenborn, R., Su, Y., andHung, H.: Long-term trends in atmospheric concentrations ofalpha- and gamma-HCH in the Arctic provide insight into the ef-fects of legislation and climatic fluctuations on contaminant lev-els, Atmos. Environ., 42, 8225–8233, 2008.
Berg, T. and Semb, A.: Preliminary results from the HELCOM– EMEP – PARCOM – AMAP analytical intercomparison ofheavy metals in precipitation, Norwegian Institute for Air Re-search, Kjeller, EMEP/CCC-Note 1/95, 1995.
Beyer, A., Wania, F., Gouin, T., Mackay, D., and Matthies, M.: Tem-perature dependence of the characteristic travel distance, Envi-ron. Sci. Technol., 37, 766–771, 2003.
Breivik, K. and Wania, F.: Mass budgets, pathways, and equilibriumstates of two hexachlorocyclohexanes in the Baltic Sea environ-ment, Environ. Sci. Technol., 36, 1024–1032, 2002.
Breivik, K., Pacyna, J. M., and Munch, J.: Use of alpha-, beta- andgamma-hexachlorocyclohexane in Europe, 1970–1996, Sci. To-tal Environ., 239, 151–163, 1999.
Breivik, K., Sweetman, A., Pacyna, J. M., and Jones, K. C.: To-wards a global historical emission inventory for selected PCBcongeners – A mass balance approach 3 An update, Sci. TotalEnviron., 377, 296–307, 2007.
Brorstrom-Lunden, E., Lindskog, A., and Mowrer, J.: Concentra-tions and fluxes of organic compounds in the atmosphere of theSwedish west coast, Atmos. Environ., 28, 3605–3615, 1994.
Cavalli, F. and Putaud, J. P.: Results of the 2010’ intercomparisonof TC, OC and EC analytical methods, in: Transboundary Par-ticulate Matter in Europe: EMEP Status Report 2009, edited by:Yttri, K. E., Norwegian Institute for Air Research, Kjeller, EMEPReport 4/2011, 55–61, 2011.
Cavalli, F., Viana, M., Yttri, K. E., Genberg, J., and Putaud, J.-P.:Toward a standardised thermal-optical protocol for measuringatmospheric organic and elemental carbon: the EUSAAR proto-col, Atmos. Meas. Tech., 3, 79–89,doi:10.5194/amt-3-79-2010,2010.
CEN: Air Quality – Determination of the PM10 fraction of sus-pended particulate matter – Reference method and field test pro-cedure to demonstrate reference equivalence of measurementmethods, European Committee for Standardization, Brussels,CEN EN 12341:1998, 1999.
CEN: Standard gravimetric measurement method for the determi-nation of the PM2.5 mass fraction of suspended particulate mat-ter, European Committee for Standardization, Brussels, CEN EN14907:2005, 2005.
Chevalier, A., Gheusi, F., Delmas, R., Ordonez, C., Sarrat, C.,Zbinden, R., Thouret, V., Athier, G., and Cousin, J.-M.: Influ-ence of altitude on ozone levels and variability in the lowertroposphere: a ground-based study for western Europe overthe period 2001–2004, Atmos. Chem. Phys., 7, 4311–4326,doi:10.5194/acp-7-4311-2007, 2007.
Cofala, J., Amann, M., Heyes, C., Klimont, Z., Posch, M., Schopp,W., Tarasson, L., Jonson, J., Whall, C., and Stavrakaki, A.: FinalReport: Analysis of Policy Measures to Reduce Ship Emissionsin the Context of the Revision of the National Emissions Ceil-ings Directive, March 2007, International Institute for AppliedSystems Analysis, Laxenburg, Austria, 74 pp., 2007.
Colette, A., Granier, C., Hodnebrog, Ø., Jakobs, H., Maurizi, A.,Nyiri, A., Bessagnet, B., D’Angiola, A., D’Isidoro, M., Gauss,M., Meleux, F., Memmesheimer, M., Mieville, A., Rouıl, L.,Russo, F., Solberg, S., Stordal, F., and Tampieri, F.: Air qualitytrends in Europe over the past decade: a first multi-model assess-ment, Atmos. Chem. Phys., 11, 11657–11678,doi:10.5194/acp-11-11657-2011, 2011.
www.atmos-chem-phys.net/12/5447/2012/ Atmos. Chem. Phys., 12, 5447–5481, 2012
5476 K. Tørseth et al.: Introduction to the European Monitoring and Evaluation Programme (EMEP)
Dayan, U. and Lamb, D.: Global and synoptic-scaleweather patterns controlling wet atmospheric deposi-tion over central Europe, Atmos. Environ., 39, 521–533,doi:10.1016/j.atmosenv.2004.09.063, 2005.
Denier van der Gon, H., Jozwicka, M., Hendriks, E., Gondwe, M.,and Martijn Schaap, M.: Mineral Dust as a component of Partic-ulate Matter, 78 pp., TNO Report 500099003, ECN, Bilthoven,The Netherlands, 2010
Dore, A. J., Vieno, M., Tang, Y. S., Dragosits, U., Dosio, A., We-ston, K. J., and Sutton, M. A.: Modelling the atmospheric trans-port and deposition of sulphur and nitrogen over the United King-dom and assessment of the influence of SO2 emissions from in-ternational shipping, Atmos. Environ., 41, 2355–2367, 2007.
Dvorska, A., Lammel, G., Klanova, J., and Holoubek, I.: Kosetice,Czech Republic – ten years of air pollution monitoring and fouryears of evaluating the origin of persistent organic pollutants, En-viron. Pollut., 156, 403–408, 2008.
Eckhardt, S., Breivik, K., Manø, S., and Stohl, A.: Record highpeaks in PCB concentrations in the Arctic atmosphere dueto long-range transport of biomass burning emissions, At-mos. Chem. Phys., 7, 4527–4536,doi:10.5194/acp-7-4527-2007,2007.
Eckhardt, S., Breivik, K., Li, Y. F., Manø, S., and Stohl, A.: Sourceregions of some persistent organic pollutants measured in the at-mosphere at Birkenes, Norway, Atmos. Chem. Phys., 9, 6597–6610,doi:10.5194/acp-9-6597-2009, 2009.
EEA: Assessment of ground-level ozone in EEA member coun-tries, with a focus on long-term trends, European EnvironmentAgency, Copenhagen, EEA Technical Report No. 7/2009, 2009.
EEA: Air quality in Europe – 2011 report, European EnvironmentAgency, Copenhagen, EEA Technical Report No. 12/2011, 2011.
Egner, H., Brodin, G., and Johansson, O.: Sampling techniqueand chemical examination of air and precipitation, Kungl. Lant-brukshogskolans Annaler, 22, 369–410, 1955.
EMEP/CCC: Manual for sampling and chemical analysis, Nor-wegian Institute for Air Research, Kjeller, EMEP/CCC Re-port 1/95 (Last rev. 2001),http://tarantula.nilu.no/projects/ccc/manual/index.html[2011-08-30], 2001.
EMEP-WMO: Workshop on Strategies for Monitoring of RegionalAir Pollution in relation to the need within EMEP, GAW andother international bodies, Aspenas Herrgard, Lerum, Sweden,2–4 June 1997, edited by: Schaug, J. and Uhse, K., Kjeller, Nor-wegian Institute for Air Research, EMEP/CCC-Report 10/97,1997.
EMEP-WMO: EMEP-WMO workshop on fine particles – emis-sions, modelling and measurements, Interlaken, Switzerland 22–25 November 1999, edited by: Hanssen, J. E., Ballaman, R.,and Gehrig, R., Kjeller, Norwegian Institute for Air Research,EMEP/CCC-Report 9/2000, 2000.
EMEP: Transboundary Particulate Matter in Europe: EMEP StatusReport 2009, edited by: Yttri, K. E., Kjeller, Norwegian Institutefor Air Research, EMEP Report 4/2011, 2011.
EMEP/CEIP: Emission data downloaded from WebDab inNovember 2011, http://www.ceip.at/emission-data-webdab/emissions-as-used-in-emep-models/, 2011.
Eliassen, A.: The OECD study of long range transport of air pollu-tants: long-range transport modeling, Atmos. Environ., 12, 479–487, 1978.
Eliassen, A., Saltbones, J., Stordal, F., Hov, Ø., and Isaksen, I. S. A.:A Lagrangian Long-Range Transport Model with AtmosphericBoundary Layer Chemistry, J. Appl. Meteor., 21, 1645–1661,1982.
EU: Council Directive 1999/30/EC of 22 April 1999 relating to limitvalues for sulphur dioxide, nitrogen dioxide and oxides of ni-trogen, particulate matter and lead in ambient air, Off. J. Eur.Comm., L 163, 29/06/1999, 0041 – 0060, 1999.
EU: Directive 2004/107/EC of the European Parliament and of thecouncil of 15 December 2004 relating to arsenic, cadmium, mer-cury, nickel and polycyclic aromatic hydrocarbons in ambient air,Off. J. Eur. Comm., L23, 26/01/2005, 3–16, 2004.
EU: Directive 2008/50/EC of the European Parliament and of thecouncil of 21 May 2008 on ambient air quality and cleaner airfor Europe, Off. J. Eur. Comm., L152,11/6/2008, 1–44, 2008.
Eyring, V., Isaksen, I., Berntsen, T., Collins, W. J., Corbett, J., En-dresen, O., Grainger, R. G, Moldanova, J., Schlager, H., andStevenson, D. S.: Transport impacts on atmosphere and climate:Shipping, Atmos. Environ., 44, 4735–4771, 2010.
Fagerli, H. and Aas, W.: Trends of nitrogen in air and precipitation:Model results and observations at EMEP sites in Europe, 1980–2003, Environ. Poll., 154, 448–461, 2008.
Flechard, C. R., Nemitz, E., Smith, R. I., Fowler, D., Vermeulen, A.T., Bleeker, A., Erisman, J. W., Simpson, D., Zhang, L., Tang,Y. S., and Sutton, M. A.: Dry deposition of reactive nitrogen toEuropean ecosystems: a comparison of inferential models acrossthe NitroEurope network, Atmos. Chem. Phys., 11, 2703–2728,doi:10.5194/acp-11-2703-2011, 2011.
Forster, P., Ramaswamy, V., Artaxo, P., Berntsen, T., Betts, R., Fa-hey, D. W., Haywood, J., Lean, J., Lowe, D. C., Myhre, G.,Nganga, J., Prinn, R., Raga, G., Schulz, M., and Van Dorland,R.: Changes in Atmospheric Constituents and in Radiative Forc-ing, in: Climate Change 2007: The Physical Science Basis. Con-tribution of Working Group I to the Fourth Assessment Reportof the Intergovernmental Panel on Climate Change, edited by:Solomon, S., Qin, D., Manning, M., Chen, Z., Marquis, M., Av-eryt, K. B., Tignor, M., and Miller, H. L., Cambridge, CambridgeUniversity Press, 2007.
Fowler, D., Pilegaard, K., Sutton, M. A., Ambus, P., Raivonen, M.,Duyzer, J., Simpson, D., Fagerli, H., Fuzzi, S., Schjoerring, J.K., Granier, C., Neftel, A., Isaksen, I. S. A., Laj, P., Maione, M.,Monks, P. S., Burkhardt, J., Daemmgen, U., Neirynck, J., Per-sonne, E., Wichink-Kruit, R., Butterbach-Bahl, K., Flechard, C.,Tuovinen, J. P., Coyle, M., Gerosa, G., Loubet, B., Altimir, N.,Gruenhage, L., Ammann, C., Cieslik, S., Paoletti, E., Mikkelsen,T. N., Ro-Poulsen, H., Cellier, P., Cape, J. N., Horvath, L.,Loreto, F., Niinemets, U., Palmer, P. I., Rinne, J., Misztal, P.,Nemitz, E., Nilsson, D., Pryor, S., Gallagher, M. W., Vesala,T., Skiba, U., Brueggemann, N., Zechmeister-Boltenstern, S.,Williams, J., O’Dowd, C., Facchini, M. C., de Leeuw, G., Floss-man, A., Chaumerliac, N., and Erisman, J. W.: Atmospheric com-position change: Ecosystems-Atmosphere interactions, Atmos.Environ., 43, 5193–5267, 2009.
Furger, M., Dommen, J., Graber, W. K., Poggio, L., Prevot, A. S. H.,Emeis, S., Grell, G., Trickl, T., Gomiscek, B., Neininger, B., andWotawa, G.: The VOTALP Mesolcina Valley Campaign 1996 –concept, background and some highlights, Atmos. Environ., 34,1395–1412, 2000.
Atmos. Chem. Phys., 12, 5447–5481, 2012 www.atmos-chem-phys.net/12/5447/2012/

K. Tørseth et al.: Introduction to the European Monitoring and Evaluation Programme (EMEP) 5477
Gelencser, A., May, B., Simpson, D., Sanchez-Ochoa, A.,Kasper-Giebl, A., Puxbaum, H., Caseiro, A., Pio, C., andLegrand, M.: Source apportionment of PM2.5 organic aerosolover Europe: Primary/secondary, natural/anthropogenic,and fossil/biogenic origin, J. Geophys. Res., 112, D23S04,doi:10.1029/2006JD008094, 2007.
Gouin, T., Harner, T., Blanchard, P., and Mackay, D.: Passive andactive air samplers as complementary methods for investigatingpersistent organic pollutants in the Great Lakes basin, Environ.Sci. Technol., 39, 9115–9122, 2005.
Gilardoni, S., Vignati, E., Cavalli, F., Putaud, J. P., Larsen, B.R., Karl, M., Stenstrom, K., Genberg, J., Henne, S., and Den-tener, F.: Better constraints on sources of carbonaceous aerosolsusing a combined14C – macro tracer analysis in a Europeanrural background site, Atmos. Chem. Phys., 11, 5685–5700,doi:10.5194/acp-11-5685-2011, 2011.
Gilbert, R. O.: Statistical methods for environmental pollution mon-itoring, New York, Van Nostrand Reinhold, 1987.
Grennfelt, P. and Schjoldager, J.: Photochemical oxidants in the tro-posphere: a mounting menace, Ambio, 13, 61–67, 1984.
Grennfelt, P., Hoem, K., Saltbones, J., and Schjoldager, J.: Oxi-dant data collection in OECD Europe 1985–87 (OXIDATE): Re-port on ozone, nitrogen dioxide and peroxyacetyl nitrate. Oc-tober 1986–March 1987, April–September 1987 and October–December 1987, Lillestrøm, Norwegian Institute for Air Re-search, NILU OR 63/89, 1989.
Halsall, C. J., Sweetman, A. J., Barrie, L. A., and Jones, K. C.:Modelling the behaviour of PAHs during atmospheric transportfrom the UK to the Arctic, Atmos. Environ., 35, 255–267, 2001.
Halse, A. K., Schlabach, M., Eckhardt, S., Sweetman, A., Jones,K. C., and Breivik, K.: Spatial variability of POPs in Eu-ropean background air, Atmos. Chem. Phys., 11, 1549–1564,doi:10.5194/acp-11-1549-2011, 2011.
Harmens, H., Norris, D. A., Steinnes, E., Kubin, E., Piispanen, J.,Alber, R., Aleksiayenak, Y., Blum, O., Coskun, M., Dam, M.,De Temmerman, L., Fernandez, J. A., Frolova, M., Frontasyeva,M., Gonzalez-Miqueo, L., Grodzinska, K., Jeran, Z., Korzekwa,S., Krmar, M., Kvietkus, K., Leblond, S., Liiv, S., Magnusson,S. H., Mankovska, B., Pesch, R., Ruhling,A., Santamaria, J. M.,Schroder, W., Spiric, Z., Suchara, I., Thoni, L., Urumov, V., Yu-rukova, L., and Zechmeister, H. G.: Mosses as biomonitors ofatmospheric heavy metal deposition: Spatial patterns and tempo-ral trends in Europe, Environ. Pollut., 158, 3144–3156, 2010.
Harner, T., Kylin, H., Bidleman, T. F., and Strachan, W. M. J.: Re-moval of alpha- and gamma-hexachlorocyclohexane and enan-tiomers of alpha-hexachlorocyclohexane in the eastern ArcticOcean, Environ. Sci. Technol., 33, 1157–1164, 1999.
Harner, T., Bartkow, M., Holoubek, I., Klanova, J., Wania, F., Gioia,R., Moeckel, C., Sweetman, A. J., and Jones, K. C.: Passive airsampling for persistent organic pollutants: Introductory remarksto the special issue, Environ. Pollut., 144, 361–364, 2006.
Heimburger, L.-E., Migon, C., Dufou, A., Chiffoleau, J.-F., andCossa, D.: Trace metal concentrations in the North-westernMediterranean atmospheric aerosol between 1986 and 2008:Seasonal patterns and decadal trends, Sci. Total Environ., 408,2629–2638, 2010.
Henne, S., Brunner, D., Folini, D., Solberg, S., Klausen, J., andBuchmann, B.: Assessment of parameters describing representa-tiveness of air quality in-situ measurement sites, Atmos. Chem.
Phys., 10, 3561–3581,doi:10.5194/acp-10-3561-2010, 2010.Hellsten, S., van Loon, M., Tarrason, L., Vestreng, V., Tørseth, K.,
Kindbom, K., and Aas, W.: Base cation deposition in Europe,Swedish Environmental Research Institute, Stockholm, IVL Re-port B1722, 2007.
Hjellbrekke, A.-G. and Fjæraa, A. M.: Data Report 2009, Acidi-fying and eutrophying compounds and particulate matter, Nor-wegian Institute for Air Research, Kjeller, EMEP/CCC-Report1/2011, 2011.
Hole, J. R., Christensen, J. H., Ruoho-Airola, T., Tørseth, K.,Ginzburg, V., and Glowacki, P.: Past and future trends in concen-trations of sulphur and nitrogen compounds in the Arctic, Atmos.Environ., 43, 928–939,doi:10.1016/j.atmosenv.2008.10.043,2009.
Holoubek, I., Klanova, J., Jarkovsky, J., and Kohoutek, J.: Trendsin background levels of persistent organic pollutants at Koseticeobservatory, Czech Republic, Part I: Ambient air and wet depo-sition 1996–2005, J. Environ. Monit., 9, 557–563, 2007.
HTAP: Assessment of hemispheric transport of air pollution, Part B:Mercury, edited by: Pirrone, N. and Keating, T., prepared by: theTask Force on Hemispheric Transport of Air Pollution, EconomicCommission for Europe, Geneva, Air Pollution Studies No. 18,2010.
Hung, H., Kallenborn, R., Breivik, K., Su, Y., Brorstrom-Lunden,E., Olafsdottir, K., Thorlacius, J. M., Leppanen, S., Bossi, R.,Skov, H., Manø, S., Patton, G. W., Stern, G., Sverko, E., andFellin, P.: Atmospheric monitoring of organic pollutants in theArctic under the Arctic Monitoring and Assessment Programme(AMAP): 1993–2006, Sci. Total Environ., 408, 2854–2873,2010.
Jaward, F. M., Farrar, N. J., Harner, T., Sweetman, A. J., and Jones,K. C.: Passive air sampling of PCBs, PBDEs, and organochlo-rine pesticides across Europe, Environ. Sci. Technol., 38, 34–41,2004a.
Jaward, F. M., Farrar, N. J., Harner, T., Sweetman, A. J., and Jones,K. C.: Passive air sampling of polycyclic aromatic hydrocarbonsand polychlorinated naphthalenes across Europe, Environ. Toxi-col. Chem., 23, 1355–1364, 2004b.
Jenkin, M. E., Utembe, S. R., and Derwent, R. G.: Modelling theimpact of elevated primary NO2 and HONO emissions on re-gional scale oxidant formation in the UK, Atmos. Environ., 42,323–336,doi:10.1016/j.atmosenv.2007.09.021, 2008.
Jonson, J. E., Simpson, D., Fagerli, H., and Solberg, S.: Can we ex-plain the trends in European ozone levels?, Atmos. Chem. Phys.,6, 51–66,doi:10.5194/acp-6-51-2006, 2006.
Kaiser, A.: Origin of polluted air masses in the Alps: An overviewand first results for MONARPOP, Environ. Pollut., 157, 3232–3237, 2009.
Kahnert, M., Lazaridis, M., Tsyro, S., and Tørseth, K.: Require-ments for developing a regional monitoring capacity for aerosolsin Europe within EMEP, J. Environ. Monit., 6, 646–655, 2004.
Karlsson, P., Uddling, J., Braun, S., Broadmeadow, M., Elvira,S., Gimeno, B., Le Thiec, D., Oksanen, E., Vandermeiren, K.,Wilkinson, M., and Emberson, L.: New critical levels for ozoneeffects on young trees based on AOT40 and simulated cumu-lative leaf uptake of ozone, Atmos. Environ., 38, 2283–2294,doi:10.1016/j.atmosenv.2004.01.027, 2004.
Kock, H. H., Bieber, E., Ebinghaus, R., Spain, T. G., andThees, B.: Comparison of long-term trends and seasonal
www.atmos-chem-phys.net/12/5447/2012/ Atmos. Chem. Phys., 12, 5447–5481, 2012

5478 K. Tørseth et al.: Introduction to the European Monitoring and Evaluation Programme (EMEP)
variations of atmospheric mercury concentrations at thetwo European coastal monitoring stations Mace Head, Ire-land, and Zingst, Germany, Atmos. Environ., 39, 7549–7556,doi:10.1016/j.atmosenv.2005.02.059, 2005.
Konovalov, I. B., Beekmann, M., Burrows, J. P., and Richter, A.:Satellite measurement based estimates of decadal changes in Eu-ropean nitrogen oxides emissions, Atmos. Chem. Phys., 8, 2623–2641,doi:10.5194/acp-8-2623-2008, 2008.
Laj, P., Klausen, J., Bilde, M., Plaβ-Duelmer, C., Pappalardo,G., Clerbaux, C., Baltensperger, U., Hjorth, J., Simpson, D.,Reimann, S., Coheur, P. F., Richter, A., de Maziere, M., Rudich,Y., McFiggans, G., Tørseth, K., Wiedensohler, A., Morin, S.,Schulz, M., Allan, J., Attie, J. L., Barnes, I., Birmilli, W., Cam-mas, P., Dommen, J., Dorn, H. P., Fuzzi, J. S., Glasius, M.,Hermann, M., Kinne, S., Koren, I., Madonna, F., Maione, M.,Massling, A., Moehler, O., Mona, L., Muller, D., Muller, T.,Orphal, J., Peuch, W. H., Stratmann, F., Tanre, D., Tyndall,D., Riziq, A. A., Van Roozendael, M., Villani, P., Weiner, B.,Wex, H., and Zardini, A.: Measuring Atmospheric CompositionChange, Atmos. Environ., 43, 5351–5414, 2009.
Larsson, P.: Contaminated sediments of lakes and oceans act assources of chlorinated hydrocarbons for release to water and at-mosphere, Nature, 317, 347–349, 1985.
Lazaridis, M., Semb, A., Larssen, S., Hjellbrekke, A.-G., Hov, Ø.,Hanssen, J.-E., Schaug, J., and Tørseth, K.: Measurements ofparticulate matter within the framework of the European Mon-itoring and Evaluation Programme (EMEP): I, First results, Sci.Total Environ., 285, 209–235, 2002.
Legrand, M. and Puxbaum, H.: Summary of the CARBOSOLproject: present and retrospective state of organic versus in-organic aerosol over Europe, J. Geophys. Res., 112, D23S01,doi:10.1029/2006JD008271, 2007.
Li, Y. F.: Global technical hexachlorocyclohexane usage and its con-tamination consequences in the environment: from 1948 to 1997,Sci. Total Environ., 232, 121–158, 1999.
Li, Y. F., Macdonald, R. W., Jantunen, L. M. M., Harner, T.,Bidleman, T. F., and Strachan, W. M. J.: The transport of beta-hexachlorocyclohexane to the western Arctic Ocean: a contrastto alpha-HCH, Sci. Total Environ., 291, 229–246, 2002.
Loibl, W., Winiwarter, W., Kopsca, A., Zufger, J., and Bau-mann, R.: Estimating the spatial distribution of ozone concen-trations in complex terrain, Atmos. Environ, 28, 2557–2566,doi:10.1016/1352-2310(94)90430-8, 1994.
Lorenz, M. and Granke, O.: Deposition measurements and criticalloads calculations: monitoring data, results and perspective, iFor-est, 2, 11–14,doi:10.3832/ifor0478-002, 2009.
Lovblad, G., Tarrason, L., Tørseth, K., and Dutchak, S.: EMEP As-sessment, Part I, European Perspective, Norwegian Meteorolog-ical Institute, Oslo, 2004.
Ma, J. M., Hung, H. L., Tian, C., and Kallenborn, R.: Revolatiliza-tion of persistent organic pollutants in the Arctic induced by cli-mate change, Nat. Clim. Change, 1, 255–260, 2011.
Malanichev, A., Mantseva, E., Shatalov, V., Strukov, B., and Vu-lykh, N.: Numerical evaluation of the PCBs transport over theNorthern Hemisphere, Environ. Pollut., 128, 279–289, 2004.
Mills, G., Hayes, F., Simpson, D., Emberson, L., Norris, D., Har-mens, H., and Buker, P.: Evidence of widespread effects of ozoneon crops and (semi-)natural vegetation in Europe (1990–2006) inrelation to AOT40- and flux-based risk maps, Global Change Bi-
ology, Blackwell Publishing Ltd, 17, 592–613, 2011.Monks, P. S., Granier, C., Fuzzi, S., Stohl, A., Williams, M. L., Aki-
moto, H., Amann, M., Baklanov, A., Baltensperger, U., Bey, I.,Blake, N., Blake, R. S., Carslaw, K., Cooper, O. R., Dentener,F., Fowler, D., Fragkou, E., Frost, G. J., Generoso, S., Ginoux,P., Grewe, V., Guenther, A., Hansson, H. C., Henne, S., Hjorth,J., Hofzumahaus, A., Huntrieser, H., Isaksen, I. S. A., Jenkin,M. E., Kaiser, J., Kanakidou, M., Klimont, Z., Kulmala, M., Laj,P., Lawrence, M. G., Lee, J. D., Liousse, C., Maione, M., McFig-gans, G., Metzger, A., Mieville, A., Moussiopoulos, N., Orlando,J. J., O’Dowd, C. D., Palmer, P. I., Parrish, D. D., Petzold, A.,Platt, U., Poschl, U., Prevot, A. S. H., Reeves, C. E., Reimann,S., Rudich, Y., Sellegri, K., Steinbrecher, R., Simpson, D., tenBrink, H., Theloke, J., van der Werf, G. R., Vautard, R., Vestreng,V., Vlachokostas, Ch., and von Glasow, R.: Atmospheric compo-sition change – global and regional air quality, Atmos. Environ.,43, 5268–5350, 2009.
Monteiro, A. Carvalho, A., Ribeiro, I., Scotto, M., Barbosa, S.,Alonso, A., Baldasano, J. M., Pay, M. T., Miranda, A. I., andBorrego, C.: Trends in ozone concentrations in the Iberian penin-sula by Quantile regression and clustering, Atmos. Environ., 56,184–193,doi:10.1016/j.atmosenv.2012.03.069, 2012.
Munthe, J., Wangberg, I., Iverfeldt, A., Lindqvist, O., Stromberg,D., Sommar, J., Gardfeldt, K., Petersen, G., Ebinghaus, R.,Prestbo, E., Larjava, K., and Siemens, V.: Distribution of atmo-spheric mercury species in Northern Europe: final results fromthe MOE project, Atmos. Environ., 37, 9–20, 2003.
Nizzetto, L., Macleod, M., Borga, K., Cabrerizo, A., Dachs, J., DiGuardo, A., Ghirardello, D., Hansen, K. M., Jarvis, A., Lindroth,A., Ludwig, B., Monteith, D., Perlinger, J. A., Scheringer, M.,Schwendenmann, L., Semple, K. T., Wick, L. Y., Zhang, G., andJones, K. C.: Past, present, and future controls on levels of per-sistent organic pollutants in the global environment, Environ. Sci.Technol., 44, 6526–6531, 2010.
Ockenden, W. A., Steinnes, E., Parker, C., and Jones, K. C.: Obser-vations on persistent organic pollutants in plants: Implications fortheir use as passive air samplers and for POP cycling, Environ.Sci. Technol., 32, 2721–2726, 1998.
OECD: The OECD Programme on Long Range Transport of AirPollutants. Measurements and Findings. Organisation for Eco-nomic Co-operation and Development, Paris 1977, Report can bedownloaded fromhttp://www.nilu.no/projects/ccc/reports/paris1977.pdf, 1977.
Oden, S.: Nederbordens og luftens forsurning, dess orsaker, forloppoch verkan i olika miljoer. Statens naturvetenskapliga forskn-ingsrad, Stockholm, Ecologikommiteen Bull. No. 1, 1968.
Oltmans, S. J., Lefohn, A. S., Harris, J. M., Galbally, I., Scheel,H. E., Bodeker, G., Brunke, E., Claude, H., Tarasick, D., John-son, B. J., Simmonds, P., Shadwick, D., Anlauf, K., Hay-den, K., Sch midlin, F., Fujimoto, T., Akagi, K., Meyer, C.,Nichol, S., Davies, J., Redondas, A., and Cuevas, E.: Long-termchanges in tropospheric ozone, Atmos. Environ., 40, 3156–3173,doi:10.1016/j.atmosenv.2006.01.029, 2006.
Ordonez, C., Mathis, H., Furger, M., Henne, S., Huglin, C., Stae-helin, J., and Prevot, A. S. H.: Changes of daily surface ozonemaxima in Switzerland in all seasons from 1992 to 2002 and dis-cussion of summer 2003, Atmos. Chem. Phys., 5, 1187–1203,doi:10.5194/acp-5-1187-2005, 2005.
Atmos. Chem. Phys., 12, 5447–5481, 2012 www.atmos-chem-phys.net/12/5447/2012/

K. Tørseth et al.: Introduction to the European Monitoring and Evaluation Programme (EMEP) 5479
Ottar, B.: The transfer of airborne pollutants to the Arctic region,Atmos. Environ., 15, 1439–1445, 1981.
Ottar, B., Dovland, H., and Semb, A.: Long range transport of airpollutants and acid precipitation, Air Pollution and Plant Life,edited by: Treshov, M. Wiley, 39–71, 1984.
Pacyna, J. M., Semb, A., and Hanssen, J. E.: Emission and long-range transport of trace elements in Europe, Tellus, 36b, 163–178, 1984.
Pacyna, E. G., Pacyna, J. M., Fudala, J., Strzelecka-Jastrzab, E.,Hlawiczka, S., Panasiuk, D., Nitter, S., Pregger, T., Pfeiffer, H.,and Friedrich, R.: Current and future emissions of selected heavymetals to the atmosphere from anthropogenic sources in Europe,Atmos. Environ., 41, 8557–8566, 2007.
Pacyna, J. M., Pacyna, E. G., and Aas, W.: Changes of emissionsand atmospheric deposition of mercury, lead, and cadmium, At-mos. Environ., 43, 117–127, 2009.
Perrino, C., Canepari, S., Catrambone, M., Dalla Torre, S., Rantica,E., and Sargolini, T.: Influence of natural events on the concentra-tion and composition of atmospheric particulate matter, Atmos.Environ., 43, 4754–4765, 2008.
Philippin, S., Laj, P., Putaud, J.-P., Wiedensohler, A., de Leeuw, G.,Fjaeraa, A. M., Platt, U., Baltensperger, U., and Fiebig, M.: EU-SAAR – An Unprecedented Network of Aerosol Observation inEurope, Earozoru Kenkyu, 24, 78–83, 2009.
Pio, C. A., Legrand, M., Oliveira, T., Afonso, J., Santos, C., Ca-seiro, A., Fialho, P., Barata, F., Puxbaum, H., Sanchez-Ochoa, A.,Kasper-Giebl, A., Gelencser, A., Preunkert, S., and Schock, M.:Climatology of aerosol composition (organic versus inorganic)at non-urban areas on a west-east transect across Europe, J. Geo-phys. Res., 112, D23S02,doi:10.1029/2006JD008038, 2007.
Pozo, K., Harner, T., Lee, S. C., Wania, F., Muir, D. C. G., andJones, K. C.: Seasonally resolved concentrations of persistent or-ganic pollutants in the global atmosphere from the first year ofthe GAPS study, Environ. Sci. Technol., 43, 796–803, 2009.
Putaud, J.-P., Van Dingenen, R., Alastuey, A., Bauer, H., Birmili,W., Cyrys, J., Flentje, H., Fuzzi, S., Gehrig, R., Hansson, H.C., Harrison, R. M., Herrmann, H., Hitzenberger, R., Huglin, C.,Jones, A. M., Kasper-Giebl, A., Kiss, G., Kousa, A., Kuhlbusch,T. A. J., Loschau, G., Maenhaut, W., Molnar, A., Moreno, T.,Pekkanen, J., Perrino, C., Pitz, M., Puxbaum, H., Querol, X.,Rodriguez, S., Salma, I., Schwarz, J., Smolik, J., Schneider, J.,Spindler, G., ten Brink, H., Tursic, J., Viana, M., Wiedensohler,A., and Raes, F.: A European aerosol phenomenology – 3: Phys-ical and chemical characteristics of particulate matter from 60rural, urban, and kerbside sites across Europe, Atmos. Environ.,44, 1308–1320, 2010.
Querol, X., Alastuey, A., Pey, J., Cusack, M., Perez, N., Mi-halopoulos, N., Theodosi, C., Gerasopoulos, E., Kubilay, N.,and Kocak, M.: Variability in regional background aerosolswithin the Mediterranean, Atmos. Chem. Phys., 9, 4575–4591,doi:10.5194/acp-9-4575-2009, 2009.
Rodhe, H. and Granat, L.: An evaluation of sulfate in Euro-pean precipitation 1955–1982, Atmos. Environ., 18, 2627–2639,doi:10.1016/0004-6981(84)90327-5, 1984.
Ruzickova, P., Klanova, J., Cupr, P., Lammel, G., and Holoubek, I.:An assessment of air-soil exchange of polychlorinated biphenylsand organochlorine pesticides across Central and Southern Eu-rope, Environ. Sci. Technol., 42, 179–185, 2008.
Salmi, T., Maatta, A., Anttila, P., Ruoho-Airola, T., and Amnell,T.: Detecting trends of annual values of atmospheric pollutantsby the Mann-Kendall test and Sen’s slope estimates – the Exceltemplate application MAKESENS, Helsinki, Finnish Meteoro-logical Institute, Report code FMI-AQ-31, 2002.
Schaap, M., Otjes, R. P., and Weijers, E. P.: Illustrating the benefitof using hourly monitoring data on secondary inorganic aerosoland its precursors for model evaluation, Atmos. Chem. Phys., 11,11041–11053,doi:10.5194/acp-11-11041-2011, 2011.
Scheel, H., Areskoug, H., Geiss, H., Gomiscek, B., Granby, K.,Haszpra, L., Klasinc, L., Kley, D., Laurila, T., Lindskog, A., Roe-mer, M., Schmitt, R., Simmonds, P., Solberg, S., and Toupance,G.: On the spatial distribution and seasonal variation of lower-troposphere ozone over Europe, J. Atmos. Chem., 28, 11–28,1997.
Schlabach, M., Aas, W., Hung, H. M., Rania, F., and Su, Y.:NCP, AMAP and EMEP POP laboratory comparison 2010,Kjeller, Norwegian Institute for Air Research, EMEP/CCC-Report 7/2011, 2011.
Schuster, J. K., Gioia, R., Sweetman, A. J., and Jones, K. C.: Tem-poral trends and controlling factors for polychlorinated biphenylsin the UK atmosphere (1991–2008), Environ. Sci. Technol., 44,8068–8074, 2010.
Schuster, J. K., Gioia, R., Breivik, K., Steinnes, E., Scheringer, M.,and Jones, K. C.: Trends in European background air reflect re-ductions in primary emissions of PCBs and PBDEs, Environ. Sci.Technol., 44, 6760–6766, 2011.
Semb, A.: Sulphur emissions in Europe, Atmos. Environ., 12, 455–460, 1978.
Shoeib, M. and Harner, T.: Characterization and comparison ofthree passive air samplers for persistent organic pollutants, En-viron. Sci. Technol., 36, 4142–4151, 2002.
Simpson, D., Olendrzynski, K., Semb, A., Støren, E., and Unger, S.:Photochemical oxidant modelling in Europe: multi-annual mod-elling and source-receptor relationships, Oslo, The NorwegianMeteorological Institute, EMEP/MSC-W Report 3/97, 1997.
Simpson, D., Yttri, K., Klimont, Z., Kupiainen, K., Caseiro, A.,Gelencser, A., Pio, C., and Legrand, M.: Modeling carbona-ceous aerosol over Europe. analysis of the CARBOSOL andEMEP EC/OC campaigns, J. Geophys. Res., 112, D23S14,doi:10.1029/2006JD008158, 2007a.
Simpson, D., Emberson, L., Ashmore, M., and Tuovinen, J.: A com-parison of two different approaches for mapping potential ozonedamage to vegetation. A model study, Environ. Pollut., 146, 715–725,doi:10.1016/j.envpol.2006.04.013, 2007b.
Simpson, D., Benedictow, A., Berge, H., Bergstrom, R., Ember-son, L. D., Fagerli, H., Hayman, G. D., Gauss, M., Jonson, J. E.,Jenkin, M. E., Nyıri, A., Richter, C., Semeena, V. S., Tsyro, S.,Tuovinen, J.-P., Valdebenito,A., and Wind, P.: The EMEP MSC-W chemical transport model – Part 1: Model description, At-mos. Chem. Phys. Discuss., 12, 3781–3874,doi:10.5194/acpd-12-3781-2012, 2012.
Skiba, U., Drewer, J., Tang, Y. S., van Dijk, N., Helfter, C., Nemitz,E., Famulari, D., Cape, J. N., Jones, S. K., Twigg, M., Pihlatie,M., Vesala, T., Larsen, K. S., Carter, M. S., Ambus, P., Ibrom, A.,Beier, C., Hensen, A., Frumau, A., Erisman, J. W., Bruggemann,N., Gasche, R., Butterbach-Bahl, K., Neftel, A., Spirig, C., Hor-vath, L., Freibauer, A., Cellier, P., Laville, P., Loubet, B., Magli-ulo, E., Bertolini, T., Seufert, G., Andersson, M., Manca, G.,
www.atmos-chem-phys.net/12/5447/2012/ Atmos. Chem. Phys., 12, 5447–5481, 2012

5480 K. Tørseth et al.: Introduction to the European Monitoring and Evaluation Programme (EMEP)
Laurila, T., Aurela, M., Lohila, A., Zechmeister-Boltenstern, S.,Kitzler, B., Schaufler, G., Siemens, J., Kindler, R., Flechard, C.,and Sutton, M. A.: Biosphere-atmosphere exchange of reactivenitrogen and greenhouse gases at the NitroEurope core flux mea-surement sites: Measurement strategy and first data sets, Agric.Ecosyst. Environ., 133, 139–149, 2009.
Skjelkvale, B. L., Stoddard, J. L., Jeffries, D. S., Tørseth, K.,Høgasen, T., Bowman, J., Mannio, J., Monteith, D. T., Mosello,R. Rogora, M., Rzychon, D., Vesely, J., Wieting, J., Wilander A.,and Worsztynowicz, A.: Regional scale evidence for improve-ments in surface water chemistry 1990–2001, Environ. Pollut.,137, 165–176, 2005.
Slemr, F. and Scheel, H. E.: Trends in atmospheric mercury concen-trations at the summit of the Wank Mountain, Southern Germany,Atmos. Environ., 32, 845–853, 1998.
Slootweg, J., Posch, M., and Hettelingh, J. P. (Eds.): Progress in themodelling of critical thresholds, impacts to plant species diver-sity and ecosystem services in Europe, CCE Status Report 2010,PBL Netherlands Environmental Assessment Agency, Coordina-tion Centre for Effects, Bilthoven, 2010.
Smidt, S., Spangl, W., and Nagl, C.: Trends of air pollutant input inAustrian forest areas, Austr. J. For. Sci., 127, 1–24, 2010.
Solberg, S.: VOC measurements 2009, Kjeller, Norwegian Instituteof Air Research, EMEP/CCC-Report 6/2011, 2011.
Solberg, S., Dye, C., Walker, S.-E., and Simpson, D.: Long-termmeasurements and model calculations of formaldehyde at ruralEuropean monitoring sites, Atmos. Environ., 35, 195–207, 2001.
Solberg, S., Bergstrøm, R., Langner, J., Laurila, T., and Lindskog,A.: Changes in Nordic surface ozone episodes due to Europeanemission reductions in the 1990s, Atmos. Environ., 39, 179–192,2005.
Strode, S. A., Jaegle, L., Selin, N. E., Jacob, D. J., Park, R. J., Yan-tosca, R. M., Mason, R. P., and Slemr, F.: Air-sea exchange in theglobal mercury cycle, Global Biogeochem. Cycles, 21, GB1017,doi:10.1029/2006GB002766, 2007.
Su, Y. S. and Hung, H. L: Inter-laboratory comparison study onmeasuring semi-volatile organic chemicals in standards and airsamples, Environ. Pollut., 158, 3365–3371, 2010.
Sutton, M. S., Howard, C.-M., Erisman, J. W. Billen, G., BleekerA., Grennfelt,P., van Grinsven, H., and Grizzetti, B. (Eds.): TheEuropean nitrogen assessment – sources, effects and policy per-spectives, Cambridge Univ. Press, Cambridge, 2011.
Travnikov, O., Gusev, A., Ilyin, I., Shatalov, V., and Sokovyh, V.:Global EMEP Multi-media Modelling System (GLEMOS): Ap-plication to heavy metal and POP pollution, in preparation, 2012.
Tørseth, K. (Ed.): ACCENT workshop on network har-monization and data intercomparability 28–30 Jan-uary 2008, Las Vegas, USA, ACCENT, Report2.08, http://www4.nilu.no/farcryaccent/download.cfm?DownloadFile30AB6844-17A4-8DB2-8C461AE65F2545B1,2008.
Tørseth, K. and Hov, Ø. (Eds.): The EMEP monitoring strat-egy 2004–2009. Background document with justification andspecification of the EMEP monitoring programme, 2004–2009,EMEP/CCC-Report 9/2003, 69 pp., NILU, Kjeller, 2003.
Uggerud, H. Th. and Hjellbrekke, A.-G.: The twenty-seventhand twenty-eighth intercomparison of analytical methodswithin EMEP, Kjeller, Norwegian Institute for Air Research,EMEP/CCC-Report 5/2011, 2011a.
Uggerud, H. Th. and Hjellbrekke, A.-G.: Analytical intercompari-son of heavy metals in precipitation 2009 and 2010, Kjeller, Nor-wegian Institute for Air Research, EMEP/CCC-Report 4/2011,2011b.
UNECE: Handbook for the 1979 Convention on Long-RangeTransboundary Air Pollution and its Protocols, Geneva, UnitedNations Economic Commissions for Europe, ECE/EB.AIR/85,2004a.
UNECE: Clearing the Air – 25 years of the Convention on Long-range Transboundary Air Pollution, Geneva, United NationsEconomic Commissions for Europe, ECE/EB.AIR/84, 2004b.
UNECE: EMEP monitoring strategy for 2010-1010, UnitedNations Economic Commissions for Europe, Geneva,ECE/EB.AIR/GE.1/2009/15, http://www.unece.org/env/documents/2009/EB/ge1/ece.eb.air.ge.1.2009.15.e.pdf, 2009.
UNEP Chemical Branch: The global atmospheric mercuryassessment: Sources, emissions and transport. Geneva,United Nations Environment Program Chemical Branch,http://www.chem.unep.ch/mercury/AtmosphericEmissions/Atmosphericemissionsmercury.htm, 2008.
UNEP/DEWA: Integrated assessment of black carbon and tropo-spheric ozone; Summary for decision makers, United NationsEnvironment Programme, Division of Early Warning and As-sessment, Nairobi, 2011.
Vautard, R., Szopa, S., Beekmann, M., Menut, L., Hauglus-taine, D. A., Rouil, L., and Roemer, M.: Are decadal anthro-pogenic emission reductions in Europe consistent with sur-face ozone observations?, Geophys. Res. Lett., 33, L13810,doi:10.1029/2006GL026080, 2006.
Vestreng, V., Myhre, G., Fagerli, H., Reis, S., and Tarrason,L.: Twenty-five years of continuous sulphur dioxide emis-sion reduction in Europe, Atmos. Chem. Phys., 7, 3663–3681,doi:10.5194/acp-7-3663-2007, 2007.
Vestreng, V., Ntziachristos, L., Semb, A., Reis, S., Isaksen, I. S. A.,and Tarrason, L.: Evolution of NOx emissions in Europe withfocus on road transport control measures, Atmos. Chem. Phys.,9, 1503–1520,doi:10.5194/acp-9-1503-2009, 2009.
Vijgen, J., Abhilash, P. C., Li, Y.F., Lal, R., Forter, M., Torres, J.,Singh, N., Yunus, M., Tian, C., Schaffer, A., and Weber, R.:Hexachlorocyclohexane (HCH) as new Stockholm ConventionPOPs-a global perspective on the management of Lindane andits waste isomers, Environ. Sci. Pollut. Res., 18, 152–162, 2011.
Wangberg, I., Munthe, J., Ebinghaus, R., Gardfeldt, K., and Som-mar, J.: Distribution of TPM in Northern Europe, Sci. Total Env-iron., 304, 53–59, 2003.
Wangberg, I., Munthe, J., Berg, T., Ebinghaus, R., Kock, H. H.,Temme, C., Bieber, E., Spain, T. G., and Stolk, A.: Trends in airconcentration and deposition of mercury in the coastal environ-ment of the North Sea, Atmos. Environ., 41, 2612–2619, 2007.
Wania, F.: On the origin of elevated levels of persistent chemicalsin the environment, Environ. Sci. Pollut. Res., 6, 11–19, 1999.
Wania, F. and Haugen, J. E.: Long term measurements of wet depo-sition and precipitation scavenging of hexachlorocyclohexanes inSouthern Norway, Environ. Pollut., 105, 381–386, 1999.
Wania, F. and Mackay, D.: Global fractionation and cold condensa-tion of low volatility organochlorine compounds in polar regions,Ambio, 22, 10–18, 1993.
Wania, F. and Mackay, D.: Tracking the distribution of persistent or-ganic pollutants, Environ. Sci. Technol., 30, A390–A396, 1996.
Atmos. Chem. Phys., 12, 5447–5481, 2012 www.atmos-chem-phys.net/12/5447/2012/

K. Tørseth et al.: Introduction to the European Monitoring and Evaluation Programme (EMEP) 5481
WGE: 30 years of effects research, monitoring and modelling un-der the Convention on Long-range Transboundary Air PollutionWorking Group on Effects, Federal Environment Agency (UBA),Dessau, Germany, 2011.
WHO: The World Health Report 2002: Reducing risks, promotinghealthy life, Geneva, World Health Organization, 2002.
WHO: Air quality guidelines for particulate matter, ozone, ni-trogen dioxide and sulfur dioxide – Global update 2005,Copenhagen, World Health Organization,http://www.who.int/phe/healthtopics/outdoorairaqg/en/[2011-08-16], 2005.
WMO operations manual for sampling and analysis techniques forchemical constituents in air and precipitation, World Meteoro-logical Organization, Geneva, 1974.
Wilson, R. C., Fleming, Z. L., Monks, P. S., Clain, G., Henne, S.,Konovalov, I. B., Szopa, S., and Menut, L.: Have primary emis-sion reduction measures reduced ozone across Europe? An anal-ysis of European rural background ozone trends 1996–2005, At-mos. Chem. Phys., 12, 437–454,doi:10.5194/acp-12-437-2012,2012.
Winkler, P. and Roider, G.: HELCOM – EMEP – PARCOM –AMAP: Field intercomparison of heavy metals in precipitation1995, Hohenpeissenberg, Deutscher Wetterdienst, Meteorologis-ches Observatorium, Report nr UBA-FB–98-059/e, 1997.
Xiao, H., Li, N. Q., and Wania, F.: Compilation, evaluation, and se-lection of physical-chemical property data for alpha-, beta-, andgamma-hexachlorocyclohexane, J. Chem. Eng. Data, 49, 173–185, 2004.
Yttri, K. E., Aas, W., Bjerke, A., Cape, J. N., Cavalli, F., Ceburnis,D., Dye, C., Emblico, L., Facchini, M. C., Forster, C., Hanssen,J. E., Hansson, H. C., Jennings, S. G., Maenhaut, W., Putaud,J. P., and Tørseth, K.: Elemental and organic carbon in PM10: aone year measurement campaign within the European Monitor-ing and Evaluation Programme EMEP, Atmos. Chem. Phys., 7,5711–5725,doi:10.5194/acp-7-5711-2007, 2007.
Yttri, K. E., Simpson, D., Nøjgaard, J. K., Kristensen, K., Genberg,J., Stenstrom, K., Swietlicki, E., Hillamo, R., Aurela, M., Bauer,H., Offenberg, J. H., Jaoui, M., Dye, C., Eckhardt, S., Burkhart,J. F., Stohl, A., and Glasius, M.: Source apportionment of thesummer time carbonaceous aerosol at Nordic rural backgroundsites, Atmos. Chem. Phys., 11, 13339–13357,doi:10.5194/acp-11-13339-2011, 2011a.
Yttri, K. E., Simpson, D., Stenstrom, K., Puxbaum, H., andSvendby, T.: Source apportionment of the carbonaceous aerosolin Norway – quantitative estimates based on14C, thermal-opticaland organic tracer analysis, Atmos. Chem. Phys., 11, 9375–9394,doi:10.5194/acp-11-9375-2011, 2011b.
Zhang, Y. and Tao, S.: Global atmospheric emission inventory ofpolycyclic aromatic hydrocarbons (PAHs) for 2004, Atmos. En-viron., 43, 812–819, 2009.
www.atmos-chem-phys.net/12/5447/2012/ Atmos. Chem. Phys., 12, 5447–5481, 2012