introduction to system monitoring with nagios, … · introduction to system monitoring with...
TRANSCRIPT
Introduction to system monitoring with Nagios,Check_MK and Open Monitoring Distribution
(OMD)
Iñigo Aldazabal Mensa – Centro de Física de Materiales(CSIC-UPV/EHU)
HPCK’14 Barcelona, 13-14th January 2014
IntroNagios
Check_MKOMD
IntroWhy monitoring?What to monitor?How to monitor?
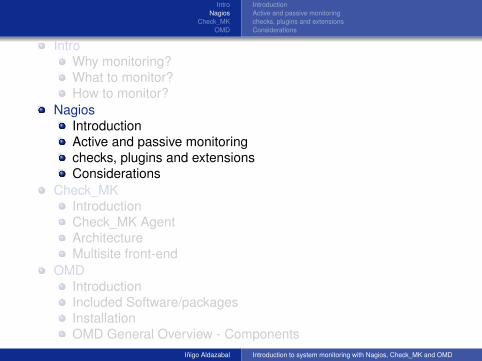
NagiosIntroductionActive and passive monitoringchecks, plugins and extensionsConsiderations
Check_MKIntroductionCheck_MK AgentArchitectureMultisite front-end
OMDIntroductionIncluded Software/packagesInstallationOMD General Overview - Components
Iñigo Aldazabal Introduction to system monitoring with Nagios, Check_MK and OMD
IntroNagios
Check_MKOMD
Why monitoring?What to monitor?How to monitor?
IntroWhy monitoring?What to monitor?How to monitor?
NagiosIntroductionActive and passive monitoringchecks, plugins and extensionsConsiderations
Check_MKIntroductionCheck_MK AgentArchitectureMultisite front-end
OMDIntroductionIncluded Software/packagesInstallationOMD General Overview - Components
Iñigo Aldazabal Introduction to system monitoring with Nagios, Check_MK and OMD
IntroNagios
Check_MKOMD
Why monitoring?What to monitor?How to monitor?
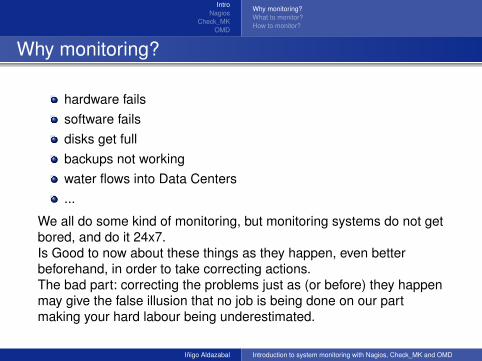
Why monitoring?
hardware failssoftware failsdisks get fullbackups not workingwater flows into Data Centers...
We all do some kind of monitoring, but monitoring systems do not getbored, and do it 24x7.Is Good to now about these things as they happen, even betterbeforehand, in order to take correcting actions.The bad part: correcting the problems just as (or before) they happenmay give the false illusion that no job is being done on our partmaking your hard labour being underestimated.
Iñigo Aldazabal Introduction to system monitoring with Nagios, Check_MK and OMD
IntroNagios
Check_MKOMD
Why monitoring?What to monitor?How to monitor?
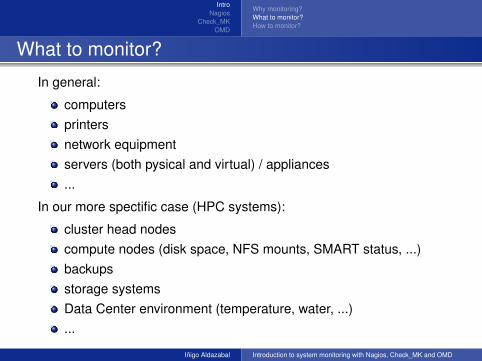
What to monitor?
In general:
computersprintersnetwork equipmentservers (both pysical and virtual) / appliances...
In our more spectific case (HPC systems):
cluster head nodescompute nodes (disk space, NFS mounts, SMART status, ...)backupsstorage systemsData Center environment (temperature, water, ...)...
Iñigo Aldazabal Introduction to system monitoring with Nagios, Check_MK and OMD
IntroNagios
Check_MKOMD
Why monitoring?What to monitor?How to monitor?
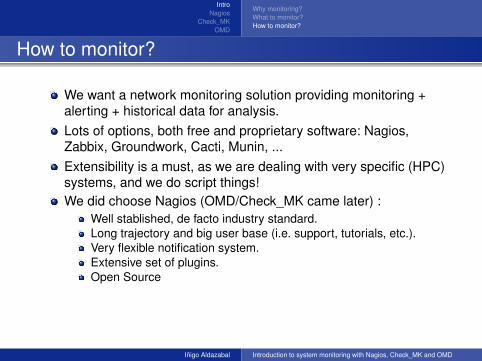
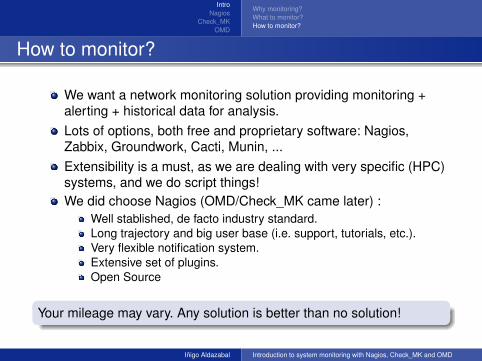
How to monitor?
We want a network monitoring solution providing monitoring +alerting + historical data for analysis.Lots of options, both free and proprietary software: Nagios,Zabbix, Groundwork, Cacti, Munin, ...Extensibility is a must, as we are dealing with very specific (HPC)systems, and we do script things!We did choose Nagios (OMD/Check_MK came later) :
Well stablished, de facto industry standard.Long trajectory and big user base (i.e. support, tutorials, etc.).Very flexible notification system.Extensive set of plugins.Open Source
Your mileage may vary. Any solution is better than no solution!
Iñigo Aldazabal Introduction to system monitoring with Nagios, Check_MK and OMD
IntroNagios
Check_MKOMD
Why monitoring?What to monitor?How to monitor?
How to monitor?
We want a network monitoring solution providing monitoring +alerting + historical data for analysis.Lots of options, both free and proprietary software: Nagios,Zabbix, Groundwork, Cacti, Munin, ...Extensibility is a must, as we are dealing with very specific (HPC)systems, and we do script things!We did choose Nagios (OMD/Check_MK came later) :
Well stablished, de facto industry standard.Long trajectory and big user base (i.e. support, tutorials, etc.).Very flexible notification system.Extensive set of plugins.Open Source
Your mileage may vary. Any solution is better than no solution!
Iñigo Aldazabal Introduction to system monitoring with Nagios, Check_MK and OMD
IntroNagios
Check_MKOMD
IntroductionActive and passive monitoringchecks, plugins and extensionsConsiderations
IntroWhy monitoring?What to monitor?How to monitor?
NagiosIntroductionActive and passive monitoringchecks, plugins and extensionsConsiderations
Check_MKIntroductionCheck_MK AgentArchitectureMultisite front-end
OMDIntroductionIncluded Software/packagesInstallationOMD General Overview - Components
Iñigo Aldazabal Introduction to system monitoring with Nagios, Check_MK and OMD
IntroNagios
Check_MKOMD
IntroductionActive and passive monitoringchecks, plugins and extensionsConsiderations
What is Nagios?
Open Source computer and networkmonitoring system which monitors hostsand services, and alerts us when they gounder undesired behavoiur.
What is monitored:Network services (SMTP, POP3, HTTP...)Network connected equipment (ping, SNMP...)Systems (CPU load, free disk space, hard disk health, backupstatus, ...)
How does it alerts:emailSMS...
Iñigo Aldazabal Introduction to system monitoring with Nagios, Check_MK and OMD
IntroNagios
Check_MKOMD
IntroductionActive and passive monitoringchecks, plugins and extensionsConsiderations
Basic Concepts
Host: the physical equipments (ping).Services: Resources to be monitored within an specific hosts(http response, printer toner levels, hard diskSMART status, backups status,...).Plugins: Programs (scripts o executable code) which can be runfrom the command line in order to verify the state of a host orservice, tipycally named as check_xxx (check_http,check_printer, check_smart, check_backup...).
Contacts and Contact Groups: People to be notified and how they are notified.
Time Periods: Week days and time intervals in which a host/service has to bemonitored.
Iñigo Aldazabal Introduction to system monitoring with Nagios, Check_MK and OMD
IntroNagios
Check_MKOMD
IntroductionActive and passive monitoringchecks, plugins and extensionsConsiderations
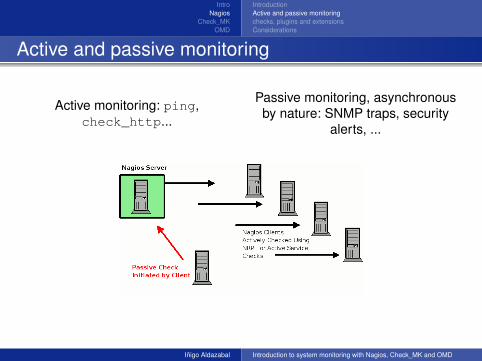
Active and passive monitoring
Active monitoring: ping,check_http...
Passive monitoring, asynchronousby nature: SNMP traps, security
alerts, ...
Iñigo Aldazabal Introduction to system monitoring with Nagios, Check_MK and OMD
IntroNagios
Check_MKOMD
IntroductionActive and passive monitoringchecks, plugins and extensionsConsiderations
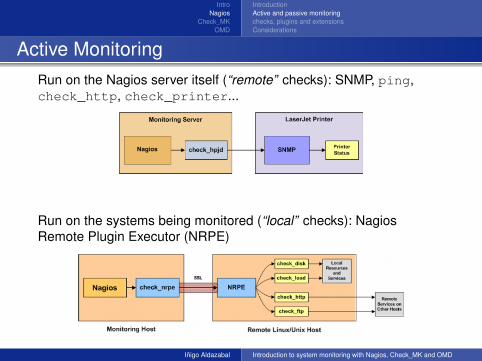
Active MonitoringRun on the Nagios server itself (“remote” checks): SNMP, ping,check_http, check_printer...
Run on the systems being monitored (“local” checks): NagiosRemote Plugin Executor (NRPE)
Iñigo Aldazabal Introduction to system monitoring with Nagios, Check_MK and OMD
IntroNagios
Check_MKOMD
IntroductionActive and passive monitoringchecks, plugins and extensionsConsiderations
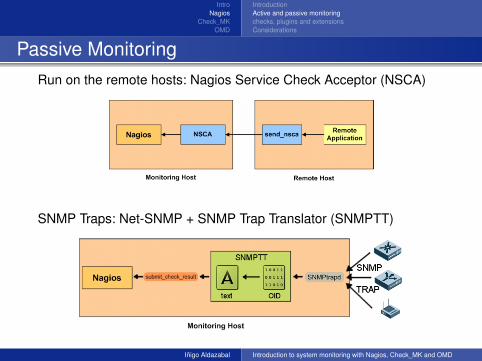
Passive MonitoringRun on the remote hosts: Nagios Service Check Acceptor (NSCA)
SNMP Traps: Net-SNMP + SNMP Trap Translator (SNMPTT)
Iñigo Aldazabal Introduction to system monitoring with Nagios, Check_MK and OMD
IntroNagios
Check_MKOMD
IntroductionActive and passive monitoringchecks, plugins and extensionsConsiderations
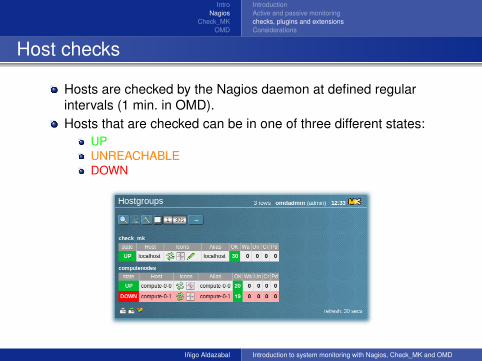
Host checks
Hosts are checked by the Nagios daemon at defined regularintervals (1 min. in OMD).Hosts that are checked can be in one of three different states:
UPUNREACHABLEDOWN
Iñigo Aldazabal Introduction to system monitoring with Nagios, Check_MK and OMD
IntroNagios
Check_MKOMD
IntroductionActive and passive monitoringchecks, plugins and extensionsConsiderations
Service checks
Service are checked by the Nagios daemon at defined regularintervals (1 min. in OMD).Services that are checked can be in one of four different states:
OKWARNINGUNKNOWNCRITICAL
Service checks are performed by plugins, which can return astate of OK, WARNING, UNKNOWN, or CRITICAL.When a service changes its state, Nagios takes appropiateaction.
Detecting and dealing with state changes is what Nagios is all about.
Iñigo Aldazabal Introduction to system monitoring with Nagios, Check_MK and OMD
IntroNagios
Check_MKOMD
IntroductionActive and passive monitoringchecks, plugins and extensionsConsiderations
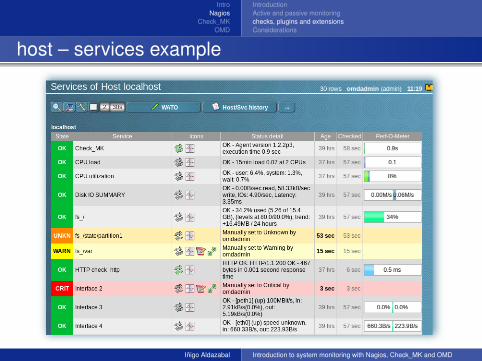
host – services example
Iñigo Aldazabal Introduction to system monitoring with Nagios, Check_MK and OMD
IntroNagios
Check_MKOMD
IntroductionActive and passive monitoringchecks, plugins and extensionsConsiderations
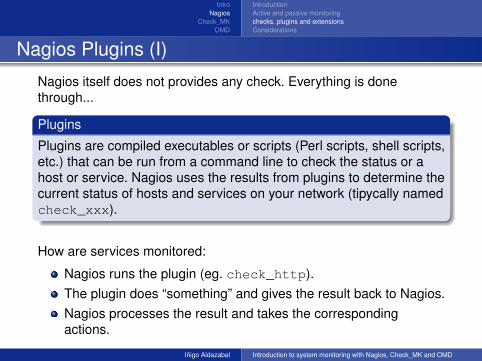
Nagios Plugins (I)
Nagios itself does not provides any check. Everything is donethrough...
Plugins
Plugins are compiled executables or scripts (Perl scripts, shell scripts,etc.) that can be run from a command line to check the status or ahost or service. Nagios uses the results from plugins to determine thecurrent status of hosts and services on your network (tipycally namedcheck_xxx).
How are services monitored:
Nagios runs the plugin (eg. check_http).The plugin does “something” and gives the result back to Nagios.Nagios processes the result and takes the correspondingactions.
Iñigo Aldazabal Introduction to system monitoring with Nagios, Check_MK and OMD
IntroNagios
Check_MKOMD
IntroductionActive and passive monitoringchecks, plugins and extensionsConsiderations
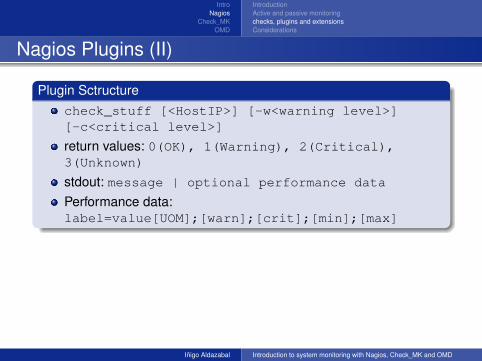
Nagios Plugins (II)
Plugin Sctructurecheck_stuff [<HostIP>] [-w<warning level>][-c<critical level>]
return values: 0(OK), 1(Warning), 2(Critical),3(Unknown)
stdout: message | optional performance data
Performance data:label=value[UOM];[warn];[crit];[min];[max]
Example:
# ./check_enviromux_mini.py 192.168.1.123 -w 35 \-c 45 -s temperature1
OK - Temperature CRAC-1 sensor reading is 31.6Celsius|Temperature\_CRAC-1=31.6;35.0;45.0;0.;50.
Iñigo Aldazabal Introduction to system monitoring with Nagios, Check_MK and OMD
IntroNagios
Check_MKOMD
IntroductionActive and passive monitoringchecks, plugins and extensionsConsiderations
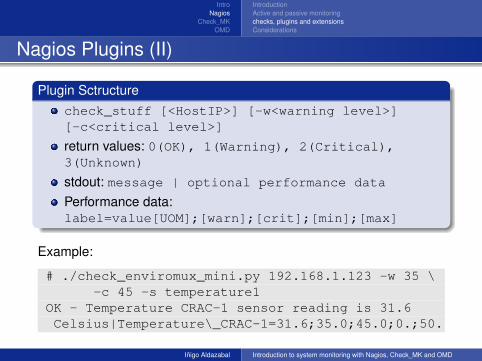
Nagios Plugins (II)
Plugin Sctructurecheck_stuff [<HostIP>] [-w<warning level>][-c<critical level>]
return values: 0(OK), 1(Warning), 2(Critical),3(Unknown)
stdout: message | optional performance data
Performance data:label=value[UOM];[warn];[crit];[min];[max]
Example:
# ./check_enviromux_mini.py 192.168.1.123 -w 35 \-c 45 -s temperature1
OK - Temperature CRAC-1 sensor reading is 31.6Celsius|Temperature\_CRAC-1=31.6;35.0;45.0;0.;50.
Iñigo Aldazabal Introduction to system monitoring with Nagios, Check_MK and OMD
IntroNagios
Check_MKOMD
IntroductionActive and passive monitoringchecks, plugins and extensionsConsiderations
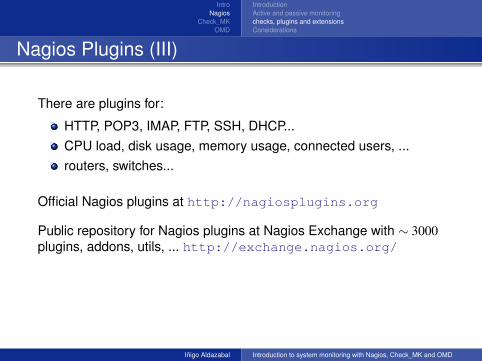
Nagios Plugins (III)
There are plugins for:
HTTP, POP3, IMAP, FTP, SSH, DHCP...CPU load, disk usage, memory usage, connected users, ...routers, switches...
Official Nagios plugins at http://nagiosplugins.org
Public repository for Nagios plugins at Nagios Exchange with ∼ 3000plugins, addons, utils, ... http://exchange.nagios.org/
Do not reinvent the wheel! Search around for something similar first.
Iñigo Aldazabal Introduction to system monitoring with Nagios, Check_MK and OMD
IntroNagios
Check_MKOMD
IntroductionActive and passive monitoringchecks, plugins and extensionsConsiderations
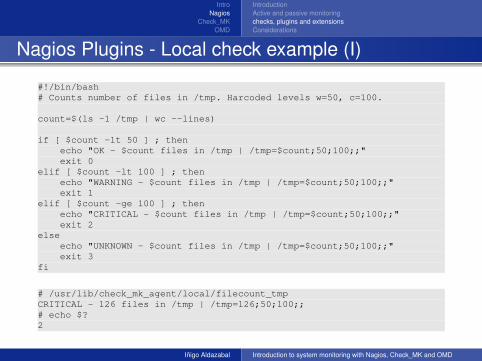
Nagios Plugins - Local check example (I)
#!/bin/bash# Counts number of files in /tmp. Harcoded levels w=50, c=100.
count=$(ls -1 /tmp | wc --lines)
if [ $count -lt 50 ] ; thenecho "OK - $count files in /tmp | /tmp=$count;50;100;;"exit 0
elif [ $count -lt 100 ] ; thenecho "WARNING - $count files in /tmp | /tmp=$count;50;100;;"exit 1
elif [ $count -ge 100 ] ; thenecho "CRITICAL - $count files in /tmp | /tmp=$count;50;100;;"exit 2
elseecho "UNKNOWN - $count files in /tmp | /tmp=$count;50;100;;"exit 3
fi
# /usr/lib/check_mk_agent/local/filecount_tmpCRITICAL - 126 files in /tmp | /tmp=126;50;100;;# echo $?2
Iñigo Aldazabal Introduction to system monitoring with Nagios, Check_MK and OMD
IntroNagios
Check_MKOMD
IntroductionActive and passive monitoringchecks, plugins and extensionsConsiderations
Considerations
ProsPlugins very easy to write/adapt.Can monitor almost eveything network connected (SNMP).Very flexible alerting system.A lot of existing plugins and addons.
ConsHard to configure.Outdated and somehow confusing interface.Does not provide historical time series data, is “just“ an alertingsystem.
Iñigo Aldazabal Introduction to system monitoring with Nagios, Check_MK and OMD
IntroNagios
Check_MKOMD
IntroductionActive and passive monitoringchecks, plugins and extensionsConsiderations
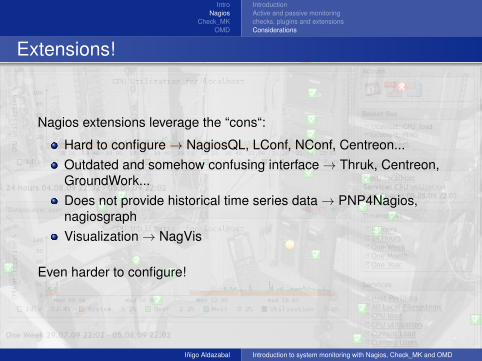
Extensions!
Nagios extensions leverage the “cons“:
Hard to configure→ NagiosQL, LConf, NConf, Centreon...Outdated and somehow confusing interface→ Thruk, Centreon,GroundWork...Does not provide historical time series data→ PNP4Nagios,nagiosgraphVisualization→ NagVis
Even harder to configure!
Iñigo Aldazabal Introduction to system monitoring with Nagios, Check_MK and OMD
IntroNagios
Check_MKOMD
IntroductionCheck_MK AgentArchitectureMultisite front-end
IntroWhy monitoring?What to monitor?How to monitor?
NagiosIntroductionActive and passive monitoringchecks, plugins and extensionsConsiderations
Check_MKIntroductionCheck_MK AgentArchitectureMultisite front-end
OMDIntroductionIncluded Software/packagesInstallationOMD General Overview - Components
Iñigo Aldazabal Introduction to system monitoring with Nagios, Check_MK and OMD
IntroNagios
Check_MKOMD
IntroductionCheck_MK AgentArchitectureMultisite front-end
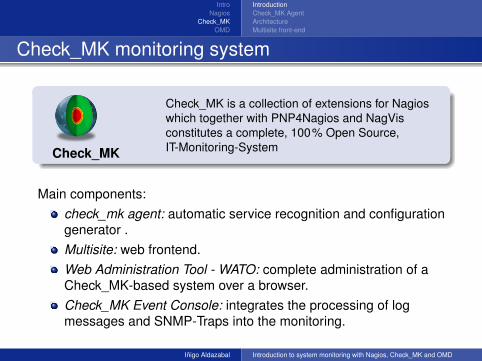
Check_MK monitoring system
Check_MK
Check_MK is a collection of extensions for Nagioswhich together with PNP4Nagios and NagVisconstitutes a complete, 100% Open Source,IT-Monitoring-System
Main components:check_mk agent: automatic service recognition and configurationgenerator .Multisite: web frontend.Web Administration Tool - WATO: complete administration of aCheck_MK-based system over a browser.Check_MK Event Console: integrates the processing of logmessages and SNMP-Traps into the monitoring.
Iñigo Aldazabal Introduction to system monitoring with Nagios, Check_MK and OMD
IntroNagios
Check_MKOMD
IntroductionCheck_MK AgentArchitectureMultisite front-end
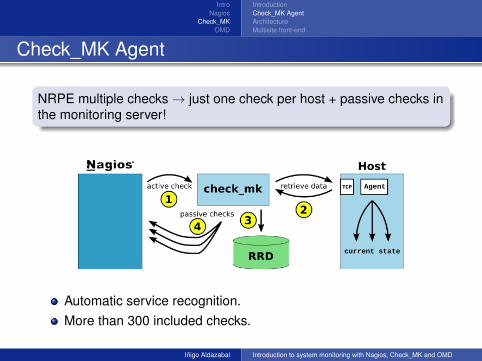
Check_MK Agent
NRPE multiple checks→ just one check per host + passive checks inthe monitoring server!
Automatic service recognition.More than 300 included checks.
Iñigo Aldazabal Introduction to system monitoring with Nagios, Check_MK and OMD
IntroNagios
Check_MKOMD
IntroductionCheck_MK AgentArchitectureMultisite front-end
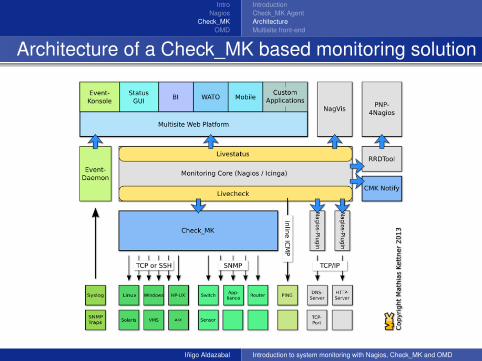
Architecture of a Check_MK based monitoring solution
Iñigo Aldazabal Introduction to system monitoring with Nagios, Check_MK and OMD
IntroNagios
Check_MKOMD
IntroductionCheck_MK AgentArchitectureMultisite front-end
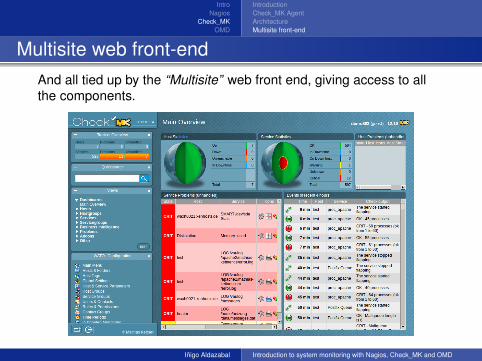
Multisite web front-endAnd all tied up by the “Multisite” web front end, giving access to allthe components.
Iñigo Aldazabal Introduction to system monitoring with Nagios, Check_MK and OMD
IntroNagios
Check_MKOMD
IntroductionCheck_MK AgentArchitectureMultisite front-end
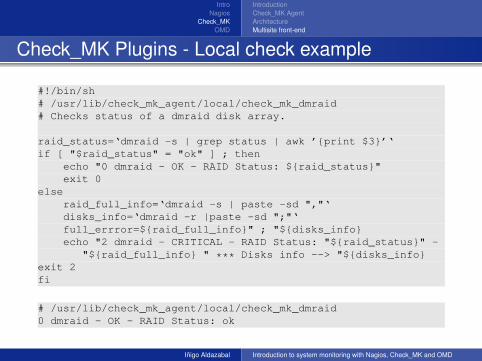
Check_MK Plugins - Local check example
#!/bin/sh# /usr/lib/check_mk_agent/local/check_mk_dmraid# Checks status of a dmraid disk array.
raid_status=‘dmraid -s | grep status | awk ’{print $3}’‘if [ "$raid_status" = "ok" ] ; then
echo "0 dmraid - OK - RAID Status: ${raid_status}"exit 0
elseraid_full_info=‘dmraid -s | paste -sd ","‘disks_info=‘dmraid -r |paste -sd ";"‘full_errror=${raid_full_info}" ; "${disks_info}echo "2 dmraid - CRITICAL - RAID Status: "${raid_status}" -
"${raid_full_info} " *** Disks info --> "${disks_info}exit 2fi
# /usr/lib/check_mk_agent/local/check_mk_dmraid0 dmraid - OK - RAID Status: ok
Iñigo Aldazabal Introduction to system monitoring with Nagios, Check_MK and OMD
IntroNagios
Check_MKOMD
IntroductionIncluded Software/packagesInstallationOMD General Overview - Components
IntroWhy monitoring?What to monitor?How to monitor?
NagiosIntroductionActive and passive monitoringchecks, plugins and extensionsConsiderations
Check_MKIntroductionCheck_MK AgentArchitectureMultisite front-end
OMDIntroductionIncluded Software/packagesInstallationOMD General Overview - Components
Iñigo Aldazabal Introduction to system monitoring with Nagios, Check_MK and OMD
IntroNagios
Check_MKOMD
IntroductionIncluded Software/packagesInstallationOMD General Overview - Components
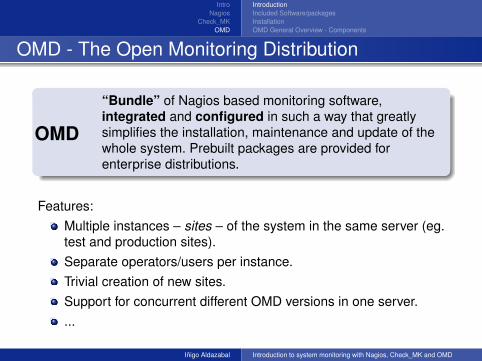
OMD - The Open Monitoring Distribution
OMD
“Bundle” of Nagios based monitoring software,integrated and configured in such a way that greatlysimplifies the installation, maintenance and update of thewhole system. Prebuilt packages are provided forenterprise distributions.
Features:Multiple instances – sites – of the system in the same server (eg.test and production sites).Separate operators/users per instance.Trivial creation of new sites.Support for concurrent different OMD versions in one server....
Iñigo Aldazabal Introduction to system monitoring with Nagios, Check_MK and OMD
IntroNagios
Check_MKOMD
IntroductionIncluded Software/packagesInstallationOMD General Overview - Components
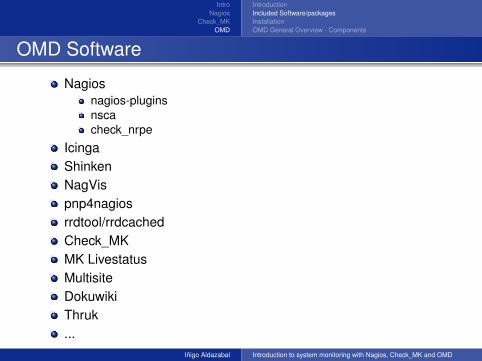
OMD Software
Nagiosnagios-pluginsnscacheck_nrpe
IcingaShinkenNagVispnp4nagiosrrdtool/rrdcachedCheck_MKMK LivestatusMultisiteDokuwikiThruk...
Iñigo Aldazabal Introduction to system monitoring with Nagios, Check_MK and OMD
IntroNagios
Check_MKOMD
IntroductionIncluded Software/packagesInstallationOMD General Overview - Components
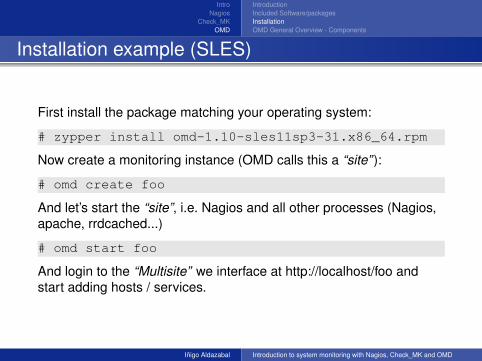
Installation example (SLES)
First install the package matching your operating system:
# zypper install omd-1.10-sles11sp3-31.x86_64.rpm
Now create a monitoring instance (OMD calls this a “site” ):
# omd create foo
And let’s start the “site”, i.e. Nagios and all other processes (Nagios,apache, rrdcached...)
# omd start foo
And login to the “Multisite” we interface at http://localhost/foo andstart adding hosts / services.
Iñigo Aldazabal Introduction to system monitoring with Nagios, Check_MK and OMD
IntroNagios
Check_MKOMD
IntroductionIncluded Software/packagesInstallationOMD General Overview - Components
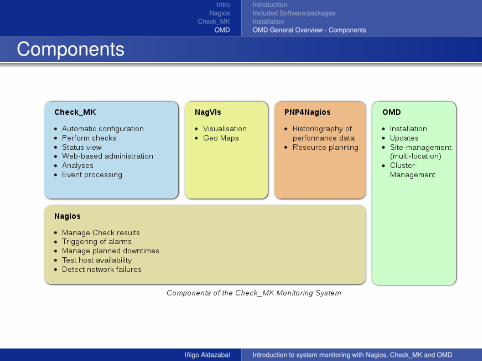
Components
Iñigo Aldazabal Introduction to system monitoring with Nagios, Check_MK and OMD
References
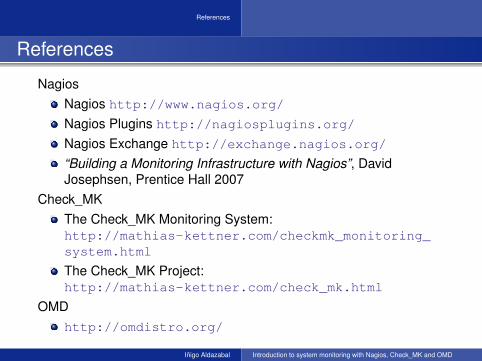
References
NagiosNagios http://www.nagios.org/Nagios Plugins http://nagiosplugins.org/Nagios Exchange http://exchange.nagios.org/
“Building a Monitoring Infrastructure with Nagios”, DavidJosephsen, Prentice Hall 2007
Check_MKThe Check_MK Monitoring System:http://mathias-kettner.com/checkmk_monitoring_system.html
The Check_MK Project:http://mathias-kettner.com/check_mk.html
OMDhttp://omdistro.org/
Iñigo Aldazabal Introduction to system monitoring with Nagios, Check_MK and OMD