introduction to spectroscopy
DESCRIPTION
INTRODUCTION TO SPECTROSCOPY. Spectroscopy. Spectroscopy is a general term referring to the interactions of various types of electromagnetic radiation with matter. Exactly how the radiation interacts with matter is directly dependent on the energy of the radiation. Spectroscopy. - PowerPoint PPT PresentationTRANSCRIPT
INTRODUCTION TO SPECTROSCOPY
Spectroscopy
Spectroscopy is a general term referring to theinteractions of various types of electromagnetic radiation with matter.
Exactly how the radiation interacts with matter is directly dependent on the energy of the radiation.

Spectroscopy
The higher energy ultraviolet and visible wavelengths affect the energy levels of the outer electrons.
Radio waves are used in nuclear magnetic Resonance and affect the spin of nuclei in a magnetic field.
Infrared radiation is absorbed by matter resulting in rotation and/or vibration of molecules.
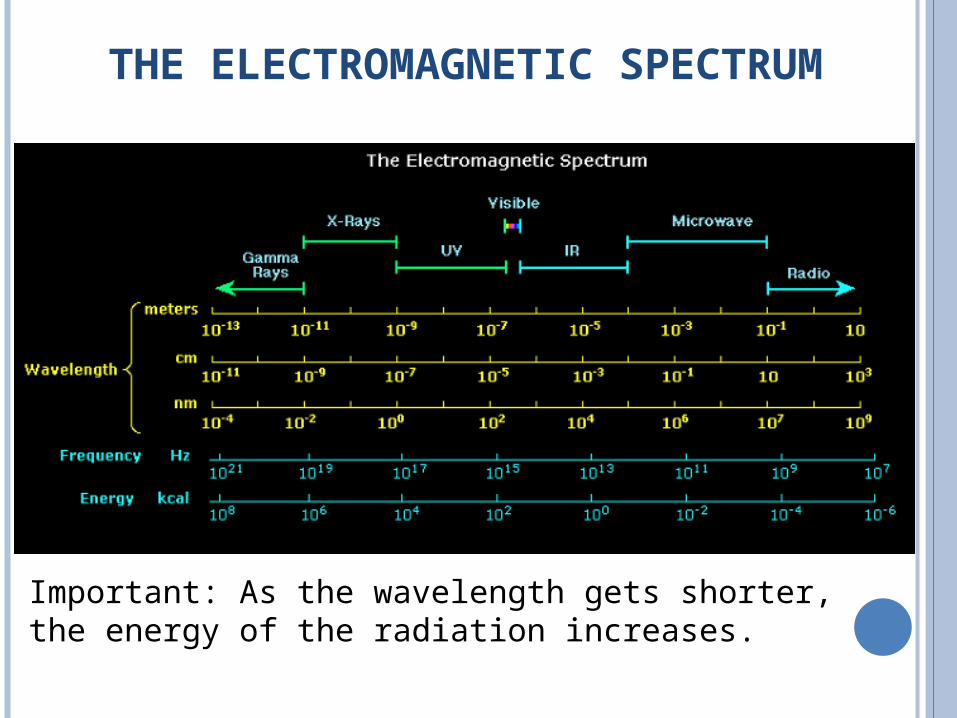
THE ELECTROMAGNETIC SPECTRUM
Important: As the wavelength gets shorter, the energy of the radiation increases.
PARTICLE NATURE OF RADIATION
Electromagnetic radiation is also described as having the properties of particles.
Molecules exist in a certain number of possible states corresponding to definite amounts of energy.
Molecules can absorb energy and change to a higher energy level called the excited state.
The amount of energy absorbed in this transition is exactly equal to the energy difference between the states.
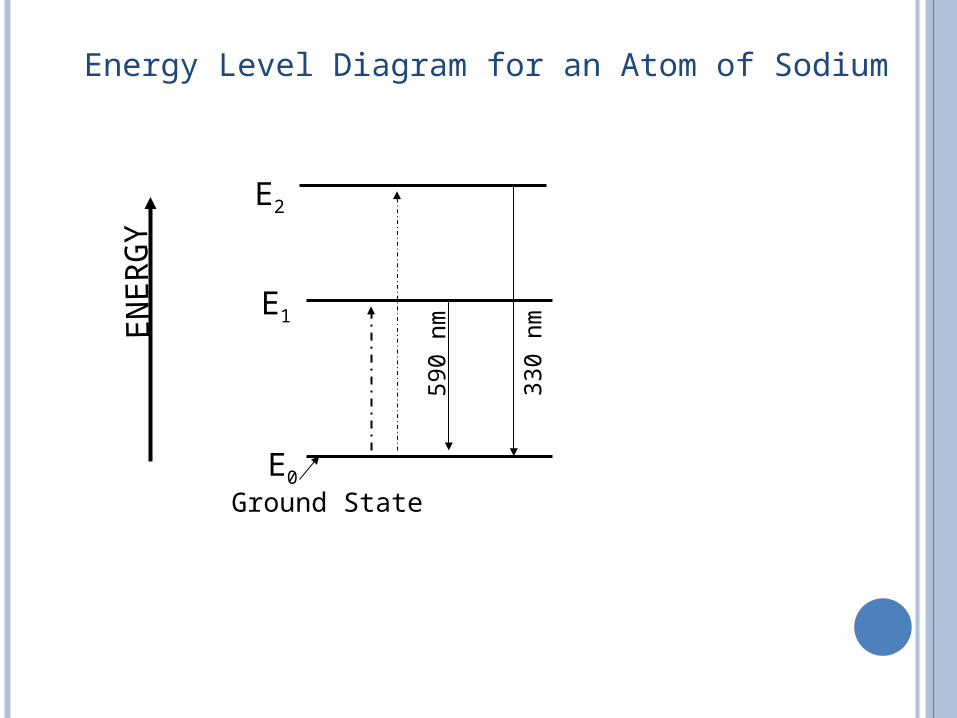
Energy Level Diagram for an Atom of Sodium
E0
E1
E2
EN
ER
GY
Ground State
590
nm
330
nm
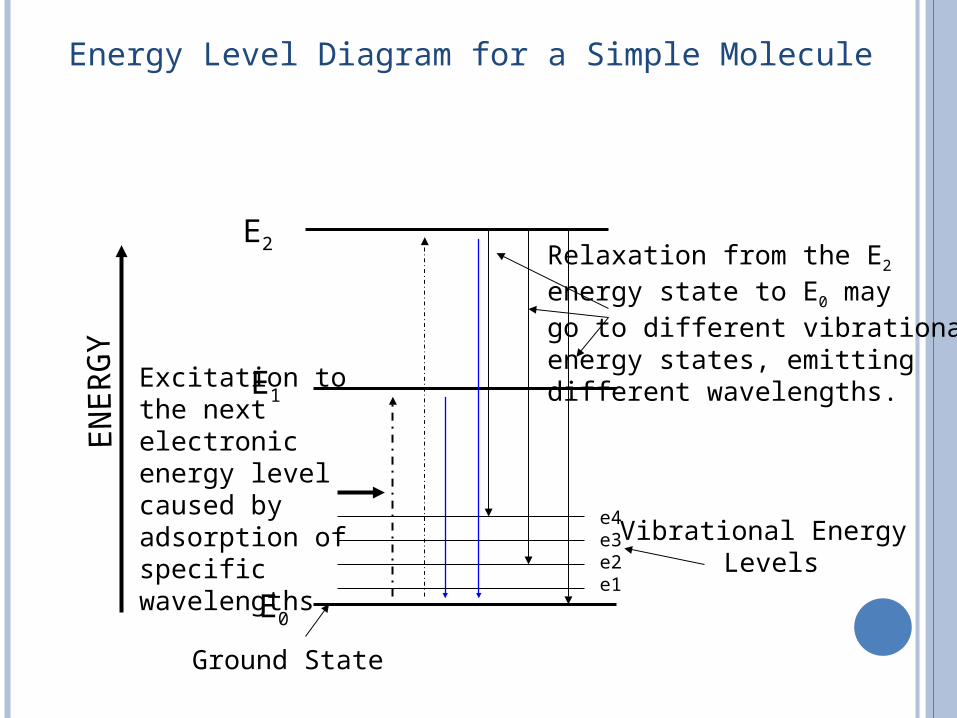
Energy Level Diagram for a Simple Molecule
E0
E1
E2
EN
ER
GY
Ground State
Excitation to the next electronic energy level caused by adsorption ofspecific wavelengths
e4e3e2e1
Vibrational Energy Levels
Relaxation from the E2 energy state to E0 maygo to different vibrationalenergy states, emittingdifferent wavelengths.
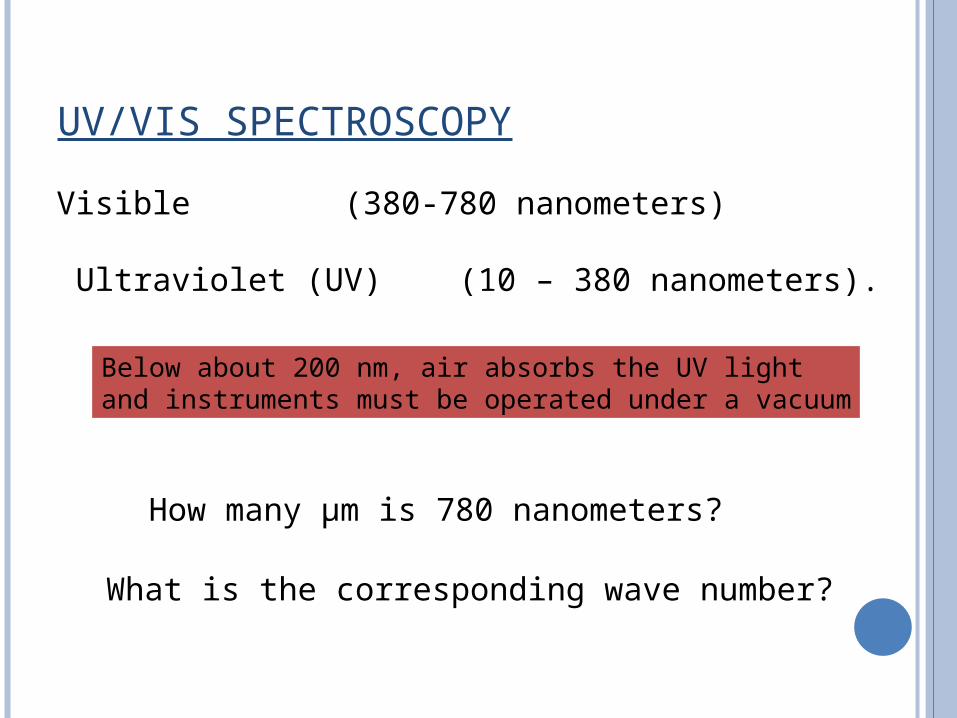
UV/VIS SPECTROSCOPY
Visible (380-780 nanometers)
Ultraviolet (UV) (10 – 380 nanometers).
How many µm is 780 nanometers?
What is the corresponding wave number?
Below about 200 nm, air absorbs the UV light and instruments must be operated under a vacuum
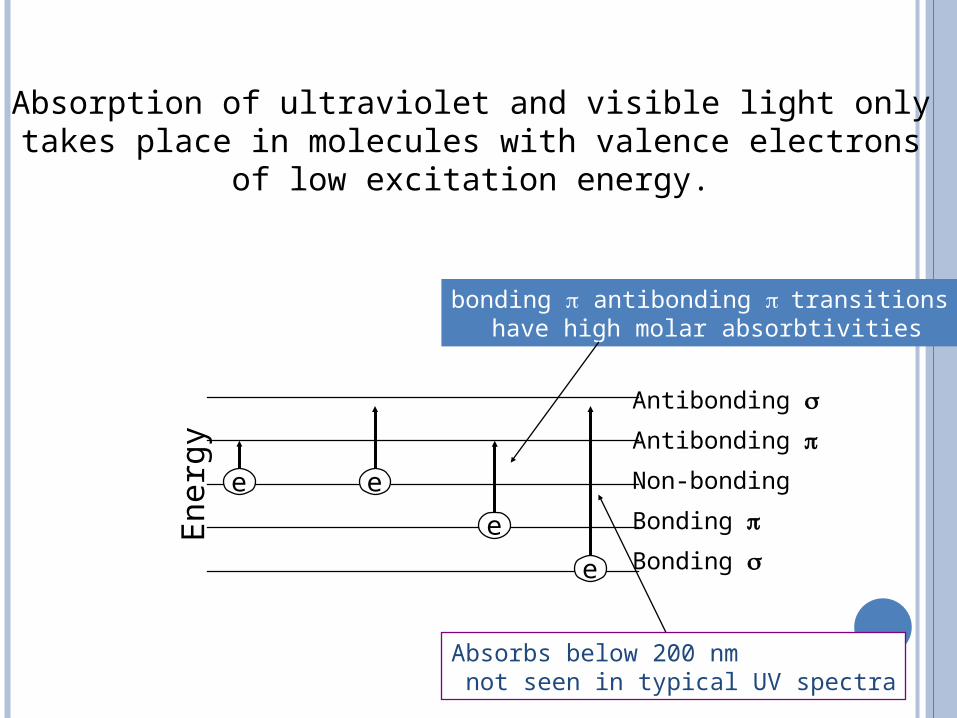
Absorption of ultraviolet and visible light only takes place in molecules with valence electrons
of low excitation energy.
e e
e
e
Antibonding
Antibonding
Non-bonding
Bonding
Bonding
Ene
rgy
Absorbs below 200 nm not seen in typical UV spectra
bonding antibonding transitions have high molar absorbtivities
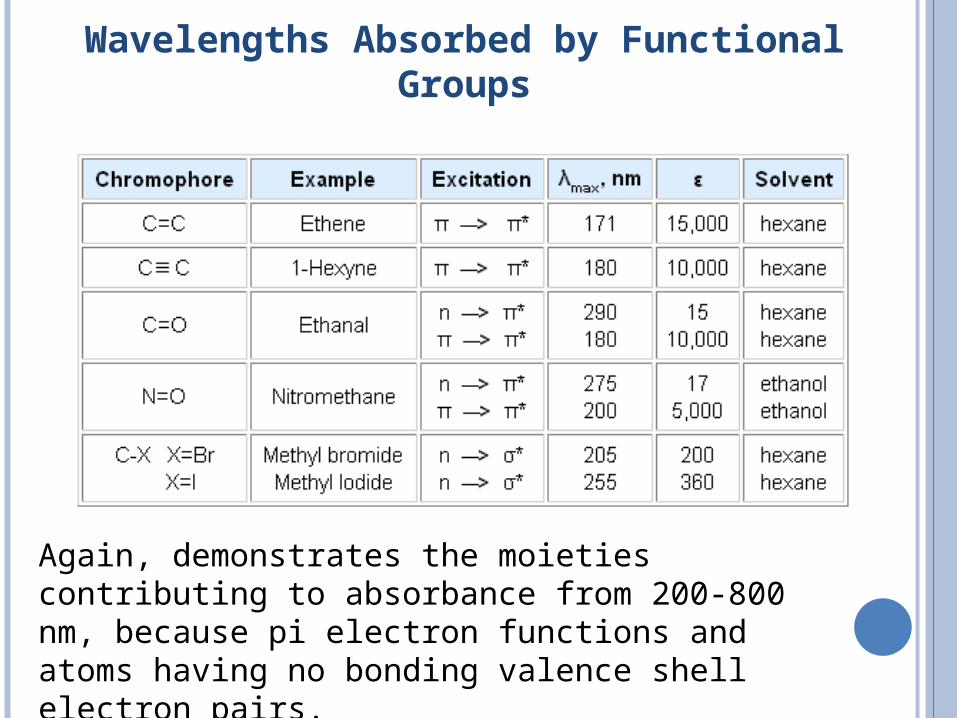
Wavelengths Absorbed by Functional Groups
Again, demonstrates the moieties contributing to absorbance from 200-800 nm, because pi electron functions and atoms having no bonding valence shell electron pairs.
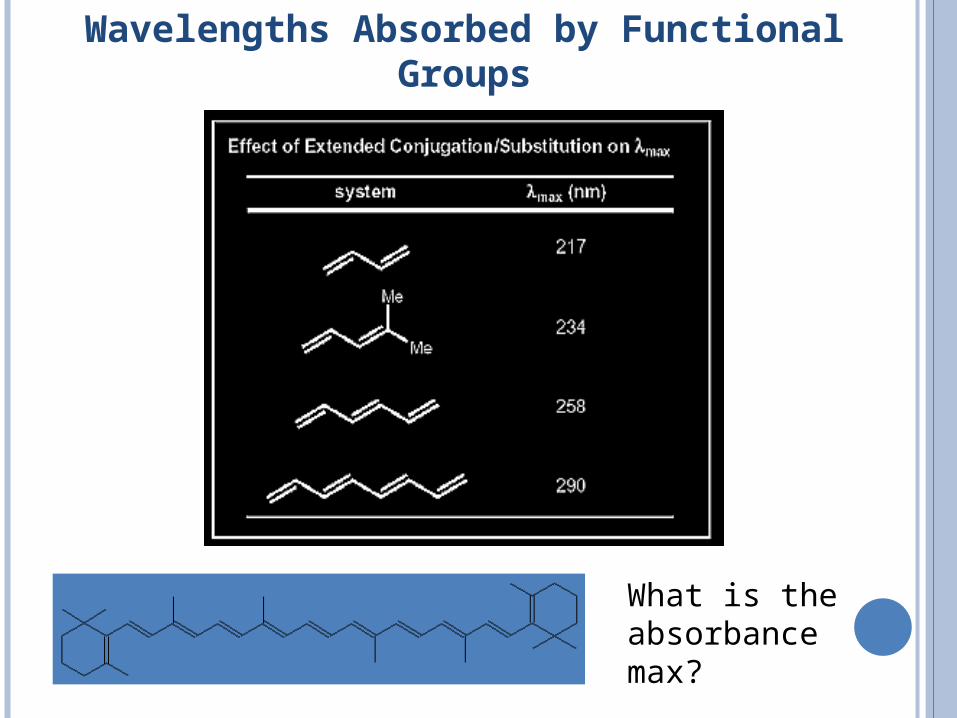
Wavelengths Absorbed by Functional Groups
What is the absorbance max?

Aldehyde: 208 nm
Extended conjugation: 30 nm
Homodiene component: 39 nm
a-Alkyl groups or ring residues: 10 nm
d-Alkyl groups or ring residues: 18 nm
Calculated: 304 nm
Woodward’s Rules For Conjugated Carbonyl Compounds
Example of a Method to Determine the Absorption Spectra of an Organic
Compound
OTHER CONCEPTS IMPORTANT TO UV/VIS SPECTROSCOPY
UV/Vis spectra can be used to some extent for compound identification, however, many compounds have similar spectra.
Solvents can cause a shift in the absorbed wavelengths. Therefore, the same solvent must be used when comparing absorbance spectra for identification purposes.
Many inorganic species also absorb energy in the UV/Vis region of the spectrum.
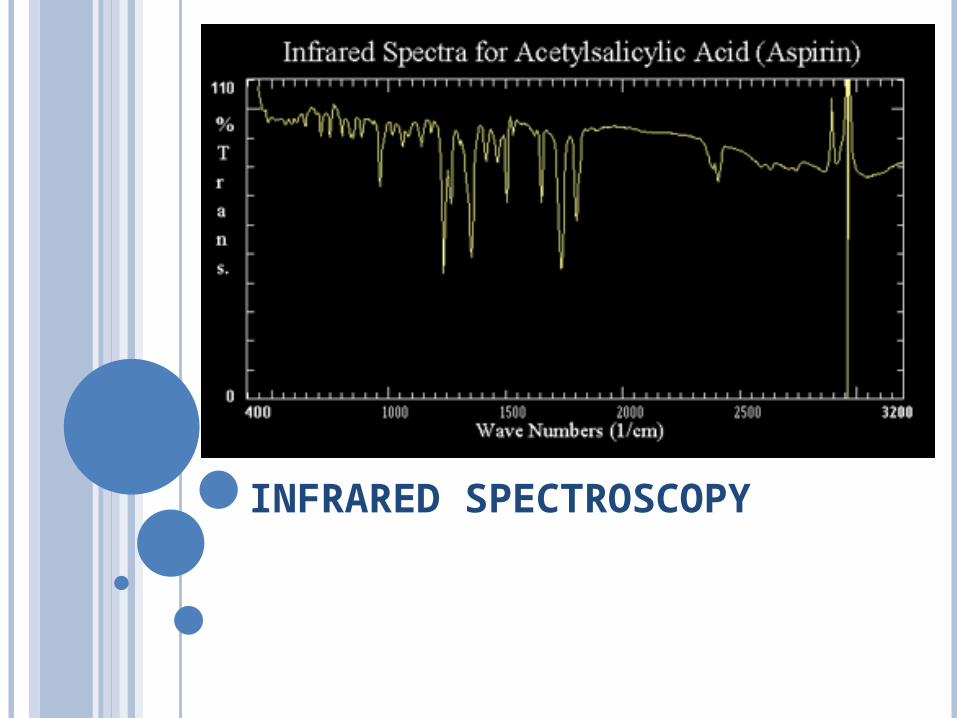
INFRARED SPECTROSCOPY
http://sis.bris.ac.uk/~sd9319/spec/IR.htm
Absorption of electromagnetic energy in the infrared region causes changes in the vibrational energy of
molecules
Energy changes are typically 6000 to 42,000 J/mol which corresponds to wavelengths of 2.5-40 mm
(250-4000/cm)
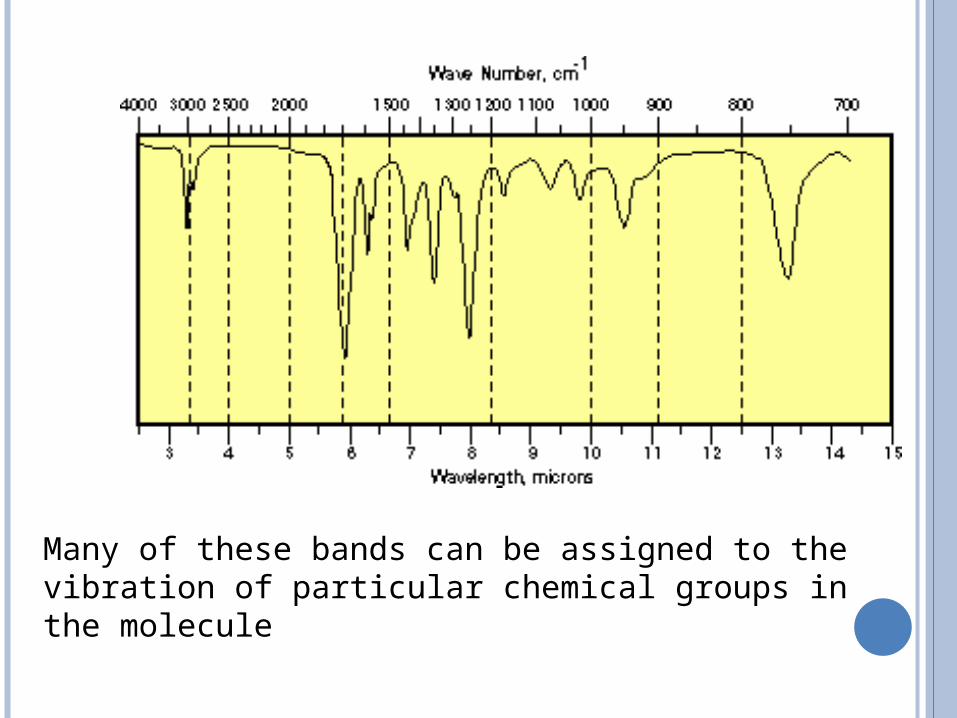
Many of these bands can be assigned to the vibration of particular chemical groups in the molecule
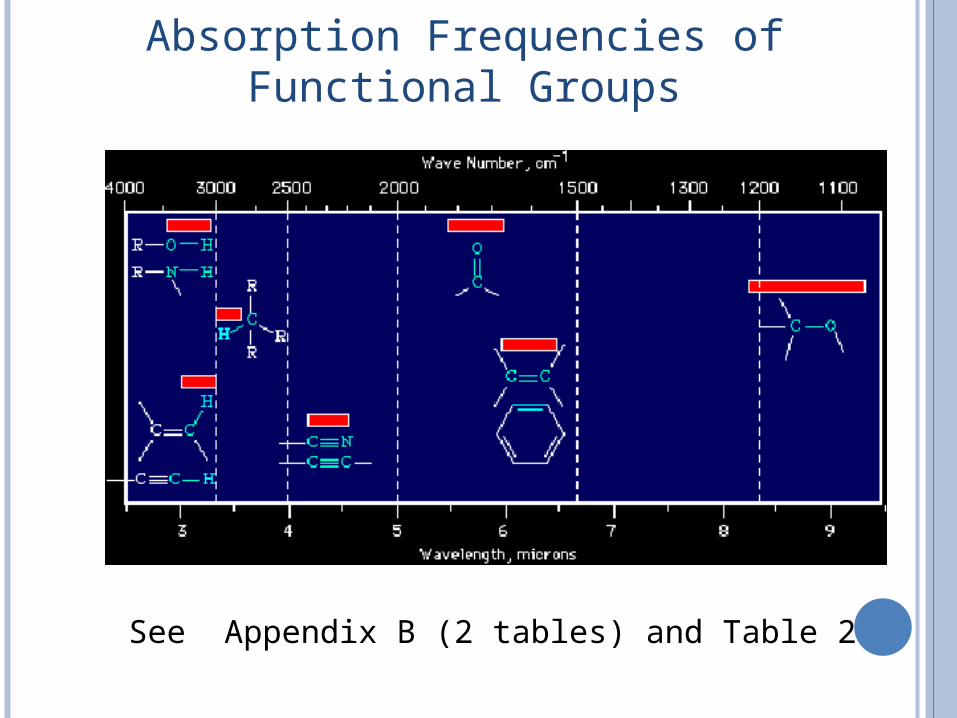
See Appendix B (2 tables) and Table 2
Absorption Frequencies of Functional Groups
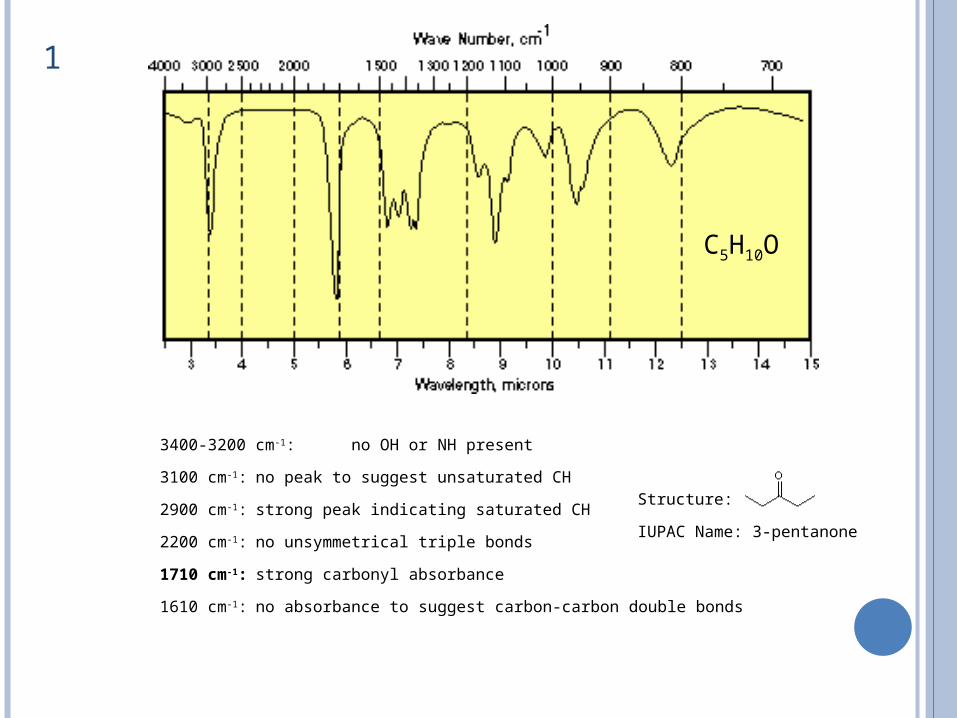
3400-3200 cm-1: no OH or NH present
3100 cm-1: no peak to suggest unsaturated CH
2900 cm-1: strong peak indicating saturated CH
2200 cm-1: no unsymmetrical triple bonds
1710 cm-1: strong carbonyl absorbance
1610 cm-1: no absorbance to suggest carbon-carbon double bonds
Structure:
IUPAC Name: 3-pentanone
1
C5H10O
3400-3200 cm-1: no OH or NH present
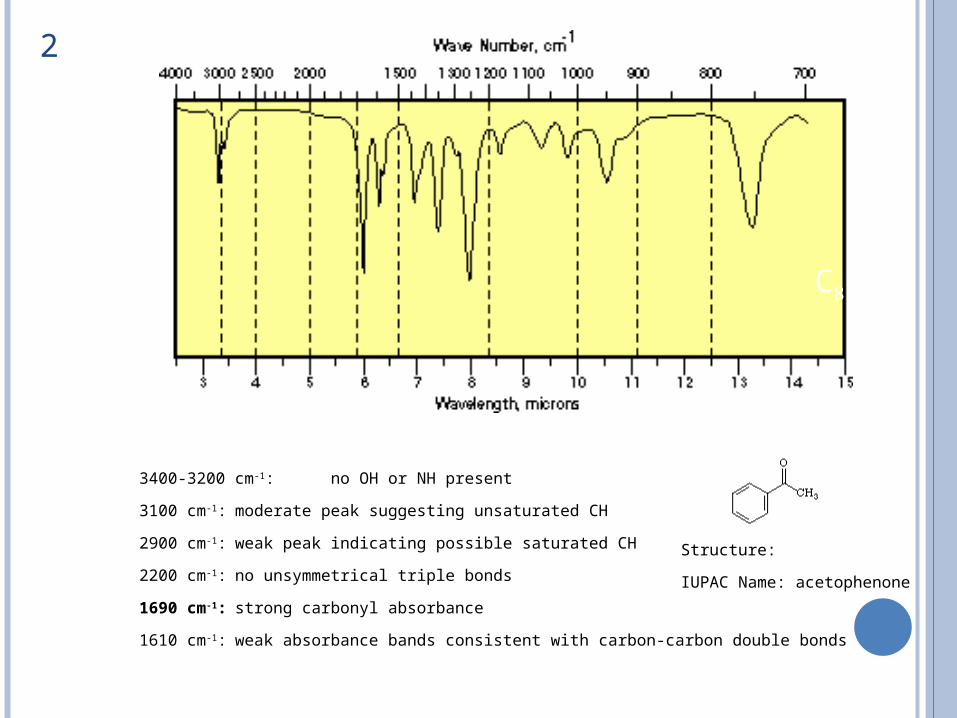
3100 cm-1: moderate peak suggesting unsaturated CH
2900 cm-1: weak peak indicating possible saturated CH
2200 cm-1: no unsymmetrical triple bonds
1690 cm-1: strong carbonyl absorbance
1610 cm-1: weak absorbance bands consistent with carbon-carbon double bonds
Structure:
IUPAC Name: acetophenone
2
C8H8O
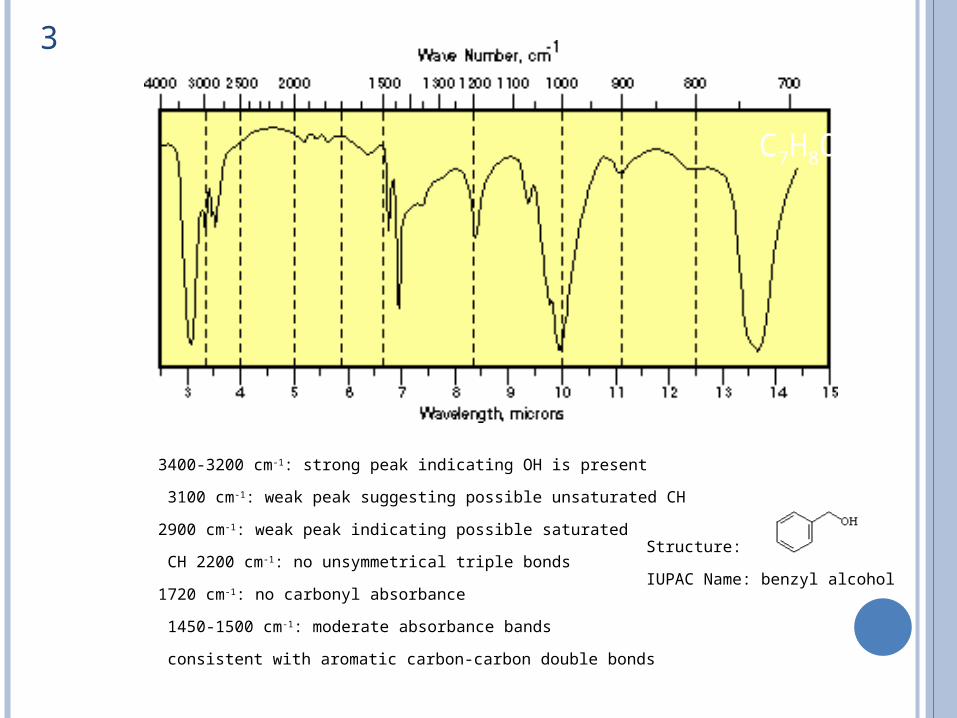
3400-3200 cm-1: strong peak indicating OH is present
3100 cm-1: weak peak suggesting possible unsaturated CH
2900 cm-1: weak peak indicating possible saturated
CH 2200 cm-1: no unsymmetrical triple bonds
1720 cm-1: no carbonyl absorbance
1450-1500 cm-1: moderate absorbance bands
consistent with aromatic carbon-carbon double bonds
Structure:
IUPAC Name: benzyl alcohol
3
C7H8O

3400-3200 cm-1: no peak which would indicate OH or NH
3100 cm-1: moderate peak indicating unsaturated CH
2900 cm-1: no peaks to indicate saturated CH
2750-2600 cm-1 ; moderate peaks strongly suggesting aldehydic CH
2250 cm-1: no absorbance indicating an unsymmetrical triple bonds
1700 cm-1: strong carbonyl absorbance
1450-1600 cm-1 :moderate absorbance bands consistent with aromatic carbon-carbon double bonds
Structure:
IUPAC Name: benzaldehyde
4
C7H6O
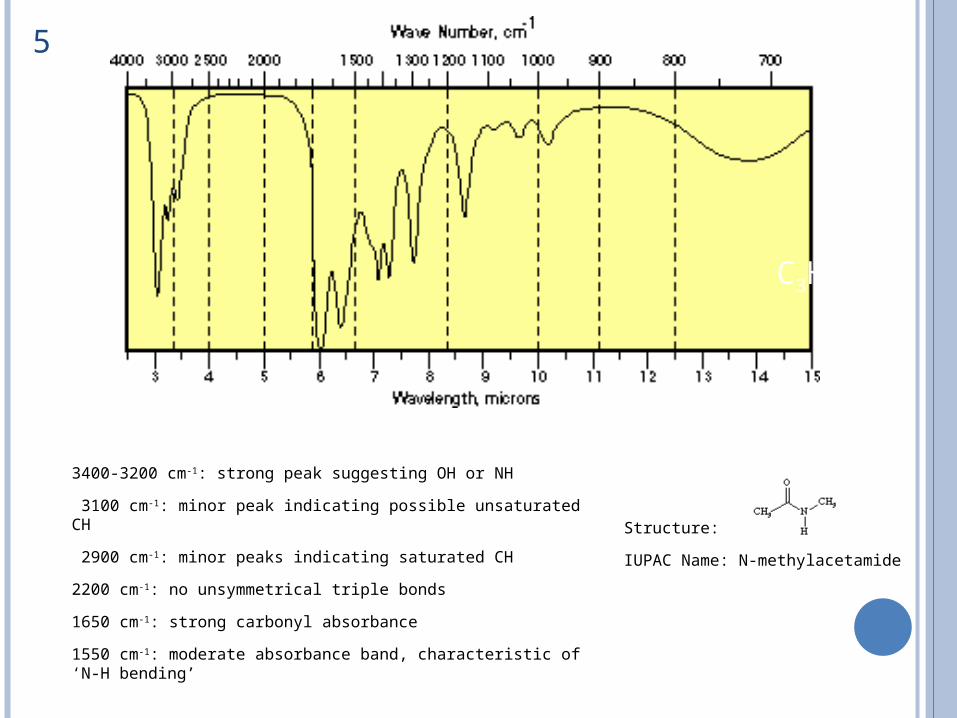
3400-3200 cm-1: strong peak suggesting OH or NH
3100 cm-1: minor peak indicating possible unsaturated CH
2900 cm-1: minor peaks indicating saturated CH
2200 cm-1: no unsymmetrical triple bonds
1650 cm-1: strong carbonyl absorbance
1550 cm-1: moderate absorbance band, characteristic of ‘N-H bending’
Structure:
IUPAC Name: N-methylacetamide
5
C3H10NO
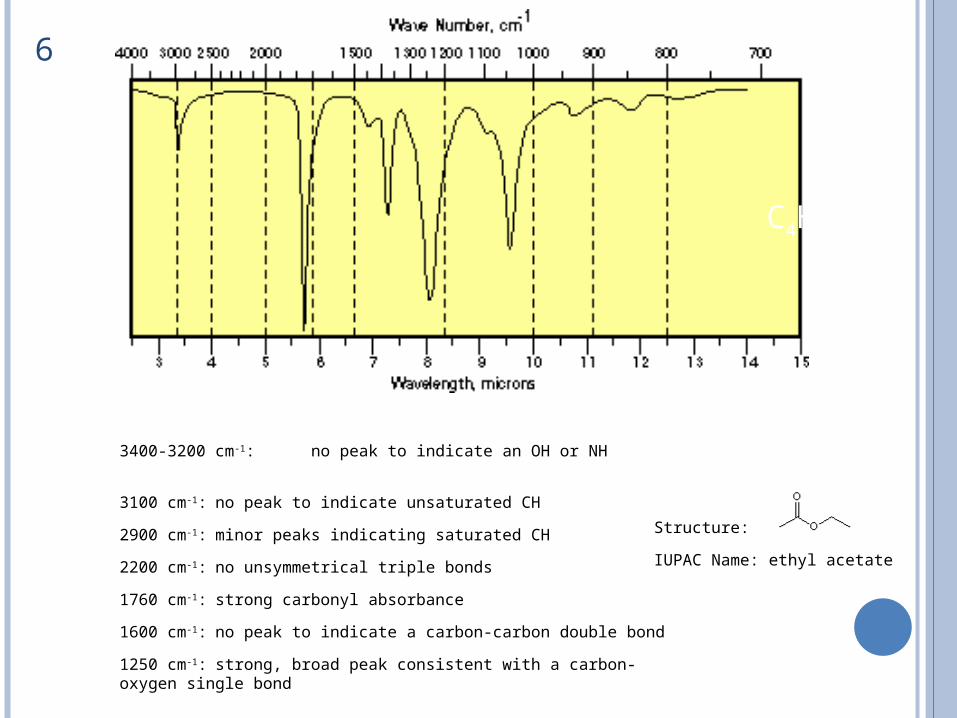
3400-3200 cm-1: no peak to indicate an OH or NH
3100 cm-1: no peak to indicate unsaturated CH
2900 cm-1: minor peaks indicating saturated CH
2200 cm-1: no unsymmetrical triple bonds
1760 cm-1: strong carbonyl absorbance
1600 cm-1: no peak to indicate a carbon-carbon double bond
1250 cm-1: strong, broad peak consistent with a carbon-oxygen single bond
Structure:
IUPAC Name: ethyl acetate
6
C4H8O2

C4H8O2

NMR SPECTROSCOPY
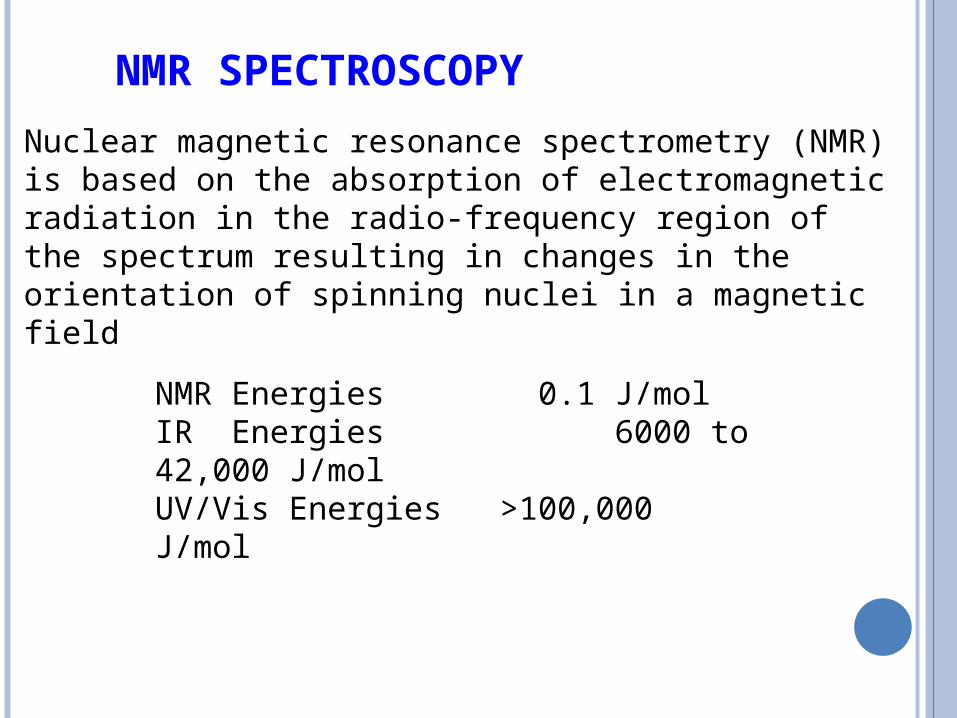
Nuclear magnetic resonance spectrometry (NMR) is based on the absorption of electromagnetic radiation in the radio-frequency region of the spectrum resulting in changes in the orientation of spinning nuclei in a magnetic field
NMR SPECTROSCOPY
NMR Energies 0.1 J/mol IR Energies 6000 to 42,000 J/molUV/Vis Energies >100,000 J/mol
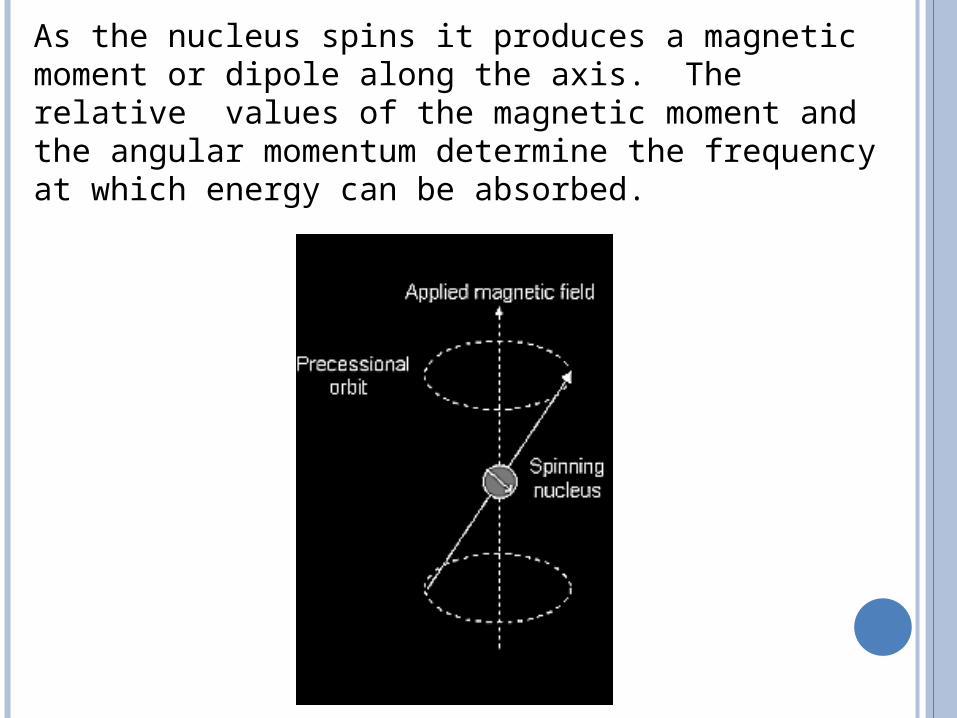
As the nucleus spins it produces a magnetic moment or dipole along the axis. The relative values of the magnetic moment and the angular momentum determine the frequency at which energy can be absorbed.
Table 4. Nuclear Spin Quantum Numbers and Magnetic Properties of Nuclei
Nucleus Nuclear spinQuantumNumber
MagneticMoment,(amperesquare meterx 1027
ResonanceFrequency inMHz at1.4092TESLA
RelativeSensitivity atthe NaturalIsotopicAbundance
Hydrogen 1/2 14.09 60.000 1.00Deuterium 1 4.34 9.211 0.00015Carbon 12 0 -- -- --Carbon 13 1/2 3.52 15.085 0.00018Fluorine 19 1/2 13.28 56.446 0.834
Relative Sensitivity of NMR Techniques
In PMR the instrument is detecting the energy difference between protons with a spin of +1/2 (low
energy) and -1/2 higher energy.
Proton Magnetic Resonance
The application of electromagnetic radiation can excite the nuclei into the higher energy level. The
frequency that causes the excitation is determined by the difference in energy between the energy levels.
The NMR spectrum arises because nuclei in different parts of the molecule experience different local
magnetic fields according to the molecular structure, and so have different
frequencies at which they absorb. This difference is called the chemical shift.
Chemical Shift
This is because the nucleus is shielded from this field to a greater or lesser extent by the other atoms in the
vicinity and their electrons.
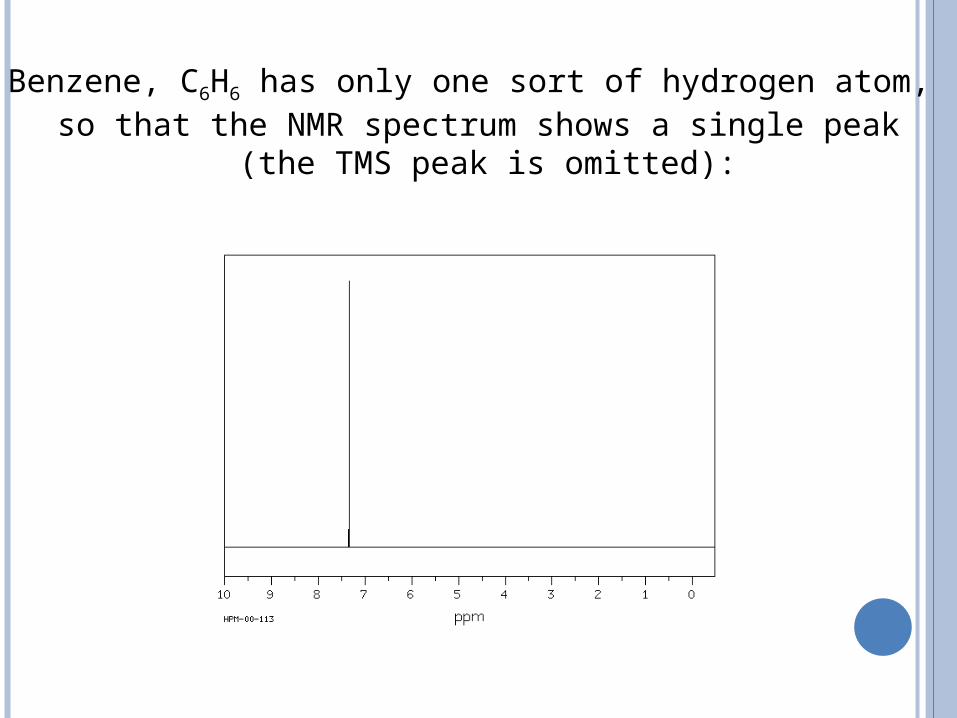
Benzene, C6H6 has only one sort of hydrogen atom, so that the NMR spectrum shows a single peak
(the TMS peak is omitted):

Ethanal CH3CHO has two sorts of hydrogen atom, those on the methyl group and the one on the
aldehyde group. It therefore has two peaks in its spectrum (the TMS peak is omitted).
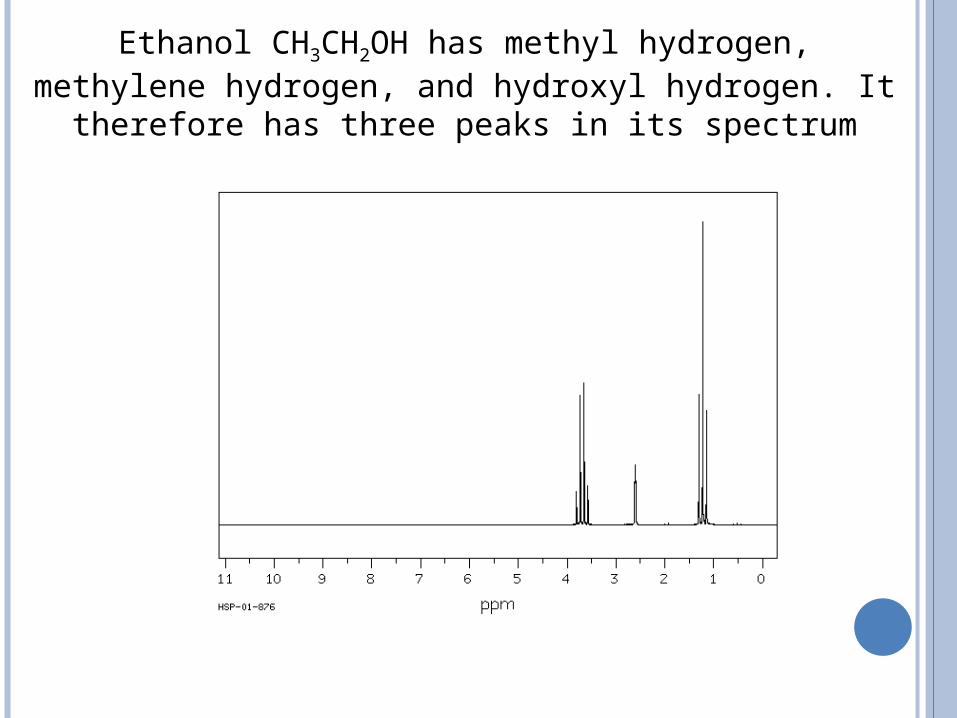
Ethanol CH3CH2OH has methyl hydrogen, methylene hydrogen, and hydroxyl hydrogen. It therefore has
three peaks in its spectrum
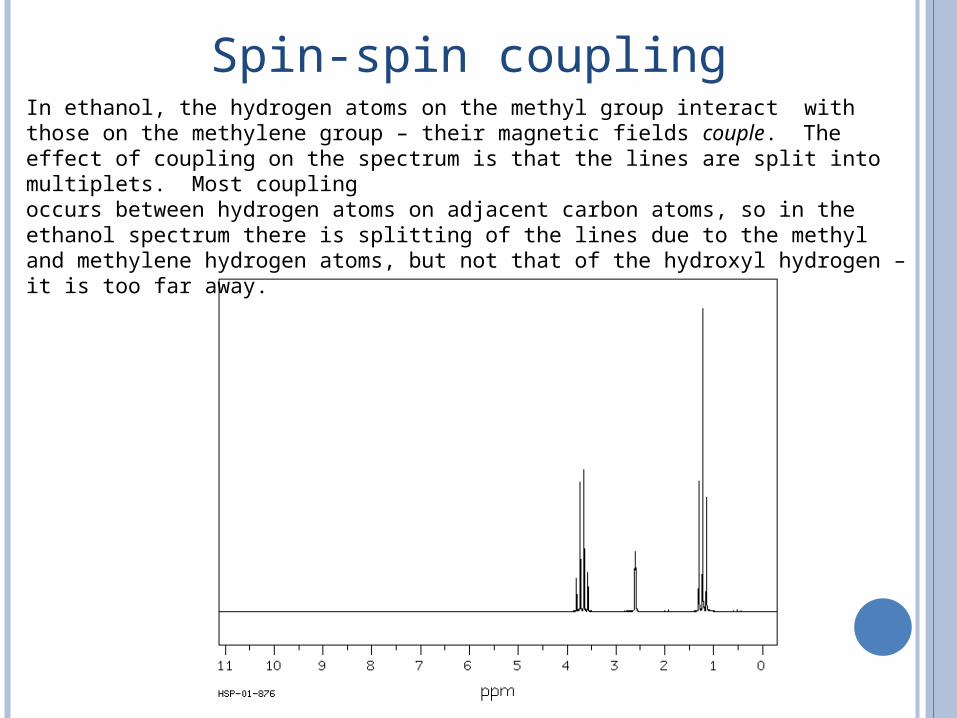
In ethanol, the hydrogen atoms on the methyl group interact with those on the methylene group – their magnetic fields couple. The effect of coupling on the spectrum is that the lines are split into multiplets. Most coupling occurs between hydrogen atoms on adjacent carbon atoms, so in the ethanol spectrum there is splitting of the lines due to the methyl and methylene hydrogen atoms, but not that of the hydroxyl hydrogen – it is too far away.
Spin-spin coupling