introduction to r statistical software anthony (tony) r. olsen usepa ord nheerl western ecology...
TRANSCRIPT

Introduction toR Statistical Software
Anthony (Tony) R. OlsenUSEPA ORD NHEERL
Western Ecology DivisionCorvallis, OR 97333
(541) [email protected]
What is R?
• A language and environment for statistical computing and graphics
• Based on the “S” system developed by Bell Laboratories
• From R Project for Statistical Computing
• R is available as Free Software
• S-Plus is a commercial implementation of the “S” system
The R Environment is an integrated suite of software
• effective data handling and storage
• calculations on spreadsheets and arrays
• integrated collection of statistical analysis tools
• graphical display on-screen or hardcopy
• a programming language
• add capability using packages (libraries)

Why use R for Aquatic Monitoring Survey Design & Analysis?
• Needed way to provide survey design and survey analysis algorithms to others (particularly states and tribal nations)
• No existing statistical software has the algorithms required
• Many organizations have limited ability to purchase any recommended commercial statistical software
• R is free, easily installed, and usable with training
• Our approach is to provide libraries that minimize knowledge required about R

Acquiring and Installing R Use web browser to access http://cran.us.r-
project.org/
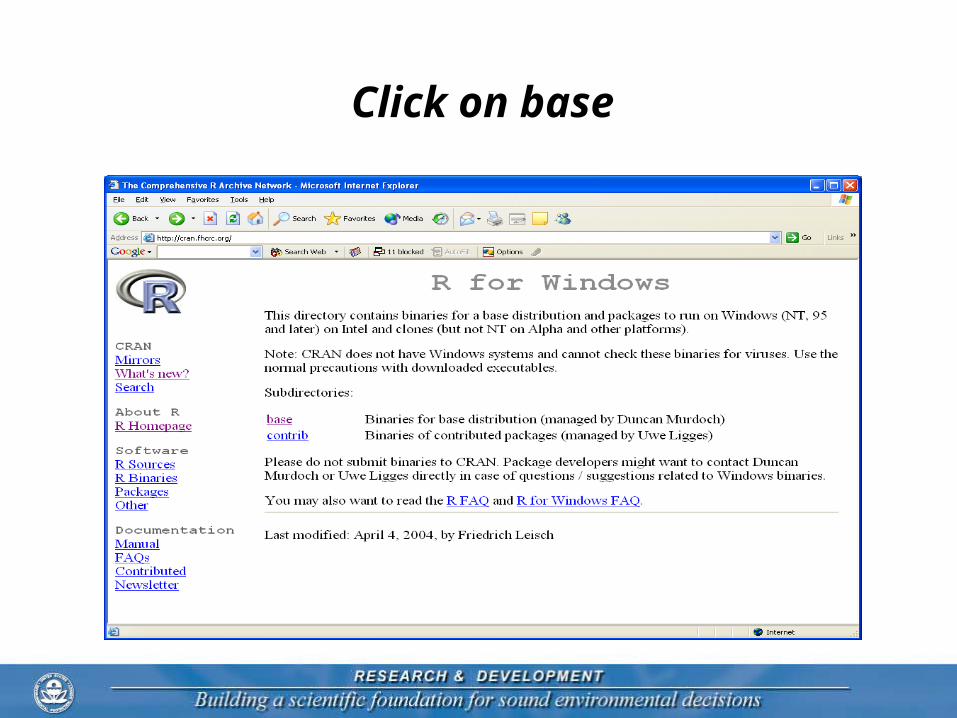
Click on base
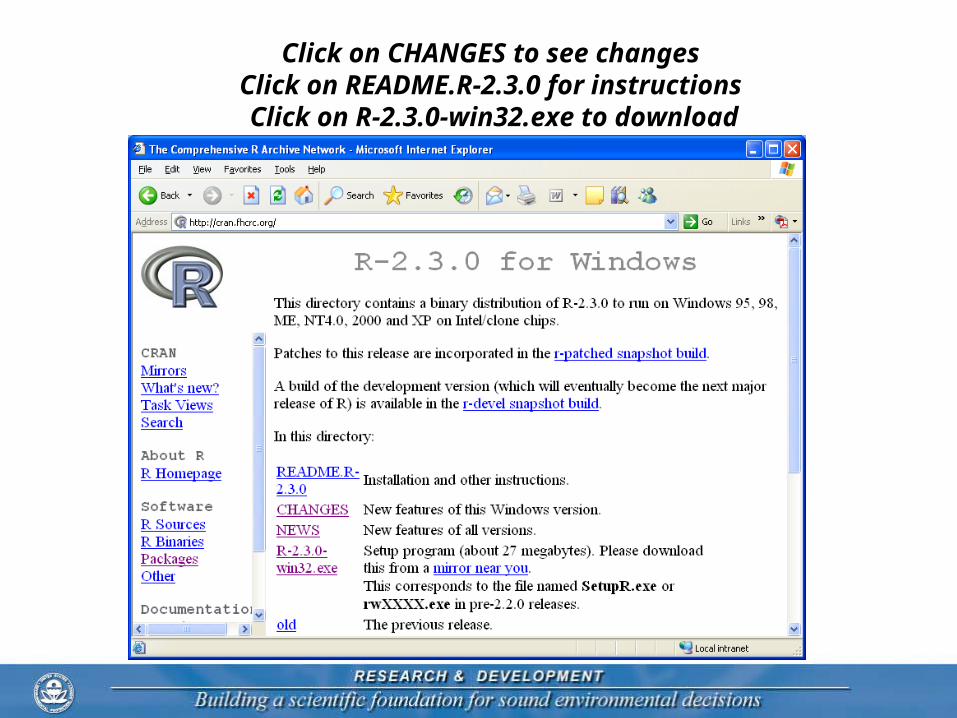
Click on CHANGES to see changesClick on README.R-2.3.0 for instructions
Click on R-2.3.0-win32.exe to download
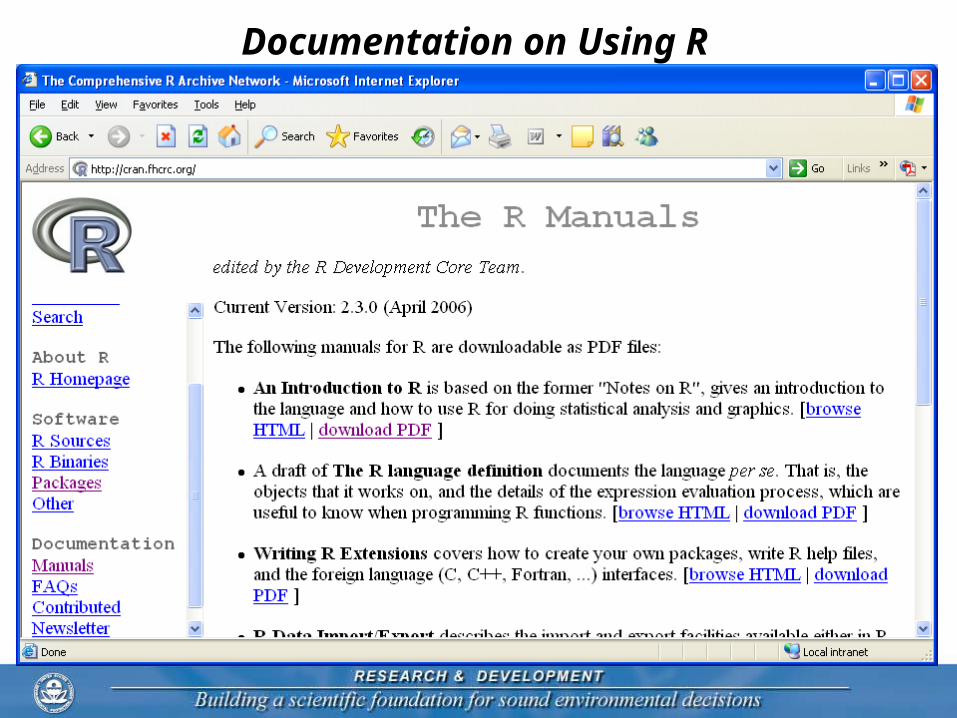
Documentation on Using R
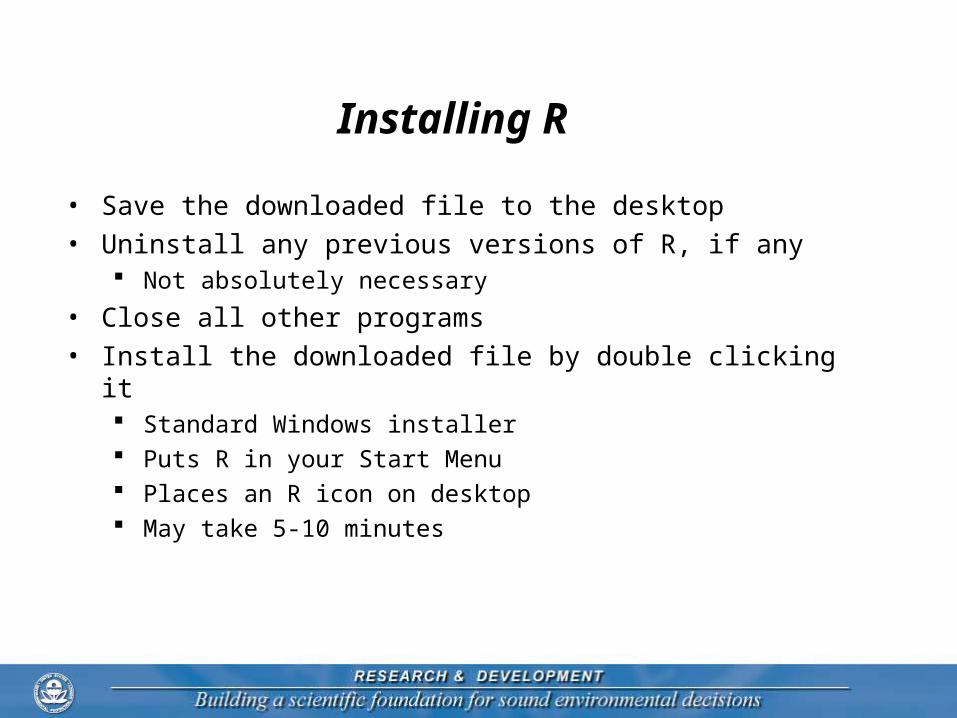
Installing R
• Save the downloaded file to the desktop
• Uninstall any previous versions of R, if any Not absolutely necessary
• Close all other programs
• Install the downloaded file by double clicking it Standard Windows installer Puts R in your Start Menu Places an R icon on desktop May take 5-10 minutes
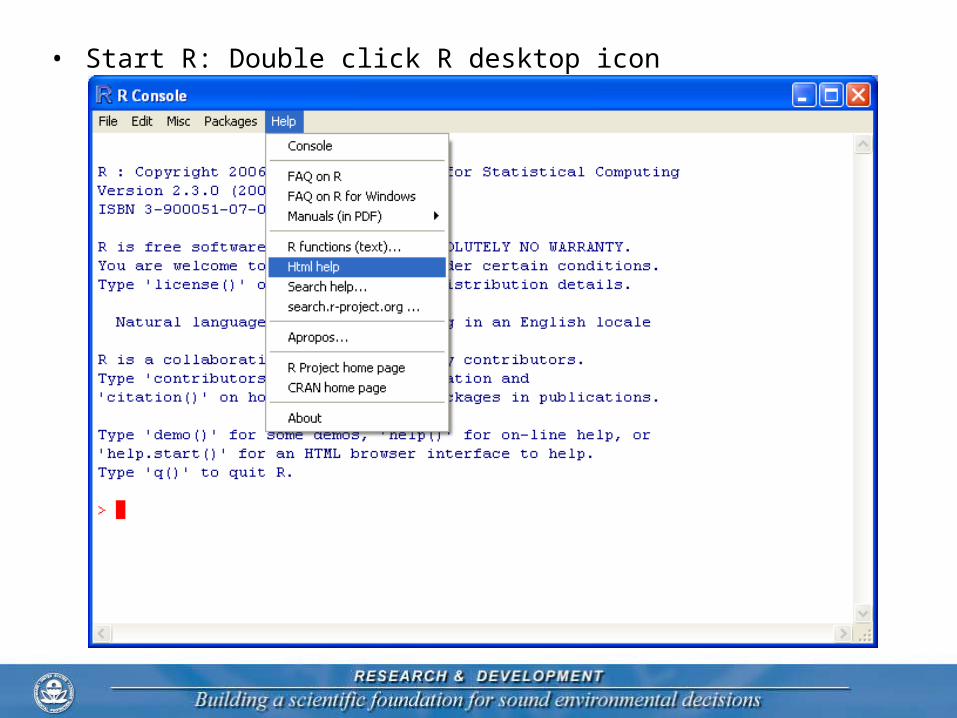
• Start R: Double click R desktop icon
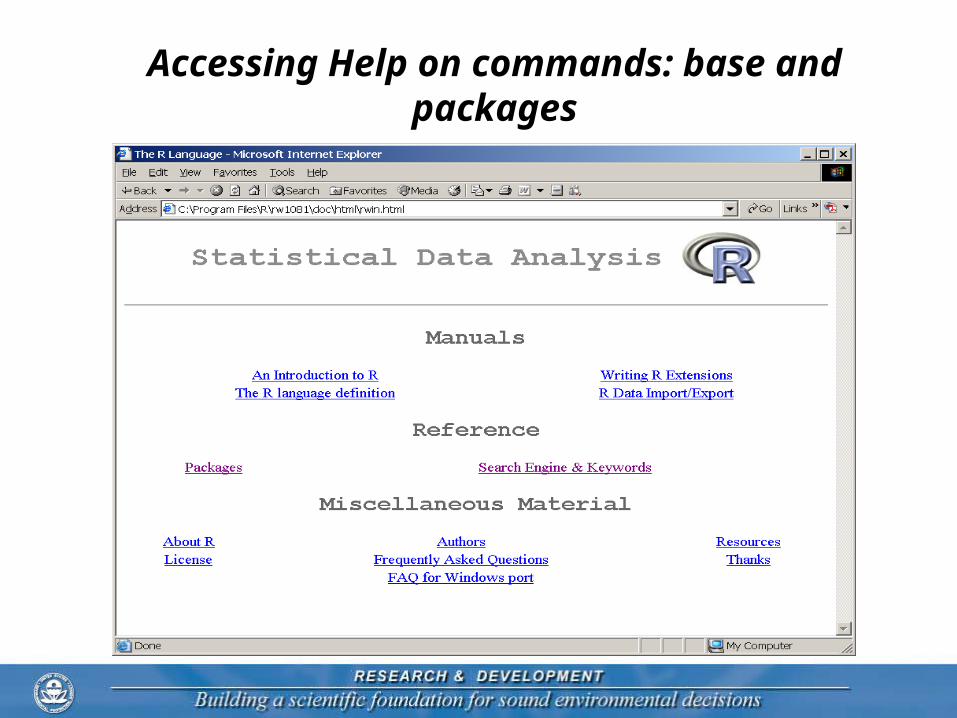
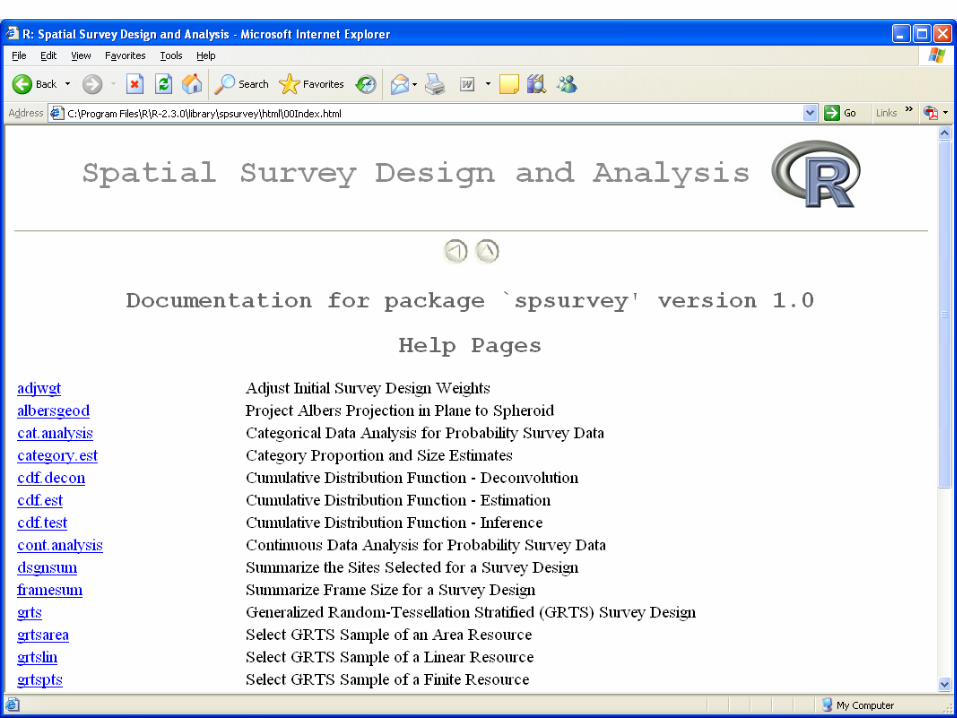
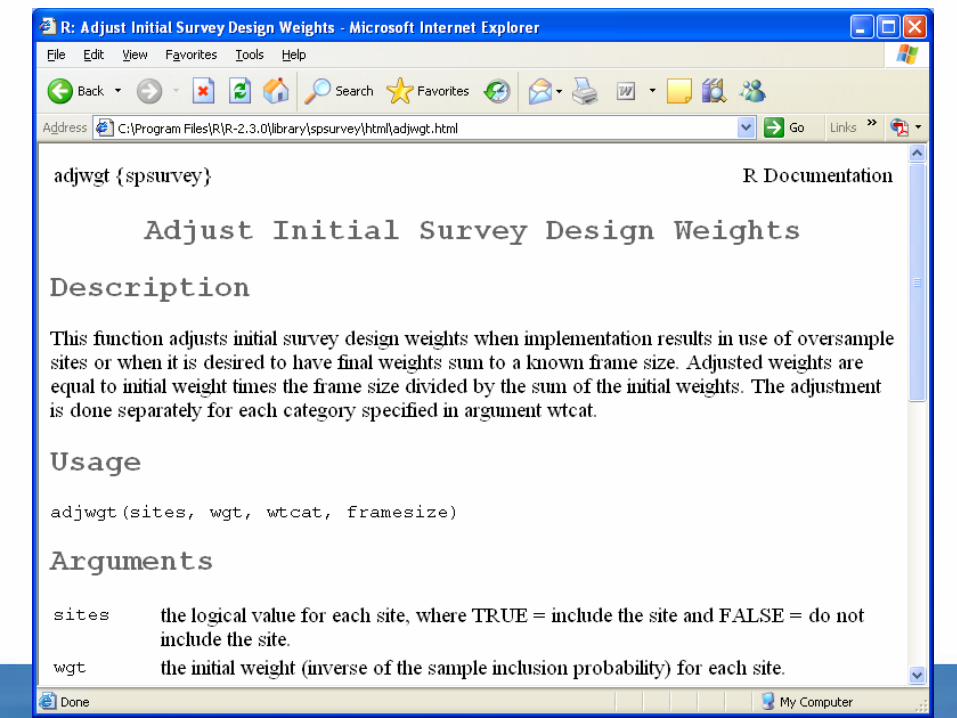
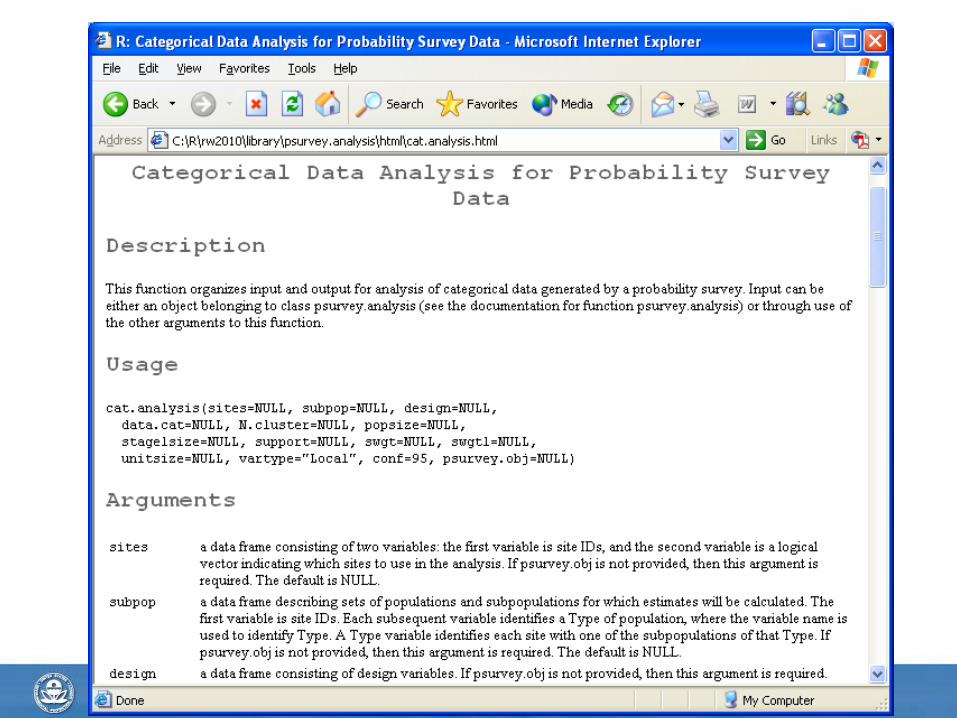
Accessing Help on commands: base and packages

List of packagesKey ones:
base
spsurvey
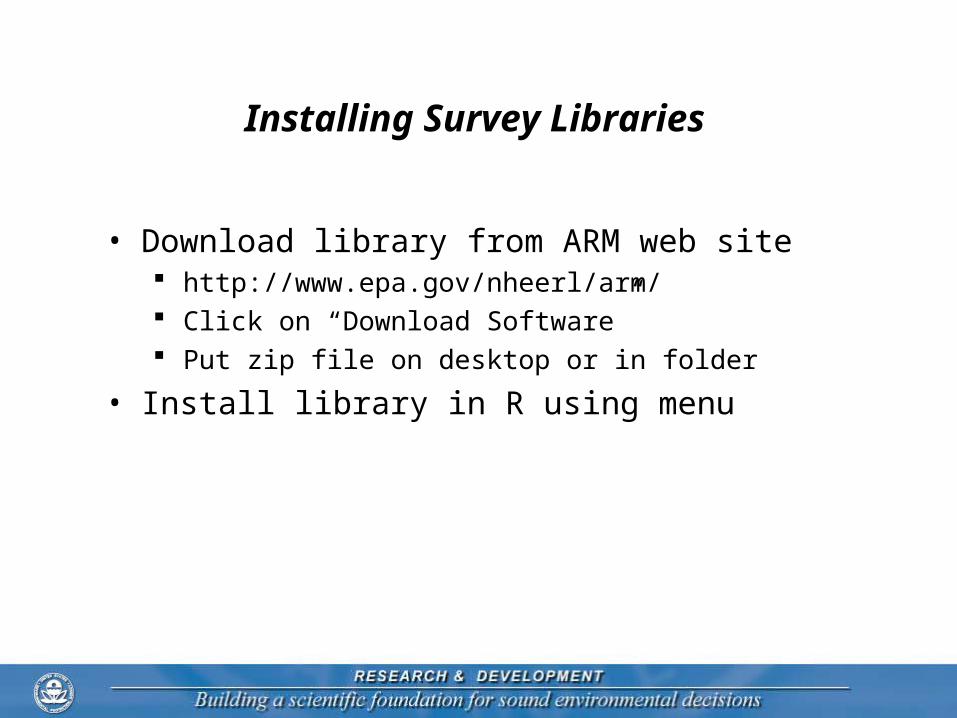
Installing Survey Libraries
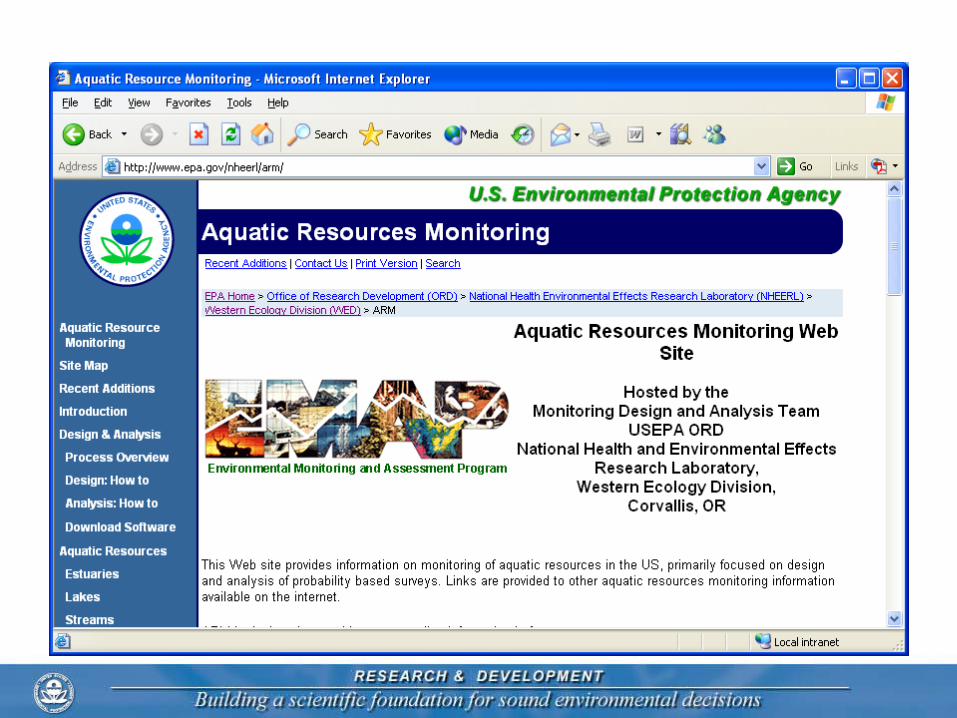
• Download library from ARM web site http://www.epa.gov/nheerl/arm/ Click on “Download Software” Put zip file on desktop or in folder
• Install library in R using menu
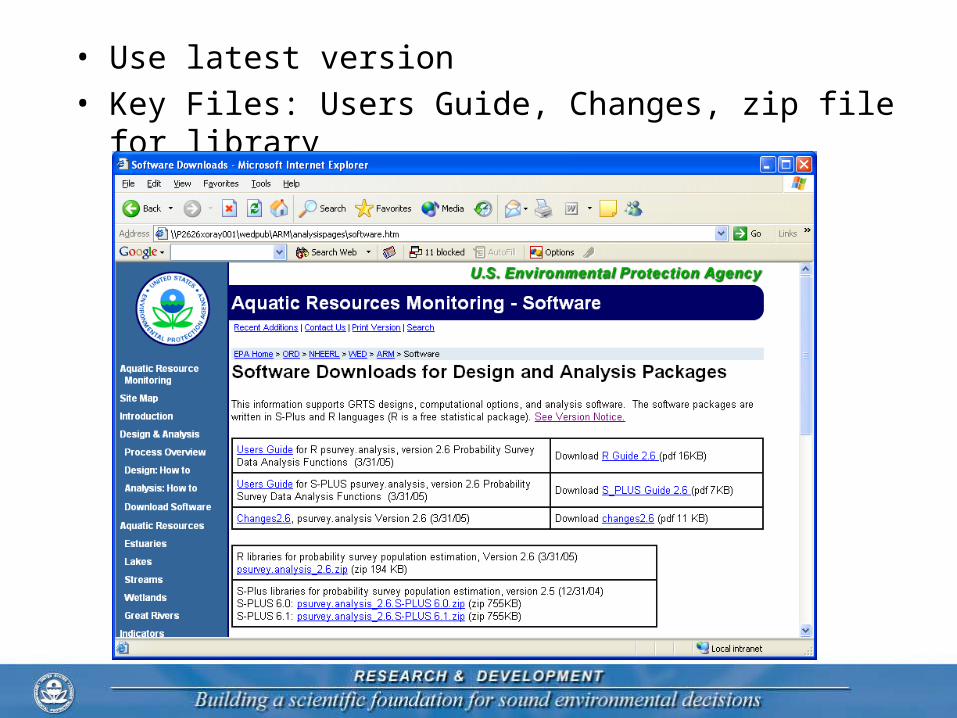
• Use latest version
• Key Files: Users Guide, Changes, zip file for library
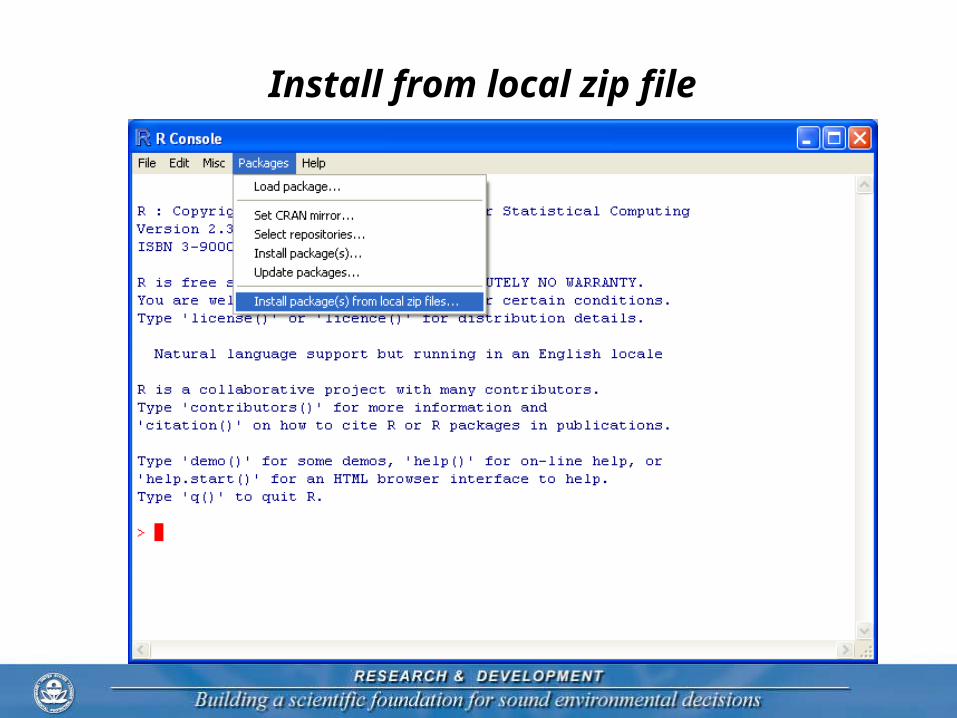
Install from local zip file
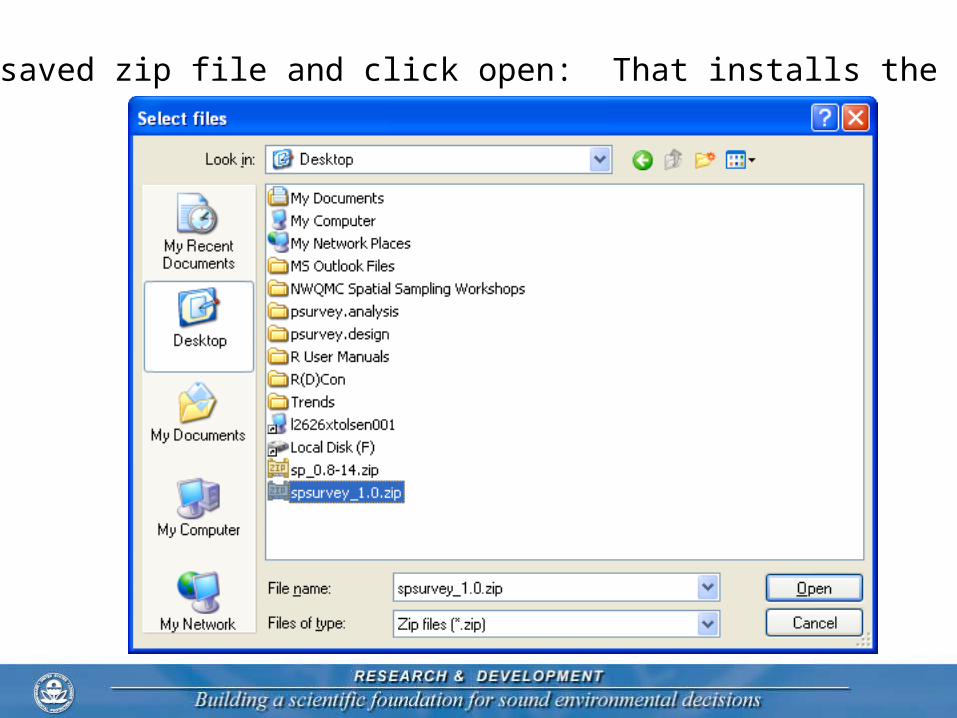
Find the saved zip file and click open: That installs the library!
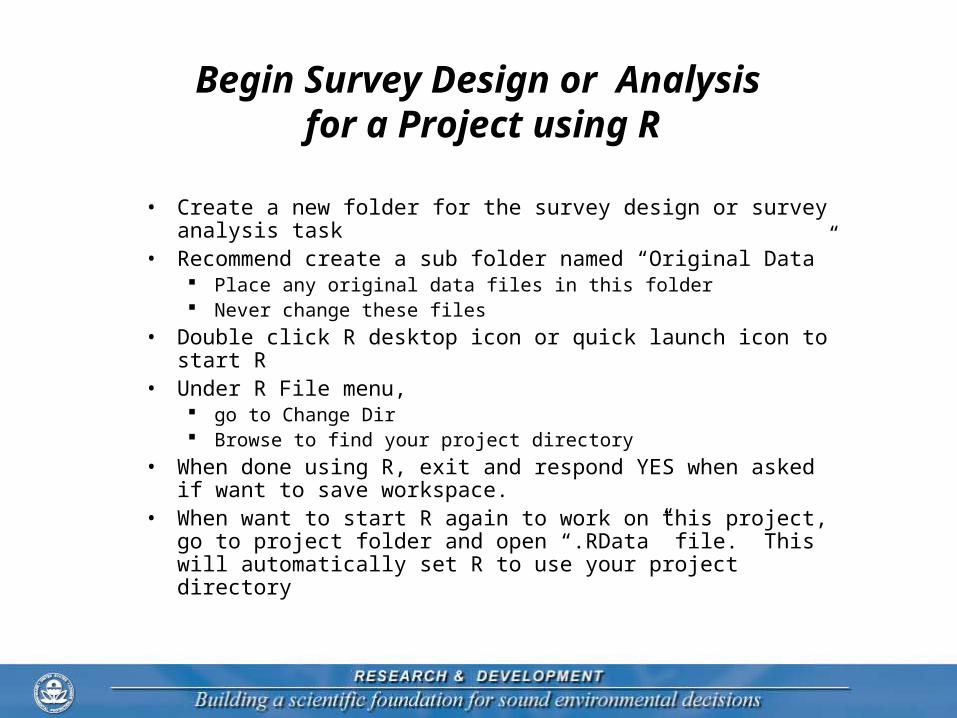
Begin Survey Design or Analysis for a Project using R
• Create a new folder for the survey design or survey analysis task• Recommend create a sub folder named “Original Data”
Place any original data files in this folder Never change these files
• Double click R desktop icon or quick launch icon to start R• Under R File menu,
go to Change Dir Browse to find your project directory
• When done using R, exit and respond YES when asked if want to save workspace.
• When want to start R again to work on this project, go to project folder and open “.RData” file. This will automatically set R to use your project directory
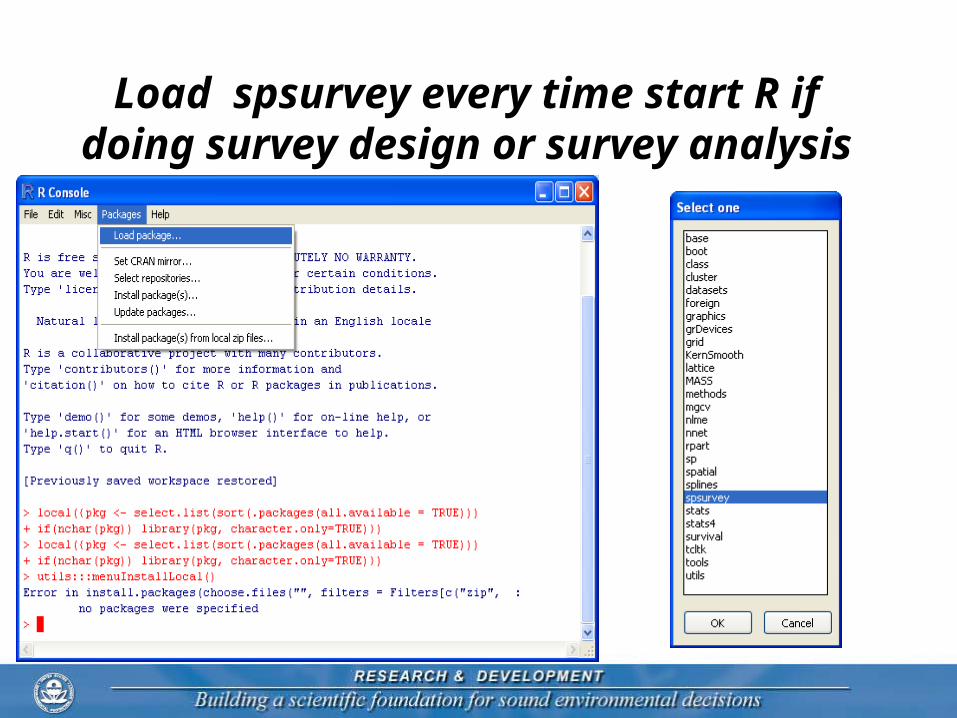
Load spsurvey every time start R if doing survey design or survey analysis
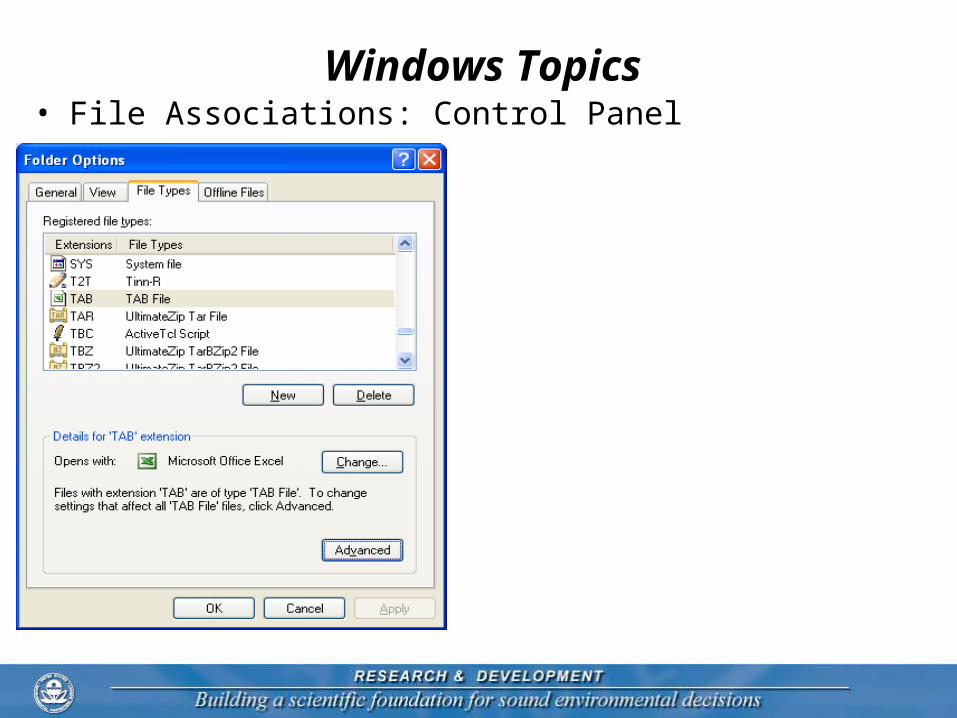
Windows Topics• File Associations: Control Panel
Executing Commands in R
• Three options to execute commands in R Type commands in console window
• window automatically opens when start R• Commands execute when hit “Enter” key
Use script window in R• Under File menu either create New or Open existing script file• Type commands in script window• To execute commands, copy and paste into console window• Close window and save to project directory• Use saved script file when want to continue work on same project
Use another text editor program• Type commands in editor• Copy and Paste into R console window
• Advantages of R script window or text editor approach Can save all your commands in both cases Some text editors recognize R language and structure making it easy to locate
errors (e.g. Tinn-R) Redo the analysis if change data with little extra work Can set up an example analysis and use as template for other analyses Aid in QA for analysis process
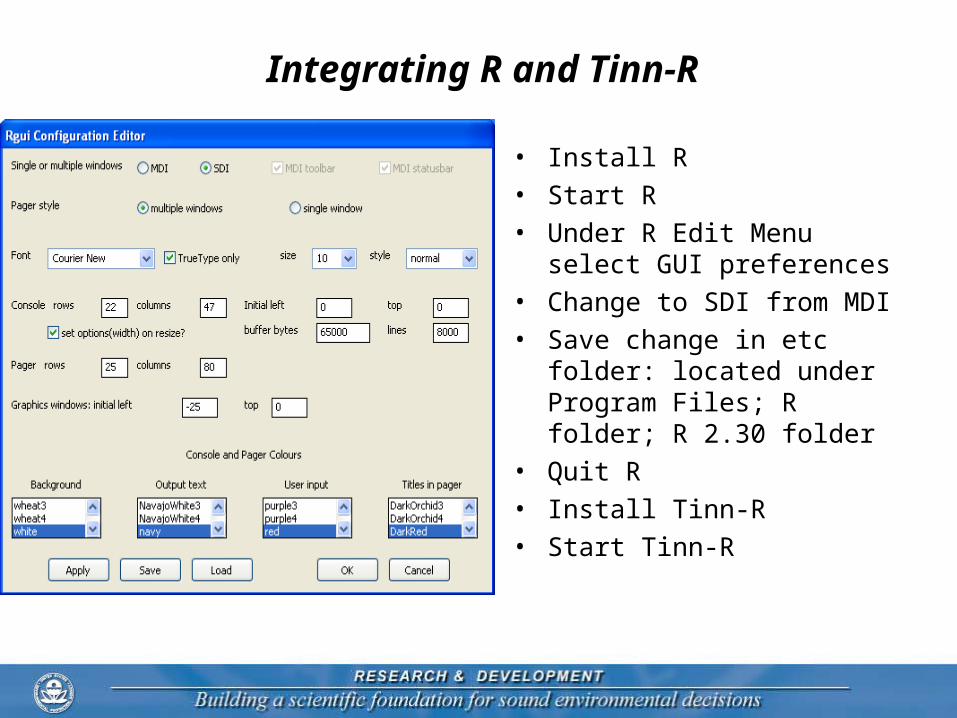
Integrating R and Tinn-R
• Install R
• Start R
• Under R Edit Menu select GUI preferences
• Change to SDI from MDI
• Save change in etc folder: located under Program Files; R folder; R 2.30 folder
• Quit R
• Install Tinn-R
• Start Tinn-R
Things to be aware of
• Column names may be modified in R “blanks” will become “.” Unusual characters will become “.” Unusual character at beginning (e.g. %), will change to “X.”
• Blanks in spreadsheet will be turned into missing data• “NA” in spreadsheet will be interpreted as missing data,
except when column is character• Everything after “#” is ignored. Can be overridden.• Reading a “csv” file may result in unanticipated results if
columns contain “,” in character fields (use “tab” delimited instead)