introduction to microwave remote sensing -...
TRANSCRIPT

1
Introduction to Microwave Introduction to Microwave Remote SensingRemote Sensing
Dr. Sandra Cruz Pol
Microwave Remote Sensing INEL 6069Dept. of Electrical & Computer Engineering,
UPRM, Mayagüez, PR
Spring 2003
2
OutlineOutline
� What is radiometry?� Importance of Microwaves� Radar� Radiometer � Brief history � Recent applications� Plane Waves� Antennas

3
What is What is radiometry?radiometry?
� All objects radiate EM energy.
� Radiometry measures of natural EM radiation from objects; earth, ice, plants...
4
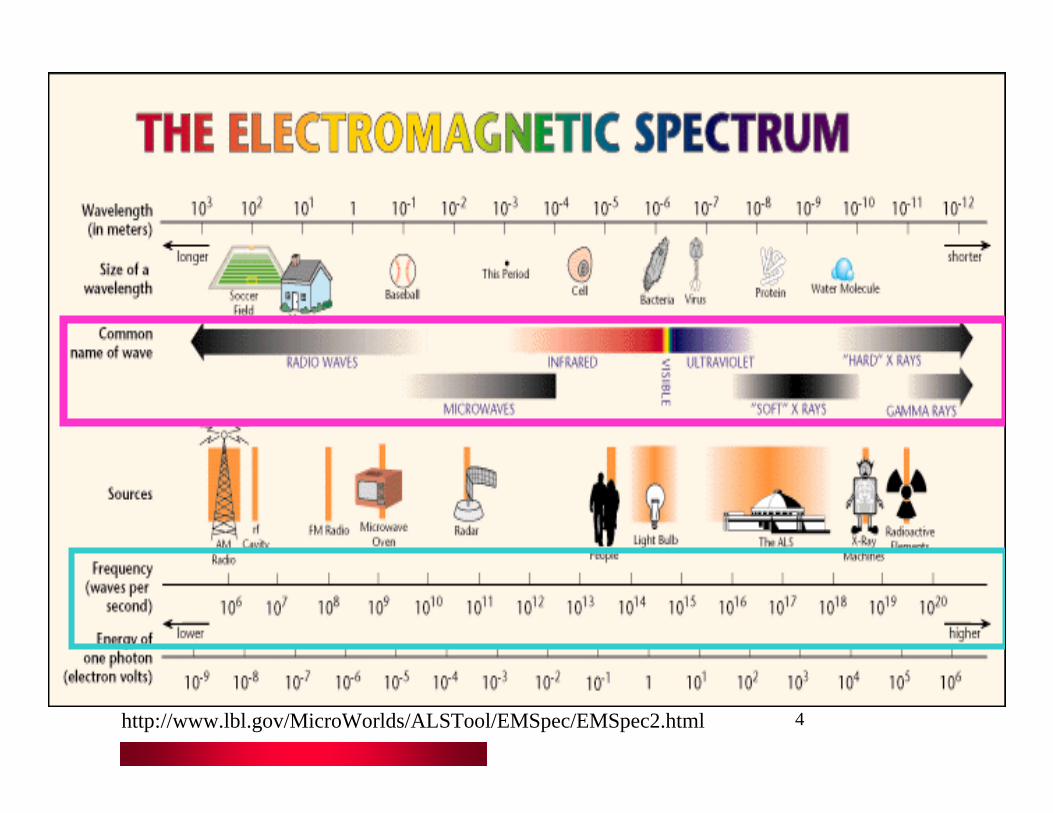
Electromagnetic SpectrumElectromagnetic Spectrum
http://www.lbl.gov/MicroWorlds/ALSTool/EMSpec/EMSpec2.html
5
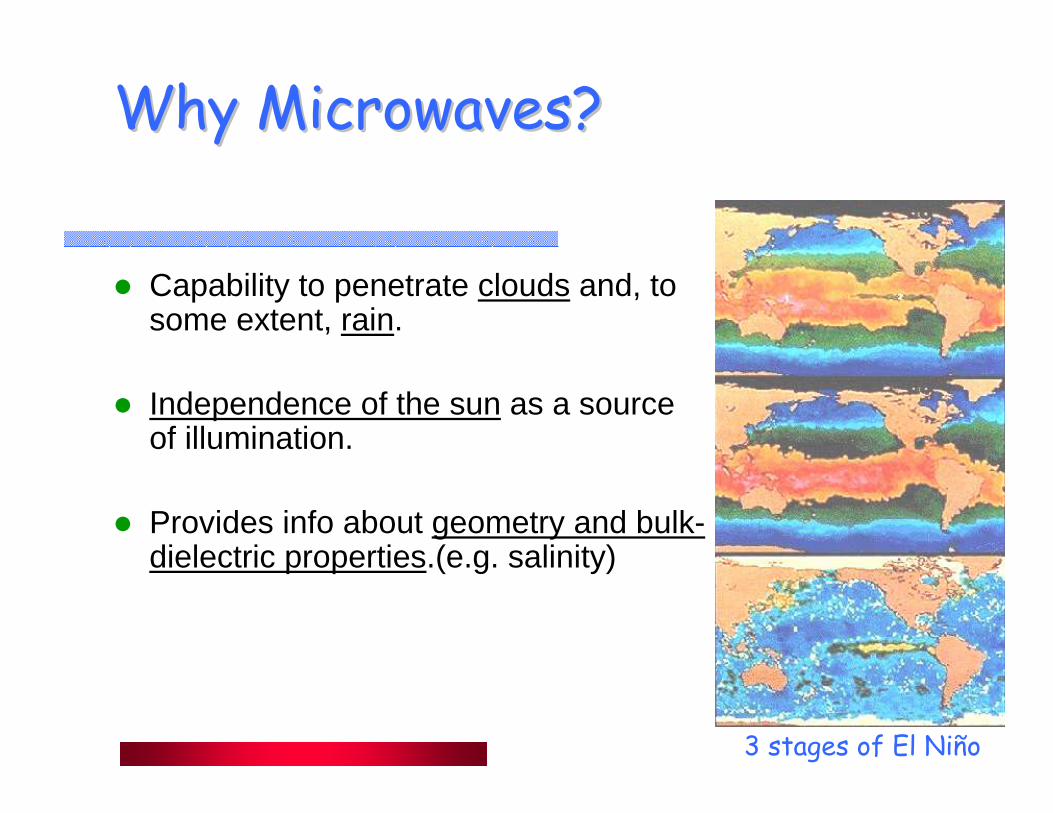
Why Microwaves?Why Microwaves?
� Capability to penetrate clouds and, to some extent, rain.
� Independence of the sun as a source of illumination.
� Provides info about geometry and bulk-dielectric properties.(e.g. salinity)
3 stages of El Niño
6
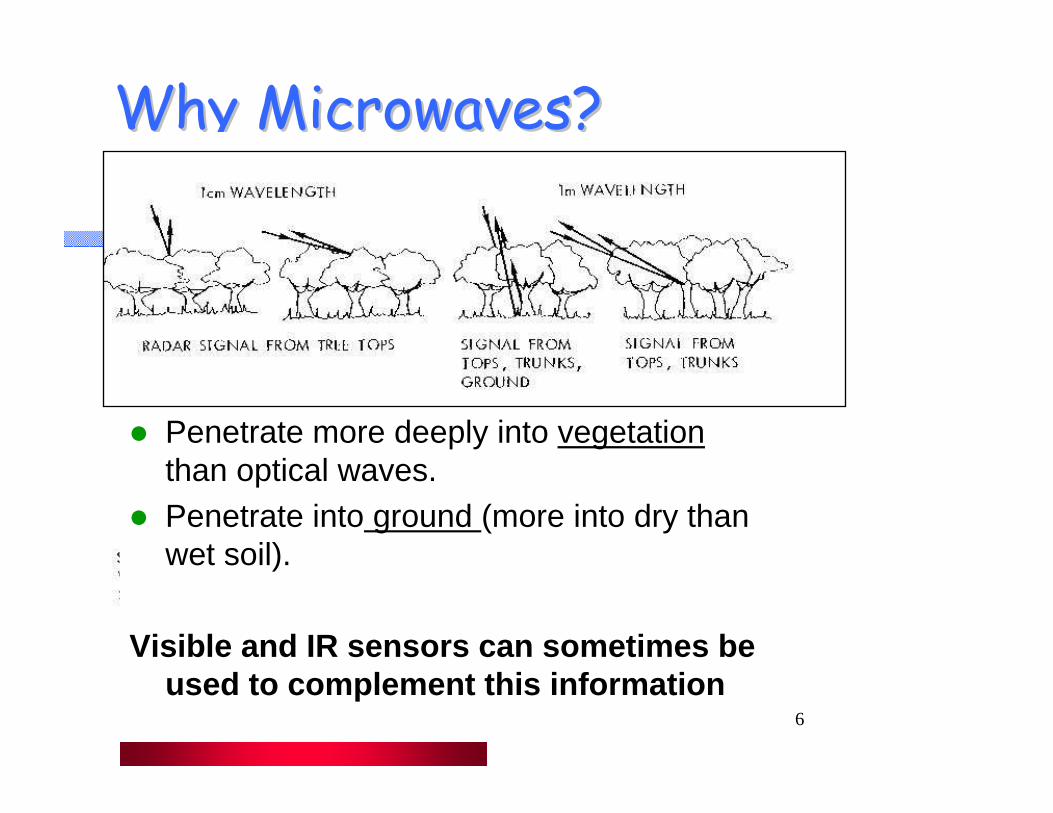
Why Microwaves?Why Microwaves?
� Penetrate more deeply into vegetationthan optical waves.
� Penetrate into ground (more into dry than wet soil).
Visible and IR sensors can sometimes be used to complement this information

7
Microwave Radar BandsMicrowave Radar Bands
www.serve.com/mahood/RCS/bands.htm110-300 GHzmillimeter
76-81 GHz92-100
75-110 GHzW
59-64 GHz40-75 GHzV
33.4-36.0 GHz27-40 GHzKa
24.05-24.25 GHz
18-27 GHzK
13.4-14.0 GHz15.7-17.7
12-18 GHzKu
8.5-10.68 GHz8-12 GHzX
5.25-5.925 GHz4-8 GHzC
2.3-2.5 GHz2.7-3.7>
2-4 GHzS
1.215-1.4 GHz1-2 GHzL
420-450 MHz890-942
300-1000MHzUHF
138-144 MHz216-225
30-300 MHzVHF
3-30 MHz0HF
SPECIFICBands
NominalFrequency Range
BANDDesignation
(millimeter)

8
Where does energy goes?Where does energy goes?
� Energy (EM waves) received at the Earth from the Sun is – absorbed (atmosphere , clouds, earth, ocean…)– scattered– transmitted
� Absorbed energy is transformed– into thermal energy.
� Thermodynamic balance– through emission, absorption,…RT

9
Microwave Remote Sensing SensorsMicrowave Remote Sensing Sensors
Passive– uses of radiometers to study the EarthPassive sensors are called microwave radiometers, which
receive and detect the radiation emitted from various objects on the earth
Active– uses radar (Radio Detection and Ranging) to study Earth
Active microwave remote sensor illuminates the ground with microwave radiation and then receives the back-scattered energy from the object. Some of the active microwave remote sensors are :
� Side looking airborne radar (SLAR) � Synthetic aperture radar (SAR) � Wind scatterometer� Altimeter � Polarimeter� Rain mapping radar
10
HistoryHistory of Radarsof Radars� Henry Hertz, 1886 1rst
radio experiment, reflections detected @200MHz.
� 1925- Pulse radars to measure height of ionosphere.
� 1930- unintentional detection of airplanes
� WWII- detecting ships and aircraft. Used PPI displays.
� MIT- developed magnetron –hi-power Tx and klystron –Lo-power source
� 1938 Altimeter – airborne FM radars at 400MHz to measure altitude.
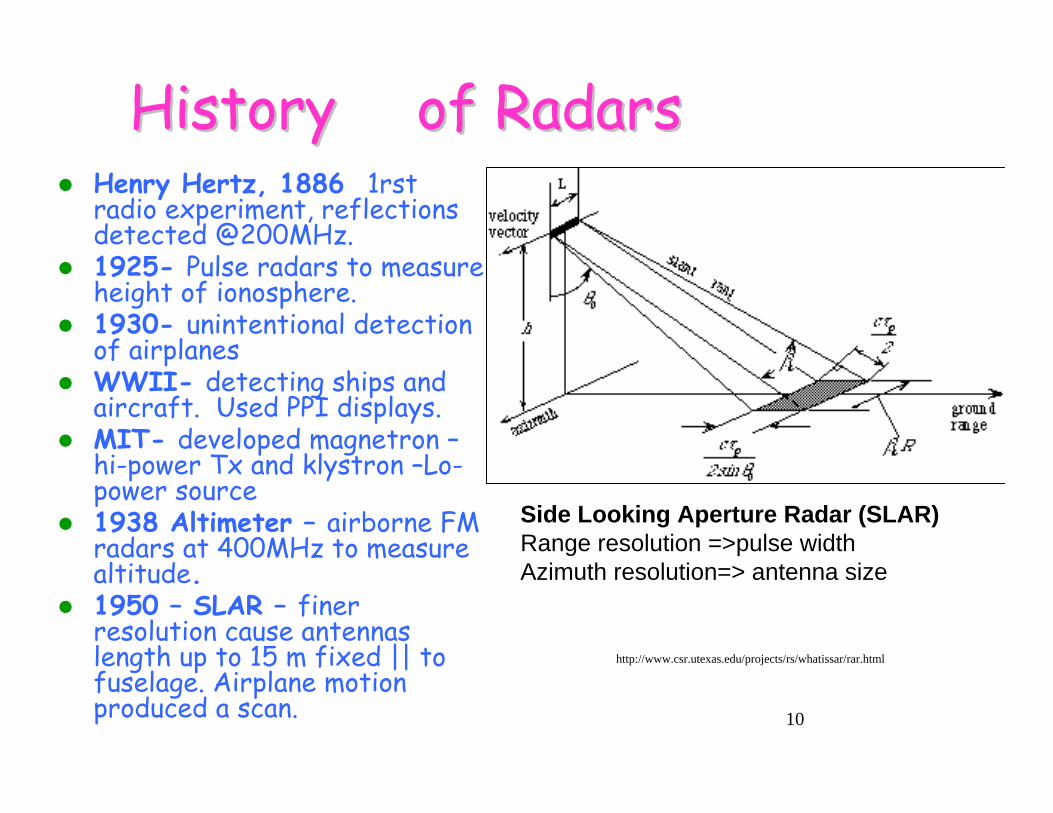
� 1950 – SLAR – finer resolution cause antennas length up to 15 m fixed || to fuselage. Airplane motion produced a scan.
http://www.csr.utexas.edu/projects/rs/whatissar/rar.html
Side Looking Aperture Radar (SLAR)Range resolution =>pulse widthAzimuth resolution=> antenna size
11
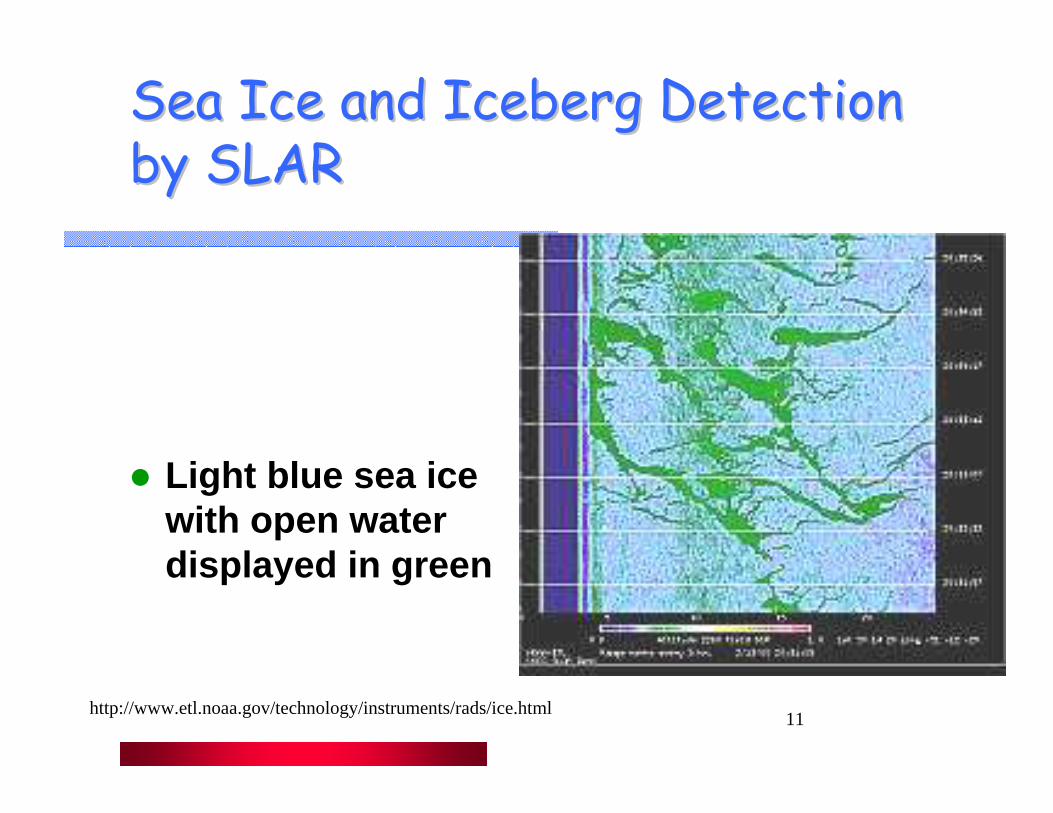
Sea Ice and Iceberg Detection Sea Ice and Iceberg Detection by SLARby SLAR
� Light blue sea ice with open water displayed in green
http://www.etl.noaa.gov/technology/instruments/rads/ice.html
12
HistoryHistory of Radarsof Radars
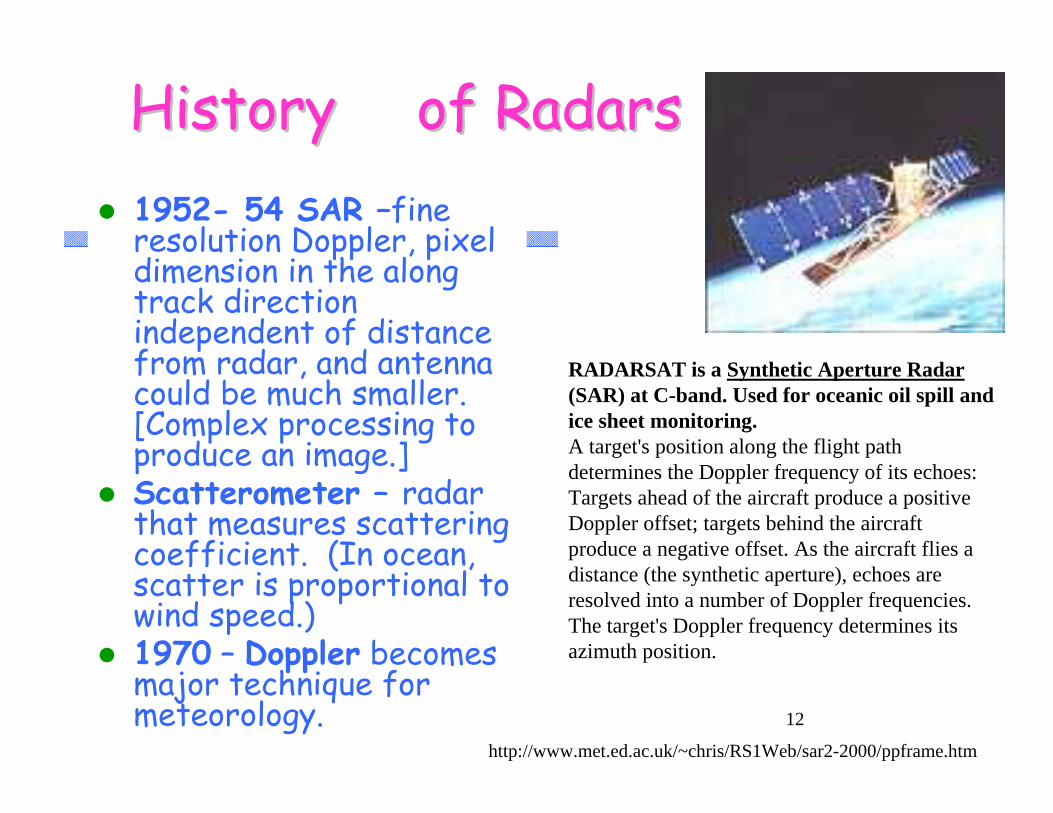
� 1952- 54 SAR –fine resolution Doppler, pixel dimension in the along track direction independent of distance from radar, and antenna could be much smaller. [Complex processing to produce an image.]
� Scatterometer – radar that measures scattering coefficient. (In ocean, scatter is proportional to wind speed.)
� 1970 – Doppler becomes major technique for meteorology.
RADARSAT is a Synthetic Aperture Radar(SAR) at C-band. Used for oceanic oil spill and ice sheet monitoring.A target's position along the flight path determines the Doppler frequency of its echoes: Targets ahead of the aircraft produce a positive Doppler offset; targets behind the aircraft produce a negative offset. As the aircraft flies a distance (the synthetic aperture), echoes are resolved into a number of Doppler frequencies. The target's Doppler frequency determines its azimuth position.
http://www.met.ed.ac.uk/~chris/RS1Web/sar2-2000/ppframe.htm

13
HistoryHistoryof Microwave Radiometersof Microwave Radiometers
� 1930s- First radiometers used for radio-astronomy
� 1950s- first radiometers used for terrestrial observations

14
Water absorption measurementsWater absorption measurements
circa 1945 � A Radiation Laboratory roof-
top crew use microwave radiometer equipment pointed at the sun to measure water absorption by the atmosphere. Atop Building 20 (from left): Edward R. Beringer, Robert L. Kyhl, Arthur B. Vane, and Robert H. Dicke (Photo from Five Years at the Radiation Laboratory)
http://rleweb.mit.edu/groups/g-radhst.HTM
15
Why monitor WV?Why monitor WV?
� Water vapor is one of the most significant constituents of the atmosphere since it is the means by which moisture and latent heat are transported to cause "weather".
� Water vapor is also a greenhouse gas that plays a critical role in the global climate system . This role is not restricted to absorbing and radiating energy from the sun, but includes the effect it has on the formation of clouds and aerosols and the chemistry of the lower atmosphere.
� Despite its importance to atmospheric processes over a wide range of spatial and temporal scales, it is one of the least understood and poorly described components of the Earth's atmosphere.
16
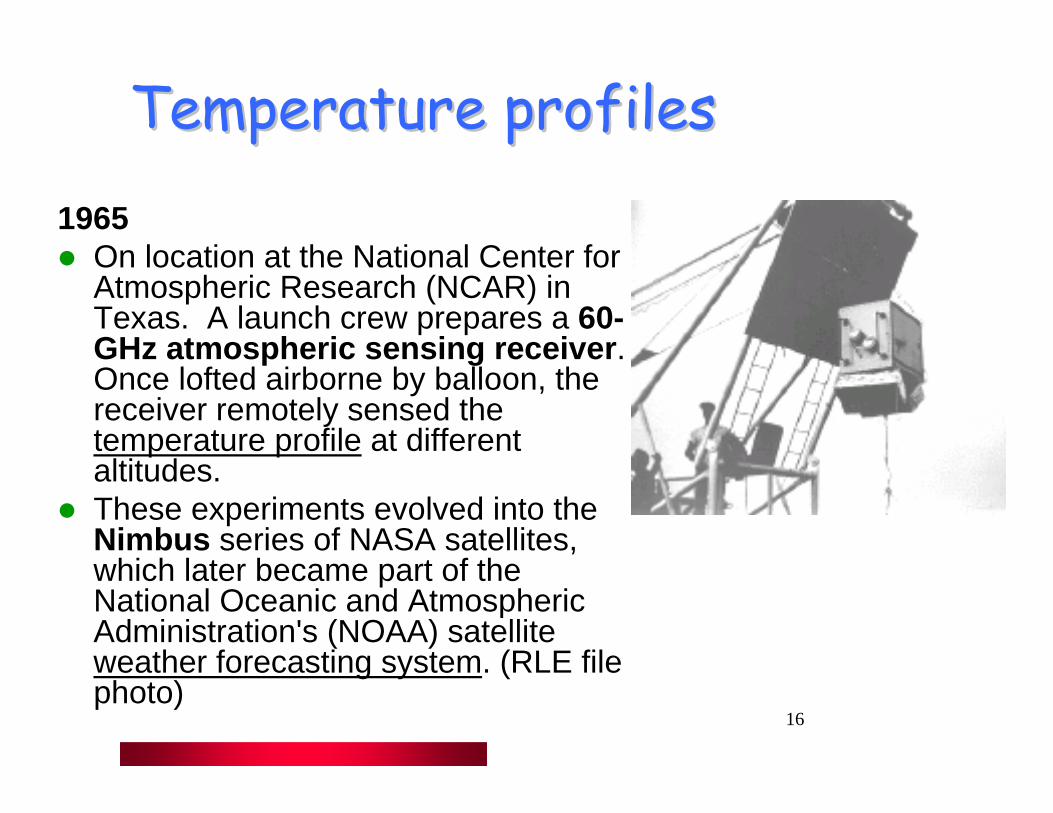
Temperature profilesTemperature profiles
1965 � On location at the National Center for
Atmospheric Research (NCAR) in Texas. A launch crew prepares a 60-GHz atmospheric sensing receiver . Once lofted airborne by balloon, the receiver remotely sensed the temperature profile at different altitudes.
� These experiments evolved into the Nimbus series of NASA satellites, which later became part of the National Oceanic and Atmospheric Administration's (NOAA) satellite weather forecasting system. (RLE file photo)
17
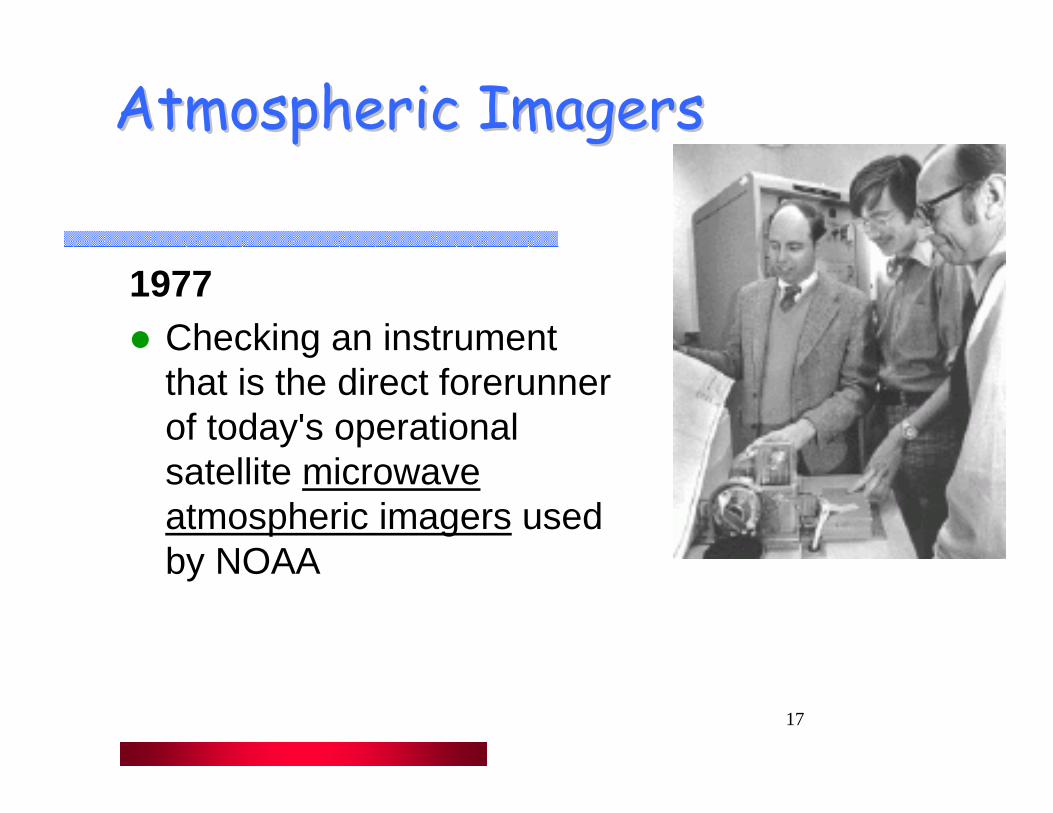
Atmospheric ImagersAtmospheric Imagers
1977 � Checking an instrument
that is the direct forerunner of today's operational satellite microwave atmospheric imagers used by NOAA

18
Modern Microwave Water Radiometer Modern Microwave Water Radiometer
(MWR)(MWR)� provides time-series
measurements of column-integrated amounts of water vapor and liquid water.
The instrument itself is essentially a sensitive microwave receiver.
That is, it is tuned to measure the microwave emissions of the vapor and liquid water molecules in the atmosphere at specific frequencies. (~22 GHz)

19
Truck mounted radiometerTruck mounted radiometer
http://daac.gsfc.nasa.gov/CAMPAIGN_DOCS/SGP97/slmr.html#100
This truck-mountedmicrowaveradiometer system measures surfacesoil moisture at L, S and C bands.

20
Medical ApplicationsMedical Applications
� Microwave Radiometry can be used for the detection of different diseases.
� Clinical trials at Moscow oncological centers, conducted in over 1000 patients have shown that breast cancer detective ability of microwave radiometry is ~90%.
http://www.resltd.ru/eng/company/r_history.php

21
Microwave Temperature Microwave Temperature ProfilerProfiler
is a microwave radiometer that measures thermal emission from oxygen moleculesalong a line of sight that is scanned in elevation angle.
� Knowledge gained in developing this radiometers are useful in developing radiometers for unstart-prevention systems in high-speed (up to mach 2.4) civil-transport aircrafts.

22
Weather ApplicationsWeather Applications

23
NASA NASA TopexTopex/Poseidon and Jason 1/Poseidon and Jason 1
� One of the contributions to the altimetric delay is the wet path delay caused by tropospheric water vapor in the altimetric signal path.
� The wet path delay is the additional time that it takes for the signal to pass through the water vapor.
� If this contribution is not subtracted from the measured altimetric delay, this additional time will introduce error to the measured sea surface height.
Altimeter on board measures sea levelswith accuracy to better than 5 cm!

24
NASA Jason 1NASA Jason 1
� A downward-looking water vapor radiometer onboard the altimeter satellite measures microwave radiation at several different frequencies, 18 GHz, 21 GHz, and 37 GHz.
� These frequencies were chosen because radiances at these frequencies are sensitive to atmospheric water vapor and liquid water.

25
El NiEl Niñño as measured by T/Po as measured by T/P

26
Electromagnetic Plane WavesElectromagnetic Plane Waves--OutlineOutline
http://www.geo.mtu.edu/rs/back/spectrum/
� Maxwell Eqs.� Polarization� Propagation in lossy media� Poynting vector (power)� Incidence (reflection, transmission)� Brewster angle
27
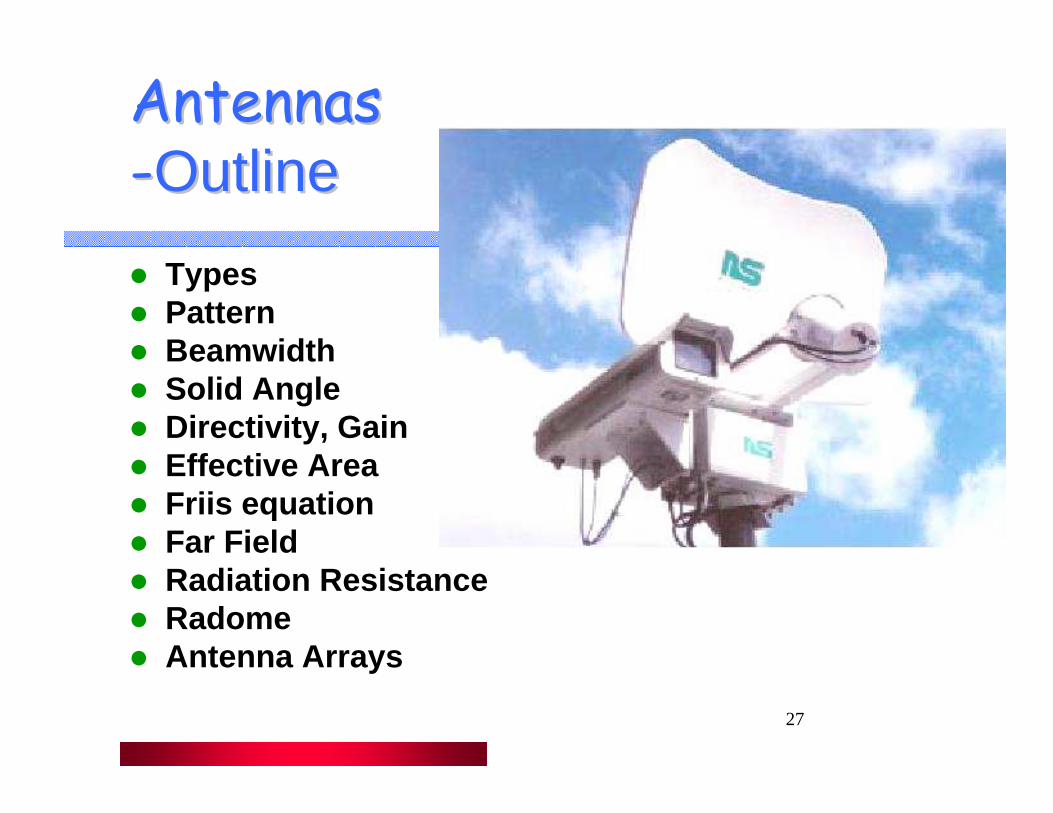
AntennasAntennas--OutlineOutline
� Types� Pattern� Beamwidth� Solid Angle� Directivity, Gain� Effective Area� Friis equation� Far Field� Radiation Resistance� Radome� Antenna Arrays