introduction to methodological issues in ls ethnicity research julian buxton bola akinwale
TRANSCRIPT
Introduction to methodological issues in LS ethnicity research
Julian Buxton
Bola Akinwale

Issues
• Sample sizes• Item imputation in 2001• Change in recorded ethnic group, 1991-2001• Loss to follow-up

Ethnicity in the LS
• 1971 Census: Country of birth, parental COB• 1981 Census: Country of birth• 1991 Census: Ethnicity, Country of birth• 2001 Census: Ethnicity, Country of birth and
religion (voluntary)

Table 1 – Ethnic group at 2001 (all people)
N % N %WHITE
White British 467,822 87.5 45,533,741 87.5White Irish 6,311 1.2 641,804 1.2Other White 12,835 2.4 1,345,321 2.6
MIXEDWhite & Black Caribbean 2,384 0.4 237,420 0.5White & Black African 780 0.1 78,911 0.2White & Asian 1,882 0.4 189,015 0.4Other Mixed 1,496 0.3 155,688 0.3
ASIAN or ASIAN BRITISHIndian 12,487 2.3 1,036,807 2.0Pakistani 8,350 1.6 714,826 1.4Bangladeshi 3,277 0.6 280,830 0.5Other Asian 2,606 0.5 241,274 0.5
BLACK or BLACK BRITISHBlack Caribbean 4,837 0.9 563,843 1.1Black African 3,993 0.7 479,665 0.9Other Black 926 0.2 96,069 0.2CHINESE or OTHER ETHNIC GROUPChinese 2,213 0.4 226,948 0.4Other Ethnic Group 2,174 0.4 219,754 0.4
TOTAL 534,373 100.0 52,041,916 100.0
Source: Table S01.6 2001 LS Sampling Fractions by sex and ethnic group
2001 Census LS traced sample 2001 ONC population

Table 2 – Religion at 2001
N % N %Christian 384,462 71.9 37,338,486 71.7Buddhist 1,486 0.3 144,453 0.3Hindu 6,251 1.2 552,421 1.1Jewish 2,632 0.5 259,927 0.5Muslim 17,586 3.3 1,546,626 3.0Sikh 4,614 0.9 329,358 0.6All other religions 1,501 0.3 150,720 0.3No religion 76,093 14.2 7,709,267 14.8Religion not stated 39,748 7.4 4,010,658 7.7
TOTAL 534,373 100.0 52,041,916 100.0
Source: Table S01.5 2001 LS Sampling fractions by sex and religion
2001 LS traced sample 2001ONC population

Table 3 – Country of birth at 2001
N % N %England 445,054 83.3 43,566,005 83.7Scotland 8,028 1.5 818,966 1.6Northern Ireland 2,221 0.4 222,975 0.4Wales 28,570 5.3 2,798,465 5.4Rest of Europe 15,154 2.8 1,491,939 2.9
AFRICA 7,866 1.5 808,940 1.6ASIA 20,893 3.9 1,594,302 3.1NORTH AMERICA 4,088 0.8 466,995 0.9SOUTH AMERICA 757 0.1 73,785 0.1OCEANIA 1,288 0.2 158,488 0.3Other 454 0.1 46,347 0.1
TOTAL 534,373 100.0 52,047,207 100.0
Source: Table S01.4 2001 LS Sampling fractions by sex and country of birth
2001 LS traced sample 2001 ONC population

Table 4 – Ethnic group at 1991 (all people)1991 LS traced sample
N %White 499,853 93.4Black Caribbean 5,220 1.0Black African 2,001 0.4Black Other 1,723 0.3Indian 11,180 2.1Pakistani 6,104 1.1Bangladeshi 2,385 0.4Chinese 1,641 0.3Other Asian 2,071 0.4Other 2,837 0.5
Total 535,015 100
Source: Table L9101.7 Forward linkage rates between 1991 and 2001 Censuses

Table 5 – Ethnic group at 2001 by sex and age
MALE FEMALE0-15 16-59 60+ 0-15 16-59 60+
White 47,496 138,743 48,576 45,762 143,312 63,083Mixed 1,616 1,434 136 1,584 1,610 162Black Caribbean 474 1,287 476 453 1,658 490Black African 582 1,194 121 502 1,490 104Black Other 179 239 29 157 302 20Indian 1,112 4,063 928 1,097 4,456 832Pakistani 1,191 2,642 467 1,122 2,653 275Bangladeshi 427 943 187 464 1,165 91Chinese 203 755 129 181 817 129Other 517 1,659 218 463 1,748 175
TOTAL 53,797 152,959 51,267 258,023 51,785 159,211 65,361 276,357Source: ONS Longitudinal Study

Table 6 – Ethnic group by NSSEC at 2001 (16-59 year olds)
NSSEC at 2001Higher Lower Prof Intermed Employers Own Lower tech Semi Routine Never worked FTMan & Prof & Higher Tech in small orgs Account & super routine & l-t u/e students
White 27,790 65,075 34,180 7,941 14,964 26,148 42,938 34,146 9,038 19,805Mixed 288 561 323 53 101 187 396 277 273 584Black Caribbean 207 666 433 41 89 227 442 315 207 316Black African 245 454 234 45 58 137 399 196 354 562Black Other 33 110 55 5 18 36 90 60 45 89Indian 986 1,155 794 446 422 486 1,230 1,239 713 1,048Pakistani 280 426 288 224 321 229 657 713 1,531 625Bangladeshi 68 120 88 115 21 119 360 239 742 236Chinese 188 231 99 159 73 54 186 77 102 403Other 359 576 263 133 113 194 462 290 472 545
TOTAL 30,444 69,374 36,757 9,162 16,180 27,817 47,160 37,552 13,477 24,213Source:ONS Longitudinal Study

Table 7 – Ethnic group by Economic activity at 2001
(16-59 year olds)
Economic Activity at 2001Employed Employed Self- Seeking Retired Student Looking Perm sick Other
FT PT employed work after home
White 138,874 39,497 26,102 9,768 4,071 20,265 21,156 14,396 7,896Mixed 1,142 280 199 204 11 613 276 135 183Black Caribbean 1,400 310 149 217 30 335 201 164 137Black African 968 233 134 236 17 610 234 84 168Indian 3,471 860 975 391 89 1,081 743 442 467Pakistani 1,204 404 494 388 30 660 1,219 322 573Bangladeshi 292 273 125 165 11 248 599 108 287Chinese 505 130 236 44 20 408 135 27 67Other 1,250 315 279 182 23 585 411 117 245
TOTAL 149,106 42,302 28,693 11,595 4,302 24,805 24,974 15,795 10,023Source: ONS Longitudinal Study

Table 8 – Ethnic groups by Government Office Regions at 2001 (all people)
Government Office Regions at 2001North North Yorkshire East West East of London South South WalesEast West & Humber Midlands Midlands England East West
White 25,344 65,084 48,421 40,612 48,748 52,757 48,216 78,597 50,334 28,859Mixed 153 607 478 468 693 548 2,157 850 389 199Black Caribbean 11 172 241 220 785 246 2,785 222 130 26Black African 35 139 96 75 108 128 3,060 247 68 37Black Other 4 62 44 30 90 37 574 54 25 6Indian 136 803 617 1,578 2,457 667 4,858 1,094 185 93Pakistani 142 1,447 1,755 339 1,777 501 1,474 747 66 102Bangladeshi 62 336 165 106 399 232 1,677 178 43 79Chinese 42 222 141 160 171 252 706 328 130 62Other 77 306 214 210 396 292 2,467 586 149 83
TOTAL 26,006 69,178 52,172 43,798 55,624 55,660 67,974 82,903 51,519 29,546Source: ONS Longitudinal Study

Table 9 – Ethnic group by religion at 2001 (all)
Religion 2001Christian Buddhist Hindu Jewish Muslim Sikh Other No religion Not stated
White 372,022 545 67 2,549 2,077 72 1,149 72,119 36,372Black 8,727 28 33 12 1,166 4 66 1,469 1,416Asian 1,857 176 6,097 32 13,494 4,495 239 773 1,440Other 1,860 737 55 39 849 43 47 1,734 520
Total 384,466 1,486 6,252 2,632 17,586 4,614 1,501 76,095 39,748Source: ONS Longitudinal Study

Imputation in the 1991 Census
• Edit & Imputation method• Edit matrices• Hotdeck method• Not flagged in the LS• Data imputed for wholly absent households
“Editing and imputing data for the 1991 Census”
I.Mills & A.Teague Pop Trends Summer 1991pp30-37

Imputation in the 2001 Census
• Edit & Donor Imputation System (EDIS)• Edit• Imputation• One Number Census
“Census 2001 Review & Evaluation
Edit and Imputation: Evaluation Report” 2003

Table 10 – Imputation rates in the 2001 Census and the LS
Population Imputation rate Population Imputation rate 000's % %
Age 49,359 0.56 539,879 0.20Sex 49,359 0.44 539,879 0.40Marital status 49,359 0.32 539,879 0.24Student flag 49,359 1.30 539,879 1.24Country of birth 48,848 1.70 538,026 1.65Ethnic group 48,848 2.91 538,026 2.80Health 48,848 1.09 538,026 1.02Carer 48,848 1.42 538,026 1.34Long-term illness 48,848 3.92 538,026 3.83Address one year ago 48,848 4.53 538,026 4.45Educational qualifications 35,367 391,841 6.05Professional qualifications 35,367 391,841 6.05Highest qualification 35,367 6.09 391,841 6.05Activity last week 35,367 3.69 391,841 3.63Employment status 33,686 6.14 369,784 5.72Workplace size 33,686 9.15 369,784 8.85Supervisor 33,686 3.34 369,784 3.25Occupation - currently working 21,741 3.48 244,104 3.29Occupation - ever worked 29,335 13.81 369,784 4.33Economic activity 369,784 9.41Relationship to Person 1 28,065 4.73 304,380 4.62Source:2001 Census data from "Census 2001 Review & Evaluation - Edit and imputation: Evaluation Report"ONS Longitudinal Study
2001 census LS

Table 10A – Imputation rates for Ethnic groups
%ALL PEOPLE 2.8
WHITEWhite British 2.6White Irish 2.9Other White 4.0
MIXEDWhite & Black Caribbean 5.4White & Black African 3.0White & Asian 3.5Other Mixed 3.6
BLACK OR BLACK BRITISHBlack Caribbean 4.4Black African 5.2Other Black 4.0
ASIAN OR ASIAN BRITISHIndian 3.0Pakistani 4.8Bangladeshi 4.1Other Asian 4.1
CHINESE OR OTHER ETHNIC GROUPChinese 2.5Other Ethnic group 2.9
Source: ONS Longitudinal Study

Table 10B - Relationships
IMPUTATION RATESRELATIONSHIPS N %Person relationship 529,874 8.47Family relationship 529,874 10.37Household relationship 529,874 11.39
Source: ONS Longitudinal Study
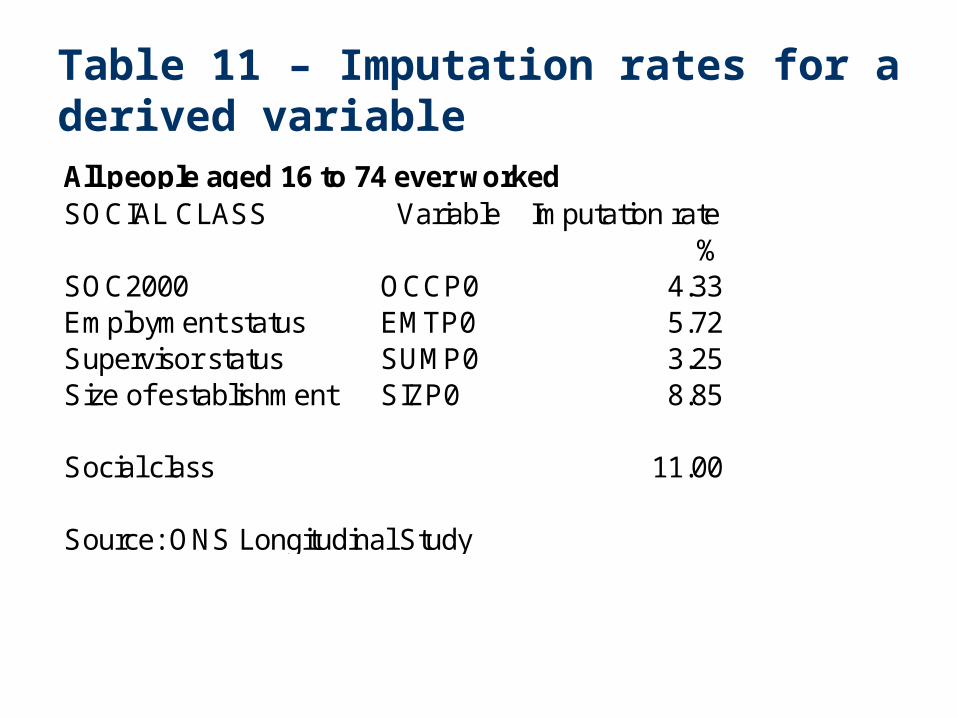
Table 11 – Imputation rates for a derived variableAll people aged 16 to 74 ever workedSOCIAL CLASS Variable Imputation rate
%SOC2000 OCCP0 4.33Employment status EMTP0 5.72Supervisor status SUMP0 3.25Size of establishment SIZP0 8.85
Social class 11.00
Source: ONS Longitudinal Study

Imputation and analysis
• Analysis with imputed values• Analysis without imputed values in the dataset• Analysis without imputed values in the variables
of interest
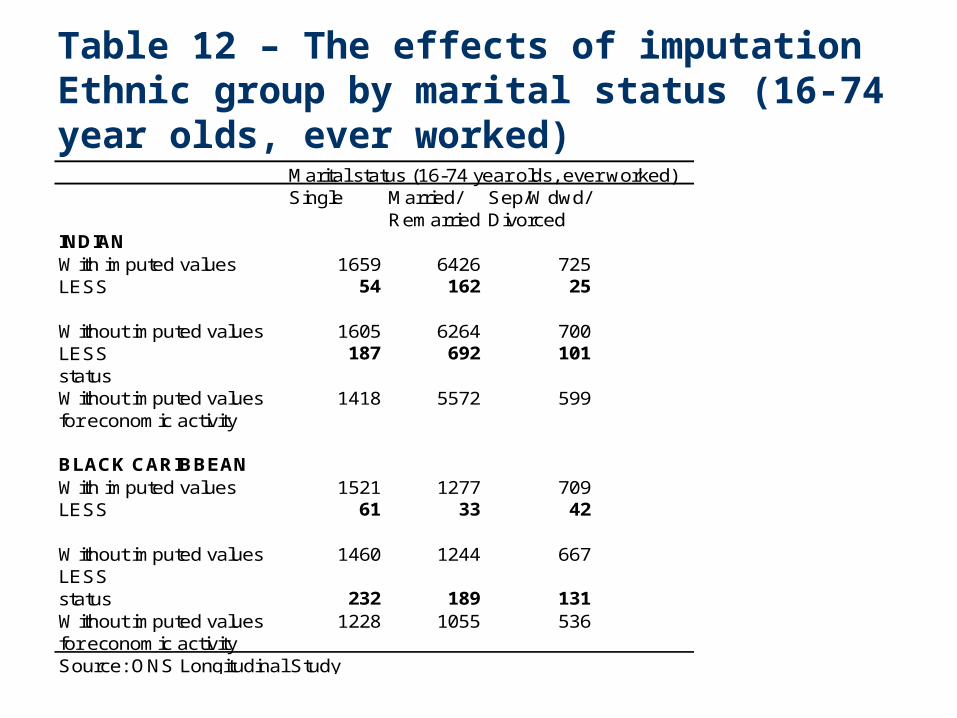
Table 12 – The effects of imputationEthnic group by marital status (16-74 year olds, ever worked)
Marital status (16-74 year olds, ever worked)Single Married/ Sep/Wdwd/
Remarried DivorcedINDIANWith imputed values 1659 6426 725LESS 54 162 25
Without imputed values 1605 6264 700LESS 187 692 101statusWithout imputed values 1418 5572 599for economic activity
BLACK CARIBBEANWith imputed values 1521 1277 709LESS 61 33 42
Without imputed values 1460 1244 667LESSstatus 232 189 131Without imputed values 1228 1055 536for economic activitySource: ONS Longitudinal Study

Change in ethnic group
• Consideration of change in ethnic group is important for understanding the composition of groups over time
• Almost 1 in 4 people recorded as Black African or Black Caribbean in the 1991 Census reported a different ethnicity in 2001, compared with less than 1 in 10 South Asian and Chinese people, and less than 1 in 200 White people
• Change in individuals’ reported ethnic group between the 1991 and 2001 Censuses reflected the introduction of new response categories in 2001, especially for mixed ethnicities
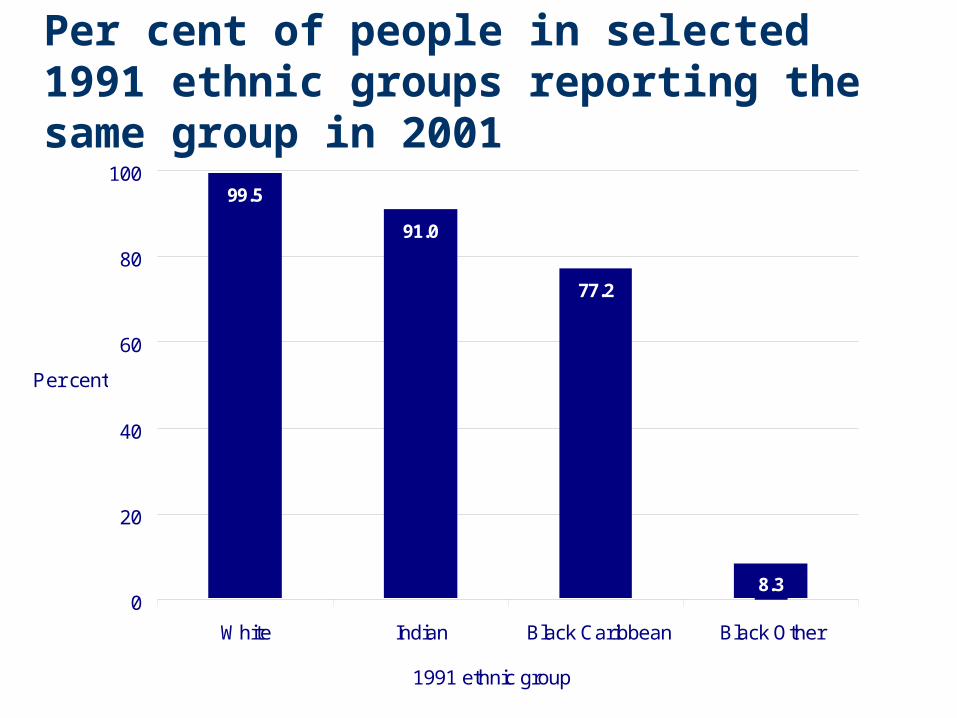
Per cent of people in selected 1991 ethnic groups reporting the same group in 2001
99.5
91.0
77.2
8.30
20
40
60
80
100
White Indian Black Caribbean Black Other
1991 ethnic group
Per cent

2001 ethnicity reported by people in the 1991 Other Black group
White 15%
Other Mixed5%
Other ethnic groups
7%
Other Black8%
Black Caribbean21%
Black African3%
Mixed White & Black Caribbean
33%
Mixed White & Black African
6%
Mixed White & Asian
2%

Loss to follow-up
• Loss between two censuses without valid exit (death or embarkation)
• Caused by:– Unobserved embarkation– Census underenumeration– Linkage failure (mismatched records)
• Higher rates of loss to follow-up among minority ethnic groups
– 16 per cent of 1991 Black Africans expected in 2001 were not found

Follow-up of the 1991 traced LS sample by ethnic group
71.4
63.7
67.3
69.4
71.0
77.3
71.7
59.3
65.0
78.7
3.1
6.1
4.3
2.1
3.1
4.1
3.5
6.2
11.7
25.4
30.2
28.4
28.5
25.9
18.6
26.8
37.2
28.9
9.7
1.6
0 10 20 30 40 50 60 70 80 90 100
Other
Other Asian
Chinese
Bangladeshi
Pakistani
Indian
Black Other
Black African
Black Caribbean
White
Present in 01 Died or embarked 91-01 Not present in 01

Summary
• Small sample sizes may constrain ethnic group analysis
• Need to consider how to treat 2001 item imputation
• Change in ethnic group between 1991 and 2001 should also be considered
• Loss to follow-up is higher among minority ethnic groups
– Potential for bias– Impact on sample sizes when measuring transitions