introduction to io and wiod - europa
TRANSCRIPT

OverviewInput-Output and National Accounts
World Input-Output DatabaseFundamentals
Introduction to IO and WIODRobert Stehrer
The Vienna Institute for International Economic Studies (wiiw)
Version: 2012-12-09
December 10-11, 2012 - CompNet workshop
ECB Frankfurt, Germany.
Robert Stehrer, wiiw CompNet Frankfurt
OverviewInput-Output and National Accounts
World Input-Output DatabaseFundamentals
Overview
• Input-output table and national accounts in single economy
• Input-output table and national accounts in international economy
• World Input-Output Database (WIOD)
• Fundamentals: Leontief inverse and final demand multipliers
Robert Stehrer, wiiw CompNet Frankfurt
OverviewInput-Output and National Accounts
World Input-Output DatabaseFundamentals
Input-Output and National Accounts
Robert Stehrer, wiiw CompNet Frankfurt
OverviewInput-Output and National Accounts
World Input-Output DatabaseFundamentals
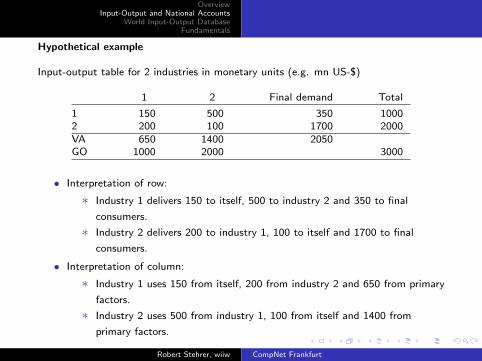
Hypothetical example
Input-output table for 2 industries in monetary units (e.g. mn US-$)
1 2 Final demand Total
1 150 500 350 10002 200 100 1700 2000VA 650 1400 2050GO 1000 2000 3000
• Interpretation of row:
∗ Industry 1 delivers 150 to itself, 500 to industry 2 and 350 to final
consumers.
∗ Industry 2 delivers 200 to industry 1, 100 to itself and 1700 to final
consumers.
• Interpretation of column:
∗ Industry 1 uses 150 from itself, 200 from industry 2 and 650 from primary
factors.
∗ Industry 2 uses 500 from industry 1, 100 from itself and 1400 from
primary factors.
Robert Stehrer, wiiw CompNet Frankfurt
OverviewInput-Output and National Accounts
World Input-Output DatabaseFundamentals
• Value added
∗ Payments to primary factors (labor capital) or income of factors (wages,
profits)
∗ VA1 + VA2 = GDP (=sum of factor incomes)
• Final demand
∗ Consumption by households, Government expenditures, Inventories
∗ f1 + f2 = GDP (=sum of final sales)
Robert Stehrer, wiiw CompNet Frankfurt
OverviewInput-Output and National Accounts
World Input-Output DatabaseFundamentals
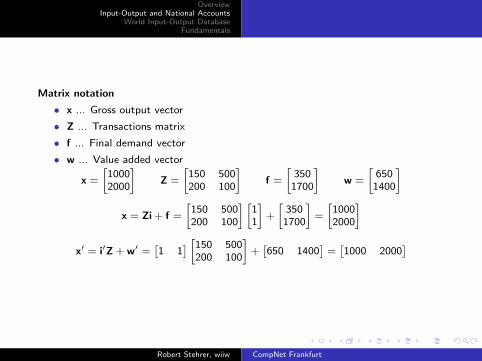
Matrix notation
• x ... Gross output vector
• Z ... Transactions matrix
• f ... Final demand vector
• w ... Value added vector
x =
[10002000
]Z =
[150 500200 100
]f =
[350
1700
]w =
[650
1400
]
x = Zi + f =
[150 500200 100
] [11
]+
[350
1700
]=
[10002000
]
x′ = i′Z + w′ =[1 1
] [150 500200 100
]+[650 1400
]=[1000 2000
]
Robert Stehrer, wiiw CompNet Frankfurt

OverviewInput-Output and National Accounts
World Input-Output DatabaseFundamentals
Notation
• n sectors
• zij ... sector i sells to sector j (interindustry sales)
• fi ... sector i sells to final user
A row in an IO table is
xi = zi1 + · · ·+ zij + · · ·+ zin + fi =n∑
j=1
zij + fi
Robert Stehrer, wiiw CompNet Frankfurt
OverviewInput-Output and National Accounts
World Input-Output DatabaseFundamentals
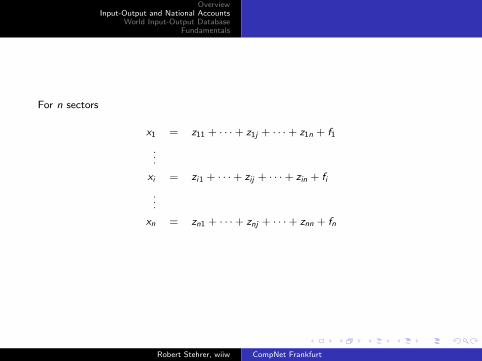
For n sectors
x1 = z11 + · · ·+ z1j + · · ·+ z1n + f1
...
xi = zi1 + · · ·+ zij + · · ·+ zin + fi
...
xn = zn1 + · · ·+ znj + · · ·+ znn + fn
Robert Stehrer, wiiw CompNet Frankfurt
OverviewInput-Output and National Accounts
World Input-Output DatabaseFundamentals
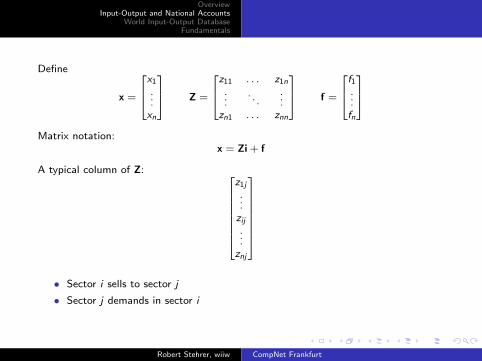
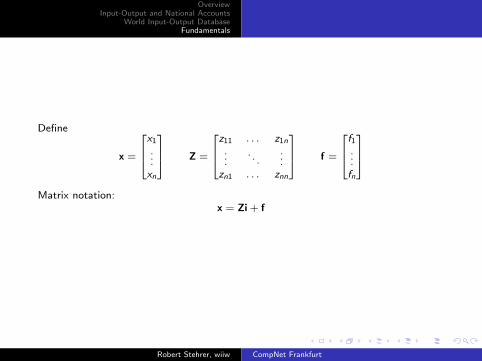
Define
x =
x1
...xn
Z =
z11 . . . z1n
.... . .
...zn1 . . . znn
f =
f1...fn
Matrix notation:
x = Zi + f
A typical column of Z:
z1j
...zij...znj
• Sector i sells to sector j
• Sector j demands in sector i
Robert Stehrer, wiiw CompNet Frankfurt
OverviewInput-Output and National Accounts
World Input-Output DatabaseFundamentals
Multi-national models (3 countries, 2 industries)
Robert Stehrer, wiiw CompNet Frankfurt

OverviewInput-Output and National Accounts
World Input-Output DatabaseFundamentals
Hypothetical example
Input-output table for 2 industries and 3 countries in monetary units (e.g. mn US-$)
Country 1 Country 2 Country 3
1 2 1 2 1 2 FD1 FD2 FD3 Total
1 3 0 1.5 0 0.25 0 2.25 0 0 72 0 2 0 1 0 0.5 1.5 0 0 51 0 0 1.5 0 1.25 0 0 4.25 0 72 0 0 0 1 0 0.5 0 3.5 0 51 0 0 0 0 1.5 0 0 1.5 4 72 0 0 0 0 0 1 0 1 3 5VA 4 3 4 3 4 3GO 7 5 7 5 7 5
• Interpretation of row:
∗ Country 1, industry 1 delivers 3 to itself
∗ Country 1, industry 1 delivers 1.5 to country 1, industry 2
∗ Country 1, industry 1 delivers 2.25 to its country 1 final consumers
• Interpretation of column:
∗ Country 3, industry 2 uses 0.5 from country 1, industry 2
∗ Country 3, industry 2 uses 1 from itself
∗ Country 3, industry 2 uses 3 from its own primary inputs (payment to factors)
Robert Stehrer, wiiw CompNet Frankfurt
OverviewInput-Output and National Accounts
World Input-Output DatabaseFundamentals
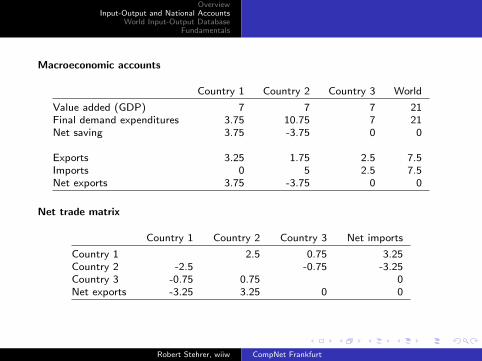
Macroeconomic accounts
Country 1 Country 2 Country 3 World
Value added (GDP) 7 7 7 21Final demand expenditures 3.75 10.75 7 21Net saving 3.75 -3.75 0 0
Exports 3.25 1.75 2.5 7.5Imports 0 5 2.5 7.5Net exports 3.75 -3.75 0 0
Net trade matrix
Country 1 Country 2 Country 3 Net imports
Country 1 2.5 0.75 3.25Country 2 -2.5 -0.75 -3.25Country 3 -0.75 0.75 0Net exports -3.25 3.25 0 0
Robert Stehrer, wiiw CompNet Frankfurt
OverviewInput-Output and National Accounts
World Input-Output DatabaseFundamentals
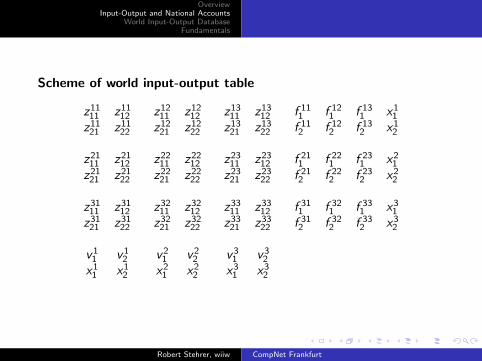
Scheme of world input-output table
z1111 z11
12 z1211 z12
12 z1311 z13
12 f 111 f 12
1 f 131 x1
1
z1121 z11
22 z1221 z12
22 z1321 z13
22 f 112 f 12
2 f 132 x1
2
z2111 z21
12 z2211 z22
12 z2311 z23
12 f 211 f 22
1 f 231 x2
1
z2121 z21
22 z2221 z22
22 z2321 z23
22 f 212 f 22
2 f 232 x2
2
z3111 z31
12 z3211 z32
12 z3311 z33
12 f 311 f 32
1 f 331 x3
1
z3121 z31
22 z3221 z32
22 z3321 z33
22 f 312 f 32
2 f 332 x3
2
v11 v1
2 v21 v2
2 v31 v3
2
x11 x1
2 x21 x2
2 x31 x3
2
Robert Stehrer, wiiw CompNet Frankfurt

OverviewInput-Output and National Accounts
World Input-Output DatabaseFundamentals
Scheme of world input-output table in (partitioned) matrixnotation
Z =
Z11 . . . Z1,41
.... . .
...Z41,1 . . . Z41,41
f1,1 + · · · + f1,41
...f41,1 + · · · + f41,41
= f
w′ =[(w1)′ . . . (w41)′
]x′ =
[(x1)′ . . . (x41)′
]
Robert Stehrer, wiiw CompNet Frankfurt
OverviewInput-Output and National Accounts
World Input-Output DatabaseFundamentals
World Input-Output Database: Construction
Robert Stehrer, wiiw CompNet Frankfurt
OverviewInput-Output and National Accounts
World Input-Output DatabaseFundamentals
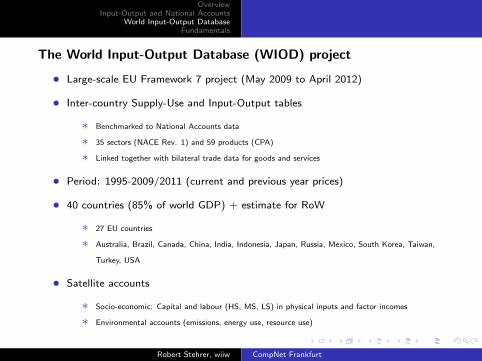
The World Input-Output Database (WIOD) project
• Large-scale EU Framework 7 project (May 2009 to April 2012)
• Inter-country Supply-Use and Input-Output tables
∗ Benchmarked to National Accounts data
∗ 35 sectors (NACE Rev. 1) and 59 products (CPA)
∗ Linked together with bilateral trade data for goods and services
• Period: 1995-2009/2011 (current and previous year prices)
• 40 countries (85% of world GDP) + estimate for RoW
∗ 27 EU countries
∗ Australia, Brazil, Canada, China, India, Indonesia, Japan, Russia, Mexico, South Korea, Taiwan,
Turkey, USA
• Satellite accounts
∗ Socio-economic: Capital and labour (HS, MS, LS) in physical inputs and factor incomes
∗ Environmental accounts (emissions, energy use, resource use)
Robert Stehrer, wiiw CompNet Frankfurt
OverviewInput-Output and National Accounts
World Input-Output DatabaseFundamentals
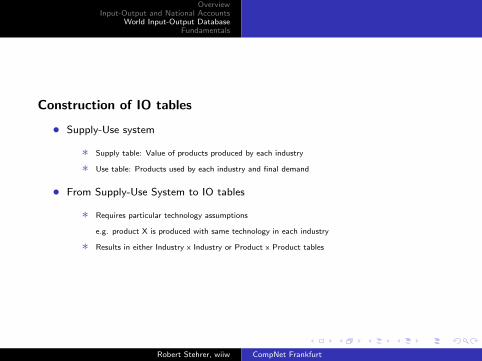
Construction of IO tables
• Supply-Use system
∗ Supply table: Value of products produced by each industry
∗ Use table: Products used by each industry and final demand
• From Supply-Use System to IO tables
∗ Requires particular technology assumptions
e.g. product X is produced with same technology in each industry
∗ Results in either Industry x Industry or Product x Product tables
Robert Stehrer, wiiw CompNet Frankfurt

OverviewInput-Output and National Accounts
World Input-Output DatabaseFundamentals
Supply and Use System: 2 industries, 3 products, in monetary units (e.g. mn US-$)
USE table (in purchaser prices)
Industry1 2 Final demand Exports Total
A 2 1 2 1 6B 1 1 2 1 5C 2 3 3 1 9VA 4 6GO 9 11
SUPPLY table (in basic prices with transformation into purchaser prices)
Industry1 2 Imports Margins Total
A 5 0 1 1 6B 4 6 1 1 5C 0 5 2 2 9
GO 9 11
Robert Stehrer, wiiw CompNet Frankfurt
OverviewInput-Output and National Accounts
World Input-Output DatabaseFundamentals
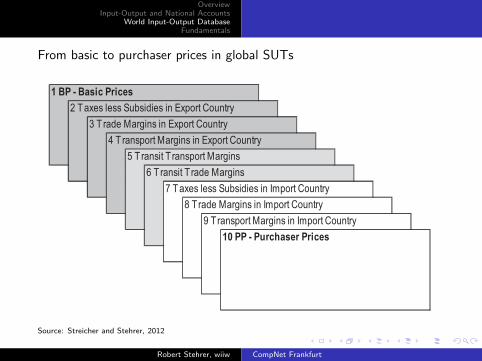
From basic to purchaser prices in global SUTs
�
����������������
���������������� ��������������������
��� �� ��������������������������
��� ���������������������������������
��� �������� ����������������
��� �������� �� ���������
���������������� ��������������������
����� ��������������������������
�����������������������������������
��������� ���������
Source: Streicher and Stehrer, 2012
Robert Stehrer, wiiw CompNet Frankfurt
OverviewInput-Output and National Accounts
World Input-Output DatabaseFundamentals
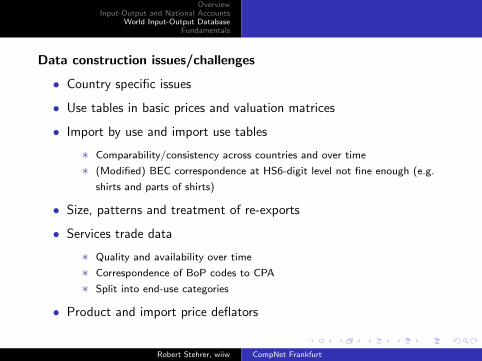
Data construction issues/challenges
• Country specific issues
• Use tables in basic prices and valuation matrices
• Import by use and import use tables
∗ Comparability/consistency across countries and over time
∗ (Modified) BEC correspondence at HS6-digit level not fine enough (e.g.
shirts and parts of shirts)
• Size, patterns and treatment of re-exports
• Services trade data
∗ Quality and availability over time
∗ Correspondence of BoP codes to CPA
∗ Split into end-use categories
• Product and import price deflators
Robert Stehrer, wiiw CompNet Frankfurt
OverviewInput-Output and National Accounts
World Input-Output DatabaseFundamentals
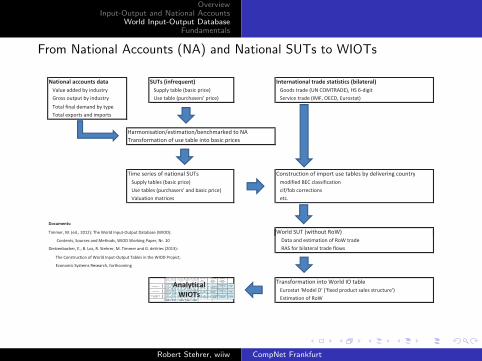
From National Accounts (NA) and National SUTs to WIOTs
������������������� ��������������� �����������������������������������������
��������������������� � ��������� ���������������� ��������� ������������������ �!��"#�$
����������� �� ������� � ������� ����������%�����&������ ������'��� ������(�) ����� ������ � �
����� ���*������+������ ��
����� ����,��� ������+��� �
!��+���� ��-�� +� ��-����%+��.��� ����
�����*��+� ����*����� ������ ������������
�+���������*��� ��������� ���� ��� ����*�+��� ����� �����������'���$����� �
��������� ����������������� ���+��*���/��������*�� ��
������� �����������%�����&��������������� ����*-*��������� ���
�������� ���+� ���� ���� �0
��������
1����������2 %�� ���1��++�� ��0����0 �3453�6��%��1�����(��� #�� �� ��� �������1(���6� 1����������2 %�� ���1�
����������� �� � ��������������� %��� �1(���1��.�$�7���� ���0�54 ������ �������� +� ����*���1� ����
�� 8�����%�� ��0 �/0�9�� ��0�� �%��� ��0��++��������0���������345:�6 ��������*������ ����� �����*��2�
��������%������ ��� ����*�1�����(��� #�� �� ���������� %��1(���7��;��
������������+���� �+���������% �*�� %��+�$
�����*��+� ���� ��1�����(�� ����
�������� � �&�������&��&*,��������� �������� ��� ���&�
����� +� ����*���1
���� ����1(���
Final
domestic
use
Final
domestic
use
Final
domestic
use
Intermediate
use
Intermediate
use
Intermediate
use
Country B
Final use of
domestic
output
Rest of
World
Final use by
RoW of
exports from
A
Final use by
RoW of
exports from
B
Output in RoW
Final use by
B of exports
from A
Final use of
domestic
output
Final use by
B of exports
from RoW
Country ACountry B
Industry
Intermediate
use by B of
imports from
RoW
Rest of World
Industry
Intermediate
use by RoW of
imports from
A
Intermediate
use by RoW of
imports from
B
Intermediate
use of
domestic
output
Country B
Rest of World
(RoW)
Industry
Industry Intermediate
use of
domestic
output
Industry
Country AOutput
in A
Final use of
domestic
output
Total
Industry
Final use by
A of exports
from B
Final use by
A of exports
from RoW
Intermediate
use by B of
imports from
A
Country A
Output in A
Value added
Output
in B
Output
in RoW
Intermediate
use by A of
imports from
B
Intermediate
use by A of
imports from
RoW
Intermediate
use of
domestic
output
Value added
Output in B
Value added
���������
�����
Robert Stehrer, wiiw CompNet Frankfurt
OverviewInput-Output and National Accounts
World Input-Output DatabaseFundamentals
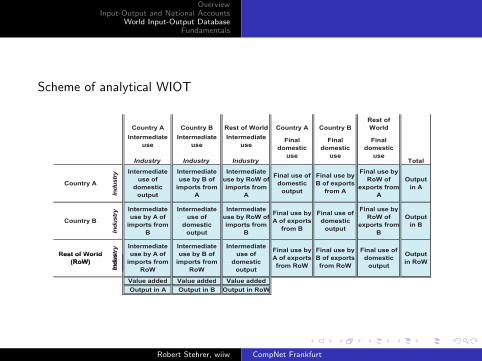
Scheme of analytical WIOT
Final
domestic
use
Final
domestic
use
Final
domestic
use
Intermediate
use
Intermediate
use
Intermediate
use
Country B
Final use of
domestic
output
Rest of
World
Final use by
RoW of
exports from
A
Final use by
RoW of
exports from
B
Final use by
B of exports
from A
Final use of
domestic
output
Final use by
B of exports
from RoW
Country ACountry B
Industry
Intermediate
use by B of
imports from
RoW
Rest of World
Industry
Intermediate
use by RoW of
imports from
A
Intermediate
use by RoW of
imports from
B
Intermediate
use of
domestic
output
Country B
Rest of World
(RoW)
Industry
Industry Intermediate
use of
domestic
output
Industry
Country AOutput
in A
Final use of
domestic
output
Total
Industry
Final use by
A of exports
from B
Final use by
A of exports
from RoW
Intermediate
use by B of
imports from
A
Country A
Output
in B
Output
in RoW
Intermediate
use by A of
imports from
B
Intermediate
use by A of
imports from
RoW
Intermediate
use of
domestic
output
domestic
output
Output in RoW
B of exports
from RoW
use by B of
imports from
RoW
use of
domestic
output
Rest of World
(RoW)
Industry
A of exports
from RoW
Output in A
Value added
Output
in RoW
use by A of
imports from
RoW
Value added
Output in B
Value added
Robert Stehrer, wiiw CompNet Frankfurt
OverviewInput-Output and National Accounts
World Input-Output DatabaseFundamentals
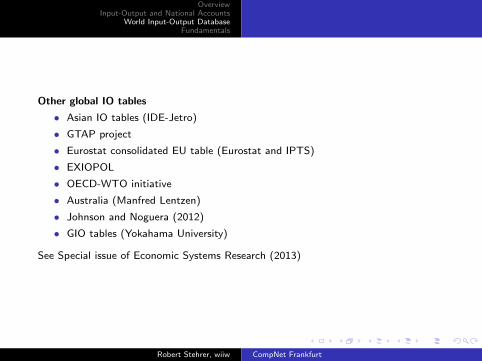
Other global IO tables
• Asian IO tables (IDE-Jetro)
• GTAP project
• Eurostat consolidated EU table (Eurostat and IPTS)
• EXIOPOL
• OECD-WTO initiative
• Australia (Manfred Lentzen)
• Johnson and Noguera (2012)
• GIO tables (Yokahama University)
See Special issue of Economic Systems Research (2013)
Robert Stehrer, wiiw CompNet Frankfurt
OverviewInput-Output and National Accounts
World Input-Output DatabaseFundamentals
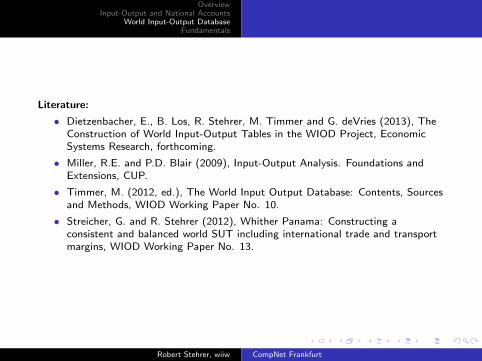
Literature:
• Dietzenbacher, E., B. Los, R. Stehrer, M. Timmer and G. deVries (2013), TheConstruction of World Input-Output Tables in the WIOD Project, EconomicSystems Research, forthcoming.
• Miller, R.E. and P.D. Blair (2009), Input-Output Analysis. Foundations andExtensions, CUP.
• Timmer, M. (2012, ed.), The World Input Output Database: Contents, Sourcesand Methods, WIOD Working Paper No. 10.
• Streicher, G. and R. Stehrer (2012), Whither Panama: Constructing aconsistent and balanced world SUT including international trade and transportmargins, WIOD Working Paper No. 13.
Robert Stehrer, wiiw CompNet Frankfurt
OverviewInput-Output and National Accounts
World Input-Output DatabaseFundamentals
Fundamentals: Leontief matrix and final demand multipliers
Robert Stehrer, wiiw CompNet Frankfurt
OverviewInput-Output and National Accounts
World Input-Output DatabaseFundamentals
Define
x =
x1
...xn
Z =
z11 . . . z1n
.... . .
...zn1 . . . znn
f =
f1...fn
Matrix notation:
x = Zi + f
Robert Stehrer, wiiw CompNet Frankfurt
OverviewInput-Output and National Accounts
World Input-Output DatabaseFundamentals
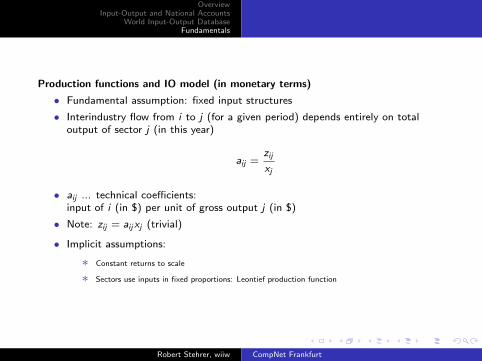
Production functions and IO model (in monetary terms)
• Fundamental assumption: fixed input structures
• Interindustry flow from i to j (for a given period) depends entirely on totaloutput of sector j (in this year)
aij =zij
xj
• aij ... technical coefficients:input of i (in $) per unit of gross output j (in $)
• Note: zij = aijxj (trivial)
• Implicit assumptions:
∗ Constant returns to scale
∗ Sectors use inputs in fixed proportions: Leontief production function
Robert Stehrer, wiiw CompNet Frankfurt
OverviewInput-Output and National Accounts
World Input-Output DatabaseFundamentals
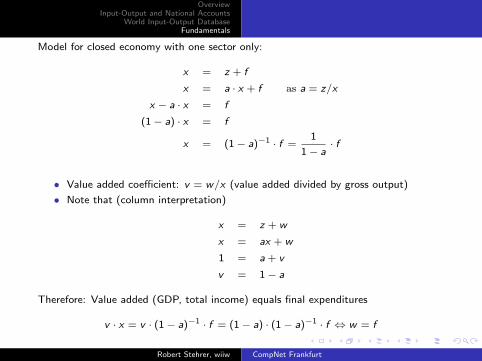
Model for closed economy with one sector only:
x = z + f
x = a · x + f as a = z/x
x − a · x = f
(1− a) · x = f
x = (1− a)−1 · f =1
1− a· f
• Value added coefficient: v = w/x (value added divided by gross output)
• Note that (column interpretation)
x = z + w
x = ax + w
1 = a + v
v = 1− a
Therefore: Value added (GDP, total income) equals final expenditures
v · x = v · (1− a)−1 · f = (1− a) · (1− a)−1 · f ⇔ w = f
Robert Stehrer, wiiw CompNet Frankfurt
OverviewInput-Output and National Accounts
World Input-Output DatabaseFundamentals
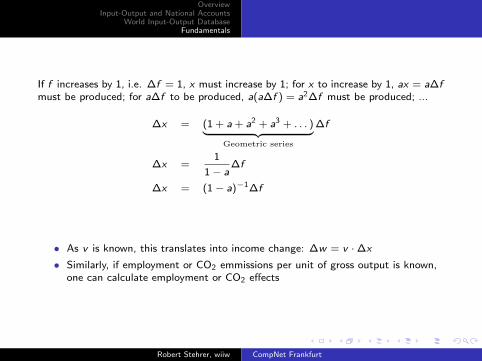
If f increases by 1, i.e. ∆f = 1, x must increase by 1; for x to increase by 1, ax = a∆fmust be produced; for a∆f to be produced, a(a∆f ) = a2∆f must be produced; ...
∆x = (1 + a + a2 + a3 + . . . )︸ ︷︷ ︸Geometric series
∆f
∆x =1
1− a∆f
∆x = (1− a)−1∆f
• As v is known, this translates into income change: ∆w = v ·∆x
• Similarly, if employment or CO2 emmissions per unit of gross output is known,one can calculate employment or CO2 effects
Robert Stehrer, wiiw CompNet Frankfurt
OverviewInput-Output and National Accounts
World Input-Output DatabaseFundamentals
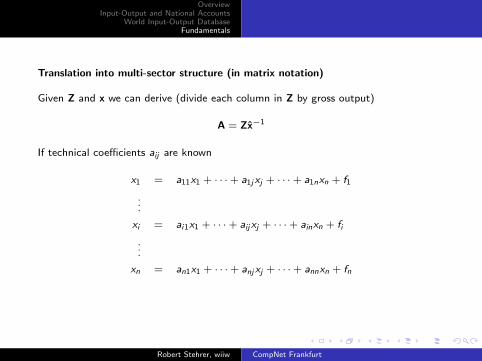
Translation into multi-sector structure (in matrix notation)
Given Z and x we can derive (divide each column in Z by gross output)
A = Zx̂−1
If technical coefficients aij are known
x1 = a11x1 + · · ·+ a1jxj + · · ·+ a1nxn + f1
...
xi = ai1x1 + · · ·+ aijxj + · · ·+ ainxn + fi
...
xn = an1x1 + · · ·+ anjxj + · · ·+ annxn + fn
Robert Stehrer, wiiw CompNet Frankfurt
OverviewInput-Output and National Accounts
World Input-Output DatabaseFundamentals
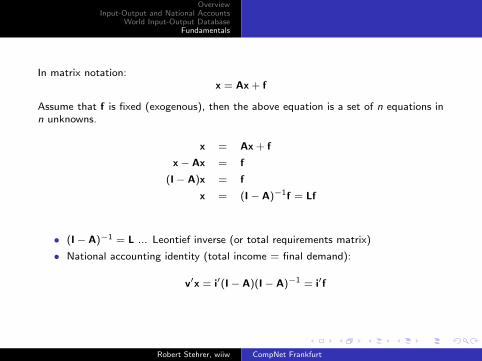
In matrix notation:x = Ax + f
Assume that f is fixed (exogenous), then the above equation is a set of n equations inn unknowns.
x = Ax + f
x− Ax = f
(I− A)x = f
x = (I− A)−1f = Lf
• (I− A)−1 = L ... Leontief inverse (or total requirements matrix)
• National accounting identity (total income = final demand):
v′x = i′(I− A)(I− A)−1 = i′f
Robert Stehrer, wiiw CompNet Frankfurt

OverviewInput-Output and National Accounts
World Input-Output DatabaseFundamentals
The calculations
A = Zx̂−1 =
[150 500200 100
] [1000 0
0 2000
]−1
=
[150 500200 100
] [ 11000
0
0 12000
]=
[0.15 0.250.20 0.05
]
L = (I− A)−1 =
([1 00 1
]−[
0.15 0.250.20 0.05
])−1
=
[1− 0.15 −0.50−0.20 1− 0.10
]−1
=
[1.2541 0.33000.2640 1.1221
]
x = Lf =
[1.2541 0.33000.2640 1.1221
] [350
1700
]=
[10002000
]
Robert Stehrer, wiiw CompNet Frankfurt
OverviewInput-Output and National Accounts
World Input-Output DatabaseFundamentals
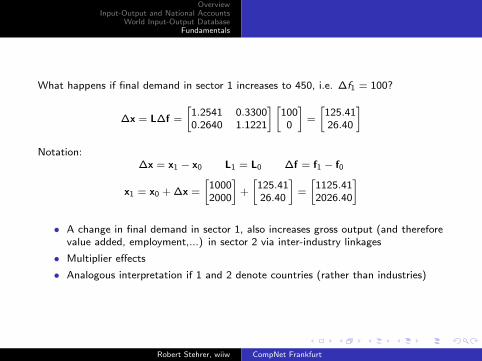
What happens if final demand in sector 1 increases to 450, i.e. ∆f1 = 100?
∆x = L∆f =
[1.2541 0.33000.2640 1.1221
] [100
0
]=
[125.4126.40
]Notation:
∆x = x1 − x0 L1 = L0 ∆f = f1 − f0
x1 = x0 + ∆x =
[10002000
]+
[125.4126.40
]=
[1125.412026.40
]
• A change in final demand in sector 1, also increases gross output (and thereforevalue added, employment,...) in sector 2 via inter-industry linkages
• Multiplier effects
• Analogous interpretation if 1 and 2 denote countries (rather than industries)
Robert Stehrer, wiiw CompNet Frankfurt
OverviewInput-Output and National Accounts
World Input-Output DatabaseFundamentals
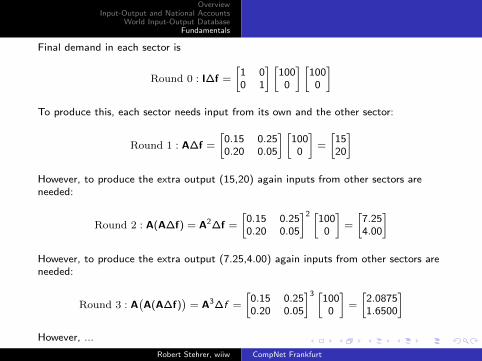
Final demand in each sector is
Round 0 : I∆f =
[1 00 1
] [100
0
] [100
0
]To produce this, each sector needs input from its own and the other sector:
Round 1 : A∆f =
[0.15 0.250.20 0.05
] [100
0
]=
[1520
]However, to produce the extra output (15,20) again inputs from other sectors areneeded:
Round 2 : A(A∆f) = A2∆f =
[0.15 0.250.20 0.05
]2 [100
0
]=
[7.254.00
]However, to produce the extra output (7.25,4.00) again inputs from other sectors areneeded:
Round 3 : A(A(A∆f)
)= A3∆f =
[0.15 0.250.20 0.05
]3 [100
0
]=
[2.08751.6500
]However, ...
Robert Stehrer, wiiw CompNet Frankfurt
OverviewInput-Output and National Accounts
World Input-Output DatabaseFundamentals
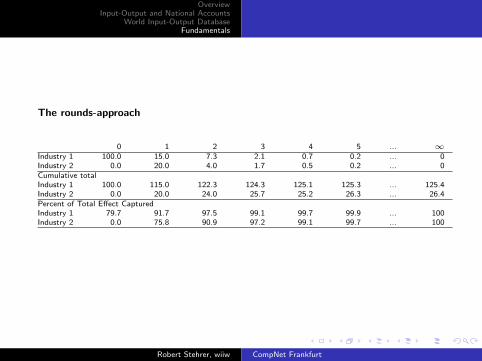
The rounds-approach
0 1 2 3 4 5 ... ∞Industry 1 100.0 15.0 7.3 2.1 0.7 0.2 ... 0Industry 2 0.0 20.0 4.0 1.7 0.5 0.2 ... 0Cumulative totalIndustry 1 100.0 115.0 122.3 124.3 125.1 125.3 ... 125.4Industry 2 0.0 20.0 24.0 25.7 25.2 26.3 ... 26.4Percent of Total Effect CapturedIndustry 1 79.7 91.7 97.5 99.1 99.7 99.9 ... 100Industry 2 0.0 75.8 90.9 97.2 99.1 99.7 ... 100
Robert Stehrer, wiiw CompNet Frankfurt

OverviewInput-Output and National Accounts
World Input-Output DatabaseFundamentals
The power series approximation of the Leontief inverse
Remember:
1 + a + a2 + a3 + · · · =1
1− a= (1− a)−1 for 0 < a < 1
This suggestsL = (I− A)−1 = I + A + A2 + A3 + . . .
under certain conditions:
• A ≥ 0 (coefficients matrix contains only non-negative terms)
• The system produces more output than it requires inputs N(A) < 1
• |I− A| > 0
• More general: Hawkins-Simon conditions
Robert Stehrer, wiiw CompNet Frankfurt
OverviewInput-Output and National Accounts
World Input-Output DatabaseFundamentals
Literature:
• Miller, R.E. and P.D. Blair (2009), Input-Output Analysis. Foundations andExtensions, CUP.
Robert Stehrer, wiiw CompNet Frankfurt