introduction to improving energy efficiency in chiller...
TRANSCRIPT

©© Hudson TechnologiesHudson Technologies1
Introduction to Improving Energy Efficiency in Chiller Systems
Riyaz Papar, PE, CEMDirector, Global Energy ServicesHudson Technologies Company
November 2013

©© Hudson TechnologiesHudson Technologies2
Acknowledgments
Texas Industries of the Future (TXIOF) Texas State Energy Conservation Office (SECO)
Energy Industries in Ohio
Joe Longo & Derrick Shoemake, Hudson Technologies

©© Hudson TechnologiesHudson Technologies3
Webinar Agenda
The Systems Approach
Fundamentals of Refrigeration
Chiller Plant Actual Operating Performance
Predictive and Preventive Maintenance BestPractices
Energy Conservation Measures (ECMs)
Conclusions

©© Hudson TechnologiesHudson Technologies4
Chiller System Energy Cost?Chiller System Energy Cost?
1,000 Refrigeration Tons chiller plant load Chiller System performance = 0.75 kW/ton Bundled power cost = $0.085/kWh
-
100,000
200,000
300,000
400,000
500,000
600,000
4 months 6-8 months All year round
Operating hours
Ope
ratin
g C
ost (
$)

©© Hudson TechnologiesHudson Technologies5
The Systems Approach

©© Hudson TechnologiesHudson Technologies6
The Systems Approach
Establish current system conditions, operating parameters, and system energy use
Investigate how the total system presently operates
Identify potential areas where system operation can be improved
Analyze the impacts of potential improvements to the plant system
Implement system improvements that meet plant operational and financial criteria
Continue to monitor overall system performance
©© Hudson TechnologiesHudson Technologies7
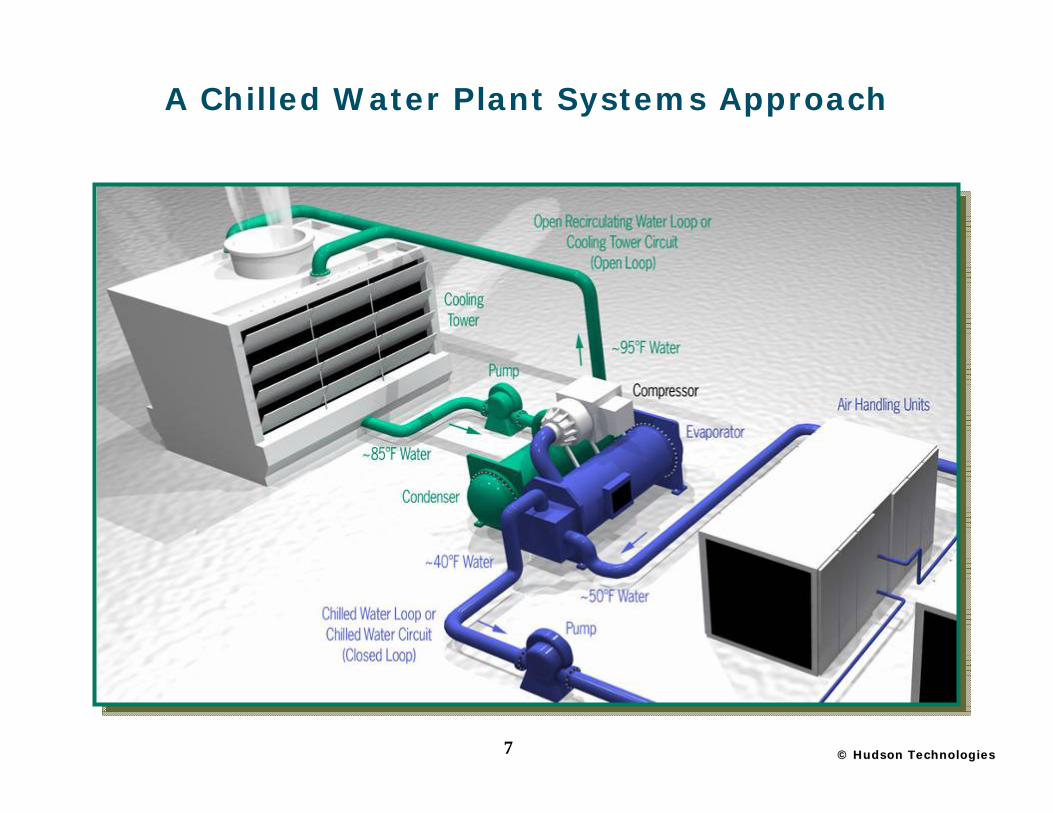
A Chilled Water Plant Systems Approach

©© Hudson TechnologiesHudson Technologies8
Energy Reliability Maintenance Productivity Quality Cost avoidance Emissions reductions
Main Driving Force for Change

©© Hudson TechnologiesHudson Technologies9
Fundamentals of Refrigeration

©© Hudson TechnologiesHudson Technologies10
The Refrigeration Cycle
0 25 50 75 100 125 150101
102
103
h [Btu/lbm]
P [p
sia]
105°F
40°F
0.2 0.4 0.6 0.8
R134a
Compression
Condensation / SubCooling
Ev aporation (Boiling)
Expansion
State Point

©© Hudson TechnologiesHudson Technologies11
Single Stage Chiller System
Condenser
Compressor
Evaporator
HGBP
HGBP
Cooling Water
Chilled Water
(Hot Gas ByPass)
©© Hudson TechnologiesHudson Technologies12
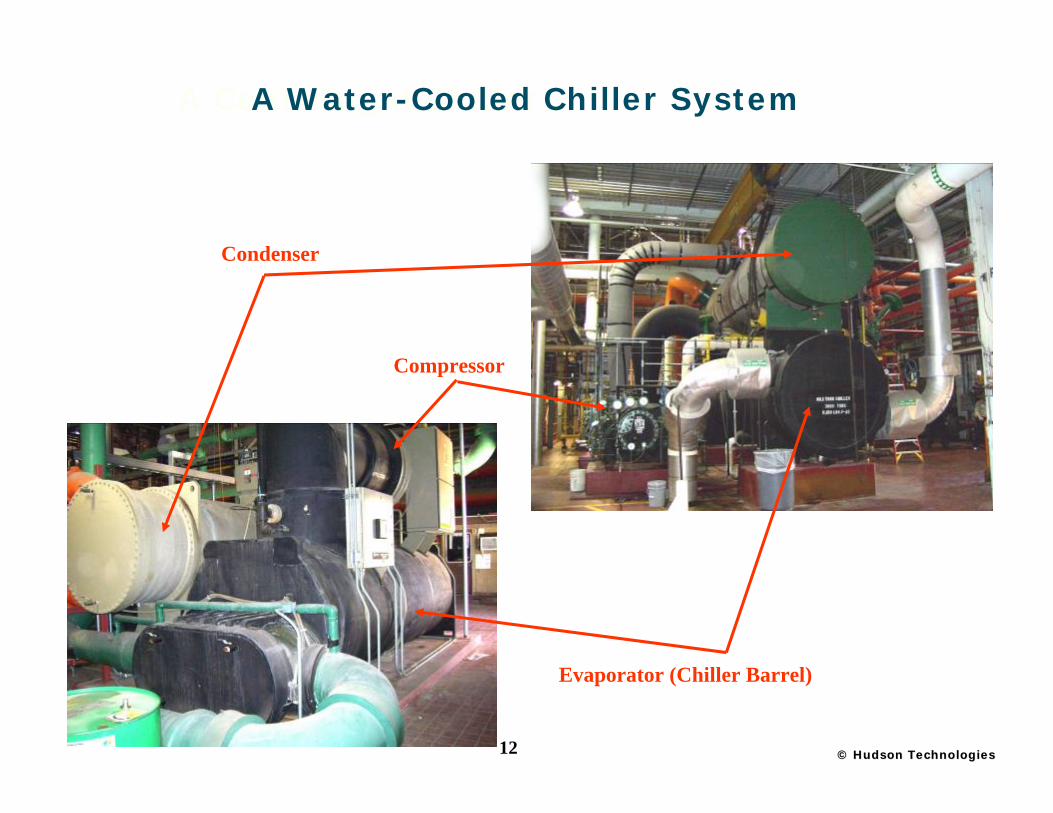
A Centrifugal Chiller
Evaporator (Chiller Barrel)
Condenser
Compressor
A Water-Cooled Chiller System

©© Hudson TechnologiesHudson Technologies13
Two Stage Chiller System
Condenser
Compressor
Evaporator
HGBP
HGBP
Cooling Water
Chilled Water
Economizer(Hot Gas ByPass)

©© Hudson TechnologiesHudson Technologies14
LiBr-Water Absorption Chillers

©© Hudson TechnologiesHudson Technologies15
The Air, Water and Refrigerant CycleThe Air, Water and Refrigerant Cycle
The Systems Approach

©© Hudson TechnologiesHudson Technologies16
Chiller Plant - Actual Operating Performance

©© Hudson TechnologiesHudson Technologies17
Chiller Capacity
Definition of Refrigeration Ton (RT) The amount of thermal energy to be
removed from 1 Ton (2,000 lbs) of water at 32°F to make it into ice at 32°F in one day (24 hr) is known as 1 RT
1 RT = 12,000 Btu/hr = 3.517 kW
Chiller capacity (size or tonnage) is the amount of full load cooling capacity provided by the chiller at certain design conditions
©© Hudson TechnologiesHudson Technologies18
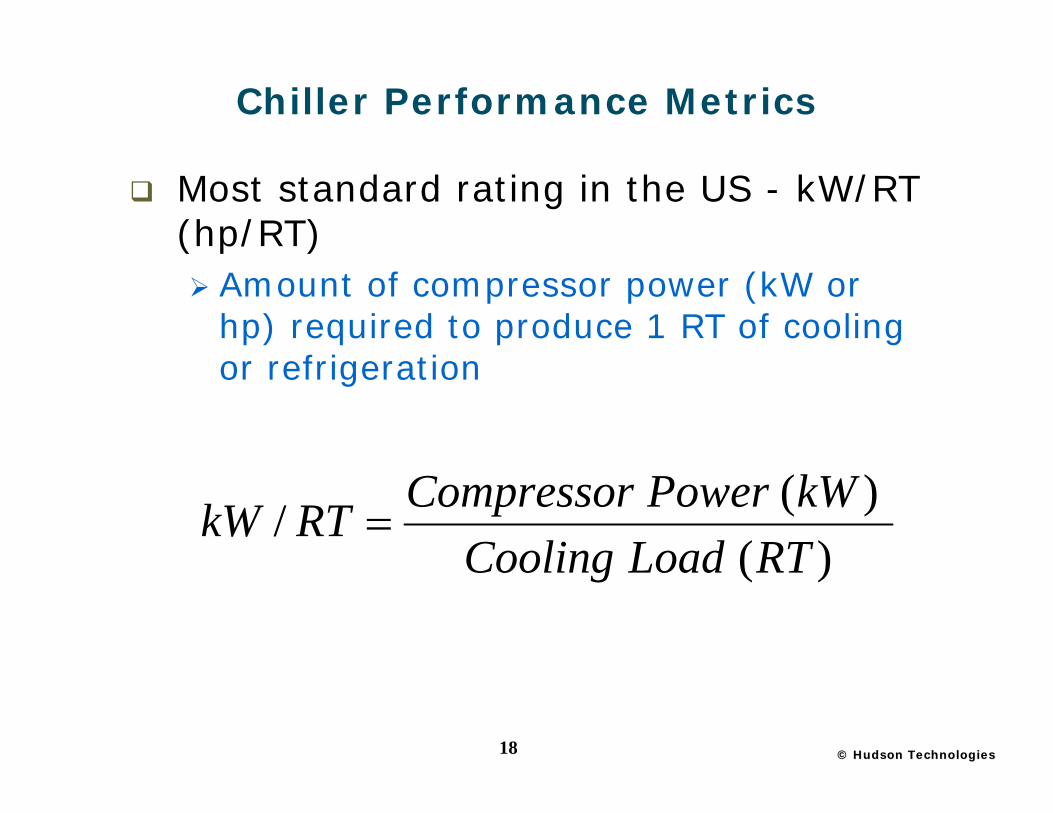
Chiller Performance Metrics
Most standard rating in the US - kW/RT (hp/RT) Amount of compressor power (kW or
hp) required to produce 1 RT of cooling or refrigeration
)( )( /
RTLoadCoolingkWPowerCompressorRTkW

©© Hudson TechnologiesHudson Technologies19
Chiller ID: Chiller #6 Chiller Manufacturer: ZZZZZZZ
Year Commissioned: 1990 Chiller Type: Constant Speed Centrifugal
Model Number: XXXXXXXXXX Serial Number: AAAAAAAA
Refrigerant Type: R-134a Capacity (Tonnage): 2,000
Efficiency (kW/Ton): 0.625 IPLV / NPLV: .541
Full Load Amps (FLA): 198 Volts: 4160
Evaporator Entering Water Temperature: 54.37°F Evaporator Leaving Water Temperature: 44°F
Condenser Entering Water Temperature: 85°F Condenser Leaving Water Temperature: 94.4°F
Evaporator Delta Temperature: 10.37°F Condenser Delta Temperature: 9.4°F
Evaporator GPM: 4,627 Condenser GPM: 6,000
Evaporator Pressure Drop (psig): 9.9 Condenser Pressure Drop (psig): 8.1
Chiller Full Load Design Specifications
Obtained from the Chiller Manufacturer

©© Hudson TechnologiesHudson Technologies20
Overall Chiller Plant Performance
Information required Total tonnage Total kW
Compressor Power Pumping Power Cooling Tower Fan Power Other (as defined in the scope)
m
n
TonsChiller
kWePerformancPlant

©© Hudson TechnologiesHudson Technologies21
Overall Chiller Plant Performance

©© Hudson TechnologiesHudson Technologies22
Chiller Plant Efficiency Metrics
Overall chiller plant performance Total tonnage Total kW (including chillers and auxiliaries)
Individual chiller efficiency Chiller tonnage Compressor kW
Individual Chiller Lift Lift is defined as the difference between the refrigerant
saturated condensing and evaporating temperatures
Individual compressor isentropic efficiency Suction and discharge temperatures Suction and discharge pressures
Individual heat exchanger effectiveness Approach temperatures T on chilled water and cooling tower water

©© Hudson TechnologiesHudson Technologies23
Predictive & Preventive Maintenance BestPractices

©© Hudson TechnologiesHudson Technologies24
First Things First First Things First –– Fluid ManagementFluid Management
Understanding “Cause” and “Effect” is very important for Root Cause Analysis
This enhances system reliability and reduces unplanned shutdown
Significant savings in Maintenance costs Most Maintenance BestPractices are testing-
based Refrigerant, Oil and Water Testing Rotating equipment monitoring
Vibration analysis
Eddy-current testing
In chiller systems, contaminants affect efficiency & capacity Chemistry Based Solutions

©© Hudson TechnologiesHudson Technologies25
Blood ChemistryBlood Chemistry

©© Hudson TechnologiesHudson Technologies26
Chiller ChemistryChiller Chemistry

©© Hudson TechnologiesHudson Technologies27
Refrigerant Analysis CriteriaRefrigerant Analysis Criteria
Moisture Oil Particulate Chlorides Acid Purity Non-Condensables Other Contaminants

©© Hudson TechnologiesHudson Technologies28
Nonferrous cutting wearNonferrous cutting wear Severe sliding wearSevere sliding wear
Copper alloy Copper alloy sliding wearsliding wear
Nonferrous cutting wearNonferrous cutting wear
FerrographyOil Analysis

©© Hudson TechnologiesHudson Technologies29
Water Testing and Analysis
Cooling Tower Water testing and analysis Open loop – evaporation of water Control of corrosion, scale and biological activity Material of construction plays a very important role Testing conducted for pH, TDS, Conductivity, Hardness,
Alkalinity, Chlorides, Silica, Bacteria, etc.
Chilled Water testing and analysis Closed loop – generally less issues Lower temperatures
Working with a water chemist / treatment company Periodic testing program

©© Hudson TechnologiesHudson Technologies30
Energy Conservation Measures (ECMs)
©© Hudson TechnologiesHudson Technologies31
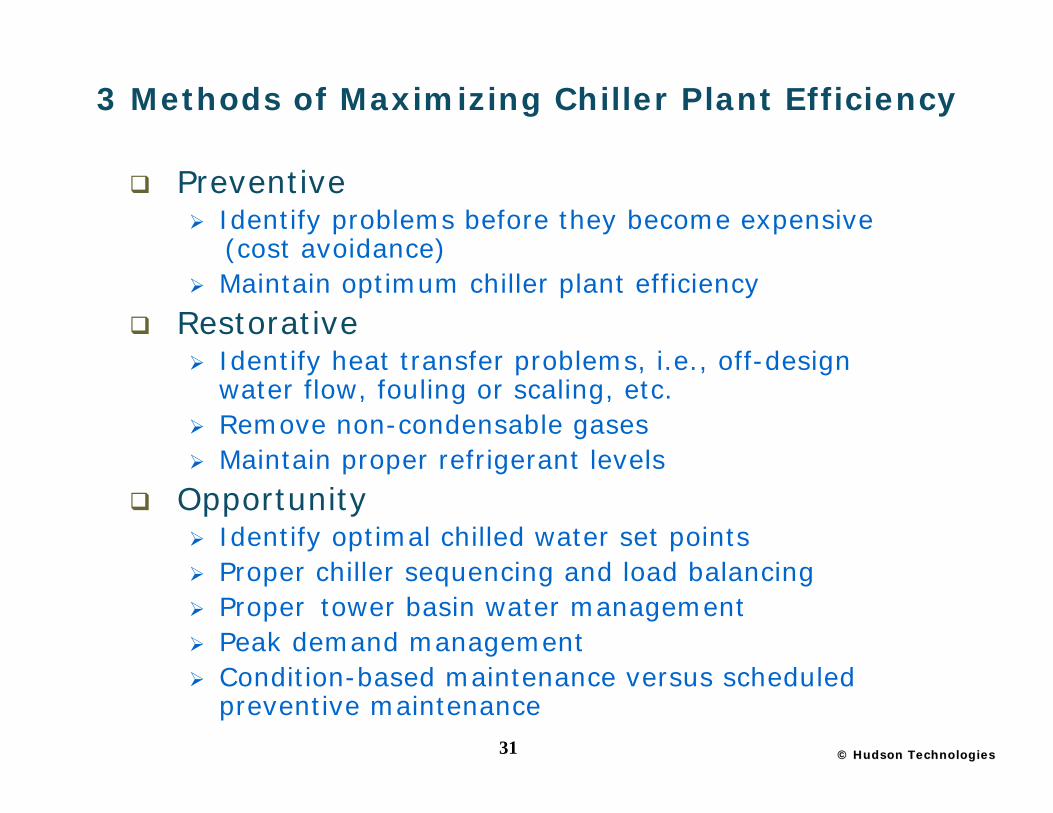
3 Methods of Maximizing Chiller Plant Efficiency
Preventive Identify problems before they become expensive
(cost avoidance) Maintain optimum chiller plant efficiency
Restorative Identify heat transfer problems, i.e., off-design
water flow, fouling or scaling, etc. Remove non-condensable gases Maintain proper refrigerant levels
Opportunity Identify optimal chilled water set points Proper chiller sequencing and load balancing Proper tower basin water management Peak demand management Condition-based maintenance versus scheduled
preventive maintenance

©© Hudson TechnologiesHudson Technologies32
List of ECMs
Implement ECWT management Optimize settings for ChWST Eliminate all refrigerant leaks Maintain design water flow rates
in evaporator / condenser Eliminate refrigerant stacking Remove non-condensable gases
and moisture Reclaim refrigerant
No
Cos
t / L
ow C
ost
EC
Ms

©© Hudson TechnologiesHudson Technologies33
List of ECMs (continued)
Clean fouled and scaled heat exchangers
Sequence multiple chillers to optimize efficiency
Maintain compressor isentropic efficiency
Improve drive efficiency Investigate application of variable
frequency drives Undertake peak load management
strategy Install water-side economizers
Med
ium
Cos
tE
CM
sH
ighe
r C
ost
EC
Ms
©© Hudson TechnologiesHudson Technologies34
Implement ECWT Management
ECWT – Entering Cooling Water Temperature
Approach The approach is the difference in temperature between
the cooled-water temperature and the entering-air wet bulb temperature
Since the cooling towers are based on the principles of evaporative cooling, the maximum cooling tower efficiency depends on the wet bulb temperature of air
Wet Bulb Wet bulb temperature is the lowest temperature that
can be reached by the evaporation of water only It is determined by the atmospheric pressure, ambient
temperature and the relative humidity

©© Hudson TechnologiesHudson Technologies35
Concept of Lift
©© Hudson TechnologiesHudson Technologies36
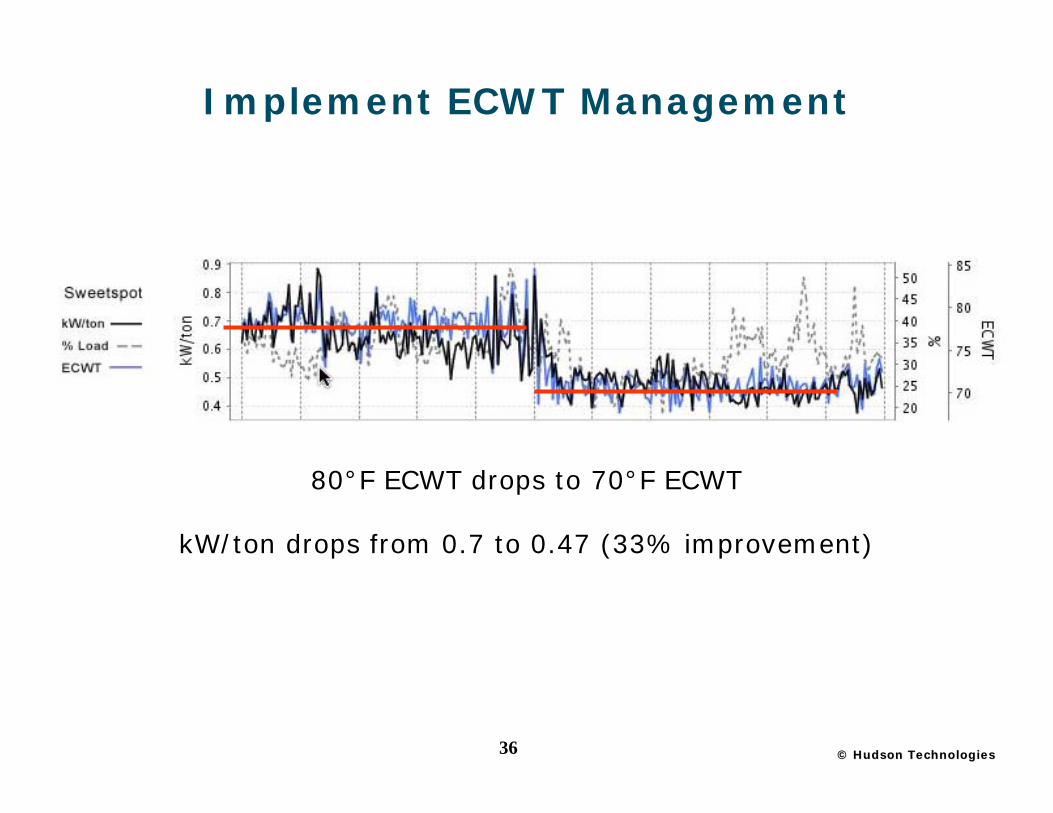
80°F ECWT drops to 70°F ECWT
kW/ton drops from 0.7 to 0.47 (33% improvement)
Implement ECWT Management

©© Hudson TechnologiesHudson Technologies37
Optimize Settings for ChWST
ChWST – Chilled Water Supply Temperature
Approach / RAT The approach (RAT) is the difference in temperature
between the chilled-water supply temperature and the refrigerant saturated temperature in the evaporator
It provides the driving force to transfer the heat from the water to the refrigerant
Load control Cooling required is controlled by bypassing chilled
water flow Alternate methodology – variable pumping
Primary Secondary

©© Hudson TechnologiesHudson Technologies38
Optimize Settings for ChWST
0.3
0.325
0.35
0.375
0.4
0.425
0.45
0.475
41 42 43 44 45 46 47
CWST (°F)
Chi
ller P
erfo
rman
ce (k
W/R
T)

©© Hudson TechnologiesHudson Technologies39
Clean Fouled and Scaled Evaporator
Fouling in the evaporator / cooler Refrigerant-side Water-side
Refrigerant-side fouling – Excess Oil
Refrigerant-side fouling – Water
Water-side fouling High makeup (leaks) in the closed loop system Iron fouling from corrosion, microbiological growth and
scale due to insufficient chemical protection

©© Hudson TechnologiesHudson Technologies40
Fouled/Scaled EvaporatorFouled/Scaled Evaporator
Iron Oxide ScaledCondition
After tube brushing

©© Hudson TechnologiesHudson Technologies41
Fouled/Scaled CondenserFouled/Scaled CondenserMarch
July
Sept

©© Hudson TechnologiesHudson Technologies42
Reclaim Refrigerant
Over time and operations, the refrigerant in the chiller gets contaminated and results in Fouling of heat exchangers Reductions in heat transfer coefficients
The process of recovering the refrigerant and bringing it back to AHRI-700 specification standard is known as “Reclamation”
Reclaiming a refrigerant improves overall operating performance and in most cases increases chiller tonnage (capacity)
Periodic sampling and testing of refrigerants in chiller systems is key to ensuring that the chiller chemistry is well maintained Analogous to maintaining water chemistry in boilers

©© Hudson TechnologiesHudson Technologies43
Reclaim Refrigerant
Presence of Oil in refrigerant
Particulate in refrigerant
Moisture in refrigerant

©© Hudson TechnologiesHudson Technologies44
SUMMARY of RESULTS & COST SAVINGS
Tons = 1,502 [RT]
compHP = 1,219 [HP]
SteamRate = 12.02 [lb/hr-HP]
NC% = 0.0 [%] Superheat Capacity Penalties
Total System
Cost ($) NC Penalty ($)
678,871 0
Evaporator Condenser System
Evaporator
%Capacity Loss (RT)
2.8 0.1
2.6 2.3
13.1 0.0 13.1
BalanceSystem = 0.0 [%]
BalanceEvap = 0.0 [%]
BalanceSubCooler = ???? [%]
SteamCost = 14.48 [$/1000lb]
Hours = 4,000 [Hr]
SUMMARY of RESULTS & COST SAVINGSTotal System
2.3
2.6
Component Balances
LFC = 0.80 [kW/ton]
2,002 [RT]
2,360 [HP]
12.03 [lb/hr-HP]
Annual Energy Costs
RefrigerantDesign F/LDesign:
Currently Used:
R134a
R134a
Potential Savings OpportunitiesPressure Ratio (current):
New Ratio
Savings (%)
HPTon = 0.81 [BHP/RT] 1.18 [BHP/RT]
1,502 [RT]
1,503 [HP]
Design P/L
1.001 [HP/Ton]
Reclaim Refrigerant
Impact of Oil, Particulate & Moisture in refrigerant on energy efficiency & costs
Impa
ct o
n C
apac
ity

©© Hudson TechnologiesHudson Technologies45
Eliminate Refrigerant Stacking
Refrigerant stacking impacts heat transfer efficiency in both the evaporator and condenser - higher kW/Ton and energy costs
Leads to reduced compressor capacity
Chiller surging or stalling
Shut down on low refrigerant temperature (pressure)

©© Hudson TechnologiesHudson Technologies46
Refrigerant Stacking
RaiseECWT

©© Hudson TechnologiesHudson Technologies47
Sequence Multiple Chillers to Optimize Efficiency
All chillers will have an optimal operation range (best efficiency point)
When multiple chillers are operating, the overall plant’s composite operating curve maybe very different from the individual chiller’s curve
It is important to know how each of the chillers operate under different load conditions
Pick the best chiller operating combination for the current operating conditions – Dynamic Optimization problem (NOT Easy)
©© Hudson TechnologiesHudson Technologies48
Investigate Application of Variable Frequency Drives (VFD)
Replacing old chillers with newer energy efficient systems –most new packaged chillers will come with a VFD option
VFDs take advantage of lower ambient temperatures (lower lift) and correspondingly lower cooling loads (lower refrigerant flow rates)
VFD pumps and fans can play a very important role in reducing total system energy consumption
VFD efficiency is extremely high (99%) and more importantly, it offers a benefit on the drive side by providing Soft start capability Power factor correction

©© Hudson TechnologiesHudson Technologies49
Comparison of Constant Speed & VFD Chiller Performance
0.3
0.35
0.4
0.45
0.5
0.55
0.6
0.65
0.7
0.75
20 30 40 50 60 70 80 90 100
Cooling Load (%)
Chi
ller P
erfo
rman
ce (k
W/R
T)
Constant SpeedVariable Frequency

©© Hudson TechnologiesHudson Technologies50
Install Water-side Economizers
This ECM is applicable only in certain geographical areas but can have a huge impact on energy savings
Installing a water-side economizer allows for “free cooling” during times of the year when the outdoor ambient conditions allow for very low wet-bulb temperatures
The cooling tower water provides all (or some portion) of the chilled water plant load and reduces the amount of chillers required
©© Hudson TechnologiesHudson Technologies51
Undertake a Peak Load Management Strategy
Peak demand charges can become excessive depending on chiller plant management and operational strategy
There are 3 ways to manage peak demand regarding chillers Thermal energy storage Optimize chiller efficiency to lower kW usage of running
chillers Take a chiller off-line

©© Hudson TechnologiesHudson Technologies52
Conclusions

©© Hudson TechnologiesHudson Technologies53
Next Steps
Develop a simple schematic of your Chiller Plant / Refrigeration system and define the boundaries
Use a systems approach to complete an initial assessment to understand operations and load profile
Undertake a simple gap analysis to identify any potential improvement opportunities
Evaluate each ECM and prioritize based on quantified savings opportunities
Put a program in place to ensure that there is proper Predictive and Preventive Maintenance BestPractices
Implement an effective Chiller Plant Performance Monitoring, Diagnostics and Optimization system

©© Hudson TechnologiesHudson Technologies54
1-Day Training Workshop
Introduction to Energy Efficiency in Chiller Plant Systems
December 17, 20138 am – 4 pm
Houston Business RoundTable5213 Center StreetPasadena, TX 77505
Facilitator: Riyaz Papar, PE, CEMHudson Technologies Co.
Registration Information:Kathey Ferland
Texas Industries of [email protected]
http://TexasIOF.ceer.utexas.edu

©© Hudson TechnologiesHudson Technologies55
Contact Information
Technical InformationRiyaz Papar, PE, CEM
Hudson Technologies [email protected]
http://www.hudsontech.com
Program InformationKathey Ferland
Texas Industries of [email protected]
http://TexasIOF.ceer.utexas.edu